
Abstract
Background
Compared with white-fleshed sweetpotato (WFSP), purple-fleshed sweetpotato (PFSP) is a desirable resource for functional food development because of the abundant anthocyanin accumulation in its tuberous roots. Some studies have shown that the expression regulation mediated by miRNA plays an important role in anthocyanin biosynthesis in plants. However, few miRNAs and their corresponding functions related to anthocyanin biosynthesis in tuberous roots of sweetpotato have been known.
Results
In this study, small RNA (sRNA) and degradome libraries from the tuberous roots of WFSP (Xushu-18) and PFSP (Xuzishu-3) were constructed, respectively. Totally, 191 known and 33 novel miRNAs were identified by sRNA sequencing, and 180 target genes cleaved by 115 known ib-miRNAs and 5 novel ib-miRNAs were identified by degradome sequencing. Of these, 121 miRNAs were differently expressed between Xushu-18 and Xuzishu-3. Integrated analysis of sRNA, degradome sequencing, GO, KEGG and qRT-PCR revealed that 26 differentially expressed miRNAs and 36 corresponding targets were potentially involved in the anthocyanin biosynthesis. Of which, an inverse correlation between the expression of ib-miR156 and its target ibSPL in WFSP and PFSP was revealed by both qRT-PCR and sRNA sequencing. Subsequently, ib-miR156 was over-expressed in Arabidopsis. Interestingly, the ib-miR156 over-expressing plants showed suppressed abundance of SPL and a purplish phenotype. Concomitantly, upregulated expression of four anthocyanin pathway genes was detected in transgenic Arabidopsis plants. Finally, a putative ib-miRNA-target model involved in anthocyanin biosynthesis in sweetpotato was proposed.
Conclusions
The results represented a comprehensive expression profiling of miRNAs related to anthocyanin accumulation in sweetpotato and provided important clues for understanding the regulatory network of anthocyanin biosynthesis mediated by miRNA in tuberous crops.
Background
Sweetpotato (Ipomoea batatas L.), a hexaploid (2n = 6x = 90) dicotyledonous plant of Convolvulaceae family, is an important crop around the world due to its high yield, wide adaptability and rich nutrition [1]. The flesh of the tuberous roots has multiple colors, such as white, yellow, orange and purple [2]. The purple-fleshed sweetpotato (PFSP) is not only as nutritious as the white-fleshed sweetpotato (WFSP) but also enriches high content of anthocyanin. Anthocyanin is water-soluble pigment belonging to the flavonoid group. Numerous studies have showed that anthocyanin has a strong antioxidant activity and therefore has therapeutic effects on a variety of diseases like obesity and cancers [3]. More importantly, the anthocyanin of PFSP has high thermal stability and light stability with a high level of acylation than that of strawberry, raspberry, and apple [4,5,6]. Therefore, the PFSP has been recently proposed as a potential pharmaceutical crop for developing drugs, such as antineoplastic, antiinflammatory, and antioxidant agents [6, 7].
Anthocyanin biosynthetic pathway has been extensively studied in plants [8, 9]. Genes that participate in anthocyanin biosynthesis can be classified into structural genes and regulatory genes. The structural genes encode a series of enzymes, including phenylalanine ammonialyase (PAL), chalcone synthase (CHS), chalcone isomerase (CHI), flavonoid 3′-hydroxylase (F3’H), flavonoid-3′5’-hydroxylase (F3’5’H), flavanone 3-hydroxylase (F3H), dihydroflavonol reductase (DFR), UDP-glucose flavonoid 3-o-glycosyltransferase (UFGT), and anthocyanidin synthase (ANS) [10]. These enzyme genes could be transcriptionally regulated by MYB-bHLH-WDR (MBW) complexes consisting of three kinds of regulatory factors, MYB, bHLH and WD40 repeat [11]. Additionally, other regulatory genes have also been reported to regulate anthocyanin biosynthesis, such as Constitutively photomorphogenic1 (COP1) [12], Jasmonate zim-domain (JAZ) [13], the Squamosa promoter binding proteinlike (SPL) [14], and NAC [15]. Apart from the structural genes and regulatory genes, recent evidences showed that microRNAs (miRNAs) can also play important roles in mediating anthocyanin biosynthesis in plants [16,17,18].
MiRNA, widely existed in eukaryotes, is a kind of endogenous non-coding small RNA with approximately 20–24 nt in length. Numerous evidences showed that miRNAs participated in regulating gene expression mainly via cleaving target mRNAs or preventing gene translation at the post-transcriptional level [19, 20]. In plants, miRNAs are involved in multiple biological processes, including growth and development [12], stress responses [21, 22], auxin signaling [23, 24] as well as secondary metabolism. For example, miR156, miR165/166, miR828 and miR858, have been identified to be involved in anthocyanin biosynthesis in Arabidopsis [14, 16, 17, 25, 26] and Solanum lycopersicum [18]. By high throughput sequencing, more and more miRNAs have been identified and characterized in wheat [27, 28], soybean [29], rice [30], sweet orange [31], asparagus [32], chinese radish [33], maize [34], tea [35] etc. So far, a total of 38,589 miRNAs from 271 different plants were recorded in the latest miRBase database (http://www.mirbase.org/). A couple of sweetpotato miRNAs and their targets have also been identified [36, 37]. However, miRNAs involved in regulating anthocyanin biosynthesis in sweetpotato have not been systematically reported.
In this study, sRNA and degradome sequencing were used to identify miRNAs and their corresponding targets that potentially involved in anthocyanin biosynthesis in sweetpotato. Small RNA and degradome libraries from the tuberous roots of WFSP (cultivar Xushu-18, XS-18) and PFSP (cultivar Xuzishu-3, XZS-3) were constructed and sequenced. Integrated analysis of sRNA, degradome sequencing, GO, KEGG and qRT-PCR revealed a comprehensive account of the ib-miRNA populations, corresponding targets, expression abundance, as well as miRNAs potentially involved in the anthocyanin metabolism. Expression levels of eight differently expressed miRNAs and their targets were validated by qRT-PCR, which were consistent with the sequencing data. In addition, we demonstrated that the over-expression of ib-miR156 in Arabidopsis strongly suppressed the abundance of ibSPL and resulted in a purplish phenotype. Finally, a possible ib-miRNA-target regulatory model associated with anthocyanin biosynthesis in tuberous roots of sweetpotato was illustrated. Our findings provided a comprehensive expression profiling of ib-miRNAs, and suggested that miRNAs were involved the regulation of anthocyanin biosynthesis in sweet potato.
Result
Small RNA populations in the tuberous roots of sweetpotato
To identify miRNAs involved in the process of anthocyanin biosynthesis, the tuberous roots of WFSP (XS-18) and PFSP (XZS-3) were used to construct sRNA libraries and sequenced on Illumina HiSeq2000 platform, respectively. A sum of 27,705,914 (XS-18) and 28,947,914 (XZS-3) raw reads were produced. After removing of the low quality reads and contaminated adapter sequences, 26,825,634 (96.82%) and 27,331,707 (94.42%) clean reads were obtained from XS-18 and XZS-3, respectively. A total of 15,764,489 (XZS-3, 91.61%) and 13,904,486 (XS-18, 73.32%) sRNAs were mapped to the corresponding assembled unigenes of sweetpotato (Additional file 1). The mapped reads were further annotated against Pfam database, and subsequently divided into rRNAs, tRNAs, snRNAs, snoRNAs, ta-siRNA (TAS) and others. The endogenous sRNAs were identified as known miRNAs and novel miRNAs (Additional file 2). The length distribution patterns of the sRNAs were similar in the two libraries. They were ranged from 18 to 30 nt, of which 24 nt sRNAs were the most abundant size with 18.63 and 15.19% in XS-18 and XZS-3 libraries, respectively (Fig. 1).
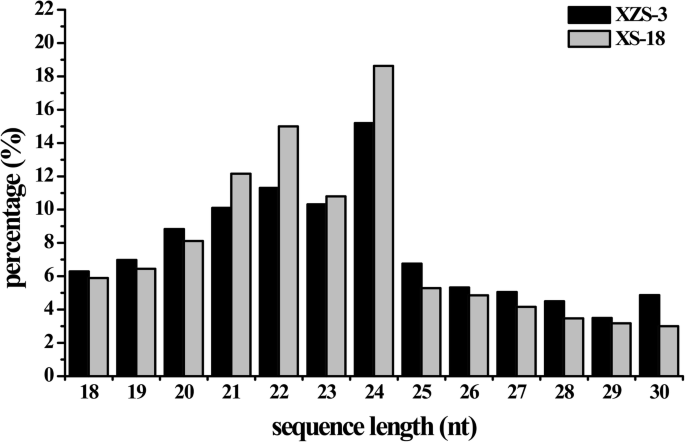
Length distribution of sRNAs in XS-18 and XZS-3 libraries
Identification of known and novel ib-miRNAs in sweetpotato
The known miRNAs were found to be important in plant growth, development and many other biological processes [38]. To identify known miRNAs in sweetpotato, the sRNA sequences were aligned to the mature miRNA sequences deposited in the miRBase 22.1. A total of 191 known miRNAs belonging to 43 miRNA families were identified in the two libraries, with 185 and 145 known miRNAs in XS-18 and XZS-3, respectively (Additional file 3). Among the 43 identified families, the member number of each miRNA family varied significantly. The ib-miR396 family contained the largest number with 18 members, followed by ib-miR166 and ib-miR159 families, with 17 and 15 members, respectively. By contrast, 9 families had only one member, such as ib-miR157, ib-miR394, ib-miR5083 and ib-miR5658 (Fig. 2).
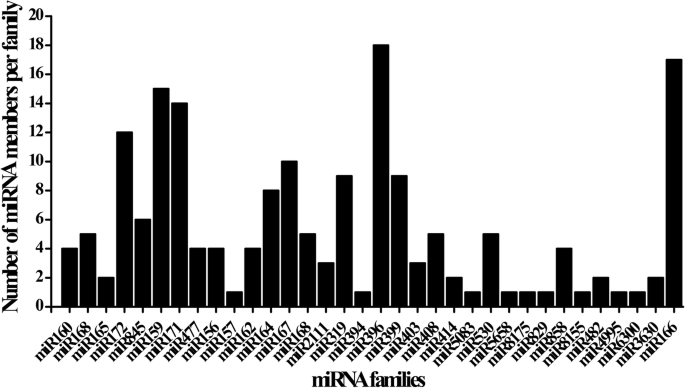
Member numbers of known miRNA families identified in sweetpotato
The abundance of the miRNAs were estimated as transcripts per million (TPM), which highly varied among the 43 known miRNA families (Additional file 4). Some miRNAs highly expressed with more than 1000 TPM, such as ib-miR159a-1 and ib-miR319a-1, whereas some miRNAs expressed at a lower level with less than 2 TPM, such as ib-miR160–1, ib-miR1030a-j and ib-miR1128. In addition, different members in the same miRNA family exhibited different expression levels. For instance, in miR159 family, ib-miR159a-1 showed the highest abundance with 5978 and 1106 TPM in the XS-18 and XZS-3 libraries, respectively. However, ib-miR159f only presented 4 and 1 TPM in the XS-18 and XZS-3 libraries, respectively (Additional file 4).
The length of known miRNAs ranged from 18 nt to 24 nt, in which 21 nt miRNAs were the most abundant size (Additional file 3). To understand the base preference of sweetpotato miRNAs, we analyzed the base distribution for each position of known miRNAs. In both libraries, nucleotide sequences analysis revealed that uridine (U) was the most common nucleotide at the 5′ end. The cleavage site of the target gene usually matched with the 10 th or 11 th nucleotide of miRNA. The majority nucleotides of known ib-miRNAs was adenine (A) at position 10 th and thymine (T) or A at position 11 th (Fig. 3a).

Relative nucleotide bias for each position of known a and novel miRNAs b
The remaining sRNA sequences were mapped to sweetpotato transcriptome database, and the hairpin structures were used to identify novel miRNAs in sweetpotato. Novel miRNAs were predicted based on the published criteria [39]. Totally, 33 and 33 novel miRNAs were predicted in the XS-18 and XZS-3 libraries, respectively (Additional file 5). The length distribution of the novel miRNAs was between 20 nt to 25 nt. Similar to known miRNAs, the nucleotide bias analysis showed that U appeared mainly at the 5′ end of novel miRNAs (Fig. 3b). The length of the novel miRNA precursors ranged from 57 nt to 293 nt, with an average length of 140 nt (Additional file 5), which was in accordance with the commonly observed length of miRNA precursors in plants [40]. The predicted hairpin structures of the novel miRNA precursors and locations of mature miRNAs in the precursors were shown in Additional file 6. The negative folding free energies of the hairpin structures ranged from − 116.21 to − 22.20 kcal mol− 1 with an average of − 57.62 kcal mol− 1. The minimal folding free energy index (MFEI) ranged from 0.51 to 2.44 with an average of 1.31, with most MFEIs being > 0.8 (Additional file 5). Usually, the presence of complementary miRNA star (miR*) strands lays strong support for the authenticity of novel miRNA [39]. Similar to the known miRNAs, the abundance of the identified novel ib-miRNAs in sweetpotato varied considerably. MiR* strands were found to be present in 17 of the 33 novel ib-miRNAs and expressed at lower levels than their corresponding miR strands (Additional file 5), which agreed with the report that miR* strands were mostly degraded [40].
Target validation of ib-miRNAs by degradome sequencing
To explore the function of sweetpotato miRNAs, computational program psRNATarget (http://plantgrn.noble.org/v1_psRNATarget/) was performed to predict their target genes. A total of 3278 transcripts were predicted to be targets of the 224 miRNAs (Additional file 7). Then, high-throughput degradome sequencing was performed to validate the miRNA targets. A total of 1,886,192 unique reads of 14.51 million raw reads were obtained, and 766,328 unique reads matched with the reference sequences assembled from sweetpotato transcriptome database (Additional file 8). Totally, 180 target genes cleaved by 115 known ib-miRNAs and 5 novel ib-miRNAs were identified by CleaveLand4 analysis (http://sites.psu.edu/axtell/software/cleaveland4/) (Additional file 9).
The cleaved-target transcripts were classified into five categories, named category 0, 1, 2, 3 and 4, according to the relative abundance of the tags at the target sites. The miRNAs and corresponding targets in the five categories were shown in Additional file 9. Among the 180 identified targets, 55, 8, 34, 1 and 23 targets were found in categories 0, 1, 2, 3 and 4, respectively.
Target analysis showed that many cleaved-target transcripts by ib-miRNAs were TF genes, including MYB, WRKY, NAC, SPL, ARFs, ERF, WDR, HD-ZIPIII, etc. (Additional file 9). Many ib-miRNAs had more than one transcript as target genes. For example, ib-miR172 could target ERF (Cluster-18,233.34295, Cluster-18,233.74214) and APETALA 2 (Cluster-18,233.40074, Cluster-18,233.74210) (Fig. 4a, b). Furthermore, the same transcript was targeted by more than one ib-miRNA. For instance, members of ib-miRNA159 family, ib-miR159, ib-miR159a, ib-miR159b-3p and ib-miR159c shared the same target ibMYB (Cluster-18,233.73594) (Fig. 4c, d). MYB gene (Cluster-18,233.73594) was also targeted by ib-miR858, ib-miR319, ib-miR159 and ib-miR156 (Additional file 9).

Target plot (t-plots) of representative ib-miRNA targets confirmed by degradome sequencing. The red lines showed the distribution of the degradome tags along the target mRNA sequences. The red arrows represented the cleavage nucleotide positions on the target genes. a, b Cleavage features in ibERF and ibAPETALA2 mRNA by ib-miR172f. c, d Cleavage features in ibMYB mRNA by ib-miR159 and ib-miR159b-3p
Differentially expressed ib-miRNAs between WFSP and PFSP
The normalized expression levels of miRNAs were compared between XS-18 and XZS-3 libraries to identify differentially expressed miRNAs. The known and novel miRNAs were followed to differential expression analysis criteria (qvalue < 0.01 and |log2 (fold change)| > 1). The Veen diagram analysis showed that 170 miRNAs co-expressed between the two libraries. Forty eight miRNAs (41 known and 7 novel miRNAs) presented specifically in XS-18 while 6 miRNAs (ib-miR162b, ib-miR164c, ib-miR166m, ib-miR166j, ib-miR414 and ib-miR845d) particularly expressed in XZS-3 (Fig. 5a; Additional file 10). Volcanic diagram showed a total of 121 of 224 (54.0%) miRNAs differentially expressed between the two libraries, among which 47 miRNAs were up-regulated and 74 miRNAs were down-regulated in XZS-3 compared to XS-18 (Fig. 5b; Additional file 10).

The differentially expressed miRNAs in XS-18 and XZS-3. a The Veen diagram of differentially expressed miRNAs. The number in each circle represented the expressed miRNAs in the corresponding sample, and in the overlapping part of the circles represented the co-expressed miRNAs between the XS-18 and XZS-3 samples. b The volcanic diagram of differentially expressed miRNAs. The X-axis represented fold change expression of miRNA in different libraries. The Y-axis represented significantly fold change expression of miRNA in statistics. The red dots and green dots represented significantly up-regulated and down-regulated miRNAs in XZS-3, respectively. The blue dots represented no significant difference
Validation of ib-miRNAs and their target genes by qRT-PCR
Eight differentially expressed miRNAs and their corresponding targets between XS-18 and XZS-3 were randomly selected for qRT-PCR to verify the results obtained from sRNA and degradome sequencing. In general, the expression patterns of the eight selected miRNAs showed by qRT-PCR were consistent with that showed by high-throughput sequencing, indicating that the sRNA sequencing data were reliable (Fig. 6). Up-regulated expression levels of ib-miR858b, ib-miR2111a-5p and ib-miR156a-5p were detected in XZS-3 compared to XS-18, whereas the abundance of their corresponding target genes MYB, ERF and SPL were down-regulated, respectively (Fig. 6a, b, c). The expression amounts of ib-miR160e-5p and ib-miR166m were decreased, while their corresponding target genes ARF and HD-ZIP had an increased expression in XZS-3 compared to XS-18 (Fig. 6d, e). The inversely correlated expression patterns between miRNA and their corresponding targets confirmed degradome sequencing data. However, the expression of ib-miR396g-5p, novel_miR-1 and novel_miR-5 showed the same trend with that of their corresponding transcripts, Cluster-18,233.16052 (WD40), Cluster-18,233.73593 (MYB) and Cluster-18,233.59778 (ARF), respectively, suggesting that the transcripts may not be the cleaved targets of these miRNAs (Fig. 6f, g, h). The expressions of another five miRNAs listed in Table 1 were also verified by qRT-PCR (Additional file 11).
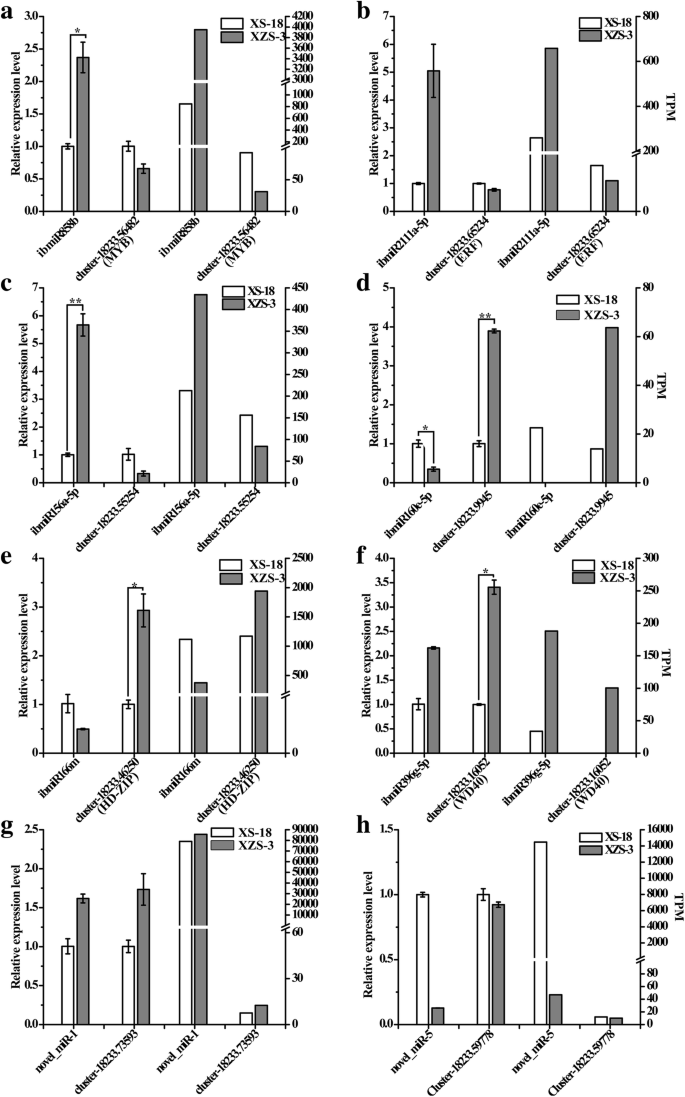
Comparison of the expression levels of the miRNAs and their corresponding target genes determined by qRT-PCR and deep sequencing. a-h The Y-axis on the left and right represented the relative expression levels determined by qRT-PCR and deep sequencing, respectively. Ib5S rRNA and ibActin were used as an internal control for miRNAs and targets, respectively. The expression levels of the miRNAs and targets in XS-18 were set as 1.0. Relative expression was calculated using the 2-ΔΔCt method. The bars represented the mean ± SD values of three biological experiments. * and ** indicated a statistically significant difference between XS-18 and XZS-3 at P < 0.05 and 0.01 according to DMRT analysis, respectively
GO and KEGG analysis of targets regulated by differentially expressed ib-miRNAs
A total of 3278 transcripts were predicted to be targets of the 224 miRNAs by computational program psRNATarget. Then, 180 targets identified by degradome sequencing were subjected to gene ontology (GO) analysis, and 124 of the 180 targets were found in GO database, which were involved in biological processes (79), molecular function (83), and cellular components (71) (Additional file 12). For biological processes category, more than 40% of the target genes were involved in regulation of transcription, DNA-templated annotations (GO:0006355), followed by DNA-templated transcription, initiation (GO:0006352) and DNA replication (GO:0006260) (Fig. 7a). In the molecular function category, the three most dominant terms were DNA binding (GO:0003677), sequence-specific DNA binding transcription factor activity (GO:0003700), and protein binding (GO:0005515) (Fig. 7b). Within the cell component category, the dominant two enrichments were the nucleus (GO:0005634) and the transcription factor complex (GO:0005667) (Fig. 7c).

GO functional categorization of the target genes of the differentially expressed ib-miRNAs. The ten most dominant categories were performed according to biological process a molecular function b and cellular component c
KEGG enrichment was carried out for pathway analysis. Twenty-two targets regulated by 12 different miRNAs were assigned to 11 KEGG pathways (Fig. 8; Additional file 13). Ubiquitin mediated proteolysis (ko04120, 5 targets) and phenylpropanoid biosynthesis (ko00940, 5 targets) were the most two enriched pathways, followed by herpes simplex infection (ko05168; 4 targets) and basal transcription factors (ko03022; 4 targets) (Fig. 8; Additional file 13). The anthocyanin biosynthesis originates from the general phenylpropanoid metabolic pathway [41]. In most species, genes and miRNAs associated with phenylpropanoid pathway may be involved in the anthocyanin biosynthesis. Based on the functions of the target genes in phenylpropanoid metabolism, a pathway panel for phenylpropanoid regulation was proposed in sweetpotato (Fig. 9). In particular, 8 ib-miRNAs (ib-miR157a-5p, ib-miR156, ib-miR396a-2, ib-miR159c; ib-miR159-3p, ib-miR159c-3, ib-miR6300, and ib-miR159a-2) participated in phenylpropanoid pathway in sweetpotato (Fig. 9), which may play significant roles in regulating the anthocyanin biosynthesis in sweetpotato.

KEGG pathway analysis of the target genes regulated by the differentially expressed ib-miRNAs. The X-axis indicated the Rich factor, which referred to the ratio of the number of genes located in the differentially expressed gene to the total number of the annotated genes located in the pathway. The significance of the matched Rich factor was represented by the color of the p-values. The Y-axis indicated the names of enriched KEGG pathways. Each pathway was represented by a single circle and the circle size was proportional to the target gene numbers

A putative model of ib-miRNAs and enzyme genes involved in phenylpropanoid pathway. MiRNA names in blue, pink and yellow circles represented miRNAs participated lignin, medicarpin and anthocyanin pathway, respectively. The potential target genes of ib-miRNAs were indicated in red
Identification of ib-miRNAs and their targets related to anthocyanin biosynthesis in sweetpotato
Identification of differentially expressed miRNAs in tuberous roots of WFSP and PFSP could help to better understand the biological function of miRNAs involved in anthocyanin biosynthesis. Combined with sRNA, degradome sequencing, GO and KEGG analysis, 26 of the 121 miRNAs differentially expressed miRNAs were identified to be potentially involved in anthocyanin biosynthesis in sweetpotato (Table 1, Additional file 14).
As expected, the previously reported miRNAs related to anthocyanin biosynthesis were also differentially expressed in this study (Table 1, Fig. 6). For instance, the expression levels of ib-miR156a-5p and ib-miR858b were higher in XZS-3 than XS-18. Aside from above mentioned miRNAs, the other 24 miRNAs representing 9 families were firstly identified to be putatively involved in anthocyanin biosynthesis (Table 1, Additional file 14). For example, the expression of ib-miR172c, ib-miR172e-3p.2, ib-miR172i, ib-miR172b, miR319, miR396 and miR2111 increased significantly in XZS-3. In particular, ib-miR164c was only expressed in XZS-3. However, family members of ib-miR159, ib-miR165, and ib-miR166 showed reduced or even no expression in XZS-3.
Over-expression of ib-pri-MIR156 induced anthocyanin accumulation in Arabidopsis
The orthologous gene of miR156 in Arabidopsis has been demonstrated to regulate anthocyanin biosynthesis [14]. In this study, the inverse correlation between the accumulation of ib-miR156 and ibSPL, the targets of ib-miR156, in WFSP and PFSP suggested that ib-miR156 may also participate in anthocyanin biosynthesis. To test this hypothesis, the recombinant vector, pc2300-pOT2-ib-pri-MIR156, was generated and transformed into Arabidopsis. Interestingly, a purplish phenotype was observed in young seedlings of the ib-pri-MIR156 over-expressing Arabidopsis under normal growth conditions (Fig. 10). Analysis by qRT-PCR showed that the abundance of miR156 was greatly increased, whereas the expression of SPL decreased significantly in the transgenic Arabidopsis (Fig. 10e). Besides, upregulated expressions were detected for four structural genes related to anthocyanin biosynthesis, including CHS, CHI, DFR and ANS in the transgenic Arabidopsis (Fig. 10e). The results indicated that ib-pri-MIR156 positively regulated anthocyanin accumulation by repressing the expression of SPL.

Phenotype and molecular analysis of ib-miR156 over-expressing transgenic Arabidopsis. a, b Phenotype of wild type Arabidopsis (WT) and ib-miR156-OE transgenic Arabidopsis plant in pots. c, d Phenotype of WT and ib-miR156-OE transgenic Arabidopsis plant under stereomicroscope (the magnification is 0.35 times). e the relative expression levels of ib-miR156, SPL9, CHS, CHI, DFR and ANS were measured by qRT-PCR. The expression level of each gene in WT was set as 1.0. Relative expression was calculated using the 2-ΔΔCt method. The bars represented the mean ± SD values of three biological experiments. * and ** indicated a statistically significant difference between WT and ib-miR156-OE transgenic Arabidopsis at P < 0.05 and 0.01, respectively
Discussion
Identification of ib-miRNAs by high-throughput sequencing
MiRNAs, as the key post-transcriptional regulators, participate in various biological processes in plant. Recently, increasing evidences have showed that plant miRNAs are also involved in secondary metabolism [14, 38, 42]. Anthocyanin is one of the important secondary metabolite products. A number of miRNAs have been reported to play important roles in regulating anthocyanin biosynthesis in plant, such as miR156 [14], miR393 [43], miR828 [18, 25, 26], miR163 [44], miR165/166 [17] and miR858 [45]. However, the identification of miRNAs related to anthocyanin biosynthesis has not yet been reported in the tuberous root of sweetpotato.
In this study, a total of 191 known ib-miRNAs were identified from the WFSP and PFSP libraries by analysis of sRNA sequencing data. The number was much higher than previous reports on sweetpotato. In the first report on sweetpotato miRNAs, only 8 potential miRNA candidates were computationally identified [46]. Then, 24 known miRNAs were identified in Solexa Sequencing of Ningzishu 1 [36]. In the two studies, the number of miRNA identified is considerably limited because EST sequences were used as the references. The known miRNAs number of this study is comparable with the recent report on miRNAs responded to chilling stress of sweetpotato, in which 190 known miRNAs were found [47]. The research is based on Kazusa sweetpotato GARDEN database, which scaffold the genome sequences of a wild diploid ancestor of sweetpotato, Ipomoea trifida, although the total lengths of the assembled sequences was only 712 Mb and the size is far less than estimated genome sequence [48].
Most of the known miRNA families detected by Xie et al were also present in our dataset, except miR1508, miR5253, miR5298 and miR2911 [47]. On the other hand, we identified miR6478, miR6300, miR6173 and miR5508 which were not reported in sweetpotato previously. Since the expression levels of miRNAs existed temporal and spatial specificity, this result is not surprising [49]. Based on the hairpin structures of pre-miRNAs (Additional file 6), 33 novel candidate miRNAs were identified in this study. The number of novel miRNAs is clearly more than the research with the EST sequences as reference, but it is far less than the report of miRNAs responded to chilling stress of sweetpotato. Although the genomic sequence of Taizhong 6 sweetpotato cultivar was released last year, the incompleteness and inaccuracy of assembly limited its application as a good reference genome of hexaploid sweetpotato [50, 51]. In order to eliminate the difference caused by genetic background, species and development stages, the transcriptome sequences developed with the same sweetpotato cultivars with sRNA deep sequencing were used as the reference to predict the novel miRNAs in this study. Degradome sequencing has been successfully applied to identify miRNA targets in many plant species [52, 53]. In this study, a total 180 targets for 115 ib-miRNAs were obtained by the degradome sequencing approach. The number of targets supported by degradome was far less than that predicted by using computational psRNATarget. As expected, a majority target genes were transcription factors in plant species, and some ib-miRNA had more than one targets. Such as, ib-miR156a-5p and ib-miR5658 both had 10 targets and ib-miR159a had 6 targets. In addition, some ib-miRNAs belonging to the same family shared the same transcript. According to the annotation of targets, these target genes were found to participate in wide biological processes.
Ib-miRNAs involved in anthocyanin biosynthesis in sweetpotato
Auxin is essential for plant development. High levels of auxin can repress the expression of the MBW complex and thereby regulate the biosynthesis of anthocyanin [54, 55]. ARF, WRKY and HD-ZIP genes play important roles in auxin-mediated signaling, which regulates anthocyanin biosynthesis through the Aux/IAA-ARF pathway in apple [56]. In plants, ARF genes were regulated by miR160 and miR390 [24, 57]. The WRKY mainly involved in auxin-mediated signaling and had considerable effect on flavonoid and anthocyanin biosynthesis [58, 59]. HD-ZIP TF plays critical roles in shoot apical meristem and organ polarity in plant [23]. Our previous study showed that blockage of miR165/166 caused the up-regulation of HD-ZIP TFs and increased IAA content accompanied by enhanced anthocyanin content in Arabidopsis [17]. In this study, the analysis of sRNA and degradome sequencing demonstrated that WRKY and ARF were targeted by ib-miR172e-3p and ib-miR160e-5p, respectively; while HD-ZIPs were targeted by ib-miR164c and ib-miR166m (Table 1). These results suggested that ib-miR172e-3p, ib-miR160e-5p, ib-miR164c and ib-miR166m might regulate anthocyanin biosynthesis through the auxin signaling.
CAD is one of the key enzyme genes of lignin biosynthesis [60], which has been found to be targeted by ib-miR156, ib-miR157 and ib-miR396 (Fig. 9). MiR156 and miR159 have been reported as potential regulators of secondary wall biosynthesis in Acacia mangium [61]. In this study, four members of ib-miR159 family were found to have a common novel target I2’H (Fig. 9), which can promote the accumulation of medicarpin [62]. MiR6300, only detected in few leguminous plants like Catharanthus roseus and Camellia sinensis, was found to target UFGT [63, 64]. Eight miRNAs were found to regulate the enzyme genes involved in the phenylpropanoid pathway in sweetpotato in this study. Based on the interactions of the miRNAs and enzyme genes in phenylpropanoid biosynthesis, we proposed a pathway panel for phenylpropanoid regulation in sweetpotato (Fig. 9).
The MYB TFs have been identified to be one of the major regulators in the pathway of anthocyanin biosynthesis [65,66,67]. For example, AtPAP1 (AtMYB75) and its orthologs have been shown to effectively induce anthocyanin production in various plant species [68,69,70]. Over-expression of MYB1 induced anthocyanin accumulation in sweetpotato and apple [65, 71]. MYB has been demonstrated to be regulated by many miRNA members. For instance, miR828 was involved in the anthocyanin production, trichome and cotton fiber development by regulating MYB in plant [16, 18, 72, 73]. MiR858 was found to play a positive role in the accumulation of anthocyanin by cleaving MYBL2 in Arabidopsis [9]. MiR858 has also been identified to target up to 66 MYB members in apple [74, 75]. Similarly, our recent studies showed that Sl-miR858 regulated two SlMYB transcripts and functioned in anthocyanin accumulation in tomato [45]. In this study, MYB genes were also targeted by ib-miR858, ib-miR319, ib-miR159 and ib-miR156. Compared with WFSP, ib-miR858b was significantly up-regulated whereas its corresponding target gene ibMYB down-regulated in PFSP (Table 1; Fig. 6). The WD40 protein was reported to be essential and irreplaceable in the MYB-bHLH complex for anthocyanin biosynthesis in sweetpotato [76]. The transcript of ibWD40 was not cleaved by ib-miR396g-5p in degradome sequencing, although it was a potential target of ib-miR396g-5p predicted by psRNATarget (Additional file 7). Ib-miR396g-5p and ibWD40 both expressed higher in PFSP than in WFSP showed by qRT-PCR (Fig. 6). One possible reason is that the miRNAs may impose a translational regulation on their targets, which could not be detectable by degradome sequencing. Transcription factor bHLH is essential for the activity of the R2R3-MYB partner and can directly bind to the promoters of DFR and UFGT to activate or inhibit anthocyanin biosynthesis [77, 78]. However, none of miRNA was identified to target bHLH in this study. The enzyme gene LcUFGT plays a major role in anthocyanin accumulation [79]. In sweetpotato, we found ib-miR6300 directly targeted ibUFGT, suggesting that b-miR6300 may participate in anthocyanin biosynthesis by regulating ibUFGT (Additional file 9). However, the regulatory mechanism needs further validation.
SPLs are transcription factors widely existing in plants, which play an important role in plant growth and development, primary and secondary metabolism, as well as other biological processes. In Arabidopsis, SPL was demonstrated to be regulated by miR156, and acted as negative regulators of anthocyanin accumulation by destabilization of the MBW complex in Arabidopsis [14]. In this study, ib-miR156a-5p was identified to cleave ibSPL genes (Additional file 9). The results of sRNA sequencing and qRT-PCR showed that miR156a-5p significantly up-regulated whereas its target ibSPL expressed down-regulated in PFSP compared with WFSP (Fig. 6). By over-expressing ib-miR156 in Arabidopsis, a purple phenotype with high anthocyanin accumulation in the main stem of transgenic Arabidopsis was observed. The results of qRT-PCR showed that the over-expression of ib-miR156 in Arabidopsis strongly suppressed the abundance of SPL (Fig. 10), which consistent with the results of Gou et al. [14]. In addition, up-regulated transcripts for four structural genes of anthocyanin pathway were detected in ib-miR156 over-expressing transgenic plant (Fig. 10), suggesting that ib-miR156 may modulate anthocyanin biosynthesis through regulation of the structure genes in the phenylprepanoid pathway. These results indicated that the regulatory function of ib-miR156 is similar to that of at-miR156.
Putative ib-miRNA-target model involved in anthocyanin biosynthesis in sweetpotato
Anthocyanin biosynthesis was modulated by regulating genes, including MYB, WDR, bHLH, SPL, ARF and MADS-box. In addition, sucrose synthase, ABC transporter and sugar/inositol transporter were also potentially participated in anthocyanin biosynthesis. In this study, according to the annotation of targets, we found that 26 differentially expressed miRNAs and 36 their corresponding regulator genes were more likely to participate in anthocyanin biosynthesis in sweetpotato (Table 1, Additional file 14). Based on the present data and previous reports, a possible ib-miRNA-target model related to anthocyanin biosynthesis was proposed. As shown in Fig. 11, miRNA families of ib-miR156, ib-miR159, ib-miR396 and ib-miR858 potentially targeted SPL, MYB and WDR to shape a regulatory MBW complex; miRNA families of ib-miR164, ib-miR165/166 and ib-miR172e-3p.2 possibly targeted WRKY and HD-ZIP to involve in auxin signaling; ib-miR160, miRNA families of ib-miR172 and ib-miR2111 might regulate ARF and ERF to activate auxin-mediated signaling and sucrose signaling. All of these biological processes would influence the expression of structural genes, and subsequently form a complex regulatory network to modulate anthocyanin biosynthesis.

A proposed interaction model between miRNAs and their corresponding target genes associated with the genes in sweetpotato anthocyanin biosynthesis. The solid and dashed arrowhead lines represented the proved and potential regulatory roles, respectively
Conclusions
In summary, this is the first report on systematic identification, expression analysis and potential roles of miRNAs and their targets in regulating anthocyanin biosynthesis in tuberous roots of sweetpotato. A total of 26 differentially expressed miRNAs and 36 corresponding targets were more likely to be related to anthocyanin biosynthesis by bioinformatic analysis and expression validation. By Agrobacterium mediated genetic transformation, ib-miR156 over-expressing transgenic Arabidopsis with purplish phenotype were obtained. The expression amount of ib-miR156 was up-regulated in the transgenic lines, while its target SPL showed down-regulated expression. Four anthocyanin-specific enzyme genes, CHS, CHI, DFR and ANS, expressed significantly higher in transgenic Arabidopsis than in the wild type plants (WT), suggesting that ib-miR156 could positively mediate anthocyanin biosynthesis by modulating related structural genes. Base on above results, a putative ib-miRNA-target model associated with anthocyanin biosynthesis in sweetpotato was proposed. Our findings provided comprehensive information for anthocyanin-specific miRNAs and their targets, as well as a starting point for mechanism investigation of miRNAs in anthocyanin biosynthesis in sweetpotato.
Materials and methods
Plant materials
Sweetpotato (Ipomoea batatas L.) cultivars of white-fleshed Xushu-18 (XS-18) and purple-fleshed Xuzishu-3 (XZS-3) were used for sRNA and degradome sequencing. The cultivars were provided by the Sweetpotato Research Institute in Jiangsu province of China and grown in the experimental field of the Shanxi Agricultural University (Taigu, China) under the normal conditions. After root formation at the stage of 90 days, white and purple tuberous roots with similar size and shape were selected. After gently washed, the roots were immediately frozen by liquid nitrogen and stored at − 80 °C freezer. We mixed three tuberous roots samples together as one biological replicate to eliminate effects of individual genetic variance, respectively. In total, three independent biological replicates were collected for each sample.
Small RNA library construction and sequencing
Total RNAs were extracted from sweetpotato roots using Trizol reagent (Invitrogen, USA) according to the manufacturer’s instructions. Total RNA from each genotype was isolated in three biological replicates and the quality and quantity of RNAs were measured with the NanoPhotometer® spectrophotometer (IMPLEN, CA, USA). Then, two sequencing libraries (XS-18 and XZS-3) were constructed using NEBNext® Multiplex Small RNA library Prep Set for Illumina® (NEB, USA.) following the manufacturer’s recommendations and sequenced on an Illumina Hiseq 2000 platform at Novogene Bioinformatics Institute, Beijing, China.
Identification and expression analysis of sweetpotato miRNAs using deep sequencing
The process for known and novel miRNAs in sweetpotato tuberous roots was performed following the previous reported approach [39]. Firstly, clean reads were obtained from raw data by removing reads containing ploy-N, larger with 5’adapter contaminants, without 3’adapter or the insert tag, containing ploy A or T or G or C and low quality reads. Sequences smaller than 18 nucleotide (nt) and larger than 30 nt were also removed. Then the sRNA tags were mapped to reference sequence by Bowtie [80] without mismatches allowed. The transcriptome sequences using the same sweetpotato cultivars (XS-18 and XZS-3) with sRNA deep sequencing were developed in our lab (not published). The assembled sequences from the transcriptome database were used as reference sequence for predicting miRNA precursors. The mapped sequences were subjected to BLASTn search against Repeat Masker (http://www.repeatmasker.org/) and Rfam database (http://rfam.xfam.org/) to remove tags originating from protein-coding genes, repeat sequences, rRNA, tRNA, snRNA, and snoRNA, or those types of data from the specified species itself. Usually, we followed the following priority rule: known miRNA > rRNA > tRNA > snRNA > snoRNA > repeat > gene > NAT-siRNA > gene > novel miRNA > ta-siRNA. The remaining reads were aligned with the miRNA sequences deposited in the miRBase 22.1 database (http://www.mirbase.org/) [81]. The matched sequences with no mismatches were considered to be known miRNAs. The unaligned reads were then subjected to software miREvo and miRdeep2 to predict novel miRNA candidates through exploring the secondary structure, the Dicer cleavage site and the minimum free energy [82]. The stem loop hairpin structures of pre-miRNAs were also predicted using RNAfold software. MiRNA expression levels were estimated by TPM (transcript per million) through the following Normalization formula: Normalized expression = mapped read count/total reads*1000000 [83].
To reveal the differentially expressed miRNAs related to anthocyanin biosynthesis between XS-18 and XZS-3, the miRNAs expression was analyzed using the DEGseq R package, respectively. P-value was adjusted using qvalue [84]. Qvalue < 0.01 and |log2 (fold change)| > 1 was set as the threshold for significantly differential expression by default.
Degradome library construction, sequencing and data analysis
To identify potential target mRNAs for sweetpotato miRNAs, a degramdome library was constructed using the mixed roots of XS-18 and XZS-3. Firstly, by using the Oligotex kit (Qiagen, Germany), 200 μg of total RNA was used for extracting poly (A) RNA, which was ligated to a 5′ adapter with an EcoP15 I recognition site in its 3′ end. After ligated, the first-strand cDNA was generated and amplify by PCR. The PCR product was purified and digested with PAGE-gel and EcoP15 I, respectively. Then, the EcoP15 I cleaved fragments were ligated to a 3′ double-strand DNA adapter and followed by PAGE-gel purification to obtain the ligated products. After PCR amplification, PAGE-gel was used for the third time to purify the final products. Finally, the purified cDNA library was ready for deep sequencing on Illumina HiSeq2000 sequencing system (LC-BIO Sciences, China).
After sequencing, the adapter sequences, low-quality reads and N-containing fragments were filtered from the raw reads. The remaining sequences mapped to the sweetpotato transcriptome database of XS-18 and XZS-3 were used to identify potentially cleaved targets by CleaveLand4 pipeline as previously described [85]. The degradome event mediated by sRNA was categorized as 0, 1, 2, 3, and 4 based on the abundance of its cleaved tag reads across the target transcript [86]. Category 0: Abundance equal to the maximum of the target transcript abundance and the cleaved tag reads had only one maximum value. Category 1: Abundance equal to the maximum of the target transcript abundance, and the cleaved tag reads had more than one maximum value. Category 2 represented the cleaved tag abundance was less than the maximum but higher than the mean of the transcript abundance. Category 3: the cleaved tag abundance was less than or equal to the mean of the transcript abundance. Category 4 represented the depth of the position equal to 1. T-plots were built to analyze the miRNA targets and RNA degradation patterns according to the distribution and abundances along these transcripts. The potential targets of miRNAs were analyzed by PAREsnip software with P-value < 0.05 [87].
GO enrichment and KEGG pathway analysis
GO terms of the miRNAs targets were annotated according to their biological role, molecular function and cellular component by using the online GO analysis tool (http://www.geneontology.org/page/go-enrichment-analysis) [88]. The statistical enrichment of the candidate target genes in KEGG pathways was set by KOBAS software [89, 90].
Construction of ib-pri-MIR156 over-expressing vector and genetic transformation of Arabidopsis
Ib-pri-MIR156 was isolated from PFSP, and inserted into a pOT2 vector between the 35S2 promoter and the 35S terminator. Then, the pOT2 was mobilized into a modified pCAMBIA2300 binary vector to construct over-expressing vector pc2300-pOT2-ib-pri-MIR156. The vector was introduced into Agrobacterium GV3101 and followed by Agrobacterium mediated transformation to obtain transgenic Arabidopsis [91]. All the primers used for plasmid construction were listed in Additional file 15.
Analysis of the expressions of ib-miRNAs, corresponding targets and anthocyanin-specific enzyme genes by qRT-PCR
The expressions of miRNAs and their corresponding targets were evaluated by qRT-PCR. Total RNA was extracted from XS-18 and XZS-3 by using Trizol (Invitrogen, USA). For miRNA expression analysis, the specific stem loop RT, forward and universal reverse primers were designed according to the reported method with some modifications [92]. One μg of DNase treated total RNA was used for cDNA synthesis following the procedures of PrimeScript™ 1st Strand cDNA synthesis kit (TaKaRa, China). All qRT-PCR analysis was carried out using SYBR Premix Ex Taq™ (Tli RNaseH Plus) (TaKaRa, China) and performed on a Bio-Rad CFX96 Real-Time PCR Systems (Bio-Rad, USA). For sweetpotato, the ib5S and ibActin gene were used as internal reference for accurate normalization in each reaction for the miRNA, and target genes, respectively [93]. For transgenic Arabidopsis over-expressing miR156, the atU6 and atActin were used. The relative expression levels were calculated using the 2-ΔΔCt method [94]. Each sample from three biological replicates was performed in triplicate. Results were presented as means ± SD. The method of Dunnett’s two-tailed t-test was used to conduct the statistical analysis of RT-PCR results, and the statistical significant differences were shown at p ≤ 0.05 (marked *) and p ≤ 0.01 (marked **). The sequences for all the primers were listed in Additional file 15.
Abbreviations
- ANS:
-
Anthocyanidin synthase
- ARF:
-
Auxin response factor
- CAD:
-
Cinnamyl alcohol dehydrogenase
- CHI:
-
Chalcone isomerase
- CHS:
-
Chalcone synthase
- DFR:
-
Dihydroflavonol 4-reductase
- ERF:
-
Ethylene-responsive transcription factor
- EST:
-
Expressed sequence tag
- F3’5’H:
-
Flavonoid 3′,5′-hydroxylase
- F3’H:
-
Flavanone 3-hydroxylase
- F3H:
-
Flavanone 3-hydroxylase
- GO:
-
Gene ontology
- HD-ZIP:
-
Homeodomain-leucine zipper protein
- I2’H:
-
Isoflavone 2′-hydroxylase
- IAA:
-
Indole-3-acetic acid
- KEGG:
-
Kyoto encyclopedia of genes and genomes
- PAL:
-
Phenylalanine ammonia lyase
- SPL:
-
Squamosa promoter-binding protein-like
- sRNA:
-
small RNA
- TF:
-
Transcript factor
- UFGT:
-
UDP-glycose flavonoid glycosyltransferase
- WDR:
-
WD repeat-containing proteins
References
Bovell-Benjamin AC. Sweet potato: a review of its past, present, and future role in human nutrition. Adv Food Nutr Res. 2007;52(06):1–59.
Suda I, Oki T, Masuda M, Kobayashi M, Nishiba Y, Furuta S. Physiological functionality of purple-fleshed sweet potatoes containing anthocyanins and their utilization in foods. Jpn Agric Res. 2003;37:167–73.
Matsui T, Ebuchi S, Kobayashi M, Fukui K, Sugita K, Terahara N, Matsumoto K. Anti-hyperglycemic effect of diacylated anthocyanin derived from Ipomoea batatas cultivar ayamurasaki can be achieved through the alpha-glucosidase inhibitory action. J Agric Food Chem. 2002;50(25):7244–8.
Yamakawa O. Development of sweetpotato cultivars for new processing use in Japan. Kyushu National Agricultural Experiment Station. Japan. Dept of Upland Farming. 1998;75(2):284–7.
Cevallos-Casals BVA, Cisneros-Zevallos L. Stability of anthocyanin-based aqueous extracts of Andean purple corn and red-fleshed sweet potato compared to synthetic and natural colorants. Food Chem. 2004;86(1):69–77.
Johnson M, Pace RD. Sweet potato leaves: properties and synergistic interactions that promote health and prevent disease. Nutr Rev. 2010;68(10):604–15.
Ma P, Bian X, Jia Z, Guo X, Xie Y. De novo sequencing and comprehensive analysis of the mutant transcriptome from purple sweet potato (Ipomoea batatas L.). Gene. 2015;575(3):641–9.
Park KI, Ishikawa N, Morita Y, Choi JD, Hoshino A, Iida S. A bHLH regulatory gene in the common morning glory, Ipomoea purpurea, controls anthocyanin biosynthesis in flowers, proanthocyanidin and phytomelanin pigmentation in seeds, and seed trichome formation. Plant J. 2007;49(4):641–54.
Wang YL, Wang YQ, Song Z, Zhang H. Repression on of MYBL2 by both microRNA858a and HY5 leads to the activation of anthocyanin biosynthetic pathway in Arabidopsis. Mol Plant. 2016;9(10):1395–405.
Castellarin SD, Pfeiffer AP, Degan M, Peterlunger E, Gaspero GDI. Transcriptional regulation of anthocyanin biosynthesis in ripening fruits of grapevine under seasonal water deficit. Plant Cell Environ. 2007;30(11):1381–99.
Xu W, Dubos C, Lepiniec L. Transcriptional control of flavonoid biosynthesis by MYB-bHLH-WDR complexes. Trends Plant Sci. 2015;20(3):176–85.
Maier A, Schrader A, Kokkelink L, Falke C, Welter B, Iniesto E, et al. Light and the E3 ubiquitin ligase COP1/SPA control the protein stability of the MYB transcription factors PAP1 and PAP2 involved in anthocyanin accumulation in Arabidopsis. Plant J. 2013;74(4):638–51.
Qi TC, Song SS, Ren QC, Wu DW, Huang H, Chen Y, et al. The Jasmonate-ZIM-domain proteins interact with the WD-repeat/bHLH/MYB complexes to regulate Jasmonate-mediated anthocyanin accumulation and trichome initiation in Arabidopsis thaliana. Plant Cell. 2011;23(5):1795–814.
Gou JY, Felippes FF, Liu CJ, Weigel D, Wang JW. Negative regulation of anthocyanin biosynthesis in Arabidopsis by a miR156-targeted SPL transcription factor. Plant Cell. 2011;23(4):1512–22.
Zhou H, Lin-Wang K, Wang H, Gu C, Dare AP, Espley RV, He H, Allan AC, Han Y. Molecular genetics of blood-fleshed peach reveals activation of anthocyanin biosynthesis by NAC transcription factors. Plant J. 2015;82(1):105–21.
Yang FX, Cai J, Yang Y, Liu ZB. Overexpression of microRNA828 reduces anthocyanin accumulation in Arabidopsis. Plant Cell Tissue Organ Cult. 2013;115(2):159–67.
Jia XY, Ding N, Fan WX, Yan J, Gu YY, Tang XQ, Li RZ, Tang GL. Functional plasticity of miR165/166 in plant development revealed by small tandem target mimic. Plant Sci. 2015;233:11–21.
Jia XY, Liu H, Shen J, Li F, Ding N, Sun Y, Gao CY, Li RZ. Negative regulation of anthocyanin biosynthesis in tomato by microRNA828 under phosphate deficiency. Sci Agric Sin. 2015;48(15):2911–24.
Baulcombe D. RNA silencing in plants. Nature. 2004;431(7006):356–63.
Wu L, Zhou H, Zhang Q, Zhang J, Ni F, Liu C, et al. DNA methylation mediated by a microRNA pathway. Mol Cell. 2010;38(3):465–75.
Ding D, Zhang L, Wang H, Liu Z, Zhang Z, Zheng Y. Differential expression of miRNAs in response to salt stress in maize roots. Ann Bot. 2009;103(1):29–38.
Sunkar R, Chinnusamy V, Zhu J, Zhu JK. Small RNAs as big players in plant abiotic stress responses and nutrient deprivation. Trends Plant Sci. 2007;12(7):301–9.
Williams L, Grigg SP, Xie M, Christensen S, Fletcher JC. Regulation of Arabidopsis shoot apical meristem and lateral organ formation by microRNA miR166g and its AtHD-ZIP target genes. Development. 2005;132(16):3657–68.
Xia R, Xu J, Meyers BC. The emergence, evolution, and diversification of the miR390-TAS3-ARF pathway in land plants. Plant Cell. 2016;29(6):1232–47.
Luo QJ, Mittal A, Jia F, Rock CD. An autoregulatory feedback loop involving PAP1 and TAS4 in response to sugars in Arabidopsis. Plant Mol Biol. 2012;80(1):117–29.
Jia XY, Yu ZQ, Liang JP, Tang GL, Jin LH, Zhang L, He LH, Li RZ. Cloning of Arabidopsis at-pri-miR828 gene and its genetic transformation into tomato. Acta Horticulturae Sinica. 2013;40(12):2419–28.
Li T, Ma L, Geng YK, Hao CY, Chen XH, Zhang XY. Small RNA and degradome sequencing reveal complex roles of miRNAs and their targets in developing wheat grains. PLoS One. 2015;10(10):e0139658.
Kwon Y, Oh JE, Noh H, Hong SW, Bhoo SH, Lee H. The ethylene signaling pathway has a negative impact on sucrose-induced anthocyanin accumulation in Arabidopsis. J Plant Res. 2011;124(1):193–200.
Song QX, Liu YF, Hu XY, Zhang WK, Ma B, Chen SY, Zhang JS. Identification of miRNAs and their target genes in developing soybean seeds by deep sequencing. BMC Plant Biol. 2011;11(1):5–20.
Li YF, Zheng Y, Charles AQ, Zhang L, Ajay S, Guru J, et al. Transcriptome-wide identification of microRNA targets in rice. Plant J. 2010;62(5):742–59.
Wu J, Zheng S, Feng G, Yi H. Comparative analysis of miRNAs and their target transcripts between a spontaneous late-ripening sweet orange mutant and its wild-type using small RNA and degradome sequencing. Front Plant Sci. 2016;7:1416.
Chen J, Zheng Y, Qin L, Wang Y, Chen L, He Y, et al. Identification of miRNAs and their targets through high-throughput sequencing and degradome analysis in male and female Asparagus officinalis. BMC Plant Biol. 2016;16(1):80–99.
Sun Y, Qiu Y, Duan M, Wang J, Zhang X, Wang H, et al. Identification of anthocyanin biosynthesis related microRNAs in a distinctive Chinese radish ( Raphanus sativus L.) by high-throughput sequencing. Mol Gen Genomics. 2016;292(1):215–29.
Liu H, Qin C, Chen Z, Zuo T, Yang X, Zhou H, et al. Identification of miRNAs and their target genes in developing maize ears by combined small RNA and degradome sequencing. BMC Genomics. 2014;15(1):25.
Jeyaraj A, Zhang X, Hou Y, Shangguan M, Gajjeraman P, Li Y, Wei C. Genome-wide identification of conserved and novel microRNAs in one bud and two tender leaves of tea plant ( Camellia sinensis ) by small RNA sequencing, microarray-based hybridization and genome survey scaffold sequences. BMC Plant Biol. 2017;17(1):212–28.
Bian X, E Z, Ma P, Jia Z, Guo X, Xie Y. Identification of miRNAs in sweet potato by solexa sequencing. Russ J Plant Physiol. 2016;63(2):283–92.
Sun RR, Guo TL, Cobb J, Wang QL, Zhang BH. Role of microRNAs during flower and storage root development in sweet potato. Plant Mol Biol Rep. 2015;33(6):1731–9.
Jonesrhoades MW, Bartel DP, Bartel B. MicroRNAs and their regulatory roles in plants. Annu Rev Plant Biol. 2006;57(1):19–53.
Meyers BC, Axtell MJ, Bonnie B, Bartel DP, David B, Bowman JL, et al. Criteria for annotation of plant MicroRNAs. Plant Cell. 2008;20(12):3186–90.
Thakur V, Wanchana S, Xu M, Bruskiewich R, Quick WP, Mosig A, et al. Characterization of statistical features for plant microRNA prediction. BMC Genomics. 2011;12(1):108.
Lu BY, Cheng GX, Zhang Z, Sun JT, Ali M, Jia QL, et al. CaMYC, a novel transcription factor, regulates anthocyanin biosynthesis in color-leaved pepper (Capsicum annuum L.). J Plant Growth Regul. 2018:1–12. https://doi.org/10.1007/s00344-018-9871-2.
Liu R, Lai B, Hu B, Qin Y, Hu G, Zhao J. Identification of microRNAs and their target genes related to the accumulation of anthocyanins in Litchi chinensis by high-throughput sequencing and degradome analysis. Front Plant Sci. 2017;7:2059.
Robert-Seilaniantz A, MacLean D, Jikumaru Y, Hill L, Yamaguchi S, Kamiya Y, et al. The microRNA miR393 re-directs secondary metabolite biosynthesis away from camalexin and towards glucosinolates. Plant J. 2011;67(2):218–31.
Ng DW, Zhang C, Miller M, Palmer G, Whiteley M, Tholl D, et al. cis- and trans-regulation of miR163 and target genes confers natural variation of secondary metabolites in two Arabidopsis species and their allopolyploids. Plant Cell. 2011;23(5):1729–40.
Jia XY, Shen J, Liu H, Li F, Ding N, Gao CY, et al. Small tandem target mimic-mediated blockage of microRNA858 induces anthocyanin accumulation in tomato. Planta. 2015;242(1):283–93.
Dehury B, Panda D, Sahu J, Sahu M, Sarma K, Barooah M, et al. In silico identification and characterization of conserved miRNAs and their target genes in sweet potato (Ipomoea batatas L.) expressed sequence tags (ESTs). Plant Signal Behav. 2013;8(12):e26543.
Xie Z, Wang A, Li H, Yu J, Jiang J, Tang Z, et al. High throughput deep sequencing reveals the important roles of microRNAs during sweetpotato storage at chilling temperature. Sci Rep. 2017;7(1):16578.
Hirakawa H, Okada Y, Tabuchi H, Shirasawa K, Watanabe A, Tsuruoka H, et al. Survey of genome sequences in a wild sweet potato, Ipomoea trifida (H. B. K.) G. Don. DNA Res. 2015;22(2):171–9.
Zhang B. MicroRNA. A new target for improving plant tolerance to abiotic stress. J Exp Bot. 2015;66(7):1749–61.
Yang J, Moeinzadeh MH, Kuhl H, Helmuth J, Xiao P, Haas S, et al. Haplotype-resolved sweet potato genome traces back its hexaploidization history. Nat Plants. 2017;3(9):696–703.
Wu S, Lau KH, Cao Q, Hamilton JP, Sun H, Zhou C, Eserman L, Gemenet DC, Olukolu BA, Wang H, et al. Genome sequences of two diploid wild relatives of cultivated sweetpotato reveal targets for genetic improvement. Nat Commun. 2018;9(1):4580.
Ku YS, Wong JW, Mui Z, Liu X, Hui JH, Chan TF, Lam HM. Small RNAs in plant responses to abiotic stresses. Regulatory roles and study methods. Int J Mol Sci. 2015;16(10):24532–54.
Fang YN, Zheng BB, Wang L, Yang W, Wu XM, Xu Q, Guo WW. High-throughput sequencing and degradome analysis reveal altered expression of miRNAs and their targets in a male-sterile cybrid pummelo (Citrus grandis). BMC Genomics. 2016;17(1):591.
Liu Z, Shi MZ, Xie DY. Regulation of anthocyanin biosynthesis in Arabidopsis thaliana red pap1-D cells metabolically programmed by auxins. Planta. 2014;239(4):765–81.
Ji XH, Wang YT, Zhang R, Wu SJ, An MM, Li M, et al. Effect of auxin, cytokinin and nitrogen on anthocyanin biosynthesis in callus cultures of red-fleshed apple (Malus sieversii f .niedzwetzkyana). Plant Cell. 2015;120(1):325–37.
Wang YC, Wang N, Xu HF, Jiang SH, Fang HC, Su MY, et al. Auxin regulates anthocyanin biosynthesis through the aux/IAA-ARF signaling pathway in apple. Hortic Res. 2018;5:59.
Wang JW, Wang LJ, Mao YB, Cai WJ, Xue HW, Chen XY. Control of root cap formation by MicroRNA-targeted auxin response factors in Arabidopsis. Plant Cell. 2005;17(8):2204–16.
Jiang Y, Liang G, Yang S, Yu D. Arabidopsis WRKY57 functions as a node of convergence for jasmonic acid- and auxin-mediated signaling in jasmonic acid-induced leaf senescence. Plant Cell. 2014;26(1):230–45.
Wang N, Liu W, Zhang T, Jiang S, Xu H, Wang Y, Zhang Z, Wang C, Chen X. Transcriptomic analysis of red-fleshed apples reveals the novel role of MdWRKY11 in flavonoid and anthocyanin biosynthesis. J Agric Food Chem. 2018;66(27):7076–86.
Boerjan W, Ralph J, Baucher M. Lignin biosynthesis. Annu Rev Plant Biol. 2003;54(1):519–46.
Ong SS, Wickneswari R. Characterization of microRNAs expressed during secondary wall biosynthesis in Acacia mangium. PLoS One. 2012;7(11):e49662.
Ayabe S, Akashi T. Cytochrome P450s in flavonoid metabolism. Phytochem Rev. 2006;5(2–3):271–82.
Lelandais-Briere C, Naya L, Sallet E, Calenge F, Frugier F, Hartmann C, Gouzy J, Crespi M. Genome-wide Medicago truncatula small RNA analysis revealed novel microRNAs and isoforms differentially regulated in roots and nodules. Plant Cell. 2009;21(9):2780–96.
Shen EM, Singh SK, Ghosh JS, Patra B, Paul P, Ling Y, Pattanaik S. The miRNAome of Catharanthus roseus. Identification, expression analysis, and potential roles of microRNAs in regulation of terpenoid indole alkaloid biosynthesis. Sci Rep. 2017;7(1):43027.
Mano H, Ogasawara F, Sato K, Higo H, Minobe Y, Hironori M, Fumiaki O, Kazuhito S, Hiromi H, Yuzo M. Isolation of a regulatory gene of anthocyanin biosynthesis in tuberous roots of purple-fleshed sweet potato. Plant Physiol. 2007;143(3):1252–68.
Lai B, Li XJ, Hu B, Qin YH, Huang XM, Wang HC, Hu GB. LcMYB1 is a key determinant of differential anthocyanin accumulation among genotypes, tissues, developmental phases and ABA and light stimuli in Litchi chinensis. PLoS One. 2014;9(1):e86293.
Shen X, Zhao K, Liu L, Zhang K, Yuan H, Liao X, et al. A role for PacMYBA in ABA-regulated anthocyanin biosynthesis in red-colored sweet cherry cv. Hong Deng (Prunus avium L.). Plant Cell Physiol. 2014;55(5):862.
Zuluaga DL, Gonzali S, Loreti E, Pucciariello C, Degl'Innocenti E, Guidi L, et al. Arabidopsis thaliana MYB75/PAP1 transcription factor induces anthocyanin production in transgenic tomato plants. Funct Plant Biol. 2008;35(7):606–18.
Rowan DD, Cao M, Lin-Wang K, Cooney JM, Jensen DJ, Austin PT, et al. Environmental regulation of leaf colour in red 35S.PAP1 Arabidopsis thaliana. New Phytol. 2010;182(1):102–15.
Cutanda-Perez MC, Ageorges A, Gomez C, Vialet S, Terrier N, Romieu C, Torregrosa L. Ectopic expression of VlmybA1 in grapevine activates a narrow set of genes involved in anthocyanin synthesis and transport. Plant Mol Biol. 2009;69(6):633.
Zhou LJ, Li YY, Zhang RF, Zhang CL, Xie XB, Zhao C, Hao YJ. The SUMO E3 ligase MdSIZ1 promotes anthocyanin accumulation by sumoylating MdMYB1 under low temperature conditions in apple. Plant Cell Environ. 2017;40(10):2068–80.
Xie Y, Sun Y, Li DN. MicroRNA828 negatively regulates sucrose-induced anthocyanin Biosynthe-sis in Arabidopsis. Plant Physiology Journal. 2013;49(2):188–94.
Guan X, Pang M, Nah G, Shi X, Ye W, Stelly DM, Chen ZJ. miR828 and miR858 regulate homoeologous MYB2 gene functions in Arabidopsis trichome and cotton fibre development. Nat Commun. 2014;5(1):3050–63.
Moxon S, Jing R, Szittya G, Schwach F, Rusholme Pilcher RL, Moulton V, Dalmay T. Deep sequencing of tomato short RNAs identifies microRNAs targeting genes involved in fruit ripening. Genome Res. 2008;18(10):1602–9.
Xia R, Zhu H, An YQ, Beers EP, Liu Z. Apple miRNAs and tasiRNAs with novel regulatory networks. Genome Biol. 2012;13(6):47–64.
Dong W, Niu LL, Gu J, Gu JT, Gao F. Isolation of a WD40-repeat gene regulating anthocyanin biosynthesis in storage roots of purple-fleshed sweet potato. Acta Physiol Plant. 2014;36(5):1123–32.
Feller A, Machemer K, Braun EL, Grotewold E. Evolutionary and comparative analysis of MYB and bHLH plant transcription factors. Plant J. 2011;66(1):94–116.
Xie XB, Li S, Zhang RF, Zhao J, Chen YC, Zhao Q. The bHLH transcription factor MdbHLH3 promotes anthocyanin accumulation and fruit colouration in response to low temperature in apples. Plant Cell Environ. 2012;35(11):1884–97.
Wei YZ, Hu FC, Hu GB, Li XJ, Huang XM, Wang HC, et al. Differential expression of anthocyanin biosynthetic genes in relation to anthocyanin accumulation in the pericarp of Litchi chinensis Sonn. PLoS One. 2011;6(4):e19455.
Langmead B, Salzberg SL. Fast gapped-read alignment with bowtie 2. Nat Methods. 2012;9(4):357–9.
Kozomara A, Griffiths-Jones S. miRBase: Annotating high confidence microRNAs using deep sequencing data. Nucleic Acids Res. 2014;42(1):68–73.
Zhang BH, Pan XP, Cox SB, Cobb GP, Anderson TA. Evidence that miRNAs are different from other RNAs. Cell Mol Life Sci. 2006;63(2):246–54.
Zhou L, Chen J, Li Z, Li X, Hu X, Huang Y, et al. Integrated profiling of microRNAs and mRNAs. microRNAs located on Xq27.3 associate with clear cell renal cell carcinoma. PLoS One. 2010;5(12):e15224.
Storey JD. The positive false discovery rate a bayesian interpretation and the q-Value. Ann Stat. 2003;31:2013–35.
Addo-Quaye C, Miller W, Axtell MJ. CleaveLand. A pipeline for using degradome data to find cleaved small RNA targets. Bioinformatics. 2009;25(1):130–1.
Charles AQ, Eshoo TW, Bartel DP, Axtell MJ. Endogenous siRNA and miRNA targets identified by sequencing of the Arabidopsis Degradome. Curr Biol. 2008;18(10):758–62.
Leighton F, Simon M, Woolfenden HC, Stocks MB, Szittya G, Dalmay MV. PAREsnip. A tool for rapid genome-wide discovery of small RNA/target interactions evidenced through degradome sequencing. Nucleic Acids Res. 2012;40(13):e103.
Young MD, Wakeeld MJ, Smyth GK, Oshlack A. Geneontology analysis for RNA-seq: accounting for selection bias. Genome Biol. 2010;11:R14.
Mao XZ, Cai T, Olyarchuk JG, Wei LP. Automated genome annotation and pathway identification using the KEGG Orthology (KO) as a controlled vocabulary. Bioinformatics. 2005;21(19):3787–93.
Kanehisa M, Araki M, Goto S, Hattori M, Hirakawa M, Itoh M, et al. KEGG for linking genomes to life and the environment. Nucleic Acids Res. 2008;36:480–4.
Smith CJS, Watson CF, Bird CR, Ray J, Schuch W, Grierson D. Expression of a truncated tomato polygalacturonase gene inhibits expression of the endogenous gene in transgenic plants. Mol Gen Genet. 1990;224:477–81.
Chen CF, Ridzon DA, Broomer AJ, Zhou ZH, Lee DH, Nguyen JT, et al. Real-time quantification of microRNAs by stem-loop RT-PCR. Nucleic Acids Res. 2005;33(20):e179.
Lin JS, Lin CC, Lin HH, Chen YC, Jeng ST. MicroR828 regulates lignin and H2O2 accumulation in sweet potato on wounding. New Phytol. 2012;196(2):427–40.
Livak KJ, Schmittgen TD. Analysis of relative gene expression data using real-time quantitative PCR and the 2(−Delta Delta C(T)) method. Methods. 2001;25(4):402–8.
Acknowledgments
The authors are grateful to Qinghe Cao (Sweetpotato Research Institute in Jiangsu province of China) for providing the experimental materials (Xushu-18 and Xuzishu-3).
Funding
Gene cloning, vector construction and genetic transformation of Arabidopsis were supported by National Key R&D Program of China (2018YFD1000705, 2018YFD1000700) and Key R&D Program of Shanxi Province (201803D221008–6). The expression determination of miRNAs and genes was supported by Science and Technology Innovation Fund of Shanxi Agricultural University (2018yz001) and NSF of Shanxi Province (201801D121238). The plant treatment and sample collection were performed with the support of Coal-based Key Sci-Tech Project of Shanxi Province (FT-2014-01). The sRNA sequencing and degradome sequencing data were analyzed by the support of NSFC (31101555, 31571611) and Special Plan of Scientific Research for Shanxi Agriculture Valley Construction of China (SXNGJSKYZX201701–03).
Availability of data and materials
The datasets generated and/or analyzed during the current study are included in Additional Tables.
Author information
Authors and Affiliations
Contributions
XYJ, RZL, LHH, QHC and WBW conceived the original research plans; LHH, RMT and XWS conducted the experiments and analyzed the data. QHC provided some experimental materials. LHH, YS, TW, XYL and HMZ collected the materials. LHH, RMT, XWS and XYJ drafted the manuscript. RZL revised the manuscript critically. All authors read and approved the manuscript.
Corresponding authors
Ethics declarations
Ethics approval and consent to participate
Not applicable.
Consent for publication
Not applicable.
Competing interests
The authors declare that they have no competing interests.
Publisher’s Note
Springer Nature remains neutral with regard to jurisdictional claims in published maps and institutional affiliations.
Additional files
Additional file 1:
Statistics of sRNA sequences and transcriptome mapping of the libraries in sweetpotato. (DOC 32 kb)
Additional file 2:
Distribution of unique sRNA sequences in different categories in sweetpotato. (DOC 32 kb)
Additional file 3:
Detailed information of the known miRNAs identified in sweetpotato. (XLS 69 kb)
Additional file 4:
Normalized read counts of the known miRNAs. (XLS 37 kb)
Additional file 5:
Detailed information of the novel miRNAs identified in sweetpotato. (XLS 36 kb)
Additional file 6:
Secondary structures of novel miRNA precursors. (TIF 269 kb)
Additional file 7:
Predicted target genes of miRNAs identified in sweetpotato by psRNATarget. (XLS 935 kb)
Additional file 8:
Statistics of degedrom sequencing reads in sweetpotato. (DOC 22 kb)
Additional file 9:
Target genes of miRNAs identified in sweetpotato using degradome sequencing. (XLS 126 kb)
Additional file 10:
List of differentially expressed miRNAs between XS-18 and XZS-3. (XLS 33 kb)
Additional file 11:
Comparison of the expression levels of the miRNAs determined by qRT-PCR and deep sequencing. (TIF 901 kb)
Additional file 12:
GO analysis for the targets of differentially miRNAs identified by degradome sequencing in sweetpotato. (XLS 63 kb)
Additional file 13:
KEGG analysis for the targets of differentially miRNAs identified by degradome sequencing in sweetpotato. (XLS 24 kb)
Additional file 14:
The miRNAs and corresponding target genes potentially related to anthocyanin biosynthesis in sweetpotato. (XLS 24 kb)
Additional file 15:
List of primers used in this study. (XLS 26 kb)
Rights and permissions
Open Access This article is distributed under the terms of the Creative Commons Attribution 4.0 International License (http://creativecommons.org/licenses/by/4.0/), which permits unrestricted use, distribution, and reproduction in any medium, provided you give appropriate credit to the original author(s) and the source, provide a link to the Creative Commons license, and indicate if changes were made. The Creative Commons Public Domain Dedication waiver (http://creativecommons.org/publicdomain/zero/1.0/) applies to the data made available in this article, unless otherwise stated.
About this article

Cite this article
He, L., Tang, R., Shi, X. et al. Uncovering anthocyanin biosynthesis related microRNAs and their target genes by small RNA and degradome sequencing in tuberous roots of sweetpotato. BMC Plant Biol 19, 232 (2019). https://doi.org/10.1186/s12870-019-1790-2
Received:
Accepted:
Published:
DOI: https://doi.org/10.1186/s12870-019-1790-2