
Abstract
Background
Leaf color is a major agronomic trait, which has a strong influence on crop yields. Isolating leaf color mutants can represent valuable materials for research in chlorophyll (Chl) biosynthesis and metabolism regulation.
Results
In this study, we identified a stably inherited yellow leaf mutant derived from ‘Huaguan’ pakchoi variety via isolated microspore culture and designated as pylm. This mutant displayed yellow leaves after germination. Its etiolated phenotype was nonlethal and stable during the whole growth period. Its growth was weak and its hypocotyls were markedly elongated. Genetic analysis revealed that two recessive nuclear genes, named py1 and py2, are responsible for the etiolation phenotype. Bulked segregant RNA sequencing (BSR-Seq) showed that py1 and py2 were mapped on chromosomes A09 and A07, respectively. The genes were single Mendelian factors in F3:4 populations based on a 3:1 phenotypic segregation ratio. The py1 was localized to a 258.3-kb interval on a 34-gene genome. The differentially expressed gene BraA09004189 was detected in the py1 mapping region and regulated heme catabolism. One single-nucleotide polymorphism (SNP) of BraA09004189 occurred in pylm. A candidate gene-specific SNP marker in 1520 F3:4 yellow-colored individuals co-segregated with py1. For py2, 1860 recessive homozygous F3:4 individuals were investigated and localized py2 to a 4.4-kb interval. Of the five genes in this region, BraA07001774 was predicted as a candidate for py2. It encoded an embryo defective 1187 and a phosphotransferase related to chlorophyll deficiency and hypocotyl elongation. One SNP of BraA07001774 occurred in pylm. It caused a single amino acid mutation from Asp to Asn. According to quantitative real-time polymerase chain reaction (qRT-PCR), BraA07001774 was downregulated in pylm.
Conclusions
Our study identified a Chl deficiency mutant pylm in pakchoi. Two recessive nuclear genes named py1 and py2 had a significant effect on etiolation. Candidate genes regulating etiolation were identified as BraA09004189 and BraA07001774, respectively. These findings will elucidate chlorophyll metabolism and the molecular mechanisms of the gene interactions controlling pakchoi etiolation.
RNA-Seq RNA sequencing
RPKM Reads per kilobases per million mapped reads
SNP Single-nucleotide polymorphism
Background
The photosynthetic pigment chlorophyll (Chl) is ubiquitous in cyanobacteria and the chloroplasts of higher plants. Chl converts the energy of sunlight into bioavailable chemical energy which drives carbohydrate biosynthesis [1]. Chl is an essential component of leaf color which influences dry matter accumulation and crop yield. In general, leaves appear green because Chl predominates and has a vital role in them. When the Chl content changes in plants, various leaf color mutant phenotypes result including chlorina, virescent, albino, yellow-green, and stay-green [2]. Leaf color mutants develop from the inhibition of genes regulating Chl biosynthesis and chloroplast development. Downregulation of these genes directly or indirectly influences Chl synthesis and degradation and produces the leaf color mutations [3,4,5]. Thus, leaf color mutants may be ideally suited for the elucidation of the mechanisms of photosynthesis, Chl biosynthesis, chloroplast development, and the expression and regulation of the genes associated with these processes [6,7,8,9]. Leaf color mutants have been characterized in Arabidopsis [10], rice [11, 12], wheat [13], Brassica napus [14], Brassica oleracea [15], barley [16], kale [17], tobacco [18], soybean [19], cotton [20], and cucumber [5, 21]. Much research has been invested in the analysis of the genetics, physiology, and molecular mechanisms of Chl biosynthesis and chloroplast development via leaf color mutants.
Several studies in genetic analysis have categorized leaf color mutation inheritance as nuclear and cytoplasmic. Most leaf color mutations are recessively inherited and conferred by a single nuclear gene [21,22,23,24]. Leaf color mutations involving two recessive genes are rare. Moreover, their inheritance is complex and it is difficult to apply genetic analysis and gene mapping on them. Wu et al. identified the light color mutant ws1 in Nicotiana tabacum and determined that this phenotype was controlled by the recessive nuclear genes ws1a and ws1b localized by different BC1F2 groups to linkage groups 5 and 24, respectively [18]. BnChd1–1 and BnChd1–2 are responsible for the light green leaf mutant phenotype in Brassica napus. Fine mapping of BnChd1–1 was achieved using the BC3F1 population. Candidate gene prediction suggested that BnChd1–1 encodes a subunit of the nicotinamide adenine dinucleotide phosphate (NADPH) complex in the thylakoid lumen [25]. Chl-deficient mutant phenotypes in durum wheat [26] and Brassica juncea [27] are also controlled by two recessive genes. Cytoplasmic mutants are uncommon compared to nuclear mutants. However, they have been reported for tobacco [28], barley [29], and Brassica campestris [30].
In plants, Chl biosynthesis comprises 15 enzymatic steps regulated by at least 27 genes [31]. Inactivation mutations of the Chl biosynthetic genes usually results in Chl-deficient mutants [11, 22, 32, 33]. Mutations in the genes governing Chl degradation metabolism generally produce stay-green mutants which retain their green leaf phenotype even during senescence [24, 34, 35]. Chl and heme biosynthesis are two types of tetrapyrrole formation and share a common metabolic pathway from 5-aminolevulinic acid (ALA) to protoporphyrin IX (Proto IX) [36]. Heme is essential for both respiration and photosynthesis. In contrast, excessive heme accumulation inhibits glutamyl-tRNA reductase activity and ALA synthesis, reduces the rate of tetrapyrrole biosynthesis, and affects Chl biosynthesis [37]. Leaf color mutants arising from abnormal heme metabolism were identified for Arabidopsis [38], rice [39,40,41], pea [42], and maize [43].
In a previous study, we developed a pakchoi (Brassica rapa L. ssp. chinensis) yellow leaf mutant (pylm) derived from the ‘Huaguan’ pakchoi variety by isolated microspore culture. This strain is a double haploid (DH) with a stable yellow leaf phenotype [44]. In the present study, we conducted genetic analysis on pylm using bulked segregant RNA sequencing (BSR-Seq) with linkage analysis to map the corresponding genes. Then, the candidate genes associated with the mutant phenotype were predicted. The information derived from this work may help facilitate the cloning of etiolation genes and elucidate the molecular mechanisms of gene interactions.
Results
Phenotypic characterization of mutant pylm
The wild type ‘CK-51’ and pylm were both obtained from isolated microspore culture of the ‘Huaguan’ pakchoi variety. However, the latter displayed yellow leaves at germination and this phenotype was stable throughout its lifetime (Fig. 1). The mutant had a slender phenotype and weak growth. However, its yellow leaf color was nonlethal. Moreover, relative to ‘CK-51’, pylm displayed an elongated hypocotyl at the seedling stage (Fig. 1c) and early flowering at the bolting stage (Fig. 1b).

Phenotypes of mutant pylm and wild type ‘CK-51’. a pylm (left) and ‘CK-51’ (right) at the seedling stage; b ‘CK-51’ (left) and pylm (right) at the bolting stage; c Seedling morphology of 2-wk pylm and ‘CK-51’ plants. Labeled plants in the tray are pylm. Scale bar: a-50 mm; b-120 mm; c-25 mm
Genetic analysis of mutant pylm
F1 and F2 populations were constructed from crosses between pylm and the Chinese cabbage DH line ‘FT’ (Additional file 1: Figure S1). The F1 individuals from the reciprocal crosses had the same green leaf phenotype as ‘FT’. Therefore, inheritance of the etiolation phenotype in pylm is nuclear rather than cytoplasmic. Segregation statistics data for the green and yellow leaf phenotypes of the F2 population accorded with the expected Mendelian ratio of 15:1 (χ2 < χ20.05 = 3.84). Thus, the Chl deficiency trait is controlled by two recessive nuclear genes. The BC1 progeny was obtained from F1 separately backcrossed with pylm and ‘FT’. Segregation statistics data for the green and yellow leaf phenotypes of the BC1F1 population from the cross of F1 with pylm fitted the expected Mendelian ratio of 3:1 (χ2 < χ20.05 = 3.84). This finding confirms that the mutant trait is conferred by two recessive nuclear genes. They were designated as py1 and py2. Neither gene alone can induce the yellow leaf phenotype. Phenotypic data for all generations are listed in Table 1.
Segregation of py1 and py2
According to the genetic analysis of pylm, the reduced-Chl phenotype is controlled by the recessive nuclear genes py1 and py2. In consequence, the F2 and BC1F1 populations could not be used to map these genes separately. To separate py1 from py2, F2 individuals with green leaves may be randomly selected and self-pollinated to produce F2:3 progeny. Green-colored F2:3 plants with a statistical segregation ratio of 3:1 (green-colored:yellow-colored) may be self-pollinated to generate F3:4 progeny. In theory, ~ 2/3 of the F3:4 families should display the expected Mendelian segregation ratio of 3:1. Some of these could map py1 while the others could map py2 (Fig. 2).
Genetic model for the pylm mutant. G and Y indicate green-colored and yellow-colored plants, respectively
Twenty green-colored individuals from F2 were randomly selected and self-pollinated to produce F2:3. For the twenty F2:3 families, phenotypic segregations were investigated. There were three distinct groups. Eleven populations showed no yellow-colored plants, five segregated with 15:1, and the other four with 3:1 (Additional file 3: Table S1). These results corroborated the theoretical segregation ratio of “all green-colored:(green-colored:yellow-colored = 3:1):(green-colored:yellow-colored = 15:1) = 7:4:4” for F2:3.
Of the four F2:3 families segregated with 3:1, eight plants with green leaves per family were selected and self-pollinated to produce F3:4. Phenotypic segregations revealed that twenty F3:4 families (Nos. 1–20) segregated with 3:1 while the other twelve showed no yellow-colored individuals (Nos. 21–32). Thus, their F2:3 genotypes should be Py1 py1 py2 py2/py1 py1 Py2 py2 and Py1 Py1 py2 py2/py1 py1 Py2 Py2, respectively (Additional file 3: Table S2). Phenotypic segregations of the F3:4 families fitted the theoretical segregation ratio of “(green-colored:yellow-colored = 3:1):all green-colored = 2:1”. Therefore, the F3:4 families (Nos. 1–20) could be used to map the py1 and/or py2 loci.
BSR-Seq analysis
A total of 47,526,126 and 49,119,466 raw reads (150-bp) were generated from the G-pool and Y-pool, respectively. After quality evaluation and data filtering, 97% of the read pairs (46,456,174 for the G-pool and 47,581,728 for the Y-pool) remained. Clean reads were mapped against the Brassica reference genome with Hisat v. 2.0.14. Of these, > 66% were uniquely mapped in both pools.
Relative to the reference genome, 154,863 and 157,022 SNPs were detected in the G-pool and Y-pool, respectively. Differential SNP loci were screened for ED5 calculation and 412 target differential SNP loci were obtained between the pools according to the top 1% ED5 threshold. Two distinct peaks were observed on chromosomes A07 and A09 (Fig. 3). This finding was consistent with the hypothesis that the mutant trait is controlled by two recessive nuclear genes. Thus, it was predicted that the etiolation genes were located on chromosomes A07 and A09 within five chromosome regions (Table 2).

ED5 distributions on chromosomes. Each color on the X-axis represents different chromosomes of Brassica rapa. Y-axis represents ED5 for each differential SNP locus. Horizontal line is the threshold of the top 1% ED5
Identification of differentially expressed genes
RPKM was used to measure gene expression level. By setting RPKM ≥0.1, 55,250 genes were detected. These were divided into six RPKM distribution intervals (Additional file 3: Table S3). There were 181 DEGs between the G-pool and Y-pool according to the constraint (|log2 fold change| ≥ 1 and FDR ≤ 0.05). Ninety genes were upregulated and the others were downregulated when the G-pool was compared with the Y-pool (Additional file 2: Figure S2). The DEGs are shown in Additional file 3: Table S4.
Fine mapping of py1
Ninety-six SSR markers were developed around the three predicted chromosome regions on chromosome A09. They were used to detect polymorphisms between pylm and ‘FT’. After screening, thirty-seven SSR markers displayed polymorphisms between parents. They were used to test twelve green-colored and yellow-colored individuals each from the No. 1 F3:4 family. SSRzk5 and SSRzk12 were located near the 23,811,435-27,563,122 region on chromosome A09 and showed linkage to py1 on the opposite side.
A total of 1520 yellow-colored individuals of the No. 1 F3:4 family were selected as the py1 mapping population. A linkage analysis disclosed that py1 was located between SSRzk5 and SSRzk12 at estimated genetic distances of 3.2 cM and 1.8 cM, respectively (Fig. 4a). To identify the molecular markers tightly linked to py1 and narrow the py1 mapping interval, new SSR and Indel markers were developed between SSRzk5 and SSRzk12. The polymorphic markers SSRzk17, SSRzk28, SSRzk29, SSRzk36, Indelzk72, and Indelzk125 were linked to py1 (Additional file 3: Table S5). SSRzk17, Indelzk72, and Indelzk125 were located on one side of py1 as SSRzk5 while SSRzk28, SSRzk29, and SSRzk36 were located on the other side of py1 as SSRzk12. The py1 was mapped between Indelzk125 and SSRzk36 at 0.13 cM and 0.2 cM, respectively (Fig. 4b). Therefore, py1 was mapped in a 258.3-kb region between the most tightly linked markers (Fig. 4c).

Genetic and physical py1 maps and candidate gene analysis. a: Chromosome A09 linkage map was constructed with 1520 pylm individuals from the No. 1 F3:4 family. The py1 was preliminarily mapped between SSRzk17 and SSRzk28; b: Fine mapping of py1. The py1 was restricted to the region between Indelzk125 and SSRzk36. Number of recombinants between the markers and py1 is shown below the genetic map. The mapping distance above the linkage map is in centimorgan (cM) units; c: Candidate py1 region and the annotated genes in the Brassica database. The py1 locus was narrowed to a 258.3-kb region comprising 34 predicted genes. The numbers 1–34 refer to the candidate genes. The arrows indicate the direction of gene expression. Detailed information on the 34 genes is presented in Additional file 3: Table S6
Candidate py1 analysis
The target DNA sequences of the 258.3-kb region between Indelzk125 and SSRzk36 were obtained from the Brassica database. A genomic sequence analysis revealed that the candidate region contained 34 genes (Fig. 4c, Additional file 3: Table S6). Differential gene expression analysis disclosed only BraA09004189 in the py1 mapping region. BraA09004189 is a heme oxygenase (HO1) which participates in heme catabolism. Mutants with yellow leaf phenotype induced by defective HOs were reported in earlier studies [40, 41]. BraA09004189 was predicted to be the most probable candidate py1 gene.
To confirm this hypothesis, two pairs of primers were designed to sequence BraA09004189 in pylm and ‘CK-51’ (Additional file 3: Table S7). The BraA sequence did not differ between parents whereas the BraB sequence in pylm presented with one SNP (Fig. 5). Based on the position of BraA09004189, an SNP marker was designed to screen 1520 yellow-colored individuals from the No. 1 F3:4 family. The bands of whole mapping individuals co-segregated with py1.

Sequence alignments of BraA09004189 in ‘CK-51’ and pylm
A qRT-PCR was performed to determine BraA09004189 expression in pylm and ‘CK-51’. In accordance with the differential gene expression analysis, the results indicated that BraA09004189 expression level was much higher in ‘CK-51’ than that in pylm (Fig. 6). This finding further supports the likelihood that BraA09004189 is the candidate for py1.
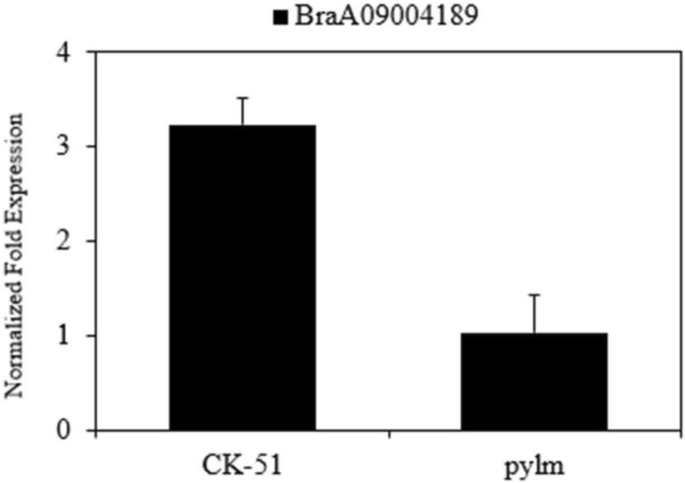
BraA09004189 expression analyses by qRT-PCR for pylm and ‘CK-51’. Error bars indicate standard errors of the means of three replicates
Fine mapping of py2
Considering the constructed populations size, we screened the Nos. 2–5 F3:4 families using the same research strategy applied for SSRzk5 and SSRzk12 linked to py1. The etiolation gene py1 was identified in the Nos. 2, 4, and 5 F3:4 families. In theory, then, the No. 3 F3:4 family may be used to establish the py2 locus.
Forty-eight SSR markers were developed around the two predicted regions on chromosome A07 to detect polymorphisms between pylm and ‘FT’. After screening, eleven SSR markers displayed polymorphisms between the parents. They were used to test twelve green-colored and twelve yellow-colored individuals of the No. 3 F3:4 family. SSR84 and SSR103 were located around the region 11,166,810-15,034,483 on chromosome A07 and presented with linkages to py2 on the opposite side (Fig. 7a; Additional file 3: Table S8).
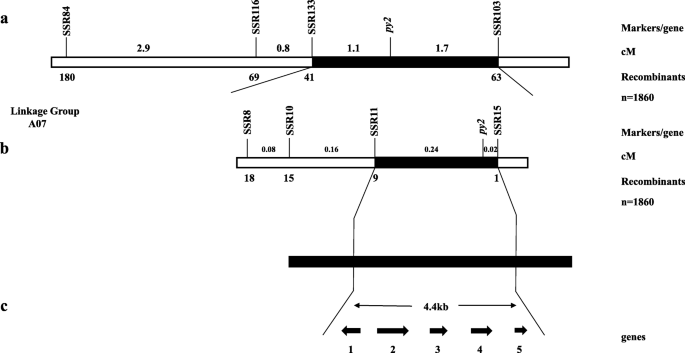
Genetic and physical maps of py2 and candidate gene analysis. a: Linkage map of chromosome A07 was constructed with 1860 individuals bearing the pylm phenotype in the No. 3 F3:4 family. The py2 was preliminarily mapped between SSR133 and SSR103; b: Fine mapping of py2. The py2 was restricted to the region between SSR11 and SSR15. The number of recombinants between the markers and py2 is shown under the genetic map. The distance above the linkage map is in centimorgan (cM) units; c: Candidate py2 region and annotated genes in the Brassica database. The py2 locus was narrowed to a 4.4-kb region containing the five predicted genes BraA07001773-BraA07001777. Arrows indicate the direction of gene expression. Detailed information on these genes is presented in Table S9
There were 1860 yellow-colored individuals from the No. 3 F3:4 family selected as the py2 mapping population. The py2 was located between SSR11 and SSR15 at estimated genetic distances of 0.24 cM and 0.02 cM, respectively (Fig. 7b). To narrow the py2 mapping interval and identify the molecular markers tightly linked to py2, new SNP markers were developed between SSR11 and SSR15. Only the polymorphic marker SNP11 was linked to py2. Based on the recombinant individuals, the py2 interval was narrowed to 14,851,951–14,896,902 and contained five genes (Fig. 7c).
Candidate py2 analysis
Annotation data for the five candidate genes in the py2 target region were obtained from the Brassica database (Additional file 3: Table S9). Primers were designed to cover the cDNA for each gene and predict the candidate genes (Additional file 3: Table S10). There were no differences between pylm and ‘CK-51’ in terms of BraA07001775, BraA07001776, or BraA07001777. After PCR amplification, the BraA07001773 sequence was disordered and the sequence comparisons were inconsistent over serial repetitions. There was SNP variation between parents for the first exon in BraA07001774 (Fig. 8). It caused a single amino acid mutation from Asp (GAT) in the wild type to Asn (AAT) in pylm (Fig. 9). Therefore, BraA07001774 was taken as the most probable candidate gene for py2.

Sequence alignments of BraA07001774 in ‘CK-51’ and pylm

Amino acid sequence alignments of BraA07001774 in ‘CK-51’ and pylm
BraA07001774 is an embryo defective 1187 (emb 1187) and a phosphotransferase. The albino mutants (pds1, pds2) phenotypes in Arabidopsis thaliana may be caused by emb 71 [45]. For Arabidopsis seeds with silique defects, hypocotyl elongation was characterized during the development of F2 generation mutant seedlings [46]. We proposed that the mutant phenotype is determined by mutations in BraA07001774. To validate our prediction, BraA07001774 expression in pylm and ‘CK-51’ was analyzed by qRT-PCR. BraA07001774 was dramatically downregulated in pylm (Fig. 10). Thus, it probably is the candidate gene for py2.
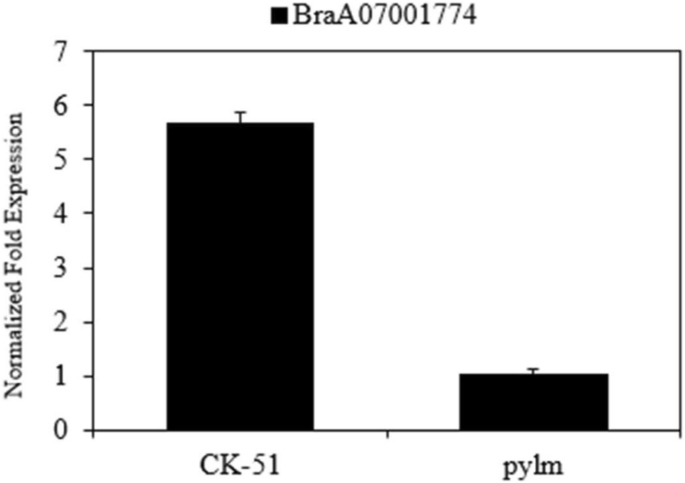
Expression analysis of BraA07001774 in pylm and ‘CK-51’ by qRT-PCR. Error bars indicate standard errors of the means of three replicates
Discussion
Mutations in leaf color are widespread in nature. The main type of leaf color mutation is Chl deficiency. Dwarfism, retarded growth, attenuated photosynthetic capacity, low yield, and death are associated with this defect [25, 47, 48]. Here, we identified the pakchoi yellow leaf mutant pylm from isolated microspore culture. Unlike previously reported Chl deficient mutants, pylm presented with substantially elongated hypocotyls at the seedling stage and early flowering at the bolting stage. The etiolation phenotype in pylm was nonlethal and stable throughout the growth period. The Chl deficiency in pylm was controlled by two recessive genes. These characteristics suggested that pylm was of high value for research in revealing the Chl biosynthesis mechanism regulated by gene interactions.
Map-based cloning is an effective gene isolation strategy. It has been extensively used for plant gene function analysis [49,50,51]. However, it is contingent upon fine mapping of the target gene. For most leaf color mutants, the traits are recessively inherited and controlled by a single nuclear gene. The F2 populations are instinctively applied to map the target gene [5, 41, 48]. With regard to the character conferred by two recessive nuclear genes, F2 populations may also be used in preliminary mapping. An efficient way to isolate allele pairs from each other and separately map them is to construct advanced backcrosses and other populations. The recessive white stem (ws) loci in Nicotiana tabacum and the Chl deficiency (Bnchd1) loci in Brassica napus were successfully mapped using constructed BC1F2 and BC3F1 populations, respectively [18, 25]. In the present study, genetic analysis revealed that the recessive nuclear genes designated as py1 and py2 were responsible for the etiolation trait. We successfully segregated py1 from py2 and constructed an inheritance model for the Chl deficiency trait in pakchoi. Twenty F3:4 families with a phenotypic segregation ratio of 3:1 were constructed. Various F3:4 families were successfully used to map the py1 and py2 loci separately. Compared to using advanced backcross populations to map pairs of recessive nuclear genes, creating and using F2:3 or F3:4 families avoid the selection errors and interference in genetic analysis caused by the incomplete emasculation of Brassica rapa.
BSR-Seq efficiently combines the respective superiorities of bulk segregation analysis (BSA) and RNA sequencing (RNA-Seq) for rapid gene mapping [52,53,54,55]. BSR-Seq is targeted at the mRNA level. It selects phenotypically opposite individuals from segregated populations and constructs two RNA mixing pools to find SNPs at the transcript level. The transcriptome data localize the target genes and detect potentially associated DEGs [56]. BSR-Seq has been extensively applied to map the causal genes linked to a single target trait [24, 57, 58]. Two independently inherited traits may also be localized by BSR-Seq. Tan et al. applied BSR-Seq to locate the genes controlling male sterility on chromosome A05 and white petal on chromosome A02 [59]. Here, the mutant pylm and Chinese cabbage DH ‘FT’ lines were chosen as parents to construct the F2 separation population. The phenotypes of the wild type and mutant individuals significantly differed. Thus, extreme mixed pools could be accurately and conveniently created for BSR-Seq. Release of Brassica rapa genomic data enhanced the reliability of these populations in BSR-Seq applications. Five candidate regions related to the yellow leaf phenotype in pylm were identified on chromosomes A07 and A09. Molecular markers were developed according to the locations of the candidate regions. The etiolation genes py1 and py2 were separately mapped with different F3:4 families. The findings confirmed the feasibility of BSR-Seq for mapping two recessive nuclear genes. They also showed that BSR-Seq simplifies molecular marker development and screening in traditional mapping methods and greatly improves their efficiency.
New molecular markers were developed near the target regions based on preliminary py1 mapping by BSR-Seq. The py1 was mapped between the markers Indelzk125 and SSRzk36 on A09 chromosome over a 258.3-kb localization interval containing 34 predicted genes. No new polymorphic SSR or Indel markers were available to limit the localization interval. The gene expression patterns determined by BSR-Seq disclosed only one differentially expressed gene (BraA09004189) within the py1 mapping region. A gene annotation referenced from the Brassica database indicated that BraA09004189 encodes heme oxygenase-1 (HO1). This enzyme plays a vital role in phytochrome chromophore metabolism, the photoresponse mechanism, adventitious root formation, and oxidative damage mitigation [60,61,62,63]. HO1 stabilizes and maintains the heme content by transforming heme into BV-IXα [64]. As embranchments of tetrapyrrole biosynthesis, Chl and heme biosynthesis share a common metabolic pathway from ALA to Proto IX. Excessive heme accumulation caused by abnormal heme metabolism leads to feedback inhibition of Chl biosynthesis [36]. Therefore, a decrease in HO1 activity may influence Chl biosynthesis. The hy1 mutant of Arabidopsis and the yellow-green leaf 2 mutant of rice presented with the reduced-Chl phenotype because of free heme inhibition resulting from HO1 mutations [40, 60]. HO1 defects strongly affected thylakoid development in rice [41]. Davis et al. found that the abnormally elongated hypocotyl phenotype of mutant Arabidopsis seedlings may be associated with HO1 defects [60]. Thus, py1 may encode HO and a mutation thereof may influence Chl biosynthesis and leaf color. In this study, qRT-PCR demonstrated that BraA09004189 was downregulated in pylm. This finding was consistent with those obtained by BSR-Seq. The SNP BraA09004189 was detected between pylm and ‘CK-51’. A candidate gene-specific SNP marker in 1520 F3:4 yellow-colored individuals co-segregated with py1. Thus, BraA09004189 corresponds to the yellow leaf locus py1 in pylm.
It was already known that certain Chl deficiency traits are controlled by two recessive nuclear genes. However, there was a lack of appropriate mapping populations or reliable molecule markers. Therefore, they were either approximately mapped without definite locations [18, 26] or only one of the pair could be localized [25]. In previous studies, little progress was made in the simultaneous fine mapping or accurate prediction of the candidate genes. Here, we used the same mapping strategy as that for py1 to accomplish fine mapping for py2. The linkage analysis disclosed that py2 was mapped between SSR11 and SSR15 on chromosome A07. The mapping interval was narrowed to 4.4 kb by the SNP11 marker linked to py2. Sequence analysis of the five genes in the py2 localization interval showed that only BraA07001774 expression significantly differed between pylm and ‘CK-51’. For pylm, BraA07001774 had a SNP missense mutation on the first exon such that the wild type had an Asp residue whereas pylm had an Asn. The qRT-PCR revealed that BraA07001774 was downregulated in the mutant relative to the wild type. Gene annotation in the Brassica database indicated that BraA09004189 encodes emb 1187 and a phosphotransferase. In Arabidopsis, the emb genes are essential for seed development [65]. EMB genes encode various proteins. Thirty percent of them are active in the plastids [66]. Most emb mutations result in albinism or etiolated seeds and embryos which are secondary effects of mutations in chloroplast biogenesis and function [67]. The albino mutants (pds1, pds2) and hypocotyl elongation phenotypes in Arabidopsis may be related to mutations in EMB genes [45, 46]. Thus, BraA07001774 is a candidate gene for py2.
Conclusions
We reported the identification of a Chl deficiency mutant pylm in pakchoi in this study. The etiolation trait was controlled by two recessive nuclear genes py1 and py2. We successfully segregated py1 from py2 by constructing F3:4 families and achieved fine mapping and predictions for the two etiolation genes. Candidate genes regulating etiolation were identified as BraA09004189 and BraA07001774, respectively. These discoveries may help elucidate the molecular mechanisms underlying the trait controlled by two recessive nuclear genes. In future studies, functional validation will be conducted to clarify the functions of these candidate genes. In this manner, the molecular mechanism of gene interactions may be better understood.
Methods
Plant materials and mapping population development
The DH line pylm was obtained by isolated microspore culture of the ‘Huaguan’ pakchoi variety introduced from Japan musashino seed company. This strain was characterized by yellow leaves and elongated hypocotyls [44]. The parent used for the segregating population development with pylm in this study was ‘FT’, a DH line derived from Chinese cabbage variety ‘Fukuda 50’ screened by Shenyang greenstar Chinese cabbage research institute (Shenyang, China), which exhibits folded green leaves [68]. The pylm was reciprocally crossed with ‘FT’ to produce the F1, F2, and BC1 generations. Twenty F2 individuals with green leaves were self-pollinated to produce F2:3 progenies. Eight green F2:3 individuals per group were randomly selected from the corresponding populations and self-pollinated to produce the F3:4 populations. Those with character segregation were used in linkage analysis and gene mapping. All plants were grown in the greenhouse at Shenyang Agricultural University, China.
Detection of variations by BSR-Seq
One hundred individuals with extreme leaf color phenotype at three-leaf stage were separately collected from the F2 progeny and pooled for RNA extraction. Total RNA of each sample was extracted using TRIzol Reagent (Invitrogen, USA). The RNA concentration and integrity were analyzed with an Agilent 2100 Bioanalyzer (Agilent Technologies, USA). The extreme mixed pools green-leaf (G-pool) and yellow-leaf (Y-pool) were constructed by mixing equal amounts of each RNA sample. RNA-Seq library preparations were constructed according to the manufacturer’s protocol (NEBNext® Ultra™ RNA Library Prep Kit for Illumina®). Sequencing was run on an Illumina HiSeq 2500 by GENEWIZ Suzhou Biological Technology Co., Ltd., China.
The quality of the raw RNA-Seq reads was assessed with FastQC (v. 0.10.1). Adapter sequences and low-quality reads containing N and < 70 were deleted from the raw reads with Cutadapt (v. 1.9.1). Low-quality bases at the 5′ or 3′ end were filtered out. Those with mean quality < 20 were trimmed by the 4-bp sliding window method. Clean data were aligned to the Brassica database (http://brassicadb.org/brad/) with Hisat v. 2.0.14 [69]. Candidate single nucleotide polymorphisms (SNPs) between the pools were obtained with the Mpileup module in SAM Tools (v. 0.1.18) SNP loci with depth coverage > 3× were screened for differential SNP analysis in the mutant and wild type pools. Euclidean distances (ED) for the differential SNP loci were calculated. The ED for each differential SNP locus was raised to the power five, namely, ED5, to eliminate background noise [70]. All ED5 were sorted and the differential SNP loci with ED5 in the top 1% were screened and mapped to specific chromosome regions based on the SNP locus distributions. Chromosome regions associated with the target traits were predicted according to the distributions of the ED5 for the differential SNP loci on the chromosomes.
Differential gene expression analysis
To detect differentially expressed genes (DEGs) between the pools, a gene expression level analysis was performed with Htseq (v. 0.6.1). The reads per kilobases per million mapped reads (RPKM) were calculated [71]. DEGs were screened using a preset threshold (|log2 fold change| ≥ 1 and false discovery rate (FDR) ≤ 0.05).
DNA isolation, polymerase chain reaction (PCR), and linkage analysis
A modified cetyltrimethylammonium bromide (CTAB) method [72] was used to extract genomic DNA from young leaves of the parental and F3:4 populations with a phenotypic segregation ratio of 3:1. The primers for polymorphism analysis were designed in Primer Premier (v. 5.0). PCR amplifications were performed following the instruction as described by Wang et al. [24]. PCR products were separated on 5% (w/v) denaturing polyacrylamide gels and examined by silver staining. The genetic linkage map was constructed by Join Map v. 4.0 [73] using the segregation data. Map distances were calculated and reported in centimorgans (cM) according to Kosambi’s mapping function [74].
Candidate gene prediction and quantitative real-time PCR (qRT-PCR) validation
Using the chromosome location of the target gene, all adjacent genes were annotated with the Brassica database (http://brassicadb.org/brad/). Candidate genes were predicted according to gene annotation. PCR primers were designed to span the entire putative gene length between the mutant pylm and wild type ‘CK-51’. The control line ‘CK-51’, with a green leaf phenotype, was obtained in the same manner as the pylm mutant during the same period [44]. Candidate genes were cloned following the method referenced from Huang et al. [75]. Sequences were determined by GENEWIZ Biological Technology Co. Ltd. (Suzhou, China) and aligned with DNAMAN software.
Leaves of pylm and ‘CK-51’ were collected for total RNA extraction as previously described. After confirming its concentration and integrity, the RNA was reverse-transcribed with a FastQuant RT Kit (Tiangen, China). qRT-PCR was performed with a Bio-Rad IQ5 Real-Time PCR System (Bio-Rad Laboratories, USA) and SYBR Green PCR Master Mix (Tiangen, China). All reactions were run on three biological replicates. Two independent technical replicates per sample were processed to confirm data accuracy. Primers for the candidate genes BraA09004189 (F: 5′-GCTTCCACTTCGCTTTTTCCT-3′; R: 5′-TCTTTTTCTGCTTCTCTGATGCTG-3′) and BraA07001774 (F: 5′-GGATACGACTGTGATTACACCTTCTAC-3′; R: 5′-CCGACTCCACTTCACCAACG-3′) were used in the qRT-PCR analysis. The Actin gene (F: 5′-CGAAACAACTTACAACTCCA-3′; R: 5′-CTCTTTGCTCATACGGTCA-3′) served as an endogenous control. The qRT-PCR reaction conditions and program were those cited in Huang et al. [76]. The relative expression level was calculated by the 2−ΔΔCt method [77]. Bio-Rad IQ5 (Bio-Rad Laboratories, USA) analyzed the data.
Availability of data and materials
The datasets analysed during the current study are available in the Brassica database (http://brassicadb.org/brad/). All data used and/or analyzed are available upon request.
Abbreviations
- ‘FT’:
-
Fukuda 50
- ALA:
-
5-Aminolevulinic acid
- BSA:
-
Bulk segregation analysis
- BSR-Seq:
-
Bulked segregant RNA sequencing
- Chl:
-
Chlorophyll
- cM:
-
Centimorgans
- CTAB:
-
Cetyltrimethylammonium bromide
- DEGs:
-
Differentially expressed genes
- DH:
-
Double haploid
- ED:
-
Euclidean distances
- emb :
-
embryo defective
- FDR:
-
False discovery rate
- HO1:
-
Heme oxygenase-1
- NADPH:
-
Nicotinamide adenine dinucleotide phosphate
- PCR:
-
Polymerase chain reaction
- Proto IX:
-
Protoporphyrin IX
- pylm :
-
Pakchoi (Brassica rapa L. ssp. chinensis) yellow leaf mutant
- qRT-PCR:
-
quantitative real-time PCR
- RNA-Seq:
-
RNA sequencing
- RPKM:
-
Reads per kilobases per million mapped reads
- SNP:
-
Single-nucleotide polymorphism
References
Fromme P, Melkozernov A, Jordan P, Krauss N. Structure and function of photosystem I: interaction with its soluble electron carriers and external antenna systems. FEBS Lett 2003;555(1):0–44.
Kurata N, Miyoshi K, Nonomura KI, Yamazaki Y, Ito Y. Rice mutants and genes related to organ development, morphogenesis and physiological traits. Plant Cell Physiol. 2005;46(1):48–62.
Schultes NP, Sawers RJH, Brutnell TP, Krueger RW. Maize high chlorophyll fluorescent 60 mutation is caused by an Ac disruption of the gene encoding the chloroplast ribosomal small subunit protein 17. Plant J. 2000;21(4):317–27.
Motohashi K, Koyama F, Nakanishi Y, Ueoka-Nakanishi H, Hisabori T. Chloroplast Cyclophilin is a target protein of thioredoxin THIOL MODULATION OF THE PEPTIDYL-PROLYL CIS-TRANS ISOMERASE ACTIVITY. J Biol Chem. 2003;278(34):31848–52.
Song M, Wei Q, Wang J, Fu W, Qin X, Lu X, Cheng F, Yang K, Zhang L, Yu X, Li J, Chen J, Lou Q. Fine mapping of CsVYL, conferring virescent leaf through the regulation of chloroplast development in cucumber. Front Plant Sci. 2018;9:432–43.
Stern DB, Hanson MR, Barkan A. Genetics and genomics of chloroplast biogenesis: maize as a model system. Trends Plant Sci. 2004;9(6):293–301.
Kusaba M, Ito H, Morita R, Iida S, Sato Y, Fujimoto M, Kawasaki S, Tanaka R, Hirochika H, Nishimura M, Tanaka A. Rice NON-YELLOW COLORING1 is involved in light-harvesting complex II and grana degradation during leaf senescence. Plant Cell. 2007;19(4):1362–75.
Bang WY, Jeong IS, Kim DW, Im CH, Ji C, Hwang SM, Kim SW, Son YS, Jeong J, Shiina T, Bahk JD. Role of Arabidopsis CHL27 protein for photosynthesis, chloroplast development and gene expression profiling. Plant Cell Physiol. 2008;49(9):1350–63.
Chen P, Hu H, Zhang Y, Wang Z, Dong G, Cui Y, Qian Q, Ren D, Guo LB. Genetic analysis and fine-mapping of a new rice mutant, white and lesion mimic leaf1. Plant Growth Regul. 2018;85(3):425–35.
Jarvis P. Dörmannn Peter, Peto CA, lutes J, Benning C, Chory J. Galactolipid deficiency and abnormal chloroplast development in the Arabidopsis MGD synthase 1 mutant. Proc Natl Acad Sci. 2000;97(14):8175–9.
Zhang H, Li J, Yoo JH, Yoo SC, Cho SH, Koh HJ, Seo HS, Paek NC. Rice Chlorina-1 and Chlorina-9 encode ChlD and ChlI subunits of mg-chelatase, a key enzyme for chlorophyll synthesis and chloroplast development. Plant Mol Biol. 2006;62(3):325–37.
Moon S, Giglione C, Lee DY, An S, Jeong DH, Meinnel T, An G. Rice peptide deformylase PDF1B is crucial for development of chloroplasts. Plant Cell Physiol. 2008;49(10):1536–46.
Hui Z, Tian FX, Wang GK, Wang GP, Wang W. The antioxidative defense system is involved in the delayed senescence in a wheat mutant tasg1. Plant Cell Rep. 2012;31(6):1073–84.
Zhu L, Zeng X, Chen Y, Yang Z, Qi L, Pu Y, Yi B, Wen J, Ma C, Shen J, Tu J, Fu T. Genetic characterisation and fine mapping of a chlorophyll-deficient mutant (BnaC.ygl) in Brassica napus. Mol Breed. 2014;34(2):603–14.
Liu XP, Yang C, Han FQ, Fang ZY, Yang LM, Zhuang M, Lv HH, Liu YM, Li ZS, Zhang YY. Genetics and fine mapping of a yellow-green leaf gene (ygl-1) in cabbage (Brassica oleracea var. capitata L.). Mol Breed. 2016;36(6):82–9.
Mueller AH, Dockter C, Gough SP, Lundqvist U, von Wettstein D, Hansson M. Characterization of mutations in barley fch2 encoding chlorophyllide a oxygenase. Plant Cell Physiol. 2012;53:1232–46.
Zhou S, Hu Z, Zhu M, Zhang B, Deng L, Pan Y, Chen G. Biochemical and molecular analysis of a temperature-sensitive albino mutant in kale named “white dove”. Plant Growth Regul. 2013;71(3):281–94.
Wu Q, Wu X, Zhang X, Jiang C, Xiao B, Zhang Y, Wang Y, Liu G. Mapping of two white stem genes in tetraploid common tobacco (Nicotiana tabacum L.). Mol Breed. 2014;34(3):1065–74.
Fang C, Li C, Li W, Wang Z, Zhou Z, Shen Y, Wu M, Wu Y, Li G, Kong LA, Liu C, Jackson SA, Tian Z. Concerted evolution of D1 and D2 to regulate chlorophyll degradation in soybean. Plant J. 2014;77(5):700–12.
Song M, Yang Z, Fan S, Zhu H, Pang C, Tian M, Yu S. Cytological and genetic analysis of a virescent mutant in upland cotton (Gossypium hirsutum L.). Euphytica. 2012;187(2):235–45.
Gao M, Hu L, Li Y, Weng Y. The chlorophyll-deficient golden leaf mutation in cucumber is due to a single nucleotide substitution in CsChlI for magnesium chelatase I subunit. Theor Appl Genet. 2016;129(10):1961–73.
Wang P, Gao J, Wan C, Zhang F, Xu Z, Huang X, Sun X, Deng X. Divinyl chlorophyll (ide) a can be converted to monovinyl chlorophyll (ide) a by a divinyl reductase in rice. Plant Physiol. 2010;153(3):994–1003.
Ansari MJ, Al-Ghamdi A, Kumar R, Usmani S, AL-Attal Y, Nuru A, Mohamed AA, Singh K, Dhaliwal HS. Characterization and gene mapping of a chlorophyll-deficient mutant clm1 of Triticum monococcum L. Biol Plant. 2012;57(3):442–8.
Wang N, Liu Z, Zhang Y, Li C, Feng H. Identification and fine mapping of a stay-green gene (Brnye1) in pakchoi (Brassica campestris L. ssp. chinensis). Theor Appl Genet. 2018;131(3):673–84.
Zhao H, Yu L, Huai Z, Wang X, Ding G, Chen S, Li P, Xu F. Mapping and candidate gene identification defining BnChd1-1, a locus involved in chlorophyll biosynthesis in Brassica napus. Acta Physiol Plant. 2014;36(4):859–70.
Li N, Jia J, Xia C, Liu X, Kong X. Characterization and mapping of novel chlorophyll deficient mutant genes in durum wheat. Breed Sci. 2013;63(2):169–75.
Tian Y, Huang Q, Liu H, Wang J, An R, Liu X, Hu W. Inheritance of chlorophyll-deficient mutant L638-y in Brassica juncea L. and molecular markers for chlorophyll-deficient gene gr1. J Northwest Agric Forest Univ (Nat Sci Ed). 2012;40(12):90–6 (in Chinese).
Barak S, Heimer Y, Nejidat A, Volkita M. The peroxisomal glycolate oxidase gene is differentially expressed in yellow and white sectors of the DP1 variegated tobacco mutant. Physiol Plant. 2000;110(1):120–6.
Colombo N, Emanuel C, Lainez V, Maldonado S, Prina AR, Börner T. The barley plastome mutant CL2 affects expression of nuclear and chloroplast housekeeping genes in a cell-age dependent manner. Mol Gen Genomics. 2008;279(4):403–14.
Tang X, Wang Y, Zhang Y, Huang S, Liu Z, Fei D, Feng H. A missense mutation of plastid RPS4 is associated with chlorophyll deficiency in Chinese cabbage (Brassica campestris ssp. pekinensis). BMC Plant Biol. 2018;18(1):130–40.
Nagata N, Tanaka R, Satoh S, Tanaka A. Identification of a vinyl reductase gene for chlorophyll synthesis in Arabidopsis thaliana and implications for the evolution of Prochlorococcus species. Plant Cell. 2005;17(1):233–40.
Frick G, Su Q, Apel K, Armstrong GA. An Arabidopsis porB porC double mutant lacking light-dependent NADPH: protochlorophyllide oxidoreductases B and C is highly chlorophyll-deficient and developmentally arrested. Plant J. 2003;35(2):141–53.
Sheng Z, Lv Y, Li W, Luo R, Wei X, Xie L, Jiao G, Shao G, Wang J, Tang S, Hu P. Yellow-Leaf 1 encodes a magnesium-protoporphyrin IX monomethyl ester cyclase, involved in chlorophyll biosynthesis in rice (Oryza sativa L.). PLoS ONE. 2017;12(5):e0177989.
Yoo SC, Cho SH, Zhang H, Paik HC, Lee CH, Li J, Yoo JH, Lee BW, Koh HJ, Seo HS, Paek NC. Quantitative trait loci associated with functional stay green SNU-SG1 in rice. Mol Cells. 2007;24(1):83–94.
Morita R, Sato Y, Masuda Y, Nishimura M, Kusaba M. Defect in non-yellow coloring 3, an alpha/beta hydrolase-fold family protein, causes a stay green phenotype during leaf senescence in rice. Plant J. 2009;59(6):940–52.
Weller JL, Terry MJ, Rameau C, Reid JB, Kendrick RE. The phytochrome-deficient pcd1 mutant of pea is unable to convert heme to biliverdin IXα. Plant Cell. 1996;8(1):55–67.
Terry MJ, Kendrick RE. Feedback inhibition of chlorophyll synthesis in the phytochrome chromophore-deficient aurea and yellow-green-2 mutants of tomato. Plant Physiol. 1999;119(1):143–52.
Xie YJ, Xu DK, Cui WT, Shen WB. Mutation of Arabidopsis HY1 causes UV-C hypersensitivity by impairing carotenoid and flavonoid biosynthesis and the down-regulation of antioxidant defence. J Exp Bot. 2012;63(10):3869–83.
Xu S, Wang L, Zhang B, Han B, Xie Y, Yang J, Zhong W, Chen H, Wang R, Wang N, Cui W, Shen W. RNAi knockdown of rice SE5 gene is sensitive to the herbicide methyl viologen by the down-regulation of antioxidant defense. Plant Mol Biol. 2012;80(2):219–35.
Chen H, Cheng Z, Ma X, Wu H, Liu Y, Zhou K, Chen Y, Ma W, Bi J, Zhang X, Guo X, Wang J, Lei C, Wu F, Lin Q, Liu Y, Liu L, Jiang L. A knockdown mutation of YELLOW-GREEN LEAF2 blocks chlorophyll biosynthesis in rice. Plant Cell Rep. 2013;32(12):1855–67.
Li Q, Zhu FY, Gao X, Sun Y, Li S, Tao Y, Lo C, Liu H. Young leaf chlorosis 2, encodes the stroma-localized heme oxygenase 2 which is required for normal tetrapyrrole biosynthesis in rice. Planta. 2014;240(4):701–12.
Linley PJ, Landsberger M, Kohchi T, Cooper JB, Terry MJ. The molecular basis of heme oxygenase deficiency in the pcd1mutant of pea. FEBS J. 2006;273(12):2594–606.
Shi D, Zheng X, Li L, Lin W, Xie W, Yang J, Chen S, Jin W. Chlorophyll deficiency in the maize elongated mesocotyl2 mutant is caused by a defective heme oxygenase and delaying grana stacking. PLoS One. 2013;8(11):e80107.
Zhang K, Liu Z, Shan X, Li C, Tang X, Chi M, Feng H. Physiological properties and chlorophyll biosynthesis in a Pak-choi (Brassica rapa, L. ssp. chinensis) yellow leaf mutant, pylm. Acta Physiol Plant. 2017;39(1):22–32.
Franzmann LH, Yoon ES, Meinke DW. Saturating the genetic map of Arabidopsis thaliana with embryonic mutations. Plant J. 1995;7(2):341–50.
Patton DA, Franzmann LH, Meinke DW. Mapping genes essential for embryo development in Arabidopsis thaliana. Mol Gen Genet. 1991;227(3):337–47.
Jung KH, Hur J, Ryu CH, Choi Y, Chung YY, Miyao A, Hirochika H, An G. Characterization of a rice chlorophyll-deficient mutant using the T-DNA gene-trap system. Plant Cell Physiol. 2003;44(5):463–72.
Wu Z, Zhang X, He B, Diao L, Sheng S, Wang J, Guo X, Su N, Wang L, Jiang L, Wang C, Zhai H, Wan J. A chlorophyll-deficient rice mutant with impaired chlorophyllide esterification in chlorophyll biosynthesis. Plant Physiol. 2007;145(1):29–40.
Jander G, Norris SR, Rounsley SD, Bush DF, Levin IM, Last RL. Arabidopsis map-based cloning in the post-genome era. Plant Physiol. 2002;129(2):440–50.
Sang XC, Fang LK, Vanichpakorn Y, Ling YH, Du P, Zhao FM, Yang ZL, He GH. Physiological character and molecular mapping of leaf-color mutant wyv1 in rice (Oryza sativa L.). Genes Genomics. 2010;32(2):123–8.
Xie K, Wu S, Li Z, Zhou Y, Zhang D, Dong Z, An X, Zhu T, Zhang S, Liu S, Li J, Wan X. Map-based cloning and characterization of Zea mays male sterility33 (ZmMs33) gene, encoding a glycerol-3-phosphate acyltransferase. Theor Appl Genet. 2018;131(6):1363–78.
Trick M, Adamski NM, Mugford SG, Jiang CC, Febrer M, Uauy C. Combining SNP discovery from next-generation sequencing data with bulked segregant analysis (BSA) to fine-map genes in polyploid wheat. BMC Plant Biol. 2012;12(1):14–30.
Lee YP, Cho Y, Kim S. A high-resolution linkage map of the Rfd1, a restorer-of-fertility locus for cytoplasmic male sterility in radish (Raphanus sativus L.) produced by a combination of bulked segregant analysis and RNA-Seq. Theor Appl Genet. 2014;127(10):2243–52.
Lu H, Lin T, Klein J, Wang S, Qi J, Zhou Q, Sun J, Zhang Z, Weng Y, Huang S. QTL-seq identifies an early flowering QTL located near Flowering Locus T in cucumber. Theor Appl Genet. 2014;127(7):1491–9.
Ramirez-Gonzalez RH, Segovia V, Bird N, Fenwick P, Holdgate S, Berry S, Jack P, Caccamo M, Uauy C. RNA-seq bulked segregant analysis enables the identification of high-resolution genetic markers for breeding in hexaploid wheat. Plant Biotechnol J. 2015;13(5):613–24.
Schneeberger K, Weigel D. Fast-forward genetics enabled by new sequencing technologies. Trends in Plant Sci. 2011;16(5):282–8.
Nestler J, Liu S, Wen TJ, Paschold A, Marcon C, Tang HM, Li D, Li L, Meeley RB, Sakai H, Bruce W, Schnable PS, Hochholdinger F. Roothairless5, which functions in maize (Zea mays L.) root hair initiation and elongation encodes a monocot-specific NADPH oxidase. Plant J. 2014;79(5):729–40.
Tang HM, Liu S, Hill-Skinner S, Wu W, Reed D, Yeh CT, Nettleton D, Schnable PS. The maize brown midrib2 (bm2) gene encodes a methylenetetrahydrofolate reductase that contributes to lignin accumulation. Plant J. 2014;77(3):380–92.
Tan C, Liu Z, Huang S, Feng H. Mapping of the male sterile mutant gene ftms in Brassica rapa L. ssp. pekinensis via BSR-Seq combined with whole-genome resequencing. Theor Appl Genet. 2019;132(2):355–70.
Davis SJ, Kurepa J, Vierstra RD. The Arabidopsis thaliana HY1 locus, required for phytochrome-chromophore biosynthesis, encodes a protein related to heme oxygenases. Proc Natl Acad Sci. 1999;96(11):6541–6.
Ortiz de Montellano PR, Wilks A. Heme oxygenase structure and mechanism. Adv Inorg Chem. 2000;51(1):359–407.
Quail P. Phytochrome photosensory signalling networks. Nat Rev Mol Cell Biol. 2002;3(2):85–93.
Emborg TJ, Walker JM, Noh B, Vierstra RD. Multiple heme oxygenase family members contribute to the biosynthesis of the phytochrome chromophore in Arabidopsis. Plant Physiol. 2006;140(3):856–68.
Terry MJ, Maines MD, Lagarias JC. Inactivation of phytochrome- and phycobiliprotein-chromophore precursors by rat liver biliverdin reductase. J Biol Chem. 1993;268(35):26099–106.
Despres B, Delseny M, Devic M. Partial complementation of embryo defective mutations: a general strategy to elucidate gene function. Plant J. 2001;27(2):149–59.
Shen Y, Li C, McCarty DR, Meeley R, Tan BC. Embryo defective12 encodes the plastid initiation factor 3 and is essential for embryogenesis in maize. Plant J. 2013;74(5):792–804.
Li Z, Thomas LT. PEI1, an embryo-specific zinc finger protein gene required for heart-stage embryo formation in Arabidopsis. Plant Cell. 1998;10(3):383–98.
Huang S, Liu Z, Li D, Yao R, Meng Q, Feng H. Screening of Chinese cabbage mutant produced by 60Co-ray mutagenesis of isolated microspore cultures. Plant Breed. 2014;133:480–8.
Kim D, Langmead B, Salzberg SL. HISAT: a fast spliced aligner with low memory requirements. Nat Methods. 2015;12(4):357–62.
Su A, Song W, Xing J, Zhao Y, Zhang R, Li C, Duan M, Luo M, Shi Z, Zhao J. Identification of genes potentially associated with the fertility instability of s-type cytoplasmic male sterility in maize via bulked segregant RNA-Seq. PLoS One. 2016;11(9):e0163489.
Mortazavi A, Williams BA, McCue K, Schaeffer L, Wold B. Mapping and quantifying mammalian transcriptomes by RNA-Seq. Nat Methods. 2008;5(7):621–8.
Murray MG, Thompson WF. Rapid isolation of high molecular weight plant DNA. Nucleic Acids Res. 1980;8(19):4321–6.
Van Ooijen J. Joinmap 4.0 software for the calculation of genetic linkage maps in experimental populations. Wageningen: Kyazma BV; 2006.
Kosambi DD. The estimation of map distance from recombination values. Ann Eugenics. 1944;12(1):172–5.
Huang S, Liu Z, Yao R, Li D, Zhang T, Li X, Hou L, Wang Y, Tang X, Feng H. Candidate gene prediction for a petal degeneration mutant, pdm, of the Chinese cabbage (Brassica campestris, ssp. pekinensis) by using fine mapping and transcriptome analysis. Mol Breed. 2016;36(3):26–35.
Huang S, Liu Z, Yao R, Li D, Feng H. Comparative transcriptome analysis of the petal degeneration mutant pdm in Chinese cabbage (Brassica campestris ssp.pekinensis) using RNA-Seq. Mol Gen Genomics. 2015;290(5):1833–47.
Livak KJ, Schmittgen TD. Analysis of relative gene expression data using real-time quantitative PCR and the 2−ΔΔCt method. Methods. 2001;25(4):402–8.
Acknowledgements
The authors thank Editage for English language editing and GENEWIZ for sequencing.
Funding
This study was funded by grants from the National Natural Science Foundation of China (No. 31672144). The funding played roles in the design of the study and collection, analysis, and interpretation of data.
Author information
Authors and Affiliations
Contributions
KZ and FH conceived the study and designed the experiments. KZ, YM, XS and NW conducted the experiments and collected the data. KZ and WL analyzed the data and drafted the manuscript. All authors read and approved the final manuscript.
Authors’ information
KZ, lecturer, College of Life Sciences, Shanxi Datong University, Datong City, Shanxi Province, People’s Republic of China. YM and NW are postgraduates from College of Horticulture, Shenyang Agricultural University, Shenyang City, Liaoning Province, People’s Republic of China. WL, lecturer, Institute of Carbon Materials Science, Shanxi Datong University, Datong City, Shanxi Province, People’s Republic of China. XS, laboratory technician, College of Life Sciences, Shanxi Datong University, Datong City, Shanxi Province, People’s Republic of China. HF, professor, College of Horticulture, Shenyang Agricultural University, Shenyang City, Liaoning Province, People’s Republic of China.
Corresponding author
Ethics declarations
Ethics approval and consent to participate
Not applicable.
Consent for publication
Not applicable.
Competing interests
The authors declare that they have no competing interests.
Additional information
Publisher’s Note
Springer Nature remains neutral with regard to jurisdictional claims in published maps and institutional affiliations.
Supplementary information
Additional file 1: Figure S1.
Phenotypes of the pylm mutant in pakchoi (left) and the DH line ‘FT’ in Chinese cabbage (right). Scale bar: 40 mm
Additional file 2: Figure S2.
DEGs between the G-pool and the Y-pool (|log2 fold change| ≥ 1 and FDR ≤ 0.05)
Additional file 3: Table S1.
Phenotypic segregation ratios of the F2:3 populations and their F2 genotypes from the cross ‘FT’ × pylm. Table S2. Phenotypic segregation ratios of the F3:4 populations and their F2:3 genotypes from the cross ‘FT’ × pylm. Table S3. RPKM interval distribution of the 55,250 genes identified in the G-pool and Y-pool via BSR-Seq. Table S4. Gene identification and expression data for the DEGs in the Y-pool vs. the G-pool. Table S5. Primer sequences for the SSR and Indel markers tightly linked with py1. Table S6. Prediction of candidate genes within the gene-mapped region on chromosome A09. Table S7. Sequences of the primers used to clone the full-length and CDS sequences of BraA09004189. Table S8. Primer sequences of the SSR markers tightly linked with py2. Table S9. Prediction of candidate genes within the gene-mapped region on chromosome A07. Table S10. Sequences of the primers used to cloning the full-length sequences of the candidate genes for py2
Rights and permissions
Open Access This article is distributed under the terms of the Creative Commons Attribution 4.0 International License (http://creativecommons.org/licenses/by/4.0/), which permits unrestricted use, distribution, and reproduction in any medium, provided you give appropriate credit to the original author(s) and the source, provide a link to the Creative Commons license, and indicate if changes were made. The Creative Commons Public Domain Dedication waiver (http://creativecommons.org/publicdomain/zero/1.0/) applies to the data made available in this article, unless otherwise stated.
About this article

Cite this article
Zhang, K., Mu, Y., Li, W. et al. Identification of two recessive etiolation genes (py1, py2) in pakchoi (Brassica rapa L. ssp. chinensis). BMC Plant Biol 20, 68 (2020). https://doi.org/10.1186/s12870-020-2271-3
Received:
Accepted:
Published:
DOI: https://doi.org/10.1186/s12870-020-2271-3