
Abstract
New tramway technologies such as “ground-level power supply systems” fit with the purpose of preserving historical heritage and urban environments of city centers. Such public transportation systems do not require a traditional air supply system (+ 750 V) and are therefore referred to as “catenary-free systems” (i.e., APS system, tramwave system, Primove system). Their implementation is becoming increasingly widespread, especially for cities with prestigious historical heritage, where high levels of environmental sustainability, capacity, reliability and safety standards are required. The study compares some of the most well-known and novel catenary-free systems for the creation of a 68-km tramway system, to be implemented in a metropolitan city. For each of the 7 new tramways, AIMSUN microsimulations were run to identify the most appropriate tramway track geometry and road section to minimize the interference with the vehicle activity. Moreover, for each system a financial and economic performance analysis has been carried out for an investment of about 869 million euros, while taking into account different scenarios of transportation demand. In addition, a cost–benefit analysis of the tramway lines investment project has been presented, including the calculation of the financial net present value, the economic net present value, rate of return of the investment and cost–benefit ratio. The analysis demonstrates that the APS ground-level power supply system is a proven alternative with greater economic and financial performance.
1 Introduction
In Europe, the transportation demand in urban and extra-urban areas (where 80% of the gross domestic product “GDP” is generated) keeps on growing. In these areas, population accounts for 75% of the total population [1,2,3]. In Europe, each person undertakes approximately 2.7 journeys per day, mainly using private vehicles (49% of total journeys) [1,2,3]. Therefore, it is unequivocal that traffic should arise with an associated 80 million euros per year in social costs [4]. In the urban area, a 23% of carbon dioxide (CO2) is generated by the transportation sector registering a total of 37% fatal road accidents (25,300 deaths in 2017; 14% of people killed on EU roads are aged between 18 and 24) [5]. In the year 2017, 21% of all people killed on roads were pedestrians, 25% two wheelers (14% were motorcyclists, 8% cyclists and 3% mopeds riders) [5].
Due to such concerning figures, many more cities are investing in tramway systems for mass transportation. These are considered eco-sustainable, reliable, fast and able to satisfy high levels of mobility demand (even higher than 6000 passengers/h per direction) [6]. Everyday trams or LRT are operated across 11 African cities, 62 Asian cities, 279 European and Russian cities, 51 North American cities, 10 South American cities, 4 Oceania cities [7, 8]. New technologies such as ground-level power supply (GLPS) (i.e., Alstom APS “Alimentation Par le Sol,” Ansaldo Tramwave) and those which are still under development, such as “induction systems” (i.e., Bombardier Primove), are greatly compatible with the city centers. In fact, these systems are not equipped with catenary devices and their fittings [9]. For such reason, the increasing presence of tramway lines in historical city centers is self-explanatory. However, traditional tramway lines require high levels of public investment. The average cost of the infrastructure comes up to 20.0–23.5 M€/km [6, 10] (20 M€/km in Africa, 22.5 M€/km in Europe, 23.5 M€/km in North America). The cost of each tram vehicle is 2.5–3.5 M€. Higher costs are required for “catenary-free systems.”
In order to carry out an evaluation of the financial and economic sustainability of the investment for a given project, a cost–benefit analysis is mandatory [11, 12]. Such analysis becomes essential for the comparison between the new tramway line and the system in place, generally the bus [13]. The study concerns the extension of the tramway line system of the city of Palermo with 7 new lines of about 68 kilometers, and it showcases some of the main results collected through the maintenance of cost–benefit analysis for the tramway lines project. It includes the calculation of the financial net present value (FNPV), the economic net present value (ENPV), rate of return of the investment and cost–benefit ratio. The paper is of significant interest as 3 out of the 7 lines run on GPLS.
2 Classification and Reliability of Catenary-Free Tramway Systems
Modern tramway lines are a type of mass public transportation system for urban and extra-urban areas. Commercial speed at which trains are operated is 12–30 km/h, holding a capacity exceeding 6,000 passengers/h per direction. These may be classified as follows [6]:
-
“Common corridor” (class E): railway vehicles are mixed with road vehicles and pedestrians;
-
“Exclusive separated corridor” (class D): grooved rails are also used, but they are separated from the general traffic by means of horizontal lining or obstacles accessible to pedestrians;
-
“Exclusive tram corridor” (class C): the existing road is used solely for the movement of the tram, while the remaining road width is pedestrianized;
-
“Exclusive protected corridor” (class B): the tramway is completely separated from the circulation of road vehicles and pedestrians;
-
“Fully exclusive corridor” (class A): tramway vehicles move as in the previous case (class B) on flat bottom rails, at grade, or underground, or elevated section
The main characteristics are given in Table 1 according to the type of system.
Currently, there are also the following new “catenary-free” technologies [6].
-
Ground-level power supply (GLPS)—power continuously supplied to the vehicle at ground level via direct contact with a conductor inductively. The most used system is Alstom APS (Fig. 1a), which may be found operating in the cities of Bordeaux, Angers, Reims, Orléans, Tours (France), Dubai (The United Arab Emirates), Rio de Janeiro (Brazil), Cuenca (Ecuador), Lusail (Qatar), Sydney (Australia);
-
Onboard energy storage system (OESS)—power stored on the vehicle, using flywheels, batteries (Ni-MH; Li ion, etc.), supercapacitors or a combination thereof, recharged periodically via regenerative braking and contact with a power conductor. The autonomy of each vehicle is of about 600 m. The stops need to be equipped with recharging systems (catenary area length of about 90 m; cfr. Tramway of Nanjing, China [14]).
Nowadays, induction systems are under development (i.e., Bombardier Primove, Fig. 1b) which operate via the physical principle called electromagnetic induction.
-
Onboard power generation system (OPGS)—power continuously generated on the vehicle as required via hydrogen fuel cells, microturbines or diesel engines.
Fig. 1 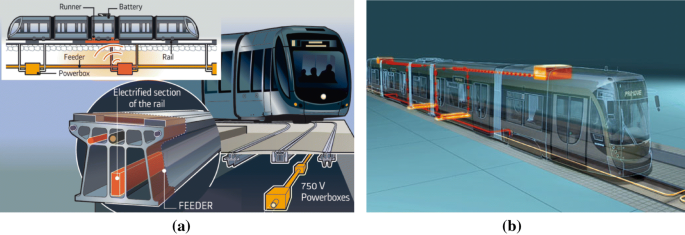
Catenary-free systems: (a) APS Alstom (source: www.alstom.com); (b) Primove Bombardier—wireless (source: www.bombardier.com)

Tables 2, 3 and 4 summarize the names of cities using the abovementioned systems and their main operational and constructional characteristics [9].
The OESS, compared to GLPS, present the following limitations:
-
The vehicles must be recharged at every stop. These require a catenary area length of at least 90 m [14]. This way there is a limited use of tramway line without catenary areas, spaced out by catenary lines with supercapacitors charged at stops;
-
Recharging times last up to 45 s, therefore longer than the average passenger access/exit time (generally between 10 and 30 s). The total idle time required for recharging may impact significantly average commercial speed;
-
There are high costs per tram (about €3,600,000), and service life of a battery supercapacitors pack (around €600,000) is 2,000,000 charge/discharge cycles. Therefore, all batteries need to be substituted on average every 10 years, thus resulting in extremely high maintenance costs;
-
Tram performance (autonomy, acceleration and power) decreases once heating and air-conditioning are on. Thus, the chance to exceed uphill slopes greater than 4% is limited.
However, it is indubitable that this type of OESS systems will be in the future ever more efficient and competitive (Fig. 2).

Efficiency and performance of the tramway systems over time (qualitative evolution)
One of the main parameters characterizing the functionality of the tramway systems is their reliability. In compliance with [15,16,17], the parameters affecting the travel time reliability at tramway systems may be investigated as follows:
-
Failure ratio and reliability improvement (Ri):
in which SD is the service delivery = actual tram trips completed/scheduled tram trips; NbTs is the number of trip scheduled; NbTd(i) is the number of trip with a fixed valued of the delay (< 5 min; < 15 min; < 30 min; ≥ 30 min).
The characteristics values are: R1 for a delay below 5 min; R2 for a delay below 15 min; R3 for a delay below 30 min; and R4 for a delay upper than 30 min.
-
Total vehicle punctuality for all delays (VPtotal):
in which NbTd is the number of trip. (Round trip is considered.)
Generally, reliability should be greater than 95–98%. This value is guaranteed by modern GLPS. This has been confirmed by a recent experiment conducted in 2016 on new tramway lines in Dubai [18], equipped with GLPS APS by Alstom and light rail vehicles called Citadis X05 with “ADAS” system (advanced driver assistance system), manufactured by Alstom. (Three configurations of Citadis X05 are available including Citadis 205, Citadis 305 and Citadis 405.) The research produced the following data: SD > 99.3%, VP > 99.6%; Ri < 0.26% (see Table 5).
3 Tramway Lines and Passengers in Italy
The tramway traffic demand had been declining up until the beginning of the 1970s (Fig. 3) to then be incentivized once again from 2000 to present days [19,20,21]. Urban traffic has shifted from 1.053 million passengers per km in 2005 to 1.305 million passengers per km in 2015 [21]. Extra-urban traffic has increased from 50 million passengers per km in 2005 to 85 million passengers per km in 2015. In 2005, the tramway network (extra-urban) reached 457 km, while in 2015 it was 516 km long [22]. The tramway system is very safe: in 2016, only 46 lone vehicle accidents (including 41 collisions with pedestrians) and 116 collisions with other vehicles [20]. Regardless of such positive data, in urban areas the use of private over public means of transportation prevails. In fact, in 2015, the repartition of urban traffic was [20]: 4.5% motorcycles, 83.8% private cars, 11.7% public means of transportation.

Tramway lines and passenger expansion in Italy
4 Feasibility of Catenary-Free Tramway Lines: A Case Study in Italy
The city of Palermo (Italy) covers a territory of 158.88 km2 with a population of 666,992 inhabitants. Apart from the capital, the metropolitan area includes 26 towns, with a total population of 1 million inhabitants. Private vehicles on the urban roads exceed 550,000 per day. On a total of 292,916 daily journeys, 284,409 are made within the city.
The most commonly used mean of transportation for study or work is private cars, both as a driver (32.4%) and as a passenger (15.8%). Motorbikes follow (including scooters and mopeds) at a rate of 13%. In total, 10.7% of journeys are made by bus, 0.9% by company buses or school buses and 0.9% by train or metro. Only 0.6% of journeys are made by bike and 25.6% on foot. The public transportation system running at present (bus) covers around 340 km and 90 lines. The average frequency is of 22’.
The following traditional catenary tramway lines have been running since 2015 (Fig. 4):

Future tramway network in Palermo (overlap between current and new lines)
-
Line 1 “Roccella”: about 5.5 km long, with double tracks;
-
Line 2 “Borgonuovo–Notarbartolo”: 4.8 km, with double tracks;
-
Line 3 “C.E.P.–Notarbartolo”: 5 km, with double tracks;
-
Line 4 “Notarbartolo–Calatafimi–Notarbartolo”: 8 km with single track.
The municipality intends to extend the tramway system with seven new lines called “A, B, C, D, E, F, G” (Fig. 4), with a total of more than 68 km. The main operational and constructional characteristics of each route are shown in Table 6.
Table 6 also indicates the frequency and potential capacity of the transport system, calculated as homotatic circulation and per tram with a capacity P = 250 passengers (seated and standing). In such instance, it equals C = (3600/ΔT)·P, in which ΔT is the mean headway between the vehicles.
The tramway lines will be built using a catenary-free system to better respect the city center and its historical heritage (Lines A, B and C) (sees Fig. 5).

Line A (“Via Libertà” segment). Current road section (a) and new proposed road section (b)
The extra-urban lines (D, E, F and G) instead are traditional, with catenary, just like the ones running currently (lines 1, 2, 3 and 4).
The road section for each tramway line has been designed to suit a number of aspects, such as a number of road intersections, existence of pavements, reserved lanes and section width.
For the double-track sections (Table 6), three possible configurations of road sections: Tyep A, Type B and Type C (shown in Fig. 6), have been analyzed.

Road section and railway track layouts (dimension expressed in meter)
The identification of the best configuration was assessed with the help of a microsimulation model [23]. The vehicles mean speed and emissions have been estimated in function of traffic flow demand and network geometry.
An example is the 700-m segment “Line A” in Via Roma (the name of the high street connecting the city center). It was modeled in the AIMSUN 8.0.8 microsimulation environment replicating the three different layouts shown in Fig. 6.
Traffic flow is intense along “Line A.” Just in 2013, in the corresponding Section 3 depicted in Fig. 7, traffic flow was recorded as 1840 veh/h in the 9:00–10:00 time frame [24].

For the analysis, 7 origin–destination (OD) test matrices have been taken into account for the 9:00–10:00 time frame.
The origin–destination test matrices are calculated out of the OD Matrix shown in Table 7 and adjusted according to the parameter γ (OD Matrix 1 for γ = 1; OD Matrix 2 for γ = 1.5; OD Matrix 3 for γ = 2.0; OD Matrix 4 for γ = 2.50; OD Matrix 5 for γ = 3.00; OD Matrix 6 for γ = 3.50; OD Matrix 7 for γ = 4.00).
It is worth pointing out that the most of the cells in the test OD matrices are equal to zero because, for hypothesis, the only origin of the total traffic flow is the centroid 3566 (first centroid in Fig. 7). This hypothesis allows the identification of the best road and railway track layout, considering the most severe conflict conditions between tram vehicles and private vehicles.
As γ changes the traffic demand, in correspondence with Sect. 3 shown in Fig. 7, varies from a minimum of 1700 veh/h (OD Matrix 1) to a maximum of 2300 veh/h (OD Matrix 4). The test matrices allow taking into account future increases in vehicle traffic flows, even unrealistic traffic demand levels.
The analysis accounted for a frequency of passage of 1 tram every 6 min (see Table 6). The vehicle arrival distribution is uniform, due to the type of implemented system VP > 99.6% (cfr. Table 5).
A stop of 35 m per direction is provided, with a mean stop time tm = 25 s and average squared deviation σt = 3 s. The length of each stop is compatible with the dimension of the tram Citadis X05 (2.40 m × 3.30 m × 32.2 m, with a capacity of 273 passengers) chosen in the project and also with tram Bombardier Primove.
All intersections have stop signs, with the exception of the intersection in Via V. Emanuele that is a signalized intersection. The purpose of having traffic lights is to provide priority of passage to trams [25, 26]. According to [27] the microsimulation analysis requires 5 steps: (1) project scope; (2) package selection; (3) data assembly and input; (4) verification and calibration; and (5) alternatives analysis and conclusions, whereas other authors claim there should be 7 steps [28]. For the study, a canonic calibration of the traffic model was not feasible. This is because the double tracks of the tram will modify substantially the current flow regime, interfering with the lateral turns of cars.
To carry out the model calibration many values of psychotechnical parameters of drivers of the private vehicles and vehicles kinematic parameters (i.e., accelerations and maximum speed of cars and tram) have been assigned in order to obtain, as an output, a mean commercial speed of tram equals to 13.5 km/h. This is because 13.5 km/h is the mean speed recorded for the Italian tramways with similar characteristics to those of the present study [29]. This value is greater than the mean commercial speed of buses in service in Palermo and equals to about 11 km/h during daytime (08:00–20:00) [24].
The best geometrical scheme found, in terms of passenger cars’ mean speed Vm and emissions, is Type A, whereas the worst is Type B (Fig. 6).
This occurs for all the control sections (Sections. 1, 2 and 3, cfr. Fig. 7).
The differences in speed tend to be increasingly more accentuated as traffic flow increases (shown in Figs. 8, 9, 10, 11), with a deviation even greater than 15 km/h (shown in Fig. 11).

Passenger cars’ mean speed—OD Matrix 1 (γ = 1)

Passenger cars’ mean speed—OD Matrix 2 (γ = 2)

Passenger cars’ mean speed—OD Matrix 3 (γ = 3)

Passenger cars’ mean speed—OD Matrix 4 (γ = 4)
Along with the rising of transport demand (from OD Matrix 1 to OD matrix 4) car emissions intensify. Such increase is greater for Type C and especially Type B, compared to Type A, which results to be more sustainable layout. The carbon dioxide (CO2) and nitrogen oxides (NOx) emission graphs (shown in Fig.12) show such consequences. These results depend only on road geometry and therefore, not on the type of technology used for the tramway (Alstom, Bombardier, etc.).

5 Economic and Financial Analysis of the Tramway Lines Investment Project with Catenary-Free System
The economic and financial analysis was limited to the two different types of catenary-free systems: the APS of Alstom and the Bombardier Primove induction system. In this section, the methodology used is described and the resulting detailed data obtained for the APS system of Alstom were compared with the Bombardier Primove system. The project of the tramway system was compared with the current transport scenario (“Scenario TP 0” with buses in service and existing lines 1, 2, 3 and 4 of the tram and with urban railway). The effects coming from the construction and functioning have been calculated separately:
-
for the central lines A, B and C (“Scenario TP 1,” see Table 8),
-
for all Lines A, B, C, D, E, F, G (“Scenario TP 2” see Table 8).
Costs and benefits of the project were evaluated on an incremental basis (or decremental) and were compared to the counterfactual (“Scenario TP 0”).
The time frame for the analysis is 30 years.
The analysis was conducted in compliance with the European guidelines [30], by taking into account (marginal) unit costs of greenhouse gas emissions, noise pollution, road safety (accidents), etc., gather from the technical scientific report [31]. It is interesting to note that the public transport operator of the city (“AMAT S.p.A.”) has provided public transportation services for the city of Palermo to 72,500,000 passengers/year in 2016, with revenues [32] of:
-
€ 6,529,946 for the sales of tickets;
-
€ 2,345,052 for ordinary season tickets.
Total revenues were € 8,874,998. The ratio α between sales and demand of traffic actually served, i.e., unit revenue, is α = 8,878,998/72,500,000 ≈ 0.12 €/passenger.
The transportation analysis [33,34,35] has demonstrated that the realization of new tramway lines will result in an increase in demand for public transport. The increase is of 41,035,000 users/year (+ 56.60% compared to counterfactual values). More specifically, the increase in traffic demand following the realization of new tramway lines compared to the counterfactual scenario “Scenario TP 0” of the local public transport service were estimated and the results are shown in Table 9. It could be seen from Table 9 that:
-
relevant increases in transport demand for Line C (15.80%), Line D (16.50%) and Line E (19.40%), i.e., the peripheral lines currently operating and covered by an inefficient bus service;
-
no increases for the Line A (0%) and Line B (0%). This is due to the presence of an efficient transport bus service (with a frequency of 1 bus every 3’).
Table 9 Increase in traffic demand following the realization of new tramway lines compared to the counterfactual scenario “Scenario TP 0” of the local public transport service
Such increases in demand will result in greater annual revenues, estimated according to rate α. This rate cannot be calculated deterministically and could vary during the useful lifetime of the new transport system. Therefore, in accordance with the transportation analysis [33,34,35] three distinct scenarios were considered in the research, according to hypothetical future citizens’ consumption trends of public transport services and the regular payment of the service:
-
Scenario 1—unrealistic: α is the same as that of the counterfactual scenario α0:
α = α0 = 8,874,998.00/72,500,000 ≈ 0.12 €/passenger per year;
-
Scenario 2—very realistic: α increases by 30% compared to the counterfactual scenario:
α = (1+30%) × α0 = (1+30%) × 0.12 ≈ 0.16 €/passenger per year;
-
Scenario 3—less realistic: α increases by 60% compared to the counterfactual scenario:
α = (1+60%) × α0 = (1+60%) × 0.12 ≈ 0.20 €/passenger per year.
Finally, an actualized residual value (VR) of the infrastructure was considered that equals to 30% of the initial value (VI) of the infrastructure [36] : VR = 0.3 × VI. No residual value was considered for tram vehicles (Primove Bombardier for the induction system and Citadis X05 equipped with “ADAS” system—based on image analysis and algorithms for the detection [37]—for the APS Alstom system).
5.1 Financial Analysis
The objective of the financial analysis is to estimate returns on investment. The profitability of the project is positive when actualized, and cumulative revenues are sufficient to cover the costs of the initial investment (construction of the infrastructure and purchase of trams).
Financial profitability of major projects for the construction of transport facilities (i.e., those more than 50 million euros) results to be most often negative due to the fact that revenues—except for rare cases (e.g., tolls on motorways)—insufficient to cover investment and operational costs.
In the financial analysis, the point of view of the private investor is taken into account (i.e., private company). Therefore, the financial analysis reports the items providing greater revenues and costs that the project generates compared to the counterfactual scenario (Scenario TP 0).
Costs and revenues were actualized by using a 4% financial discount rate [30].
The inflows include: sources of financing; operating revenues from the provision of goods and services; and transfer, subsidies and other financial gains not stemming from charges paid by users for the use of the infrastructure.
The outflows include: initial investment; replacement costs; operating costs; reimbursement of loans and interest payments; taxes on capital/income; and other direct taxes.
Having calculated individual costs and revenue items the financial net present value (FNPV) of the transport system may be estimated and calculated for a period of 30 financial years [30]:
As FBt and FCt are the financial benefits and costs, respectively (including start-up investment costs for the construction of the facility), which occur at time t; it = financial discount rate (considered as constant it = 4%). Benefits and costs were estimated in compliance with microeconomic analysis principles [30].
Costs of investment are:
-
For central lines A, B and C = € 348,351,508;
-
For peripheral lines D, E, F, G = € 520,473,596;
-
For all Lines A, B, C, D, E, F, G = € 868,825,103.
The basic hypothesis is that it will take 5 years for the realization of Lines A, B, C and management/service expenses and revenues from sales of tickets and season tickets will occur by the end of the fifth year. Instead, the construction of Lines D, E, F, G will occur after Lines A, B, C are completed, therefore from the sixth year onward, compared to the counterfactual scenario. The construction of Lines D, E, F, G will take another 5 years.
The results from the financial analysis are shown in Table 10 for the central lines A + B + C and in Table 11 for all lines. It may be noted that the financial net present value (FNPV) is negative in all scenarios TP2 and for α = 0.16 the FNPV is equal to = −526 million of euros.
Figure 13 shows the annual cash flow trend calculated for the APS Alstom system (Lines A + B + C + D + E + F + G). These are always negative, considering that incremental benefits (revenue) are lower than incremental costs. The trend seems to be improving from year 10 onward (compared to the counterfactual scenario); however, a positive cash flow will never occur (thus the pay back period > 30 years).

Variations of cash flow (cost increase–revenue increase) over the years for all new tramway lines (APS Alstom)
The graph in Fig. 14 demonstrates the annual cash flow for the APS Alstom system by hypothesizing the realization of only Lines A + B + C.

Variations of cash flow (cost increase–revenue increase) over the years for tramway Lines A, B and C (APS Alstom)
In conclusion, FNPV remains negative; thus, the estimated revenue is not sufficient to cover costs.
Figure 15 reports the results obtained out of the sensitivity analysis of the financial net present value (FNPV) with a financial discount rate (i) for the APS Alstom system. It is evident that the curve in “Scenario TP 1” has a lower mean slope to that of “Scenario TP 2.” Therefore, financial results in “Scenario TP 1” result “more robust” [30], impacting less possible future variation of the financial discount rate.

Variations of the FNPV with financial discount rate (APS Alstom)
5.2 Economic Analysis
The economic analysis measures the social value of the project of the new tramway lines. In this analysis, much relevance is given to citizens who, even if non users of the transportation system, will be burdened by certain indirect costs and benefits generated by the tramway lines.
According to the economic analysis, an investment in transport infrastructure may be positively evaluated (i.e., it is advantageous for society) if the resulting benefits exceed its costs (opportunity costs). Even in the economic analysis, costs are recorded after tax. However, instead of market prices, these have to be converted in constant accounting (shadow) prices. This may be done by using respective conversion factors [30, 31, 36].
The economic performance of the project may be calculated upon deviation of two main indicators:
-
The economic net present value (ENPV):
Equation (4) is practically the same as Eq. (3). However, in Eq. (4) EBt and ECt are economic benefits and costs, respectively (including start-up costs for the construction of the transport system), occurring at time t; it = social discount rate (considered as constant it = 3%).
The period forecasted for the analysis is of 30 financial years, more than those required for the construction of the new lines (5 years for Lines A + B + C and 5 years for Lines D + E + F + G).
The economic benefits and costs are related to the project scenario of new tramway lines compared to the counterfactual scenario (“Scenario TP 0,” see Table 8), calculated in compliance with the microeconomic analysis principles, considering that the infrastructure is for the urban area [30].
-
The economic internal rate of return (EIRR) is equal to the value of the social discount rate which is calculated as ENPV = 0.
The approval of the project has to satisfy the condition: ENPV > 0, ratio benefits–costs > 1 and EIRR > social discount rate.
Other cost items were recorded in the economic analysis [30, 31]: costs of scarce infrastructure (road congestion and scarcity costs); accident costs; air pollution costs and human health; air pollution and building/material damages; air pollution and nature; noise; nature and landscape.
ENPV is calculated for both systems (APS Alstom and Bombardier Primove), and the scenarios indicating the increase in demand for transport are reported in Tables 12 and 13.
Between the two systems the most economically advantageous is APS Alstom. More specifically, with α equals to 0.16 €/passenger per year the following results are obtained:
-
(a)
Economic net present value:
• For Lines A + B + C: ENPV = € 32,707,003 > 0
• For Lines A + B + C + D + E + F + G: ENPV = € 272,506,515 > 0
-
(b)
Economic internal return rate:
• For Lines A + B + C: EIRR = 4.10% > 3%
• For Lines A + B + C + D + E + F + G: EIRR = 6.6% > 3%
-
(c)
Actualized benefits/costs ratio:
• For Lines A + B + C: B/C = 1.05 > 1
• For Lines A + B + C + D + E + F + G: B/C = 1.15 > 1
In conclusion, the project is sustainable in economic terms considering that ENPV > 0 and EIRR > 3% (social discount rate used as a base rate for analysis purposes), in both the hypotheses (“Scenario TP 1” Lines A + B + C and “Scenario TP 2” Lines A + B + C + D + E + F + G).
In conclusion, a sensitivity analysis was carried out of the ENPV according to the discount rate (i) (Fig. 16).

Variations of the ENPV with social discount rate (APS Alstom)
In financial terms, “Scenario TP 2” has a worse FNPV compared with “Scenario TP 1” (Tables 10 and 11). Instead, in economic terms “Scenario TP 2” provides much greater benefits compared with “Scenario TP 1.” This occurs because social benefits in the case that all tramways lines should be realized (A, B, C, D, E, F and G); these would be extended to the entire city. Therefore, economic benefits should be much greater than those perceived by the areas (more limited) covered by only A, B and C lines.
6 Conclusions
The paper has compared some types of catenary-free tramway systems, more specifically ground-level powered supply systems “GLPS” (i.e., APS Alstom) and induction (Bombardier Primove).
Catenary-free systems are ever more used especially in historical city center with medium–high traffic demand levels. The area requires mass public transportation services with high capacity, reliability, security levels and low environmental impact. Research is based on a feasibility study of 7 new tramway lines (about 68 km) projected for the city of Palermo; these are subdivided as follows:
-
Three lines along the city center (Lines A, B, C) built with catenary-free system;
-
Four peripheral lines (Lines D, E, F, G) with traditional tram and aerial catenary system.
For each new tramway line the geometrical layout for the road section which determines the best operating conditions (in terms of passenger cars’ mean speed Vm) and lower pollutant emissions has been detected.
For a road segment of 700 m of Via Roma (Line A), with catenary-free system, 3 different layouts were examined (Type A, Type B and Type C) and 7 test origin–destination matrices (OD matrices) for the time frame 9:00–10:00. A number of traffic microsimulations in AIMSUN 8.0.8 were carried out to conclude that the best road geometry is Type A (tramway lines have lateral and symmetric tracks), while the worst is Type B. Type A reaches a higher passenger cars’ mean speed Vm with lower emissions (CO2 and NOx).
This occurs for all of the 3 prefixed sections of the road segment taken into account (Sects. 1, 2 and 3). Differences in Vm between Type A and Type B tend to be incrementally more marked according to the increasing traffic flow, with deviations being greater than 15 km/h. These results are independent from the type of catenary-free system APS Alstom and Bombardier Primove.
Instead, to identify the best catenary-free system, economic and financial analysis was required in the useful lifetime of the new public transportation system (conventionally fixed at 30 financial years); this is due to the high investment levels (about 869 million of euros).
Three different scenarios according to the increase in traffic demand and number of passenger payers were considered:
-
Scenario 1—unrealistic: α = 0.12 €/passengers per year;
-
Scenario 2—very realistic: α = 0.16 €/passengers per year;
-
Scenario 3—less realistic α = 0.20 €/passengers per year.
In addition, three different scenarios were evaluated in terms of tramway network:
-
Scenario TP 0: no new tramway lines (A, B, C, D, E, F, G);
-
Scenario TP 1: realization of central lines (A, B and C);
-
Scenario TP 2: realization of all the tramway lines (A, B, C, D, E, F, G).
The methodology used for the study follows the “Cost–Benefit Analysis of Investment Projects Guidelines” for the year 2014 issued by the European Commission.
The financial net present value (FNPV) of Scenario TP2 compared to the counterfactual scenario (Scenario TP 0) is negative in all cases considered, and the tramway system most financially convenient is the APS Alstom (as α = 0.16 the FNPV ≈ −526 million of euros).
Sensitivity analyses demonstrate that the investment for the construction of only the central lines (A, B, C—“Scenario TP 1”) is more reliable. It is less impacted by future variations of the financial discount rate compared with “Scenario TP 2” (construction of all the 7 lines).
In all the scenarios, the economic net present value (ENPV) associated with the APS Alstom is greater than the ENPV of the Bombardier Primove system. Therefore, between the two systems the most economically advantageous is APS Alstom.
In conclusion, even if FNPV < 0, the project should be approved because of ENPV > 0. In other terms, the public project should be realized considering that it will provide social benefits, especially if all 7 lines should be realized (Scenario TP2).
Between the two catenary-free systems, for the case study, the APS Alstom system is desirable. In fact, the latter reports greater ENPV values compared with the Bombardier Primove system.
Results of the study demonstrate, once again, that the investments required for the public transport system are generally unsustainable in financial terms, but sustainable economically.
Therefore, if FNPV < 0 but ENPV > 0 (as demonstrated by the case study) such project should be realized. Obviously, this requires ongoing annual grants (state, regional, etc.) which are essential to managing public transport services, having often a negative cash flow (as demonstrated by the case study).
It is worth pointing out that the suggested methodology is “general” and can be applied to other types of tramway systems as well as to other cities or regions.
References
White Paper on transport, European Commission (2011)
EMTA (2009) Barometer of public transport in European metropolitan areas. Availalble: https://www.emta.com
Ortego A, Valero A, Abadías A (2017) Environmental impacts of promoting new public transport systems in urban mobility: a case study. J Sustain Dev Energy Water Environ Syst 5(3):377–395
Together towards competitive and resource-efficient urban mobility, European Commission (2013)
MEMO/18/2762 (2017) Road safety statistics: what is behind the figures? European Commission—fact sheet
Vuchic VR (2017) Urban transit systems and technology. Wiley, Hoboken
List of Tram systems (2019) https://en.wikipedia.org/wiki/List_of_tram_and_light_rail_transit_systems
Alpkokin P, Kiremitci ST, Black JA, Cetinavci S (2016) LRT and street tram policies and implementation in turkish cities. J Transp Geogr 54(1):476–487
Swanson J, Smatlak J (2015) State-of-the-art in light rail alternative power supplies. In: APTA/TRB 2015, light rail conference
Guerrieri M (2017) Infrastrutture ferroviarie, metropolitane, tranviarie e per ferrovie speciali. Maggioli Editore
Prud’homme R, Koning M, Kopp P (2011) Substituting a tramway to a bus line in Paris: costs and benefits. Transp Policy 18:563–572
Penyalver D, Turró M, Williamson JB (2019) Measuring the value for money of transport infrastructure procurement; an intergenerational approach. Transp Res Part A 119:238–254
Dubéa J, Legrosb D, Devaux N (2018) From bus to tramway: is there an economic impact of substituting a rapid mass transit system? An empirical investigation accounting for anticipation effect. Transp Res Part A 110:73–87
Becker F (2016) Catenary free operation of light rail vehicles—topology and operational concept. In: 18th European conference on power electronics and applications (EPE’16 ECCE Europe)
EN 50126-1:2017, Railway Applications (2017) The specification and demonstration of reliability, availability, maintainability and safety (RAMS). Generic RAMS process, 06 Dec 2017
Guidelines to Understanding Reliability Prediction (2005) EPSMA, European Power Supply Manufacturers Association
Tzanakakis K (2017) The railway track and its long term behaviour. Springer
FDR-System (2017) Final demonstration report—system. Dubai Tram, ELS10-00-D900-SYS-000-00872-B
Chen CL (2018) Tram development and urban transport integration in Chinese cities: a case study of Suzhou. Econ Transp 15:16–31
CNIT (2016) Ministero delle Infrastrutture e dei Trasporti, Conto Nazionale delle Infrastrutture e dei Trasporti Anni 2015–2016. Istituto Poligrafico e Zecca dello Stato S.p.A, Roma
Guerrieri M (2018) Tramways in urban areas: an overview on safety at road intersections. Urban Rail Transit 4(4):223–233
Italian Road accidents year 2017 (2017) ISTAT, Istituto Nazionale di Statistica
Fernández R (2010) Modelling public transport stops by microscopic simulation. Transp Res Part C Emerg Technol 18(6):856–868
Transportation Plan for the city of Palermo (2013) www.comune.palermo.it/
Sermpis D, Papadakos P, Fousekis K (2012) Tram priority at signalcontrolled junctions. Proc Inst Civ Eng Transp 165(2):87–96
Ter Zhao X, Li Y, Xu S, Zhai H (2018) Modeling a modern tram system integrated with a road traffic simulation. Simulation 94(1):77–90
Elefteriadou L (2014) An introduction to traffic flow theory. Springer
Dowling R, Skabardonis A, Alexiadis V (2004) Traffic analysis toolbox volume III: guidelines for applying traffic microsimulation software. Report FHWA-HRT-04-040, Federal Highway Administration, Washington, DC
Asperti G (2010) Trasporto pubblico locale: efficienza e qualità in Lombardia. MCE. http://www.mobilityconference.it/archivio/2010/allegati/Asperti.pdf
Guide to Cost-Benefit Analysis of Investment Projects (2014) European commission
Ricardo—AEA DG Move (2014) Update of the handbook on external costs of transport
AMAT Transportation Service, Balance (2016) http://amat.pa.it/
Cascetta E (2009) Transportation systems analysis. Springer
Ortuzar JDS, Willumsen LG (2011) Modelling transport. Wiley
D’Orso G, Migliore M (2017) A GIS-based methodology to estimate the potential demand of an integrated transport system. Lect Notes Comput Sci 10407:525–540
Prassas ES, Roess RP (2013) Engineering economic and finance for transportation infrastructure. Springer
Guerrieri M, Parla G, Corriere F (2013) A new methodology to estimate deformation of longitudinal safety barriers. ARPN J Eng Appl Sci 8(9):763–769
Open Access
This article is distributed under the terms of the Creative Commons Attribution 4.0 International License (http://creativecommons.org/licenses/by/4.0/), which permits unrestricted use, distribution, and reproduction in any medium, provided you give appropriate credit to the original author(s) and the source, provide a link to the Creative Commons license, and indicate if changes were made.
Author information
Authors and Affiliations
Corresponding author
Additional information
Communicated by Guoquan Li.
Rights and permissions
Open Access This article is licensed under a Creative Commons Attribution 4.0 International License, which permits use, sharing, adaptation, distribution and reproduction in any medium or format, as long as you give appropriate credit to the original author(s) and the source, provide a link to the Creative Commons licence, and indicate if changes were made.
The images or other third party material in this article are included in the article’s Creative Commons licence, unless indicated otherwise in a credit line to the material. If material is not included in the article’s Creative Commons licence and your intended use is not permitted by statutory regulation or exceeds the permitted use, you will need to obtain permission directly from the copyright holder.
To view a copy of this licence, visit https://creativecommons.org/licenses/by/4.0/.
About this article

Cite this article
Guerrieri, M. Catenary-Free Tramway Systems: Functional and Cost–Benefit Analysis for a Metropolitan Area. Urban Rail Transit 5, 289–309 (2019). https://doi.org/10.1007/s40864-019-00118-y
Received:
Revised:
Accepted:
Published:
Issue Date:
DOI: https://doi.org/10.1007/s40864-019-00118-y