
Abstract
To study borehole deformation under non-uniform horizontal principal stress in the deep strata, a prediction method for horizontal principal stress was developed based on the morphological parameters of boreholes, the deformation trajectory equation for the standard circular borehole was derived based on elasticity theory, and the morphological characteristics of boreholes were analyzed. Additionally, a quantitative relationship between the geometric parameters of elliptical boreholes and horizontal principal stress was established. Subsequently, uniaxial tests on borehole deformation were conducted to verify elliptical deformation under non-uniform horizontal principal stress. A combined deductive, experimental, and numerical simulation approach to borehole deformation analysis was adopted, and the impact factors of borehole deformation were obtained. The results indicated as following: (1) the deformation morphology of borehole under non-uniform horizontal principal stress was elliptical; (2) for the given lithology, the greater the difference in horizontal principal stress, the greater were the ellipticity and elliptical deformation of borehole; (3) for given stress background, rock strength was inversely proportional to ellipticity. Additionally, the smaller the Young’s modulus and compressive strength, the larger was the Poisson’s ratio and the larger was the ellipticity. For example, the ellipticity of mudstone and coal was greater than that of limestone and sandstone; (4) with an increase in load, the displacement of borehole wall exhibited three stages: initial micro-deformation, accelerated deformation, and stable deformation; (5) horizontal principal stress can be calculated by using the morphological parameters (long and short axes) of an elliptical hole. Furthermore, a horizontal principal stress method theory can be developed based on the morphological parameters of boreholes. The results of our study can provide new ideas and methods for the measurement of in situ stress in deep boreholes and a theoretical basis for the development of equipment for measuring elliptical boreholes.
Highlights
-
Deducing the elliptical deformation morphology of borehole under non-uniform horizontal principal stress
-
Establishing quantitative relationship between the geometric parameters of elliptical boreholes and horizontal principal stress
-
Conducting the uniaxial tests and numerical simulation to verify the relation between elliptical deformation of borehole and horizontal principal stress
1 Introduction
Drilling is indispensable for the exploitation of oil gas resources (Guglielmi et al. 2014; Cui et al. 2021; Liu et al. 2019; Fang et al. 2022a, b). When the bit breaks rock, the original mechanical balance system in the deep strata is broken and the borehole is in the complex state with multiple loads, resulting in the redistribution of stress around the borehole, which changes the morphology of borehole and leads to borehole deformation (Oh et al. 2020; Liu et al. 2022; He et al. 2023; Fang et al. 2023). In particular, during gas drilling, the release of stress around the borehole can easily form an elliptical borehole. The resulting elliptical morphology provides abundant in situ stress information (Ghosh et al. 2015; Ziegler et al. 2021; Fang et al. 2022a, b; Liu et al. 2023). However, few theoretical, experimental, or numerical studies have been conducted on the mechanisms and modes of borehole deformation under horizontal principal stress and even fewer studies have been conducted on the quantitative relation between horizontal principal stress and elliptical morphology. This relationship could be used for the calculation of horizontal principal stress, but it has received very little attention.
Extensive tests on the deformation of pre-drilled boreholes under the loading have been conducted. For example, Eyal et al. (2021) investigated borehole breakouts in arkose and granite rocks through trial experiments to assess stability of borehole morphology. Sheosei et al. (1986) analyzed the failure deformation of the boundary of borehole in an experiment to determine the states of in-situ stress and material properties of complex geological formations. Li et al (2018) and Ma (2022) analyzed the mechanical failure and evolution of the rocks as well as impact factors on sand erosion rate around wellbore during the experiment of sand production. Wang et al. (2008) studied the failure modes of borehole bottoms and walls, and established a mechanical model of borehole instability. Bahrehdar et al. (2022) dealt with the numerical analysis of elliptical boreholes under a nonisotropic in situ stress field using the Mogi–Coulomb nonlinear failure criterion. Setiawan et al. (2022) simulated the borehole breakout initiation, progression, and stabilization using semi-analytical method. He et al. (2022) studied the deformation characteristics of a gas extraction borehole under the influence of principal stress, pore pressure, and aperture using numerical simulations. The abovementioned studies have not built the quantitative the relation between deformation of borehole and in-stress.
A borehole deforms to some certain extent under in-situ stress, particularly beyond the specific depth (> 500 m). Several studies have been conducted on borehole deformation under in-situ stress through theoretical deduction. Ge et al. (2011) proposed the relationship between borehole deformation and stress under local stress relief. Hou (2007) deduced the quantitative relationship between the depth and diameter of a relieved core and analyzed the influence of stress concentration caused by an annular relieving groove on the stress distribution of the local borehole wall. Zoback et al. (1985) analyzed the variation characteristics of borehole structures during the entire process of caving and proposed a variation criterion for stress during caving. Kirsch (1898) proposed a solution for rock stress and borehole deformation, which laid the theoretical foundation for an in-situ stress measurement method based on borehole deformation. Jaeger et al. (2009) derived an analytical solution for the borehole wall displacement of circular boreholes under far-field stress. Wang et al. (2008) conducted analysis on borehole deformation under plane and three-dimensional stress states and deduced the calculation formula for borehole wall displacement under two stress states. Brudy et al. (1997) analyzed the relationship between the variations in the diameter and stress of the KTB Borehole and concluded that variations in diameter exhibit certain correlation with crustal stress. Zhang et al. (2010) deduced an analytical solution for the displacement of deep buried circular roadways in transverse isotropic rock masses. These researchers have focused on the relationship between the displacement of borehole wall and stress. But this quantitative relation ignored the geometric morphological parameters of borehole deformation under in-situ stress. Additionally, the in-situ stress could not be computed by these quantitative equations.
In this study, based on elasticity theory, the geometric morphology of circular borehole formed under the action of two-dimensional stress was determined to be elliptical and the relationship between the stress and geometric parameters of the borehole ellipse was established. The deformation, cracking, and displacement of the borehole under uniaxial loading were studied using rock samples with pre-drilled boreholes to determine the relationship between horizontal principal stress and borehole deformation, and to confirm the morphology characteristics of deformation. Finally, numerical simulation of borehole deformation under horizontal principal stress was conducted to confirm the deformation morphology of borehole and the key factors affecting the elliptical deformation of the borehole were determined. This study provides new ideas and methods for solving the problem of in situ stress measurement in deep complex environments.
2 Theoretical analysis of borehole morphology under horizontal principal stress
2.1 Borehole deformation under plane stress
Let the Young’s modulus of an infinite elastic thin plate be E and the Poisson’s ratio be v. A standard circular borehole exists in the thin plate with radius a. At infinity, the plate is subjected to the tensile force in the x direction, which is uniformly distributed and of magnitude P (Fig. 1). A planar polar coordinate system (r, θ) is used to represent any point on the thin plate. The displacement at any point on the plate can be decomposed into the radial displacement s (i.e., increasing direction of r is defined as positive), circumferential displacement g (i.e., increasing direction of θ is defined as positive), and displacement in the thickness direction d. Let the tension be positive and pressure be negative.

Mathematical expressions near a borehole
The stress components are \(\sigma_{r}\), \(\sigma_{\theta }\), \(\tau_{r\theta }\), \(\varepsilon_{r}\), \(\varepsilon_{\theta }\), and \(\gamma_{r\theta }\). If only the effect of tension P at infinity is considered and the physical force is not considered, then the following equations and conditions are valid.
-
(1)
The relationship between displacement and strain is
$$\left. {\begin{array}{*{20}c} {\varepsilon_{r} = \frac{\partial s}{{\partial r}}} \\ {\varepsilon_{\theta } = \frac{s}{r} + \frac{1}{r}\frac{\partial g}{{\partial \theta }}} \\ {\gamma_{r\theta } = \frac{1}{r}\frac{\partial s}{{\partial \theta }} + \frac{\partial s}{{\partial r}} - \frac{s}{r}} \\ \end{array} } \right\}.$$(1) -
(2)
The compatibility equation for deformation is
$$\frac{1}{r}\frac{{\partial \varepsilon_{r} }}{\partial r} - \frac{1}{{r^{2} }}\frac{{\partial^{2} \varepsilon_{r} }}{{\partial \theta^{2} }} - \frac{1}{r}\frac{{\partial^{2} \left( {r\varepsilon_{\theta } } \right)}}{{\partial r^{2} }} + \frac{1}{{r^{2} }}\frac{{\partial^{2} \left( {r\gamma_{r\theta } } \right)}}{\partial r\partial \theta } = 0.$$(2) -
(3)
The relationship between stress and strain is
$$\left. {\begin{array}{*{20}c} {\varepsilon_{r} = \frac{{\sigma_{r} - v\sigma_{\theta } }}{E}} \\ {\varepsilon_{\theta } = \frac{{\sigma_{\theta } - v\sigma_{r} }}{E}} \\ {\gamma_{r\theta } = \frac{{2\left( {1 + v} \right)}}{E}\tau_{r\theta } } \\ \end{array} } \right\}.$$(3) -
(4)
The equilibrium equation is
$$\left. {\begin{array}{*{20}c} {r\frac{{\partial \sigma_{r} }}{\partial r} + \frac{{\partial \tau_{r\theta } }}{\partial \theta } + \sigma_{r} - \sigma_{\theta } = 0} \\ {\frac{{\partial \tau_{r\theta } }}{\partial r} + \frac{1}{r}\frac{{\partial \sigma_{\theta } }}{\partial \theta } + \frac{{2\tau_{r\theta } }}{r} = 0} \\ \end{array} } \right\}.$$(4) -
(5)
The boundary conditions are as follows.
Boundary conditions of stress:
-
(1)
On the borehole wall, if \(r = a, \, \sigma_{r} = 0, \, \tau_{r\theta } = 0\), then the following statements holds.
-
(2)
The stress state is not significantly different from that in a circular plate without borehole at a certain distance from the circular hole.
Boundary conditions of the displacement:
-
(1)
When \(\theta = 0^\circ ,{\text{ g = 0;}}\) then the following statement holds.
-
(2)
\(s\left| {_{{\theta = 0^{ \circ } }} } \right. = s\left| {_{{\theta = 180^{ \circ } }} } \right.\).
A circular ring plate is concentric with the borehole and has radius \({\text{b}} \gg {\text{a}}\), as shown in Fig. 2. According to Saint–Venant’s principle, there is little difference in the stress states between a perforated plate and an unperforated plate subjected to the same tension at infinity. Therefore, at (b, θ) on the plate without borehole, the stress state is expressed as

Infinite plate with a circular borehole and large circular ring plate
Equation (5) also defines the outer boundary condition of the circular ring plate.
According to the boundary conditions in Eqs. (1)–(5), as b increases to infinity, the annular plate becomes an infinitely perforated plate. The stress distribution in the annular plate is equivalent to that in an infinitely perforated plate, which is expressed as
Further, the displacement distribution in an infinite plate with large borehole is obtained as follows:
If \(r = a\), then the displacements of each point on the borehole wall can be obtained as
When the infinite plate is subjected to tension forces \(\sigma_{1}\) and \(\sigma_{2}\) in the directions of x and y simultaneously (i.e., P is equal to \(\sigma_{1}\) and \(\sigma_{2}\)), the radial displacement of the borehole wall can be derived through superposition, as shown in Fig. 3.

Superposition of principal stresses
Assume that s1 is the radial displacement of the thin plate at point B when subjected to pressure only in the x direction and s2 is the radial displacement of the thin plate at point B when subjected to pressure only in the y direction.
According to Eq. (8), we can obtain
where a is the radius of the circle in which point B is located and \(\theta\) denotes the angle between the radial of point B and the positive x and y axes according to the following relationship:
Therefore, substituting Eq. (11) into Eq. (10) yields
Based on the principle of superposition, the radial displacement of the borehole wall under the combined action of the two external forces is equal to the sum of the radial displacements of the borehole wall generated by the separate action of each tension force, which can be written as
Equation (13) expresses the displacement variation of any point in the borehole under stress.
2.2 Theoretical derivation of the morphology of a borehole under horizontal principal stress
Based on the foregoing theoretical analysis, the displacement at any point F on a borehole wall can be expressed by applying Eq. (13). Assume that point F with coordinates (x, y) is deformed to point \({{\varvec{F}}}^{\boldsymbol{^{\prime}}}\), as shown in Fig. 4.

Deformation of any point on a borehole wall
Then, substituting Eq. (13) into Eq. (14) yields Eq. (15) after simplification.
If we assume that
then Eq. (15) can be rewritten as
Finally, based on this deduction, the geometric equation for borehole morphology can be expressed as shown in Eq. (18). This is the standard elliptical equation, which indicates that the characteristics of borehole deformation under the maximum and minimum horizontal principal stresses are elliptical.
3 Experiments on borehole deformation
In this section, based on the influence of the variation in the stress state on the morphology of a borehole, deformation tests on rock samples with pre-drilled boreholes are conducted systematically to determine the morphological characteristics of boreholes under horizontal principal stress. The experiments help clarify the evolution law and testify the elliptic morphology of borehole being acted by the external loading.
3.1 Experimental instruments and rock samples
-
(1)
Rock mechanics testing machine and monitoring equipment for borehole deformation.
The experimental device used to test rock mechanical properties was an RMT-150C mechanics testing machine developed by the Wuhan Institute of Rock and Soil Mechanics of the Chinese Academy of Sciences. This device uses digital control and an electrohydraulic servo with high controllability, easy operation, and a high level of digitization. This device is suitable for mechanical tests of rock and concrete materials and can be used to conduct many types of rock mechanics tests, including uniaxial compression and tensile, triaxial compression, and shear tests. The technical specifications of the device are listed in Table 1.
One can see that the maximum axial load is 1000 kN and the maximum horizontal load is 500 kN, which met the requirements for our tests. The greatest advantage of this device is its ability to conduct fatigue tests under periodic loads during rock sample compression and direct shearing. The RMT-150C mechanical testing machine is illustrated in Fig. 5.

RMT-150C mechanics testing machine
During the loading tests, high-precision drilling imaging equipment was used to conduct real-time dynamic monitoring of the deformation of the borehole wall and observe the deformation characteristics of the borehole, as shown in Fig. 6.

Camera equipment used for measuring borehole deformation
(2) Test process.
To evaluate the deformation of pre-drilled boreholes of different geometric sizes caused by different stress states, the entire test process consisted of the following seven steps. 1) Cubic rock sample creation: the selected rock samples were sandstone, limestone, and coal, and the dimensions of the cubic rock samples were 150 × 150 × 150 mm. (2) Drilling boreholes: based on our experimental requirements, four different diameters were tested for each lithology (40, 51, 63, and 74 mm), as presented in Table 2. (3) Stick strain gauge measurement was performed. (4) The confining pressure was set to conduct deformation experiments utilizing displacement control. 5) A high-precision camera was used to collect real-time deformation information from the borehole. (6) The experimental data were recorded. (7) The data were analyzed, stress–strain curves were plotted, and the deformation characteristics of the borehole structures were obtained.
Stick strain gauge measurement is an important and critical step in this process, particularly for small boreholes. Therefore, a small-scale strain gauge was selected for our tests. The specific measurement process was as follows. (1) We used a cotton swab dipped in alcohol to clean the borehole and then let it dry. (2) The strain gauge and wire were welded together. (3) A layer of epoxy resin glue was applied to the connection point and back position of the strain gauge for fixing. (4) Glue was applied to the bottom of the strain gauge and it was lowered to the designated point for attachment. (5) A small round rod was used to roll the strain gauge back and forth to ensure that it was firmly attached to the borehole. A mechanical test of rock sample with a pre-drilled borehole is illustrated in Fig. 7.

Schematic diagram of the testing of borehole deformation for rock samples with pre-drilled boreholes
4 Numerical simulation of borehole deformation caused by horizontal principal stress
4.1 Geometric model
Based on our theoretical analysis of borehole deformation caused by horizontal principal stress, it can be concluded that the deformation morphology of a standard circular borehole under non-uniform horizontal principal stress is elliptical. The ABAQUS numerical simulation software was used to simulate borehole deformation to verify our theoretical deductions and the relevant settings are described in this section.
For numerical simulation, the formation around borehole was assumed to be isotropic and homogeneous, and the problem was simplified to a plane. The geometric model of the formation was 0.2 m × 0.2 m in size and the radius of the borehole was 0.015 m (see Fig. 8). Typically, the deformation near a borehole is of significant concern. Therefore, a structured grid was adopted in our analysis. Grids with different node densities were established in different areas. The grid near the borehole was a denser grid and relatively sparse grids were used far away from the circular borehole. Boundary constraint conditions were defined with the displacement in the y direction set to zero to ensure that the circular borehole could not rotate or move under stress.

Grid structure of the numerical model
4.2 Parameter sets
The materials selected for numerical simulation were mudstone, sandstone, coal, and limestone. Based on the differences in the compressive strengths of these four materials, different maximum and minimum horizontal principal stresses were considered. The maximum horizontal principal stress was set to 50 MPa and the initial value of the minimum horizontal principal stress was set to 30 MPa, which gradually increased in steps of 5 MPa, as shown in Table 3.
5 Results
5.1 Analysis of borehole deformation tests
5.1.1 Variation in borehole displacement
Loading tests were conducted on rock samples with pre-drilled boreholes. The deformation and strain values of the boreholes were measured at 0°, 45°, 90°, 135°, 180°, 225°, 270°, and 315°. The loading direction was defined as 0°. Angles of 0° and 180° were consistent with the direction of the maximum principal stress, which was also consistent with the direction of the short axis. Angles of 90° and 270° corresponded to the direction of the stable confining pressure, which was consistent with the direction of the minimum principal stress and direction of the long axis.
The results revealed that the deformation laws and characteristics of boreholes were the same for angle pairs of 0° and 180°, 45° and 225°, 135° and 315°, and 90° and 270°.The variation trends of borehole displacement over time were consistent. Therefore, the strain gauge data in one direction were selected for each of the four aforementioned pairs for analysis. As the directions of the long and short axes can best reflect the variation of the morphological structure of a borehole, the strain and displacement data along the long and short axes were selected to analyze the variation characteristics of the morphological structures of boreholes. We defined the compression direction of the load as positive and the tensile direction as negative.
(1) Coal
When the diameter of the coal borehole was 40 mm, as depicted in Fig. 9a, the displacement and deformation in the directions of the long and short axes of the borehole were both positive. In other words, the confining pressure states of the long and short axes were the same. Both were positive compressions that generated compressive deformation and strain. After loading was implemented for 25 s, borehole deformation occurred instantaneously and the displacement in the long-axis direction varied from 0 to 0.05 mm. Additionally, the slope in the long-axis direction was greater than that in the short-axis direction. Furthermore, the deformation in the long-axis direction was greater than that in the short-axis direction. In the time of 25 to 260 s, the deformation in the direction of the short axis was relatively stable and the slope remained unchanged. After 260 s, the deformation in the direction of the short axis accelerated and the slope was greater than that in the previous stage. In the period of 260 to 350 s, the deformation in the direction of the short axis was relatively stable until rupture occurred in the direction of the short axis.

Real-time monitoring of borehole displacement in coal samples: (a) Φ40 mm, (b) Φ51 mm, (c) Φ63 mm, and (d) Φ74 mm
When the diameter was varied from 40 to 51 mm, as shown in Fig. 9b, positive compression deformation occurred in the short-axis direction, whereas negative tensile deformation occurred in the long-axis direction. Deformation occurred immediately in the short-axis direction when a load was applied and the displacement of the borehole varied from 0.00 to 0.11 mm. The rate of increase in the deformation in the long-axis direction was smaller than that in the short-axis direction. In other words, the slope of the displacement–time curve in the long-axis direction was lower than that in the short-axis direction. As displayed in Fig. 9b, the variation in the borehole displacement exhibits three different stages: initial, stable, and accelerated deformation. The variation curves in each stage are approximately linear. The deformations in these three stages were approximately linear elastic deformations.
When the borehole diameter was 63 mm, as indicated in Fig. 9c, the variation trend of the displacement along the long and short axes with time was similar to that when the diameter was 51 mm. The difference was that the duration of the initial and stable deformation stages was shorter than that for the diameter of 51 mm. Additionally, the long-axis direction exhibited negative tensile deformation and the short-axis direction exhibited positive compressive deformation. The deformation process exhibited an approximately linear elastic deformation mode.
Compared with the borehole diameters of 51 and 63 mm, when the diameter was 74 mm, as shown in Fig. 9d, the short axis did not rupture as result of the established confining pressure. When unloading was performed, the deformation along the long axis was restored and the displacement of the borehole returned to zero. This can be explained by the deformation of the borehole before the ultimate failure stage, which is an elastically recoverable deformation. After a stable deformation was reached, the borehole displacement, deformation, and time exhibited an approximately linear relationship, which is an iconic feature of elastic deformation.
(2) Sandstone.
When the diameter of the sandstone borehole was 40 mm, as shown in Fig. 10a, the deformation of the borehole exhibited three stages: initial, stable, and accelerated deformation. The long-axis direction exhibited negative tensile deformation, whereas the short-axis direction was characterized by positive compression deformation. When the maximum confining pressure was reached, the loading equipment began to relieve the pressure. The borehole did not crack or exhibit any significant damage because the compressive strength of sandstone is relatively large and the diameter of the borehole was relatively small, allowing it to resist damage from the external load.

Real-time monitoring of borehole displacement in sandstone samples: (a) Φ40 mm, (b) Φ51 mm, (c) Φ63 mm, and (d) Φ74 mm
When the diameter was 51 mm, as shown in Fig. 10b, deformation occurred immediately when a load was applied. Before reaching the maximum confining pressure, the variation in borehole displacement along the long and short axes with time exhibited an ideal linear relationship, indicating that the deformation was elastic. When the maximum confining pressure was reached, the borehole did not reach an ultimate failure state because the compressive strength of sandstone is greater than that of coal.
When the diameter was 63 mm, as depicted in Fig. 10c, negative tensile deformation occurred in the long-axis direction, whereas positive compressive deformation occurred in the short-axis direction. Initial, stable, and accelerated deformations occurred in the short-axis direction, eventually leading to fracture. However, the long axis did not break when the rock reached the maximum confining pressure.
When the diameter was 74 mm, as presented in Fig. 10d, the borehole deformation was similar to that at 63 mm, where the borehole displacement in the short-axis direction was characterized by three stages: initial, stable, and accelerated deformation.
When the maximum confining pressure was reached, fracture occurred in the short-axis direction, but no ultimate fracture occurred in the long-axis direction. The deformation in the short-axis direction was approximately elastic, whereas that in the long-axis direction was completely elastic. The variation in the deformation displacement with time for different diameters was characterized by linear relationships in the long- and short-axis directions. The sandstone boreholes experienced elastic deformation under the confining pressure, but the deformation returned to zero with pressure relief. In contrast to coal, fractures along the short axis were generated in sandstone with different borehole diameters when the maximum load was reached, whereas the long axis did not fracture as a result of the high compressive strength and Young’s modulus of sandstone.
(3) Limestone.
When the diameter of borehole of the limestone was 40 mm, as shown in Fig. 11a, a negative tensile deformation appeared in the long-axis direction and a positive compressive deformation appeared in the short-axis direction at the initial application of the load. The displacement of the borehole in both directions was initially linear with time. In the direction of the short axis, when the load reached a certain stage, the displacement of the borehole varied abruptly and the deformation rate was greater than that in the initial stage. However, no rupture occurred when the maximum load was reached. In the long-axis direction, the displacement of the borehole continued to exhibit a linear relationship with time from the beginning of loading until the maximum load value was reached.

Real-time monitoring of borehole displacement in limestone samples: (a) Φ40 mm, (b) Φ51 mm, (c) Φ63 mm, and (d) Φ74 mm
When the diameter was 51 mm, as displayed in Fig. 11b, the borehole deformation trend was similar to that of the 40 mm diameter, but the values of deformation were larger. For the diameter of 63 mm, as shown in Fig. 11d, when the initial load was applied, deformation was generated immediately and was characterized as stable and linear. When loading reached a certain stage, abrupt deformation occurred until the rock fractured. The deformation rate was greater than that in the previous stage, as indicated by the slopes of the two stages. When the diameter was 74 mm, the deformation mode differed from that in the other cases. In this case, the time from loading to the appearance of displacement of borehole wall was longer than that for the previous three diameters. This indicates that the greater the borehole diameter, the longer the time from loading to deformation. As shown in Fig. 11c and d, the displacement of the borehole remained at zero after loading for approximately 200 s.
For the diameters of 40 and 51 mm, when the maximum load was reached, the borehole did not break and only minor damage appeared. In the unloading stage, deformation was restored to zero. When the borehole diameters were 63 and 74 mm, ultimate fracture occurred when the maximum load was reached. The strain and displacement of the borehole were characterized as having a linear relationship with time. Based on our experimental results, it can be concluded that during the loading process, borehole deformation in the limestone exhibited elasticity and that the greater the diameter, the longer the time from loading to deformation.
5.1.2 Deformation morphologies of boreholes
The deformation morphologies of rock samples with pre-drilled boreholes were obtained by fitting the displacements of the boreholes collected by sensors along the long and short axes. The deformation morphology of the standard circular borehole was characterized as elliptical deformation caused by the maximum and minimum horizontal principal stresses (see Figs. 12, 13 and 14). For the same borehole diameter, the ellipticity of coal was greater than that of limestone. For the same lithology, the ellipticity of rock samples with diameters of 51 and 63 mm was greater than that of rock samples with diameters of 41 and 74 mm.

Deformation trajectories of boreholes in coal: (a) Φ40 mm, (b) Φ51 mm, (c) Φ63 mm, and (d) Φ74 mm

Deformation trajectories of boreholes in sandstone: (a) Φ40 mm, (b) Φ51 mm, (c) Φ63 mm, and (d) Φ74 mm

Deformation trajectories of boreholes of limestone: (a) Φ40 mm, (b) Φ51 mm, (c) Φ63 mm, and (d) Φ74 mm
Generally, the deformation obtained in our experiments was consistent with that obtained through our theoretical deductions and numerical simulations, which confirmed the elliptic deformation mode of a standard circular borehole under an external load. This indicates that borehole deformation is related to horizontal stress to a certain extent and that the stress value can be reflected in the deformation of a borehole. Therefore, from the three perspectives of numerical simulations, experiments, and theoretical deductions, developing the method for calculating horizontal principal stress based on borehole deformation forced should be logical and feasible. These findings can provide a theoretical basis for a set of systematic calculation methods and techniques for horizontal principal stress.
5.2 Analysis of numerical simulations
-
(1)
Factors affecting elliptical deformation: non-uniformity of horizontal principal stress.
After appropriate parameters were set, numerical simulations of different stress levels were conducted on geometric models of different materials to analyze borehole deformation (see Figs. 15, 16, 17 and 18). The elliptical characteristics of borehole can be expressed by its ellipticity, which is generally characterized by the ratio of the long axis (A) to the short axis (B) of a borehole as \(\varepsilon = A/B\). As shown in Figs. 15, 16, 17 and 18, the morphologies of standard circular boreholes tend to become elliptical under the maximum and minimum horizontal principal stresses.
Fig. 15 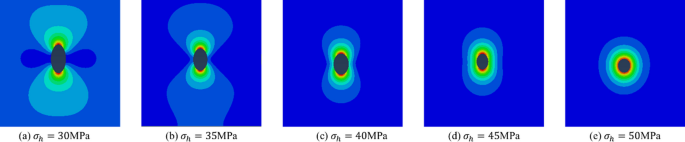
Numerical simulation of borehole deformation in coal under different horizontal stresses
Fig. 16 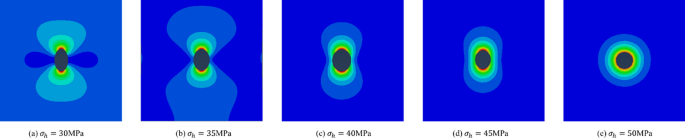
Numerical simulation of borehole deformation in mudstone under different horizontal stresses
Fig. 17 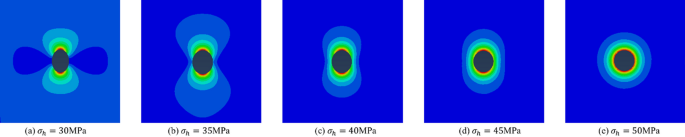
Numerical simulation of borehole deformation in sandstone under different horizontal stresses
Fig. 18 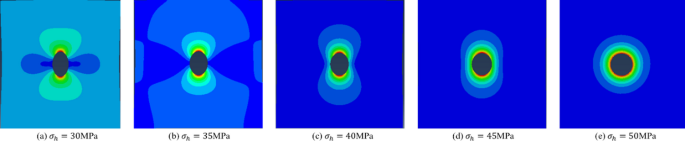
Numerical simulation of borehole deformation in limestone under different horizontal stresses
For a given lithology, the ellipticity of the standard circular borehole gradually increases with increasing horizontal principal stress differences.
When the horizontal principal stress difference (\(\Delta \sigma\)) is greater than 10 MPa, ellipticity becomes more pronounced, as shown in Fig. 19. Furthermore, stress concentration along the long axis of a borehole becomes more evident. Thus, the ellipticity of a borehole is mainly influenced by the non-uniformity of the horizontal principal stress. When the maximum and minimum horizontal principal stresses were equal (i.e., \(\sigma_{H} = \sigma_{h} = 50MPa\)), the boreholes remained circular and the stress distributions around the holes were uniform, which further indicates that the non-uniformity of horizontal principal stress is an important factor influencing the ellipticity of a borehole.
Fig. 19 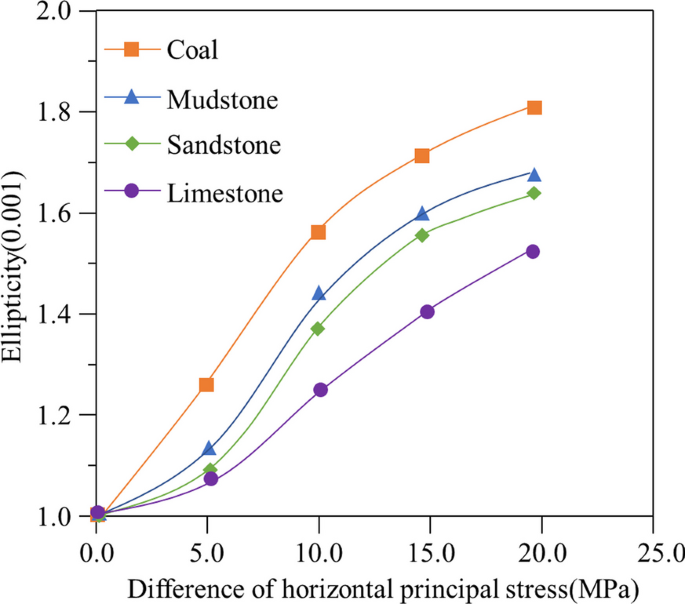
Relationships between the ellipticity of a borehole and differences in horizontal principal stresses for different materials
Figures 15, 16, 17 and 18 reveal that under a given amount of stress, the ellipticity of circular boreholes in coal and mudstone is relatively high and the ellipticity of coal is the most significant, which can be attributed to the small Young’s modulus and large Poisson’s ratio of coal. In contrast, limestone exhibited the smallest deformation under a given stress level as result of its large Young’s modulus and small Poisson’s ratio.
Ellipticity was calculated based on the lengths of the long and short axes of the elliptical boreholes under different horizontal principal stress differences. As shown in Fig. 19, the horizontal principal stress difference had a significant influence on the ellipticity of the standard circular boreholes. However, the degree of influence on different materials varied significantly. Based on the effect of the horizontal principal stress difference on elliptical deformation, deformation can be divided into three stages: initial, stable, and accelerated deformation. With an increase in the horizontal principal stress difference (\(\Delta \sigma\)), the ellipticity gradually increases. When \(0.0 \le \Delta \sigma \le 5.0\), ellipticity gradually increases and elliptical deformation remains in the initial stage. A standard circular borehole then tends to undergo elliptical deformation under the action of horizontal principal stress.
When the pressure difference is greater than 5.0 MPa (\(\Delta \sigma > 5.0\)), the ellipticity increases significantly and the borehole enters the accelerated deformation stage. When the pressure difference is greater than 10.0 MPa (\(\Delta \sigma > 10.0\)), although ellipticity continues to increase, this increase is smaller than that in the previous stage and the borehole enters the stable deformation stage. Among the four tested materials of coal, mudstone, sandstone, and limestone, the ellipticity of coal was the greatest, followed by mudstone and limestone, which is related to their mechanical properties. The initial deformation time of coal was short and the coal directly entered the accelerated deformation stage, whereas the corresponding initial stages of the other three materials lasted for a period before entering the accelerated deformation stage. The numerical simulation results indicated that the elliptical deformation of coal is easier than that of the other three materials.
-
(2)
Factors affecting elliptical deformation: Young’s modulus.
The foregoing analysis was mainly focused on borehole deformation caused by the non-uniformity of horizontal principal stress. It was determined that the greater the non-uniformity of horizontal principal stress, the greater the ellipticity of a standard circular borehole. In strata with strong tectonic movement and sedimentary differences, the heterogeneity of strata is also greater, which leads to significant differences in rock mechanical parameters such as Young’s modulus and Poisson’s ratio.
To investigate the influence of the heterogeneity of rock mechanical parameters on the elliptical deformation of a circular borehole, we considered the following conditions: 1) the maximum and minimum horizontal principal stresses were equal (i.e., \(\sigma_{H} = \sigma_{h}\)); 2) Poisson’s ratio was consistent, but the variation in the Young’s modulus in the x- and y-axis directions was controlled to simulate the borehole deformation corresponding to different ratios of Ex and Ey, as shown in Fig. 20. One can see that when Ex and Ey are equal (i.e., Ex: Ey = 1), the borehole maintains a circular shape. In contrast, as this ratio increases from one to four, the standard circular borehole gradually becomes more elliptical. Therefore, the greater the heterogeneity of rock mechanical parameters, the greater is the ellipticity.
Fig. 20 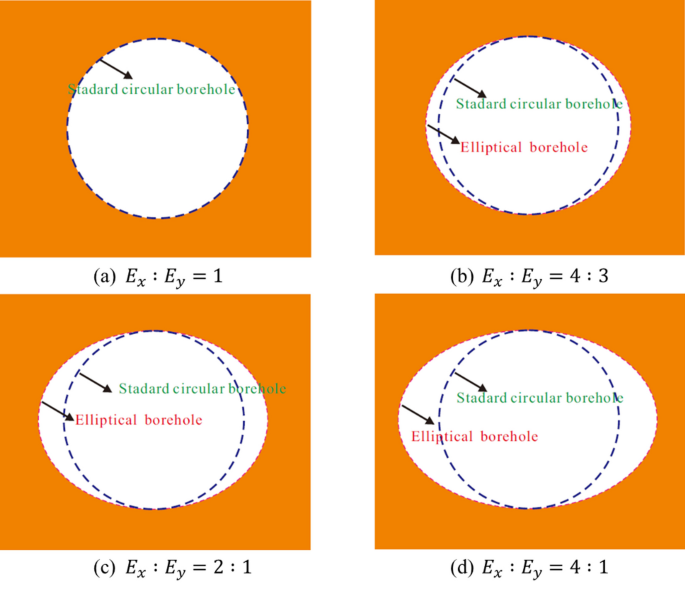
Influence of difference of Young’s modulus on elliptical deformation under the same horizontal principal stress
Next, the maximum horizontal principal stress (\(\sigma_{H}\)) was set to 50 MPa and the minimum horizontal principal stress (\(\sigma_{h}\)) was set to 30 MPa. Poisson’s ratio was set to 0.3. In this manner, simulations of borehole deformation under the same stress and different Young’s modulus were conducted, as shown in Fig. 21. As presented in Fig. 22, under a given stress level, when the circumference angle remains unchanged, the greater the Young’s modulus, smaller the borehole strain, and smaller the deformation. This further confirms that a formation with a larger Young’s modulus is more difficult to deform. The smaller the Young’s modulus, the greater is the ellipticity. Among the four tested materials, coal had the smallest Young’s modulus and was characterized as having the greatest capacity for elliptical deformation. In contrast, limestone exhibited the largest Young’s modulus and its deformation was relatively small under a given stress level.
Fig. 21 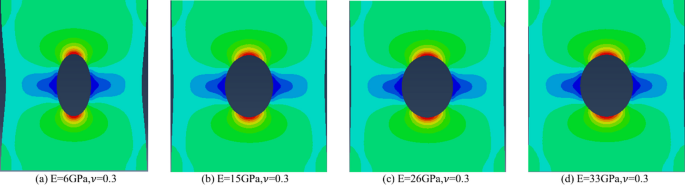
Borehole deformation simulations corresponding to different Young’s moduli under the same stress level
Fig. 22 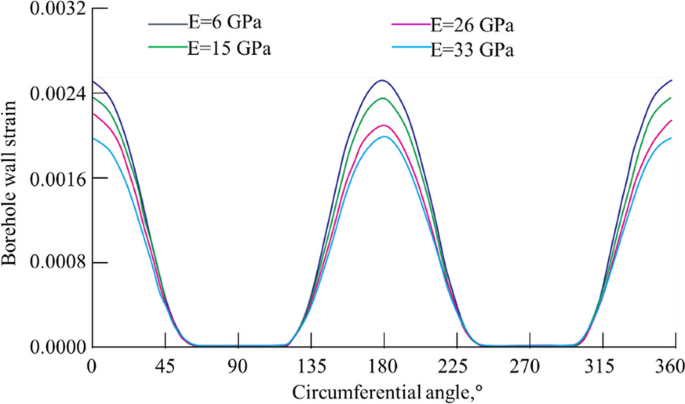
Variations in borehole strain at different circumference angles with the same stress and different Young’s modulus
As shown in Fig. 23, a negative exponential variation relationship exists between the Young’s modulus and ellipticity. With an increase in the Young’s modulus, the ellipticity gradually decreases. When Young’s modulus is less than 15 GPa, ellipticity varies rapidly and the elliptical deformation of standard circular holes is significant. When Young’s modulus is greater than 15 GPa, the ellipticity varies slowly and the elliptical deformation of standard circular holes is relatively stable. The Young’s moduli of soft rocks are generally less than 10 GPa, whereas the Young’s moduli of hard rocks are generally relatively large. For example, the Young's modulus of hard limestone can reach 100 GPa. Our numerical simulations indicate that for relatively soft rocks with Young’s modulus lower than 15 GPa, the elliptical deformation of standard circular boreholes is relatively easy, which is more conducive to the formation of elliptical boreholes.
Fig. 23 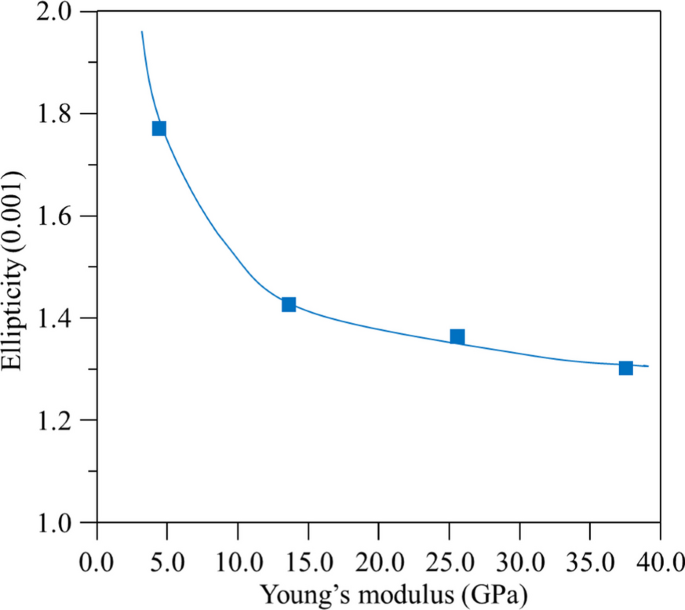
Relationship between Young’s modulus and ellipticity
-
(3)
Factors affecting elliptical deformation: Poisson’s ratio.
Next, we considered a maximum horizontal principal stress (\(\sigma_{H}\)) of 50 MPa and minimum horizontal principal stress (\(\sigma_{h}\)) of 30 MPa with a Young’s modulus of 16.8 GPa. Therefore, borehole deformation under a given stress level with different Poisson’s ratios was analyzed, as shown in Fig. 24. The results in Fig. 25 indicate that under a given stress level, the borehole strain gradually increases with Poisson’s ratio, confirming that strata with larger Poisson’s ratios are more prone to deformation. Deformation is maximized at angles of 0° and 180°, and minimized at angles of 90° and 270°. The deformations at 0° and 180° are identical, as are those at 90° and 270°, which is conducive to generating elliptical deformation of a borehole. Among the four materials of mudstone, limestone, coal, and sandstone, the Poisson’s ratio of coal was the greatest at nearly 0.5. Therefore, its ellipticity was also the greatest.
Fig. 24 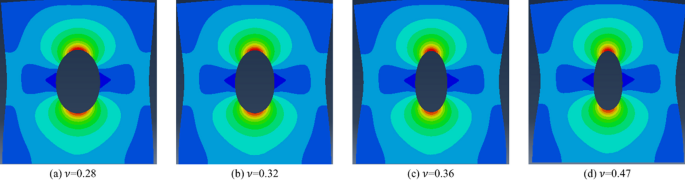
Simulations of borehole deformation with different Poisson’s ratios at the same stress level
Fig. 25 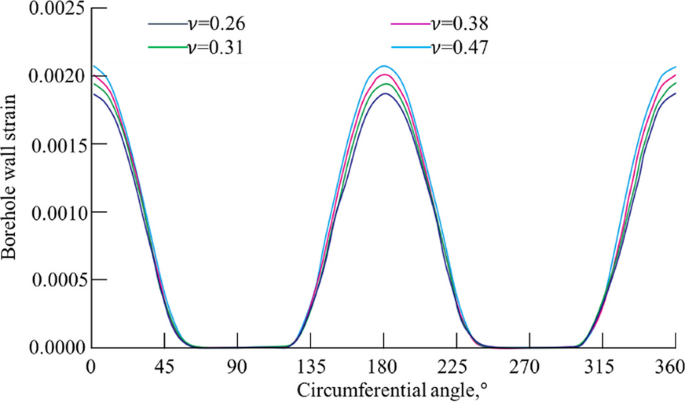
Variations in borehole strain at different circumference angles with the same stress and different Poisson’s ratios


As shown in Fig. 26, the Poisson’s ratio and ellipticity exhibit a positive exponential variation relationship. With a gradual increase in the Poisson’s ratio, the ellipticity also increases synchronously. When Poisson’s ratio is less than 0.3, the increase in ellipticity is smaller than that when Poisson’s ratio is greater than 0.3. Based on the relationship between hardness and Poisson’s ratio, rock is commonly characterized as hard rock when its Poisson’s ratio is less than 0.3. For example, the Poisson’s ratio of relatively hard limestone is approximately 0.1, whereas the Poisson’s ratio of soft coal is greater than 0.3. Therefore, Poisson’s ratio is another key factor affecting the elliptical deformation of standard circular boreholes.

Relationship between Poisson’s ratio and ellipticity
6 Discussion
6.1 Relationship between the non-uniformity of horizontal principal stress and elliptical deformation of boreholes
For soft coal seam or gas drilling, a standard circular borehole is prone to elliptical deformation. Because the thickness of soft coal seams varies significantly and the mechanical strength of coal is low, under the rotational disturbance of the bit and drill pipe, a borehole for gas extraction gradually deforms from a standard circle to an ellipse. In the Sichuan and Xinjiang areas of China, gas drilling is common and the deformation of boreholes in soft rock caused by weakening as a result of mud erosion is rare. Therefore, elliptical boreholes are mainly created by non-uniform horizontal principal stress.
The results of our numerical simulations indicate that for given lithology, when the horizontal principal stress difference is 0 MPa, the borehole morphology maintains a standard circular shape, whereas when the horizontal principal stress difference is greater than zero and gradually increases, the morphology of a borehole deforms gradually from a circle to an ellipse. When the horizontal principal stress difference is large, elliptical deformation is also large. Our numerical simulation results indicate that horizontal principal stress is the key factor affecting the ellipticity of boreholes and that a horizontal principal stress difference has a positive relationship with the ellipticity of a borehole. Figure 19 revealed that the influence of the horizontal principal stress difference on ellipticity exhibited staged features. Specifically, when the horizontal principal stress difference is 0 to 5 MPa, the increase in ellipticity is relatively slow, which defines the initial stage of micro-deformation. When the horizontal principal stress difference is 5 to 10 MPa, the ellipticity rate increases rapidly; this defines the accelerated elliptical stage. When the horizontal principal stress difference is greater than 10 MPa, the increase in ellipticity slows and enters a stage of stable elliptical deformation.
Our test results for borehole deformation further confirmed that for a given lithology, with an increase in the difference in horizontal principal stress, the morphology of boreholes deforms from circular to elliptical.
When the minimum horizontal principal stress remains constant, the load and ellipticity gradually increase. The law derived from our tests is consistent with the results of our numerical simulations and theoretical deductions. All results indicated that horizontal principal stress was closely related to and was a key factor affecting the elliptical deformation of boreholes.
6.2 Relationship between the non-uniformity of horizontal principal stress and lithology
Experimental analysis of different materials with pre-drilled boreholes revealed that the ellipticity values of different materials differ under a given stress level, as shown in Figs. 15, 16, 17 and 18. The strength parameters (compressive strength and Young’s modulus) of coal and mudstone are smaller than those of limestone and sandstone, and their ellipticity values are also relatively small. The influence of differences in materials on elliptical deformation mainly depends on the physical characteristics of rock, including its mineral composition, microscopic pore structure, and strength (compressive strength and Young’s modulus).
Scanning electron microscopy (SEM) observations of soft mudstone clearly revealed its mineral crystal arrangement and cementation structure characteristics, as shown in Fig. 27. The quartz particles in the soft mudstone are tightly packed, clay particles can occasionally be observed in the rock, there are few expansive clay mineral areas, and a large number of intergranular pores are present, which provide a flow channel for drilling fluid to invade the formation. The intrusion of drilling fluid into a formation through intergranular pores may not only induce hydraulic fracturing and aggravate borehole deformation, but also cause hydration expansion and dispersion of clay minerals after they contact the drilling fluid, which may reduce the strength of a formation. These two factors lead to an increase in the probability of elliptical deformation of boreholes. The hydration of soft mudstone leads to the deterioration of rock strength and this deterioration exhibits aging characteristics. Therefore, the pore structure of soft mudstone exhibits elliptical deformation with aging characteristics (i.e., periodic elliptical deformation).

SEM image of mudstone
The effects of the physical and chemical properties of coal and limestone on borehole deformation can be ignored considering their low swelling when exposed to water. Therefore, the factor of in situ stress was analyzed to study the microscopic mechanisms of borehole deformation in these two types of rocks. In the well-diameter log curve displayed in Fig. 28, the elliptical deformation of the limestone section is apparent, mainly because high formation pressure at extremely deep depths generates an obvious non-equilibrium in the in-situ stress. This phenomenon is commonly observed during gas drilling in eastern Sichuan. In gas drilling, there is no drilling fluid in the borehole. Therefore, the borehole is not affected by the hydration of the drilling fluid and borehole deformation is mainly caused by in situ stress. When the borehole stress remains within the range of the shear strength of the wall rock, borehole deformation is typically elliptical and manifests as tensile deformation. When the shear strength of the rock is reached or exceeded, the block collapses, which manifests as shear deformation.

Diameter log curve from eastern Sichuan
6.3 Feasibility of constructing a calculation method for horizontal principal stress based on the structural parameters of borehole deformation
According to our theoretical analysis, the morphology created by horizontal principal stress is elliptical and can be derived from Eq. (18). Then, \(\sigma_{H}\) and \(\sigma_{h}\) can be derived by working backward from Eq. (16), as follows:
Therefore, a relationship between the principal stress and geometric parameters of an elliptical borehole (major semi-axis A0, minor semi-axis B0, and initial radius a) has been established, which is the theoretical basis for an in-situ stress measurement method based on the elliptical morphology of a borehole.
As shown in Eq. (19), the maximum and minimum horizontal principal stresses are primarily related to the long and short axes of the elliptical borehole. For standard elliptical boreholes, multi-arm boreholes can be measured directly, whereas for nonobvious ellipses, the elliptical deformation trajectory can be approximated through fitting, which requires only three borehole diameter values. Therefore, only three diameters in different directions are required to determine the geometric parameters of an ellipse and a set of measurement technologies can be developed to obtain no less than three diameters in different directions simultaneously. Contact-type micro-optical aperture deformation measurement technology has been developed to solve the problem of measuring the elliptical shapes of boreholes and corresponding measurement devices have been designed. Key sub-technologies include aperture deformation sensing, micro-optical imaging measurement, and azimuth measurement. Such tools can provide technical support for in situ stress measurement methods based on borehole morphology.
The numerical simulation and experiments indicated that the borehole deformation dominantly depended on the in-situ stress in the formation. The morphology of borehole could be quantitatively characterized with borehole diameter values. With the advanced measurement equipment, the morphologic parameters of borehole could be obtained precisely. Compared with the method based on borehole deformation, the method based on wellbore breakout uses the collapses of deep wellbore wall and falling of rock around the wellbore to compute the in-situ stress. Though this method was characterized as fast measurement speed and can obtain information in deep strata or even ultra-deep strata, the dominant directions of wellbore breakout could not be determined precisely. In addition, the anisotropy of the surrounding formation medium would also impact the dominant caving orientation, thereby impairing the validity of the information obtained.
7 Conclusions
-
(1)
Our theoretical deductions indicate that the morphology of a deformed standard circular borehole created by the maximum and minimum horizontal principal stresses is elliptical and that reverse calculation for the horizontal principal stress can be realized based on elliptical borehole morphology parameters.
-
(2)
Numerical simulations indicate that the factors affecting the ellipticity of a borehole are the difference in horizontal principal stress, Young’s modulus, Poisson’s ratio, and lithology. For a given lithology, the greater the difference in horizontal principal stress, the greater are the ellipticity and elliptical deformation. For a given stress level, rock strength is inversely proportional to the ellipticity of a borehole. The smaller the Young’s modulus and compressive strength and the greater the Poisson’s ratio, the greater is the ellipticity of a borehole. Therefore, the ellipticity of mudstone and coal is greater than that of limestone and sandstone.
-
(3)
Borehole deformation tests reveal that with an increase in load, the displacement of a borehole wall exhibits three stages: initial micro-deformation, accelerated deformation, and stable deformation. Additionally, under non-equilibrium horizontal principal stress, a borehole deforms from a standard circle to an ellipse. Therefore, from an experimental perspective, the geometric equation of borehole morphology derived under horizontal principal stress is confirmed to be an elliptical equation. Furthermore, calculating horizontal principal stress based on elliptical morphology parameters is feasible.
Availability of data and materials
The datasets generated and analysed during the present study are not publicly available because of applicable institutional guidelines but are available from the corresponding author upon reasonable request.
References
Bahrehdar M, Lakirouhani A (2022) Effect of eccentricity on breakout propagation around noncircular boreholes. Adv Civil Eng 2:1–14
Brudy M, Zoback MD, Fuchs K (1997) Estimation of the complete stress tensor to 8 km depth in the KTB scientific drill holes Implications for crustal strength. J Geophys Res 18:453–475
Cui XP, Su F, Sun W (2021) Analysis of solid load transfer mechanism and characteristics of anchor based on hole wall shape. Coal Sci Technol 49:96–102
Eyal S, Stephen JB, Michael AH (2021) Borehole breakout modeling in arkose and granite rocks. Geomech Geophys Geo-Energy Geo-Resour 7:15–38
Fang XX, Feng H, Wang YH (2022a) Prediction method and distribution characteristics of in situ stress based on borehole deformation-a case study of coal measure stratum in Shizhuang block. Qinshui Basin Front Earth Sci 8:961311
Fang XX, Feng H, Wang H (2022b) Study on intelligent prediction method of rock drillability based on Bayesian lithology classification and optimized BP neural network. Pet Sci Technol 40:2141–2162
Fang XX, Zhu GT, Yang YM (2023) Quantitative method of classification and discrimination of a porous carbonate reservoir integrating k-means clustering and bayesian theory. Acta Geolog Sinica-Engl Edn 97:179–186
Ge XR, Hou MX (2011) A new 3D in-situ rock stress measuring method: Borehole wall stress relief method (BWSRM) and development of geostress measuring instrument based on BWSRM and its primary applications to engineering. Chin J Rock Mech Eng 38:2161–2180
Ghosh R, Zhang ZX, Nyberg U (2015) Borehole instability in malmberget underground mine. Rock Mechan Rock Eng 48:1731–1736
Guglielmi Y, Cappa F, Lancon H (2014) ISRM suggested method for step-rate injection method for fracture in-situ properties (SIMFIP): Using a 3-components borehole deformation sensor. Rock Mech Rock Eng 47:303–311
He JF, He WC, Zhang CP (2022) Numerical simulation on the deformation characteristics of borehole failure in gas-bearing coal seams considering the effective stress principle under complicated stress path conditions. Geomech Geophys Geo-Energy Geo-Resour 8:95–115
He MM, Ding MC, Yuan ZY (2023) Numerical simulation of rock bursts triggered by blasting disturbance for deep-buried tunnels in jointed rock masses. Comput Geotech 161:105609
Hou MX, Ge XR (2007) Study on a calculation model for 3D in-situ rock stress tensor. Rock Soil Mechan 28:2017–2022
Jaeger C, Neville GW (2009) Fundamentals of rock mechanics. Wiley, UK
Kirsch G (1898) Die theorie der elastizitat und die bedürfnisse der festigkeitslehre. UK: Veit Ver Deut Ing 42:797–807
Li XR, Feng YC, Gray KE (2018) A hydro-mechanical sand erosion model for sand production. J Petrol Sci Eng 3:42–80
Liu HB, Han X, Zhang J (2019) Wellbore stability evaluation during gas drilling through low permeability gas reservoirs in Western Sichuan. Petrol Drill Technol 47:25–32
Liu JS, Yang H, Xu K (2022) Genetic mechanism of transfer zones in rift basins: Insights from geomechanical models. GSA Bull 134:2436–2452
Liu JS, Mei L, Ding W (2023) Asymmetric propagation mechanism of hydraulic fracture networks in continental reservoirs. GSA Bull 135:678–688
Ma TS, Qiu Y, Zhang Y (2022) Numerical simulation of progressive sand production of open-hole completion borehole in heterogeneous igneous formation. Int J Rock Mech Min Sci 150:1–14
Oh J, Canbulat TR, Stacey TR (2020) Experimental and analytical investigations of the effect of hole size on borehole breakout geometries for estimation of in situ stresses. Rock Mech Rock Eng 53:781–798
Setiawan NB, Zimmerman RW (2022) Semi-analytical method for modeling wellbore breakout development. Rock Mech Rock Eng 55:2987–3000
Sheosei S, Shinji K (1986) A diametral deformation method for in situ stress and rock property measurement. Int J Min Geol Eng 4:15–38
Wang Z, Liang YP, Jin HW (2008) Analysis of mechanics conditions for instability of outburst-preventing borehole. J Min Safety Eng 25:444–449
Yang BB, He MM, Xiao ZS (2023) Effect of horizontal stress on fractal characteristics of rockburst fragments in coal mining. Energy 281:128181
Zhang ZZ, Li ZK, Xu MG (2010) Displacement analytic solution of deep buried circular tunnel in transverse isotropy rock mass. Gold 31:23–26
Ziegler M, Valley B (2021) Evaluation of the diametrical core deformation and discing analyses for in-situ stress estimation and application to the 4.9 km deep rock core from the Basel geothermal borehole. Switz Rock Mechan Rock Eng 54:6511–6532
Zoback MD, Moos D, Mastin L (1985) Wellbore breakouts and in-situ stress. J Geophys Res 90:5523–5530
Acknowledgements
I am grateful for the suggestions of co-authors.
Funding
This study was supported by the development of large penetrating distance transient electromagnetic detection equipment with wide face [2022–2-TD-MS006], Research on trajectory deflection mechanism of mine coring drilling and technology of directional coring [2023-YBGY-059] and Shaanxi Province Qin Chuangyuan cited high-level innovation and entrepreneurship talent project (QCYRCXM-2022–260).
Author information
Authors and Affiliations
Contributions
XF completed the writing, construction, experiment, numerical simulation, Language, review. Other authors help with the figure and structure design.
Corresponding author
Ethics declarations
Ethics approval and consent to participate
The MS has no ethical problems.
Competing interests
All authors declare no conflict of interest.
Additional information
Publisher's Note
Springer Nature remains neutral with regard to jurisdictional claims in published maps and institutional affiliations.
Rights and permissions
Open Access This article is licensed under a Creative Commons Attribution 4.0 International License, which permits use, sharing, adaptation, distribution and reproduction in any medium or format, as long as you give appropriate credit to the original author(s) and the source, provide a link to the Creative Commons licence, and indicate if changes were made. The images or other third party material in this article are included in the article's Creative Commons licence, unless indicated otherwise in a credit line to the material. If material is not included in the article's Creative Commons licence and your intended use is not permitted by statutory regulation or exceeds the permitted use, you will need to obtain permission directly from the copyright holder. To view a copy of this licence, visit http://creativecommons.org/licenses/by/4.0/.
About this article

Cite this article
Fang, X., Ma, S., Wang, Y. et al. Experimental and numerical simulation investigation of the deformation characteristics of vertical boreholes under non-uniform horizontal principal stress. Geomech. Geophys. Geo-energ. Geo-resour. 10, 81 (2024). https://doi.org/10.1007/s40948-024-00799-1
Received:
Accepted:
Published:
DOI: https://doi.org/10.1007/s40948-024-00799-1