
Abstract
In the last few decades, the discovery of various methods for generating secure image hash has become revolutionary in the field of image hashing. This paper presents an efficient approach to obtain image hash through DWT-SVD and a saliency detection technique using spectral residual model. The latest image hashing technique based on ring partition and invariant vector distance is rotation invariant for the large angle at the cost of being insensitive to corner forgery. But, due to the use of the central orientation information, the proposed system is rotation invariant for arbitrary angles along with sensitiveness to corner changes. In addition, we have used the HSV color space that gives desirable classification performance. It provides satisfactory results against large degree rotation, JPEG compression, brightness and contrast adjustment, watermarking, etc. This technique is also sensitive to malicious activities. Moreover, it locates the forged areas of a forged image. We have applied the proposed algorithm to a large collection of images from various databases. The receiver operating characteristics shows that the proposed method is better than some state-of-the-art methods.
1 Introduction
With the advancement of science and technology, life has become simple and easier. Internet and multimedia devices have facilitated in easy clicking, storing and sharing images, videos and songs. The problem arises when we get interested in searching all versions of images which are perceptually similar [1]. If the digital representation of all these would be different, this simple problem becomes a challenging one. Many innovative discoveries have facilitated other digital operations also, like editing and tampering [1]. The time has gone when one could provide images as evidence without any further inspection. Now to ensure the authenticity of an image, forensic investigation is required. These all could not have been possible without emerging multimedia technology image hashing.
Image hashing not only expedites the search of copies of images from large databases but also ensures image authentication. Image hashing sketches out the smallest string from the input image and leads to the formation of image hash [2]. Image hash is not only beneficial for image replica detection and image authentication but also is widely useful in image retrieval, forensics, tamper detection and watermarking. In cryptography, some standard functions like MD5 and SHA-1 are used for message authentication. These functions cannot be used in case of an image because they are sensitive to bit level changes. An image often undergoes simple digital processing like compression, and contrast and color adjustments, which visually resembles the original one [3, 4]. Hence, image hash needs to be perceptually robust against few changes but should also detect tampering events, such as replacement, deletion, and insertion.
From the last few decades, researchers have contributed many methods for development in this field of image hashing techniques. The earliest work was proposed by Chang and Schneider [5] at Third International Conference on Image Processing (ICIP). Another famous paper was published at Seventh ICIP, by Venkatesan et al. [6] entitled, “Robust Image Hashing”. This method is supple to rotation within 2°, median filtering, and JPEG compression. But it is fragile to contrast adjustment and gamma correction. Further, researchers have proposed image hashing based on discrete wavelet transform (DWT) [6,7,8,9]. Monga et al. [9] proposed a two-step basis image hashing in which first involves generation of intermediate hash by feature extraction. Second, the intermediate hash is coded to obtain a final hash. The major drawback is not robust to image rotation. A secure image hashing framework was given by Ahmed et al. [7]. He has used DWT and cryptography technique, the SHA-1. It can be used for tamper detection, but is fragile to some digital processing like contrast adjustment and brightness adjustment. Monga and Evans [8] proposed an image hashing based on visually significant feature points. These feature points are invariant to insignificant changes in the image, but limited in large degree rotation.
Goljan and Fridrich [10] proposed a method based on DCT. This method was based on a concept that DCT coefficients can represent the image contents. This method is robust against some normal digital processing, but sensitive to image rotation. Chang and Lin et al. [11] gave an image authentication system which was based on the relation of DCT coefficients at a same position in the separate block. This relation was invariant to JPEG compression. This method is also fragile to the rotation, but can discriminate JPEG compression from malicious attacks. Swaminathan et al. [12] proposed an image hashing using discrete Fourier transform (DFT). The concept was that the DFT represents the visual contents of the image. This method is robust to some digital manipulations, but limited to rotation up to 20°. Laimer and Uhl [13] proposed an image hashing technique using key depended on JPEG2000 packet data. This method is robust to some digital manipulation, but limited in the case of rotation. Lv and Wang [14] designed an image hashing using Fast Johnson Lindenstrauss transform (FJLT) and Fourier Mellin transform (FMT). The author first constructed hash using only FJLT, then combined with FMT to enhance the performance in case of rotation. This method is sensitive to Gaussian low pass filtering and gamma correction. Xiang and Yang [15] proposed an image hashing based on a restricted blocking strategy by considering the central circular part of an image to improve the performance of block-based NMF method in case of rotation. This method is robust to the rotation but with the cost of corner information loss.
Kozat et al. [16] proposed SVD-SVD hashing in which images were attacked by a sequence of linear operators and generation of hash was based on SVD. This method is robust against geometric attacks but the classified range is limited. Monga and Mihcak [17] made use of NMF in image hash for the first time in the area of image hashing. According to their algorithm, NMF is applied to randomly selected sub-images of an input image. Now, the coefficients of matrix factorisation are arranged in the matrix form called secondary image. The NMF is again applied on a secondary image, and NMF-NMF vector is resulted by concatenating the matrix. This method cannot resist some normal manipulation but is flexible to geometric attacks. Tang et al. [18] further applied invariant relation in NMF coefficient matrix and used to obtain robust image hash. This method is robust against additive noise, watermark embedding, and JPEG compression but fragile to image rotation.
Compressive sensing (CS) [19], matrix factorization [20], feature point [21], moments [3, 22], and ring partition [2, 23] have also been used to develop image hashing techniques. The image hash construction by using compressive sensing has been proposed by Kang et al. [19]. It generates small hash due to compression, but is sensitive to rotation. The lexicographical framework based on DCT and NMF has been used to generate image hash by Tang et al. [20]. This method is robust to some content-preserving operation, but variant for rotation of large degree. Lv and Wang [21] has proposed a hashing technique using scale invariant feature transform (SIFT). In this method, keys are detected by SIFT, and only stable keys are selected based on Harris criterion. The final hash has been generated from shape-based descriptor around stable keys. This method is robust to many digital manipulations, but not robust for the large degree of rotation. In this method around 20% image information remains unexplored during hash generation. The invariant moments (IM) has been used for hashing method by Tang et al. [22]. The hash has been formed by concatenating the moments from YCbCr and HIS color model of the image. It is robust for an arbitrary degree of rotation, but limited in discrimination. The global features based on Zernike moments of an image and local features based on shape texture from the salient map of an image has been used to design image hashing by Zhao et al. [3]. The major limitation of this method is that it is rotation invariant only up to 5°. Tang et al. [23] proposed a hashing method based on entropy from the rings. The motivation of this method is that image center remains unchanged after rotation, so pixel values from rings around the image center do not change due to the rotation. The hash vectors have been generated from entropies of each ring. But this method is limited for textural images. The hashing technique based on ring partition of an image, and followed by NMF to generate hash, has been proposed by Tang et al. [2]. This method is robust to digital image manipulations, but limited to forgery of images in corners.
Recently the researchers in an image hashing area have proposed some good hashing methods. Tang et al. [24] have enhanced the earlier work [2] by incorporating security of hash and replacing NMF by invariant vector distance. This method is robust to many content-preserving operations, but the limitation of corner forgery detection has not been solved. The FMT and CS have been combined to design hashing technique by Sun and Zeng [25]. This method is robust to scaling, and transition attacks, but limited to large angle rotation. Wang et al. [26] proposed an image hashing by concatenating the features from image blocks and key points. This method is robust to some digital image manipulation, identifies the forged area, but sensitive for large angle rotation. The quaternion discrete Fourier transform has been combined with the log-polar transform to design a hashing technique [27]. In this method, a three-color channel has been used and the method is robust to rotation of large degree, but unable to locate forged area. Li et al. [28] proposed a hashing method using selective quaternion. It is robust to some content-preserving operations but is variant to brightness and contrast changes. The adaptive local features have been considered for a hash generation by Yan et al. [29]. This method is robust to digital image manipulations, but is insensitive to color forgery. Qin et al. [30] presented an image hashing algorithm by using block truncation coding (BTC). It is not robust to brightness adjustments. The concept of ring partition and color vector angle has been used to design image hash by Tang et al. [31]. It is robust to content-preserving operations, but with the cost of around 20% image content loss.
With the aim to reduce the limitations of some existing image hashing techniques, the contributions of the paper may be stated as follows:
-
The central orientation information enhances the robustness of image hashing technique. Incorporating the central orientation information may make the system completely rotation invariant which is considered to be the limitation of many state-of-the-art methods.
-
It has been observed from the literature that the image hashing techniques using only global feature limited in discrimination. We have used the global and local features to generate the image hash. The local features (the shape-texture feature) along with global features enhance the discrimination. Moreover, the proposed system may be used in image authentication. It is also capable enough to locate the forged part in an image that may be highly used in medical and forensic evidence, etc.
-
The hash vector is protected with secret keys. The proposed image hash may be used for image security-related applications.
-
Some of the existing state-of-the-art methods are robust to the large angle of rotation, but with the cost of insensitivity to corner forgery (i.e., tampering in corner of an image) of an image. The corner information of an image has been used during hash generation in the proposed method, hence sensitive to corner forgery and also robust against arbitrary rotations.
-
In addition, we have used the HSV color space that gives desirable classification performance.
-
We have also tried to explore LWT in place of DWT keeping all other parameters unchanged in the proposed method. The experimental results with modification of the proposed method have the similar performance with slightly lower computation cost.
-
The experiment has been performed on large standard image database to test the robustness and discrimination of the proposed system.
The paper is organized as follows: Section 2 provides the details of each step used in the proposed system. The application of the proposed method in image authentication and forged area localization has been discussed in Section 3. Section 4 shows the experimental results of the proposed system. Section 5 compares the performance of the proposed system with some state-of-the-art methods. Finally, conclusions and future works have been drawn in Section 6.
2 Proposed algorithm
The proposed algorithm is represented using a flow chart (Fig. 1). In this paper, we have proposed an image hashing algorithm that uses some pre-processing steps, DWT-SVD and saliency detection technique using a spectral residual model. We have used three keys to making our image hash secure. The central orientation information is also transmitted along with the image hash. The following section presents the details of each step.

Block diagram of proposed algorithm
2.1 Singular value decomposition
SVD is a mathematical tool that transforms correlated variables into a set of variables that are not correlated, but they better express the relationship among original data. It can be overviewed as a process of data reduction. SVD of any matrix X is the factorization of X into a product of three matrices:
Here, S is a diagonal matrix, whereas U and V are orthonormal. SVD is a very useful tool and it has various applications. SVD can be used to find a low-rank matrix which is a good approximation to the original matrix X. One of the best property of SVD is that it can be defined for any kind of matrix, whether it is rectangular or square unlike other spectral decomposition in linear algebra. The columns of V in SVD are called right singular vectors of X. Similarly, columns of U are called left singular vectors. Both right and left singular vectors form an orthogonal set. The diagonal elements of matrix S are singular values [32].
The SVD are known to be more robust than eigenvectors of a covariance matrix. The reason is that robustness is determined by directional vector rather than general scalar quantity. These directional vectors are encoded in matrices U and V which are orthogonal. Therefore, little disruption like noise causes a very small effect to disturb orthogonal property encoded in U and V [33].
2.2 Discrete wavelet transform
The wavelet transform has now accomplished widespread approval in image processing. Wavelet transform generally dissolves the input signal into an array of basis functions which is called wavelets. Discrete wavelet transform (DWT) is a highly flexible and efficient method for sub-band decomposition of the signal. We use 2D-DWT in image processing. It is a multi-resolution analysis and it decomposes images into wavelet coefficients and scaling function. It has a property due to which signal energy accumulates into wavelet coefficients. This makes DWT useful in compressing images [34]. Wavelets convert images into a series of wavelets that can be saved more efficiently than pixels. They have rough edges which allow them to render images better. The implementation of DWT is very easy and it also reduces the resources required along with computation time. In this process, an input signal is allowed to pass through filters having different cut-off frequencies at the different scale. We can observe 2D-DWT as 1-D wavelet transforming along rows and then along columns. At first, processing of rows with one level of decomposition results in the division of array into two vertical halves [35]. The first half stores the average coefficient whereas the detail coefficient is stored in the second half. Then, this process is iterated for column also. This results into four sub-bands.
2.3 Saliency detection through spectral residual
We have used the method proposed by Hou and Zhang [36] for saliency detection. From the context of information theory, effective coding disintegrates the image information H (Image) into two parts:
Novelty part is denoted by F (Innovation), whereas F (Prior Knowledge) denotes the redundant data which is required to be concealed using coding. In image statistic fields, such redundancies resemble the invariant properties of the environment. These characteristics have been discussed in literature pertaining to natural image statistics [37,38,39,40].Thus, natural images follow predictable distributions. They are not random. The spectral residual contains the innovation part of an image [36].
2.4 The central orientation (θ C ) estimation and image restoration
The proposed system has been created as arbitrary rotation invariant by using the central orientation information. Radon transform (RT) is used to estimate this information [21]. The estimation process of θ C using RT is as follows:
-
1.
From the input image crop out the circular region with center (i.e., input image center) and radius 64 grids [21]. Let it say 2-D function f(x, y) as shown in Fig. 2. This function has been used to calculate the RT (R f (p, ∅)) with the limit of 0 ≤ ∅ ≤ 2π.
Fig. 2 
Radon transform (R(p, ∅)) of f(x, y)
-
2.
Let us consider a reference point i in the p axis with the small range [i − τ, i + τ] as shown in Fig. 2. Now, θ c is calculated as in Eq. (3)
$$ {\theta}_C={ \arg}_{\varnothing } \max {\displaystyle \sum_{p= i-\tau}^{p= i+\tau}}{R}_f\left( p,\varnothing \right),\ \varnothing \in \left(0,2\pi \right) $$(3)

The rotation operation changes the content locations, hence difficult to handle in image hashing techniques [24]. The content location may be readjusted into the original one by using the knowledge of central orientation information, i.e., θ C , which makes the proposed image hashing method rotation invariants. Let us consider that the transmitted image has central orientation θ c . If the transmitted image has been rotated by an angle α and received at the receiver end, then the received image central orientation also rotate with the same angle, i.e., θ c ' = θ C + α [21]. Hence, an angle of rotation of received image can be obtained, and received image may be perceptually similar to transmitted image by anti-rotating the received image by an angle α.
2.5 Proposed algorithm in details
Input: Initially image is taken as input.
2.5.1 Pre-processing
This step involves the conversion of an image into a fixed size and scale (i.e., 256 × 256). This is done to reduce the computation complexity which may arise while applying various methods. Low pass filter has been used to improve the image quality.
2.5.2 Global feature extraction using DWT-SVD
-
1.
The rescaled image obtained from the previous step is then converted into HSV color space [41], and V components have been used for further processing.
-
2.
Four-level 2D-DWT is applied on V components of an image.
-
3.
Only the coefficients corresponding to the low frequencies band are used for further processing, and all other values are discarded. These values are saved together in a matrix C (size 16 × 16).
-
4.
This matrix C is then used to form secondary image J.
-
5.
SVD is applied on image J. Then first right and left singular values are obtained and stored as a vector γ (length of γ is 32 digits).
-
6.
We, finally, use the secret key K 1 for encryption and obtain our first intermediate hash, m (length of m is Z = 32 digits) as discussed: Let generates the pseudo random number of length same as first intermediate hash (m) length by using a fixed seed value (i.e., secret key K 1). Next, sorted the generated number and the original position has been stored in an array W. According to position of array W, the generated hash will be scrambled as in (4) [24]
Here, W [i] represents, ith value sorted array position (1 ≤ i ≤ Z). Finally, the first intermediate hash, m is given as in (5)
2.5.3 Local feature extraction based on saliency detection using a spectral residual model
-
1.
Amplitude B(f) of the averaged Fourier spectrum of an ensemble of the natural image is calculated.
-
2.
Log spectrum L(f) from the down-sampled image is obtained as in (6)
$$ L(f)= \log \left( B(f)\right) $$(6) -
3.
The general shape of log spectra is denoted by E(f). It is given as prior information.
-
4.
Approximation of shape of E(f) is done by adopting a local filter g q (f).
-
5.
Average spectrum E(f) is given as:
$$ E(f)={g}_q(f)* L(f) $$(7)where ‘*’ denotes convolution and g q is a q × q matrix (i.e., 3 × 3) given as
$$ {g}_q(f)=\frac{1}{q^2}\left(\begin{array}{ccc}\hfill 1\hfill & \hfill \cdots \hfill & \hfill 1\hfill \\ {}\hfill \vdots \hfill & \hfill \ddots \hfill & \hfill \vdots \hfill \\ {}\hfill 1\hfill & \hfill \cdots \hfill & \hfill 1\hfill \end{array}\right) $$ -
6.
The spectral residual R(f) is given by
$$ R(f)= L(f)- E(f) $$(8) -
7.
Construction of output image in the spatial domain is done by using inverse Fourier transform. This output image is nothing else but saliency map.
-
8.
Saliency map is further smoothened by Gaussian filter β(f).
-
9.
Thus final saliency map is given as
$$ S(f)=\beta (f)*{F}^{-1}{\left[ \exp \left( R(f)+ A(f)\right)\right]}^2 $$(9) -
10.
A feature vector is formed accumulating the position vectors, p (i.e., circumscribed rectangle corner coordinates and size) and texture vectors, t (i.e., coarseness, contrast, skewness, and kurtosis) of each salient objects [3].
F − 1 is inverse Fourier transform and A(f) is phase spectrum of an image which is to be calculated during the process. The salient regions are found using thresholding (we have considered three times of mean of S(f)) the saliency map. For example, we have shown (a) an original image, (b) saliency map, (c) salient regions, and (d) salient objects using red circumscribed rectangles in Fig. 3.
Fig. 3 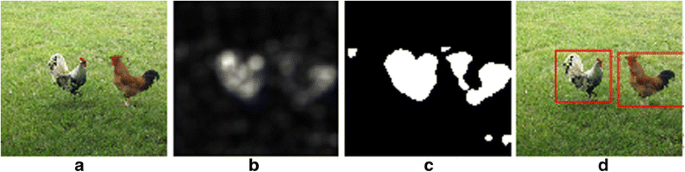
Saliency detection using spectral residual: a an original image, b the saliency map, c salient regions after thresholding, and d two largest connected salient regions are marked with red circumscribed rectangles.
-
11.
Using the encryption method as previously described (2.5.2(6)) the second secret key K 2 is used on this feature vector and second intermediate image hash, n = [p t] (n of length 48 digits) is obtained.

2.5.4 Final hash
-
1.
The two intermediate hash (m and n) obtained from steps 2.5.2 and 2.5.3 are concatenated to form h.
-
2.
Next, using the encryption method as in case of m and n (2.5.2(6) and 2.5.3(11)), the third secret key K 3 is used to obtain the image hash, h = [m n] (h of length 80 digits)
-
3.
Finally, the additional information (θ c ) is being added with the h to create a final hash h θ = [h θ C ]
Output. Final hash, h θ = [m n θ C ]
2.6 Parameter for performance analysis
For evaluating the result, we have used normalized hamming distance [12]. Hamming distance between hashes is calculated, and it is normalized with respect to the length (L) of the hash. It can be defined as follows:
Here h and h′ are image hashes of transmitted and received images, whereas L is the length of image hash. The normalized hamming distance D should be less than the threshold (δ) in content-preserving operations (i.e., robustness), greater than the threshold in image forgery and different image contents (i.e., sensitivity/discrimination).
3 Image authentication
The proposed system in image authentication application (shown in Fig. 4) has been explained as follows: Let, the receiver has a hash (i. e., h θ = [h θ C ]) along with the received image, which is transmitted from the sender. While testing for authentic or forged/different image, and also to localize the forged region, the receiver calculates the central orientation information (θ c ') from the received image. Then, finds the difference of θ c ' and θ c , i.e., α = θ c ' − θ c . If α is zero, there is no rotation of received image, then find the image hash (h′) using the proposed image hashing technique as discussed in Section 2. Otherwise, the image is anti-rotated and an image hash (h′) is found after restoration as shown in Fig. 4. Next, the normalized hamming distance (D) has been calculated between received hash (h) and generated hash (h′) at the testing time. If D is greater than the predefined threshold δ,, then the received image is either different or forged (tampered). Otherwise, it is an authentic one.

Depict the image restoration and authentication
3.1 Tamper localization
In order to discriminate between the different and tampered image, to localize the tampered regions in the case of tampered image, saliency region information has been used. In the case of tampering (i.e., a small region is added/deleted or copy-move) in the received image, the salient regions in the transmitted and received image will be different. This idea has been used to localize the tampered regions as shown in Fig. 5.

Flowchart for tampered area localization
Let consider, p = [p 1 p 2 p 3 … p 6] from h (after decomposing h into constructed elements as discussed in Section 2.5, i.e., h = [m n] = [m p t]) and \( {\mathbf{p}}^{\mathbf{\prime}}=\left[{\mathbf{p}}_1^{\boldsymbol{\hbox{'}}}\ {\mathbf{p}}_2^{\hbox{'}}\ {\mathbf{p}}_3^{\hbox{'}}\dots {\mathbf{p}}_6^{\boldsymbol{\hbox{'}}}\right] \) from h ’ where p i = [x i y i w i h i ], x i and y i are corner coordinates, w i and h i are width and height, of a circumscribed rectangle of ith salient region. It has been experimentally observed that 96% of 2800 images has the number of salient regions less than six, only a few of the images has larger than it (for example, shown in the second and third columns of Table 5 in the result Section 4.3). Hence, the six largest salient regions are selected for position vector calculation. There may be unequal salient regions in the transmitted and received images. Consider an example of an original (transmitted) image with two salient regions and four in the received one, then the position vectors for each image are p = [p 1 p 2 0 0 0 0] and\( {\mathbf{p}}^{\mathbf{\prime}}=\left[{\mathbf{p}}_1^{\boldsymbol{\hbox{'}}}\ {\mathbf{p}}_2^{\hbox{'}}\ {\mathbf{p}}_3^{\hbox{'}}\ {\mathbf{p}}_4^{\boldsymbol{\hbox{'}}}\ 0\ 0\right] \), respectively (i.e., the position vector of missing salient regions are considered to be zero). In this case, regions 1 and 2 between transmitted and received image (i.e., \( {\mathbf{p}}_1,{\mathbf{p}}_1^{\boldsymbol{\hbox{'}}} \) and \( {\mathbf{p}}_2,\kern0.5em {\mathbf{p}}_2^{\boldsymbol{\hbox{'}}} \) respectively) may be exact matching regions (i.e., the difference between mean values of position vector for corresponding regions are less than T ', where T ' = 2 selected empirically from the experiment on 800 tampered image pairs taken from CASIA V2.0 tampered image database [42]). The regions 3 and 4 (i.e., \( {\mathbf{p}}_3^{\boldsymbol{\hbox{'}}} \) and \( {\mathbf{p}}_4^{\boldsymbol{\hbox{'}}} \) respectively) may have been inserted by an adversary in the received image. These two mismatched/inserted regions will be highlighted in the received image (for example, shown in Fig. 6). If the number of salient regions in the transmitted image will be greater than the received one, it may be a deletion case and the deleted region will be highlighted in the received image (for example, shown in the first and second rows of Table 5). Pseudocode for tampered area localization using p and p′ is given in Table 1.

Illustration of tampered localization: a an original (transmitted) image, b a received (maliciously tampered) image, and c localization of tampered region by blue rectangle
4 Performance analysis
4.1 Threshold detection (δ) for performance analysis
The threshold value (i.e., the normalized hamming distance of image hash vectors) for the image authentication (i.e., classification of received images either perceptually similar, forged or different images to original ones) application may be determined as follows: Let us consider 53 color images from USC-SIPI database [43], and create a database of 53 × 76 = 4028 perceptually similar image pairs by using StirMark 4.0 [44], Matlab, and Photoshop with different content-preserving operations according to parameters shown in Table 2. Then the normalized hamming distance between the original image and the digitally manipulated images are calculated using the proposed system. The histogram of the normalized hamming distance is shown in Fig. 7.

The histogram of the normalized hamming distance for perceptual similar image pairs
Now, we have collected a set of 170 different images (where 70 from ground truth database [45] and 100 from the internet) (that consists 170 × (170 − 1)/2 = 14, 365 image pairs). Then, calculated the normalized hamming distances for total 14, 365 image pairs using the proposed system, and the histogram of experimental results are shown in Fig. 8. It can be observed from Fig. 7 that the highest normalized hamming distance between original image and images followed by content-preserving operation is almost 0.18. Next, Fig. 8 shows that the lowest normalized hamming distance of original image and the different one is almost 0.2. Empirically from Figs. 7 and 8, the desired normalized hamming distance (i.e., threshold distance) for robustness and discrimination analysis is 0.18.

The histogram of the normalized hamming distance for different image pairs
Criteria for a better image hashing algorithm is that the hash distance of an original image with a digitally manipulated one should be less than the predetermined threshold (i.e., robustness). Moreover, the hash distance of the original image with a forged and different one should be greater than the predetermined threshold (i.e., sensitivity/discrimination).
4.2 Robustness analysis
Robustness concentrates on non-malicious activities. An image should be resistive to few operations. When it is attacked by some content-preserving actions or geometric attacks, the image hash should remain the same as it was prior to the attack. Five sample images from USC-SIPI database (i.e., Baboon, Lena, Airplane, Car, and Peppers) are shown in Fig. 9. The content-preserving operation shown in Table 2 has been applied to these sample images, and hence it generates 5 × 76 = 380 image pairs. The normalized hamming distance is being calculated by using the proposed method and the results are shown in Fig. 10.

Standard benchmark images. a Baboon. b Lena. c Airplane. d Car. e Pepper

a–i Perceptual robustness results
From Fig. 10a, it can be observed that all the normalized hamming distances are less than the predetermined threshold distance, i.e., 0.18. It can also be observed that for ±20 Photoshop scale the normalized hamming distance is larger as compared to that for Photoshop scale of ±10. It may be due to the pixel values of the image slightly more disturbed with ±20 Photoshop scale. The SVD coefficients of an image may slightly vary with these changes. It can also be observed that for same Photoshop scale the normalized hamming distances are different. The reason may be a variation of color sensitivity of image contents. But for the Photoshop scale range [−20 +20], all the normalized hamming distances are less than the selected threshold; hence, the proposed method is robust to brightness adjustments.
Figure 10b shows that the normalized hamming distances in case of contrast adjustment with Photoshop scale values of ±10 and ±20 are smaller than the selected threshold, i.e., 0.18. Hence, the proposed method is robust against contrast adjustment. Figure 10c, d shows that the maximum normalized hamming distance is 0.140 and 0.142, which is less than the pre-selected threshold. Hence, the proposed image hashing is insensitive to gamma correction and Gaussian low pass filtering. From Fig. 10e, f, it can be observed that as the density of noise increases, the normalized hamming distance also proportionally increases. The reason may be the high-density noise includes some more pixel values so that the SVD coefficients may get disturbed slightly. But, all the normalized hamming distances are still less than the predetermined threshold.
From Fig. 10g, it can be observed that as the watermark embedding strength increases the normalized hamming distances approach towards threshold distance. The reason may be the higher strength watermark slightly disturbed the SVD coefficients. But, all the normalized hamming distances are below the selected threshold. Figure 10h, i shows that all the normalized hamming distances are less than the predetermined threshold. Hence, the proposed method is robust against scaling and JPEG compression.
One of the content-preserving operations (i.e., rotation of image) has not been discussed till now. It is observed from the literature review that the rotation operation is difficult to handle in image hashing techniques [21]. We have used central orientation information, θ C in the proposed method to take care of this issue as discussed in Section 2.4. Table 3 shows the experimental results of θ C , \( {\theta}_c^{\hbox{'}} \), and α at the different angle of rotation. Table 3 also shows the normalized hamming distance for Lena image.
The normalized hamming distance for five sample images in the case of the different degrees of rotation is shown in Fig. 11. From Fig. 11, it can be observed that the normalized hamming distances for 60 pairs of rotated images are less than the selected threshold. Hence, the proposed method is completely rotation invariant without leaving any information during hash generation.

Results in case of rotation
Now, 53 images from the USC-SIPI database (in which 37 color images from “Aerial” and 16 color images from “Miscellaneous”) have been considered for content-preserving operations using the proposed method. All the operations which are given in Table 2 have been applied to all the 53 images, so a total of 53 × 76 = 4024 pairs of visually similar image database has been created for experiments. The experimental result using 4024 pairs of the visually similar image are shown in Table 4. It can be observed from Table 4 that mean hash distances of all content-preserving operations are less than the selected threshold value. Hence, the proposed method is robust to content-preserving operations.
4.3 Analysis of sensitivity towards malicious attacks (forgery) and its localization
When the images are maliciously attacked by the operations like insertion, deletion, and copy-move, it may lead perceptually different images [11, 12]. These images are said to be tampered ones. The use of tampered images in some fields like forensic evidence, scientific discovery, and official media, may produce a serious impact on many aspects of the society. The scheme, tampering detection recognize the integrity of digital multimedia data [46]. Since tampering generates a perceptually different image, therefore image hash of tampered images should be different from original ones. Further, we carried out the experiment to see the result of our algorithm towards malicious activities and verification for locating forged areas (discussed in Section 3.1) by using CASIA V2.0 tampered image database [42] with 800 selected image pairs. For example, some tampered image pairs and their experimental results are shown in Table 5. The minimum, maximum, and mean normalized hamming distances for 800 tampered image pairs are shown in Table 6. It can be observed from Tables 5 and 6 that all the normalized hamming distance is far away from the selected threshold. Hence, the proposed image hashing is sensitive to image tampering.
The proposed method has also located the tampered area in case of tampering, shown in Table 5 (the blue rectangle in the fourth column). It can be observed from the first and second rows of Table 5 that the salient objects 2 and 3 have been deleted in the received image (third column). These have been successfully detected and located by a blue rectangle in the fourth column using the proposed method. Similarly, the added objects (6 and 2 in the third and fourth rows), and copy-move objects (2 and (3, 4) in the fifth and sixth rows) have also been located in the fourth column, respectively. Finally, from the last two rows, it can be observed, in the case of different image pairs, there are no exactly matched salient regions. In the case of different image pairs, the exact salient region matching is almost zero. It has been verified using 500 different image pairs taken from the USC-SIPI and CASIA databases. Hence, the proposed image hashing method may accurately locate the forged area, which is a limitation of some state-of-the-art methods [2, 12, 16, 24].
4.4 Result analysis of image forgery (image corner changes)
We have selected 53 color images from the USC-SIPI database [43] and forged by deleting corner information (i.e., by using Photoshop), hence, creating 50 forged image pairs. The experimental results for some sample pairs are shown in Table 7.
Table 7 shows that the hash distance is greater than the selected threshold. Some of the state-of-art-methods (i.e., based on SIFT [21], and Ring partition and invariant vector [24]) are robust to arbitrary rotation but limited in the case of corner changes. It can be observed from Table 8 that the mean hash distance is greater than the selected threshold. Hence, the proposed method is able to detect the corner forgery in images.
4.5 Discrimination capability
To check the discrimination capability of the proposed system, we have selected 170 different images (that consists 70 from ground truth database [45] and 100 from the internet). The normalized hamming distance has been obtained for total 170 × (170 − 1)/2 = 14, 365 image pairs. The minimum, maximum, and mean normalized hamming distances are shown in Table 9. It can be observed from Table 9 that the mean normalized hash distance is far away from the selected threshold. Hence, the proposed system has good discrimination capability.
4.6 Result analysis for key dependence of the proposed hashing technique
The protection of hash is essential so that an adversary cannot access it. It has been done by using pseudo random generator process. The hash has been protected using three different places as shown in Fig. 1. The three keys K 1, K 2, and K 3 have been used to protect m, n, and h of length 32, 48, and 80, respectively. Hence, the permutation required to breach the hash is 32 ! ≅ 2.63 × 1035, 48 ! ≅ 1.24 × 1061, and 80 ! ≅ 7.16 × 10118, respectively. Let, a hash (h) (generated using the proposed method using three keys K 1 = 4, K 2 = 5, and K 3 = 6) along with the image is transmitted to the receiver side. All the keys may be sent in three separate secure channels. An adversary may not guess the transmitted hash without having all three keys. Although an adversary may have one or two keys out of the three keys, nevertheless, it will be about impossible to extract hash. It has been discussed as follows.
Case 1: Let, an adversary knows K 2 = 5, K 3 = 6, but does not know K 1 and uses different key \( {K}_1^{\hbox{'}}=10 \), then the normalized hamming distance between hash is 0.5575, which is far away than the selected threshold (i.e., 0.18) (for example, used Lena image). It may be due to position changes (for example, 18, 1, 31, and 8 in the transmitted first intermediate hash have been changed to 26, 6, 1, and 30 in the receiver side) of first intermediate hash as shown in Table 10.
Similarly, let, an adversary knows K 1 = 4, K 3 = 6, but does not know K 2 and uses different key \( {K}_2^{\hbox{'}}=8 \). The hash distance is 0.5312. It may be also due to the positioning changes of second intermediate hash. Finally, let, an adversary uses K 1 = 4, K 2 = 5, but does not know K 3 and uses different keys \( {K}_3^{\hbox{'}}=7-120 \) (used 114 different keys). The hash distance between hash pairs using original keys (K 1 = 4, K 2 = 5, and K 3 = 6) and different keys (K 1 = 4, K 2 = 5, and \( {K}_3^{\hbox{'}}=7-120 \)), keeping the input image (Lena) and other algorithm parameters fixed, is shown in Fig. 12. It can be observed from Fig. 12 that same hash vector cannot be generated without knowledge of seed value (K 3) (i.e., hash distances are large for different seed values). Figure 12 shows that first value is zero because we have used the same seed value again and the proposed method has generated the same hash. Hence, it may be inferred that all three keys (exactly same to the transmitted one) are essential to generate the similar hash as transmitted. This enhances the security of the proposed method.

Distance between hashes using a different key
We have selected 53 images from USC-SIPI database and the hash distance with 114 different keys has been calculated. The experimental results for 53 × 114 = 6042 image pairs for the third case (uses a different key, \( {K}_3^{\hbox{'}} \)) are shown in Table 11. It can be observed from Table 11 that the mean hash distance is far away from selected threshold. Hence, the proposed method hash is secure.
4.7 Selection of color space for image hashing
The different color model with keeping other parameters of the proposed algorithm constant has been used in the proposed model and drawn the ROC as shown in Fig. 13. It can be observed from Fig. 13 that HSV color space performance is better (i.e., high TPR with low FPR) as compared to other color models. The CIELab color model follows the HSV color model. The HSI and YCbCr color model performance is followed by the HSV and CIELab models. We have selected the HSV color model in the proposed image hashing due to its satisfactory performance as compared to other given color model.

Receiver operating characteristic for color selection
4.8 The result analysis with a modified approach using LWT in the proposed method
We have done experiments with the same image set for robustness and discrimination by replacing DWT with LWT keeping other parameters same as in the proposed algorithm. It has been observed that the experimental results with a modified approach are comparable to the proposed method, but computational cost is a little bit small (approximately 0.2312 s less time required to generate an image hash). However, the future work may be to construct the image hash by combining the vectors from the different band of LWT and may try to use different types of wavelets for LWT.
5 Comparisons
We have compared our proposed algorithm with some state-of-the-art methods shown in Table 12. We have chosen SVD-SVD image hashing by Kozat [16], Fourier transform-based image hashing by Swaminathan [12], randomized signal processing-based image hashing by Venkatesan [6], Ring partition and NMF-based hashing by Tang [2], Zernike moment and shape-texture-based hashing [3], and ring partition and invariant vector-based [24] image hashing for comparison. We preferred to select the same images for performance analysis by all hashing to avoid any biased testing. All images were resized to 256 × 256 before generating a hash. The visualization of the performance of image hashing is better represented by receiver operating characteristic (ROC), which is shown in Fig. 14. Figure 14 is plotted with the parameters true positive rate (TPR) and false positive rate (FPR) on the abscissa and ordinate, respectively. TPR and FPR are defined as follows:

Receiver operating characteristic for performance comparison
The criteria for better image hashing is that it should have high TPR with low FPR. It can be observed from Fig. 14 that the proposed method satisfies the required criteria.
It can be observed from Table 12 that the image hashing techniques [3, 6, 12, 16] can detect the corner forgery, but are sensitive to large angle rotation. The image hashing techniques [2, 24] are invariant to large angle rotation, but are unable to detect the corner forgery in images. Table 12 shows that the proposed method detects the corner changes as well as invariant to large angle rotation. Table 12 shows that the methods [2, 12, 13, 24] cannot specify the location of forgery. The methods [3, 6] can find forged locations, but due to the sensitivity to large angle rotation TPR is low (i.e., 0.9534 and 0.6374). It can also be observed from Table 12 that the proposed method TPR is highest (i.e., 0.9923) compared to the existing methods with low FPR (i.e., 0.005). The proposed method sensitivity to content changes is comparable to some of the existing methods shown in Table 12. The average time taken for generation of image hash of the proposed method is less to the methods in [2, 3, 6, 12], but little higher to methods in [16, 24]. Apart from all this, use of three security keys K 1, K 2, and K 3 makes the method secure and collision resistant as described in Section 4.6.
6 Conclusions
In this paper, we have proposed an image hashing algorithm which is based on DWT-SVD and spectral residual method. In this method, DWT-SVD were used to extract global features of image and saliency region was detected using the spectral residual model which further yield local features. This algorithm shows better results compared to some state-of-the-art methods. It generates secure and robust image hash. The experimental results showed that the proposed method is robust against content-preserving operations like rotation, scaling, JPEG compression, brightness adjustment, contrast adjustment, and gamma correction, and is sensitive towards malicious activities like deletion, insertion, and replacement. Moreover, it has also located the forged area in forged images. The experimental results also showed sensitivity towards corner forgery of the proposed method along with invariants to an arbitrary rotation. The proposed image hashing may not detect color forgery and is also sensitive to translation, which may be enhanced in the future work.
Abbreviations
- DCT:
-
Discrete cosine transform
- DWT:
-
Discrete wavelet transform
- LWT:
-
Lifting wavelet transform
- MD:
-
Message digest
- NMF:
-
Non-negative matrix factorization
- SHA:
-
Secure hash algorithm
- SVD:
-
Singular value decomposition
References
MN Wu, CC Lin, CC Chang, Novel image copy detection with rotating tolerance. J Syst Softw 80(7), 1057–1069 (2007)
Z Tang, X Zhang, S Zhang, Robust perceptual image hashing based on ring partition and NMF. IEEE Trans Knowl data Eng 26(3), 711–724 (2014)
Y Zhao, S Wang, X Zhang, H Yao, Robust hashing for image authentication using Zernike moments and local features. IEEE Trans Inf Forensics Sec 8(1), 55–63 (2013)
M Kociołek, A Materka, M Strzelecki, P Szczypiński, Discrete wavelet transform-derived features for digital image texture analysis (International Conference on Signals and Electronic Systems, Lodz, Poland, 2001), pp. 163–168
M Schneider, SF Chang, A robust content based digital signature for image authentication, in IEEE Int. Conf. Image Processing, 1996, pp. 227–230
R Venkatesan, S-M Koon, MH Jakubowski, P Moulin, Robust image hashing, in IEEE Int. Conf. Image Processing, 2000, pp. 664–666
F Ahmed, MY Siyal, VU Abbas, 5, A secure and robust hash-based scheme for image authentication. Signal Proc 90(5), 1456–1470 (2010)
V Monga, BL Evans, Perceptual image hashing via feature points: performance evaluation and tradeoffs. IEEE Trans Image Proc 15(11), 3452–3465 (2006)
V Monga, A Banerjee, BL Evans, A clustering based approach to perceptual image hashing. IEEE Trans Inf Forensics Sec 68(1), 79 (2006)
J Fridrich, M Goljan, IEEE Int. Conf. Inf. Technology Coding and Computing, 2000, pp. 178–183. Robust Hash Functions for Digital Watermarking
CY Lin, SF Chang, A robust image authentication system distinguishing JPEG compression from malicious manipulation. IEEE Trans Circ Syst Vid Tech 11(2), 153–168 (2001)
A Swaminathan, Y Mao, M Wu, Robust and secure image hashing. IEEE Trans Inf Forensics Sec 1(2), 215–230 (2006)
G Laimer, A Uhl, Key-dependent JPEG2000-based robust hashing for secure image authentication. EURASIP J Inf Secur 1, 1 (2008)
X Lv, W ZJane, An extended image hashing concept: content-based fingerprinting using FJLT. EURASIP J Inf Secur 1, 1 (2009)
S Xiang, Y Jianquan, Block-based image hashing with restricted blocking strategy for rotational robustness. EURASIP J Adv Sig Proc 1, 1–13 (2012)
SS Kozat, R Venkatesan, MK Mihcak, Robust perceptual image hashing via matrix invariants, in IEEE Int. Conf. Image Processing, 2004, pp. 3443–3446
V Monga, MK Mihcak, Robust and secure image hashing via non-negative matrix factorizations. IEEE Trans Inf Forensics Sec 2(3), 376–390 (2007)
Z Tang, S Wang, X Zhang, W Wei, S Su, Robust image hashing for tamper detection using non-negative matrix factorization. J Ubiquitous Convergence Tech 2(1), 18–26 (2008)
L-W Kang, C-S Lu, C-Y Hsu, Compressive sensing-based image hashing, in IEEE Int. Conf. Image Processing, 2009, pp. 1285–1288
Z Tang, S Wang, X Zhang, W Wei, Y Zhao, Lexicographical framework for image hashing with implementation based on DCT and NMF. Multimed Tools Appl 52(2–3), 325–345 (2011)
X Lv, Z Jane Wang, Perceptual image hashing based on shape contexts and local feature points. IEEE Trans Inf Forensics Sec 7(3), 1081–1093 (2012)
Z Tang, Y Dai, X Zhang, Perceptual hashing for color images using invariant moments. Appl Math Inf Sci 6((2S), 643S–650S (2012)
Z Tang, X Zhang, L Huang, Y Dai, Robust image hashing using ring-based entropies. Signal Process 93(7), 2061–2069 (2013)
Z Tang, X Zhang, X Li, S Zhang, Robust image hashing with ring partition and invariant vector distance. IEEE Trans Inf Forensics Sec 11(1), 200–214 (2016)
R Sun, W Zeng, Secure and robust image hashing via compressive sensing. MultimedTools Appl 70(3), 1651–1665 (2014)
X Wang, K Pang, X Zhou et al., A visual model-based perceptual image hash for content authentication. IEEE Trans Inf Forensic Sec 10(7), 1336–1349 (2015)
J Ouyang, G Coatrieux, H Shu, Robust hashing for image authentication using quaternion discrete Fourier transform and log-polar transform. Digital Signal Process 41, 98–109 (2015)
YN Li, P Wang, YT Su, Robust image hashing based on selective quaternion invariance. IEEE Signal Proc Lett 22(2), 2396–2400 (2015)
CP Yan, CM Pun, XC Yuan, Multi-scale image hashing using adaptive local feature extraction for robust tampering detection. Signal Proc 121, 1–16 (2016)
C Qin, X Chen, D Ye et al., A novel image hashing scheme with perceptual robustness using block truncation coding. Inf Sci 361, 84–99 (2016)
Z Tang, L Huang, X Zhang et al., Robust image hashing based on color vector angle and canny operator. Int J Electron Comm 70, 833–841 (2016)
R.A.P Hernandez; M.N. Miyatake; B.N. Kurukoski, Robust Image Hashing Using Image Normalization and SVD Decomposition, In Circuits and Systems (MWSCAS), IEEE 54thInternational Midwest Symposium, 2011, Seoul, Korea, pp. 1-4
S Noushath, R Ashok, G Hemanth Kumar, SVD based algorithms for robust face and object recognition in robust vision application (automation and robotics in construction (Symposium, IIT Madras, India, 2007), pp. 473–477
YS Bute, RW Jasutkar, Implementation of discrete wavelet transform processor for image compression. Int J Comp Sci Netw 1(3), 1–5 (2012)
D Gupta, S Choubey, Discrete wavelet transform for image processing. Int J EmergTechnol Adv Eng 4(3), 598–602 (2015)
X Hou, L Zhang, Saliency detection: a spectral residual approach, in IEEE Int. Conf. Computer Vision and Pattern Recognition, 2007, pp. 1–8
J Gluckman, in computer vision and pattern recognition (CVPR), in IEEE Int. Conf. on. Higher Order Whitening of Natural Images, 2005, pp. 254–360
A van der Schaaf, J van Hateren, Modelling the power spectra of natural images. Stat Inf Vis Res 36(17), 2759–2770 (1996)
D Ruderman, The statistics of natural images. Netw Comput Neural Syst 5(4), 517–548 (1994)
D Ruderman, Origins of scaling in natural images. Vis Res 37(23), 3385–3395 (1997)
Z Tang, X Li, J Song, M Wei, X Zhang, Color space selection in image hashing: an experimental study. IETE Tech Rev 33(4), 1–8 (2016)
Dong, Jing, and Wei Wang. CASIA tampered image detection evaluation database. (2011). [Online] Available: http://forensics.idealtest.org.
U. SIPI, USC-SIPI Image Database, [online] Available: http://sipi.usc.edu/database/, 2007
FAP Petitcolas, Watermarking schemes evaluation. IEEE Signal Proc Mag 17(5), 1–4 (2000)
Ground Truth Database, [online] Available: http://imagedatabase.cs.washington.edu/groundtruth/. Accessed 8 May 2008.
M Mishra, MC Adhikary, Digital image tamper detection techniques: a comprehensive study. Int J Computer Sci Bus Inform 2, 1–12 (2013)
Acknowledgements
The authors would like to acknowledge people of Speech and Image Processing Laboratory, National Institute of Technology Silchar, India, for providing support and necessary facilities for carrying out this work. The authors are thankful to Mr. Amarjit Roy and Mr. Mohiul Islam, PhD Scholar, Department of Electronics and Communication Engineering, for their constructive criticism and suggestions.
Funding
This research work was not funded by any organization/institute/agency.
Authors’ contributions
RKK carried out the study and implementation of DWT-SVD (and LWT-SVD), participated in the sequence alignment and drafted the manuscript. RHL carried out the study and implementation of orientation information and color space selection. Aditi carried out the study and implementation of a spectral residual method.
Competing interests
The authors declare that they have no competing interests.
Publisher’s Note
Springer Nature remains neutral with regard to jurisdictional claims in published maps and institutional affiliations.
Author information
Authors and Affiliations
Corresponding author
Rights and permissions
Open Access This article is distributed under the terms of the Creative Commons Attribution 4.0 International License (http://creativecommons.org/licenses/by/4.0/), which permits unrestricted use, distribution, and reproduction in any medium, provided you give appropriate credit to the original author(s) and the source, provide a link to the Creative Commons license, and indicate if changes were made.
About this article

Cite this article
Karsh, R.K., Laskar, R.H. & Aditi Robust image hashing through DWT-SVD and spectral residual method. J Image Video Proc. 2017, 31 (2017). https://doi.org/10.1186/s13640-017-0179-0
Received:
Accepted:
Published:
DOI: https://doi.org/10.1186/s13640-017-0179-0