
Abstract
Background
Areas with saline soils are sparsely populated and have fragile ecosystems, which severely restricts the sustainable development of local economies. Zoysia grasses are recognized as excellent warm-season turfgrasses worldwide, with high salt tolerance and superior growth in saline-alkali soils. However, the mechanism underlying the salt tolerance of Zoysia species remains unknown.
Results
The phenotypic and physiological responses of two contrasting materials, Zoysia japonica Steud. Z004 (salt sensitive) and Z011 (salt tolerant) in response to salt stress were studied. The results show that Z011 was more salt tolerant than was Z004, with the former presenting greater K+/Na+ ratios in both its leaves and roots. To study the molecular mechanisms underlying salt tolerance further, we compared the transcriptomes of the two materials at different time points (0 h, 1 h, 24 h, and 72 h) and from different tissues (leaves and roots) under salt treatment. The 24-h time point and the roots might make significant contributions to the salt tolerance. Moreover, GO and KEGG analyses of different comparisons revealed that the key DEGs participating in the salt-stress response belonged to the hormone pathway, various TF families and the DUF family.
Conclusions
Zoysia salt treatment transcriptome shows the 24-h and roots may make significant contributions to the salt tolerance. The auxin signal transduction family, ABA signal transduction family, WRKY TF family and bHLH TF family may be the most important families in Zoysia salt-stress regulation.
Background
Soil salinization is a worldwide problem. Areas with saline soils are sparsely populated and have fragile ecosystems, which severely restricts the sustainable development of local economies. As an important part of landscaping, turf plays an important role in protecting, improving and beautifying urban environments. Therefore, it is particularly important to choose high-quality salt-tolerant turfgrass suitable for landscaping in areas with saline soils. Zoysia Willd. is a genus of perennial plants belonging to the family Poaceae, subfamily Chloridoideae, tribe Zoysieae [51]. Zoysia grasses are recognized as excellent warm-season turfgrasses worldwide; they are with salt tolerant, hardy, and drought tolerant and are widely used in athletic fields, home lawns and parks [10]. Compared with other Poaceae family members, Zoysia grasses have received less attention in the research community. However, as an alternative grass species for landscaping in saline-alkali soil, Zoysia has superior growth qualities [26]. In particular, among the three most important commercial species, Zoysia japonica Steud. is distinctly tolerant to abiotic stress [51]. Therefore, studying the salt tolerance of Zoysia plants is highly important.
Previous studies on salt tolerance of Zoysia mainly focused on the evaluation of salt tolerance and the physiological mechanisms governing salt tolerance. Salt tolerance evaluations have shown that the salt tolerance of Zoysia plants has rich genetic variation [25, 35, 40, 57]. This variation makes for convenient selection of materials with contrasting salt tolerances for studying the salt tolerance mechanism of Zoysia. Zoysia plants secrete salt; all Zoysia plant leaves have salt glands that regulate ion balance by selectively secreting salt ions. The salt tolerance of Zoysia plants is positively correlated with the rate of Na+ secretion from salt glands in leaves and the density of salt glands per unit leaf area [21, 22, 33]. Moreover, previous studies have shown that the salt tolerance of Zoysia is negatively correlated with the content of Na+ and positively correlated with the content of K+ in the leaf fluid. Salt-tolerant materials have a strong ability to maintain the K+/Na+ ratio in their leaves and roots. The Na+ content in leaves has been successfully used to evaluate the salt tolerance of Zoysia [25, 33, 34].
The salt tolerance of Zoysia is a very important trait, but to date, its molecular regulatory mechanism remains unknown. The Na+/H+ antiporter gene ZjNHX1, which belongs to the plant NHX-gene family, was cloned from Z. japonica, and studies have shown that ZjNHX1 plays an important role in ion homeostasis and salt tolerance [9]. In addition, the glycine-rich RNA-binding protein-coding gene ZjGRP was isolated from Z. japonica and was strongly induced by NaCl treatment. ZjGRP-overexpressing Arabidopsis thaliana plants present low germination rates, slow seedling growth and poor salt tolerance [50]. ZjZFN1 is a C2H2-type zinc finger protein-coding gene that is expressed more in leaf tissues than in root and stem tissues, and its expression is induced by salt, cold and abscisic acid (ABA) treatments. Overexpressing ZjZFN1 in A. thaliana can improve seed germination and increase salt tolerance by improving the transcriptional activities of several salt-tolerance-related genes under salt stress [49].
Studies on the salt tolerance genes of Zoysia are scarce. However, using a full-length cDNA expression library in yeast, Chen et al. [5] systematically excavated the salt tolerance genes in Zoysia matrella and identified 16 candidate salt tolerance genes involved in ion regulation, osmotic adjustment, protein folding and modification, mitochondrial membrane translocase and RNA metabolism. Xie et al. [58] presented the first comprehensive transcriptome data of Z. japonica Steud. roots, and a total of 32,849 unigenes and 4842 simple sequence repeats (SSRs) were identified. Their results showed that transcription factors (TFs) including members of the AP2/EREBP family, bZIP family, NAC family, WRKY family, MYB family and bHLH family play significant roles in the early response to salt stress [58].
Studies of the salt tolerance of zoysiagrass so far have focused on evaluating the salt tolerance among different cultivars, the physiological mechanisms of salt tolerance and the development of molecular markers [11, 59]. However, the molecular mechanism of salt tolerance in zoysiagrass remains unclear. In this study, we investigated the phenotypic and physiological responses of two materials with contrasting salt tolerances, Z. japonica Z004 (salt sensitive) and Z011 (salt tolerant), in response to salt stress. On the basis of the existing Zoysia reference genome [48], the HiSeq™ 2000 platform was used to perform RNA sequencing (RNA-seq) of the zoysiagrass leaves and roots. We then compared the transcriptomes at different time points (0 h, 1 h, 24 h, and 72 h) and of different tissues (leaves and roots) under salt treatments to identify the significant time points and tissues. According to the Gene Ontology (GO) and Kyoto Encyclopedia of Genes and Genomes (KEGG) analyses of differentially expressed genes (DEGs) in different comparisons, the key DEGs participating in the salt-stress response were selected, and these DEGs belonged to the hormone pathway, TF families and the DUF family. Thus, our research provides fundamental information for use in future salt-stress studies of Zoysia and improves the understanding of molecular mechanisms in salt-tolerant plants.
Results
Phenotypic and physiological responses of Z. japonica Steud. To salt stress
Japanese lawngrass (Z. japonica Steud.) is a popular and important warm-season turfgrass, and different accessions have different degrees of salt tolerance. In this study, two accessions with contrasting salt tolerances, Z004 (salt sensitive) and Z011 (salt tolerant), were chosen to analyse the salt tolerance mechanism of Z. japonica. The salt treatment results showed that Z011 had strong salt tolerance and displayed good growth, while Z004 was sensitive to salt and withered and yellowed after treatment with 350 mM NaCl for 40 days (Fig. 1a). Moreover, the leaf firing of Z004 was significantly greater than that of Z011 (Fig. 1b), and the biomass statistics showed that the relative shoot clipping dry weight, verdure dry weight and root dry weight of Z011 were markedly greater than those of Z004 (Fig. 1c-e).

Phenotypic response of Z. japonica Steud. to salt stress. a Two materials with contrasting salt tolerances, Z004 (salt sensitive) and Z011 (salt tolerant), were exposed to 350 mM NaCl for 40 days. b The leaf firing of the Z004 and Z011 grasses after NaCl treatment for 40 days. c The relative shoot clipping dry weights of Z004 and Z011 after NaCl treatment for 40 days. d The relative verdure dry weights of Z004 and Z011 after NaCl treatment for 40 days. e The relative root dry weights of Z004 and Z011 after NaCl treatment for 40 days. The values are presented as the means ± SEs. The asterisks above the bars indicate significant differences between the respective values (p < 0.05)
To study the differences in the mechanism of salt tolerance between Z004 and Z011, the Na+ and K+ concentrations were measured in the leaves, roots and secretions. In the control (CK) group, the Na+ concentrations and K+ concentrations in the leaves, roots and secretions were not significantly different between Z004 and Z011 (Fig. 2a-f). After treatment with 350 mM NaCl, the Na+ concentrations in the leaves, roots and secretions of Z004 and Z011 were greater than those in the CK (Fig. 2a-c). In the roots of Z004 and Z011 after NaCl treatment, the Na+ concentrations were not different (Fig. 2b). However, in the leaves, the Na+ concentrations and secretions were significantly lower in Z011 than in Z004 (Fig. 2a, c).
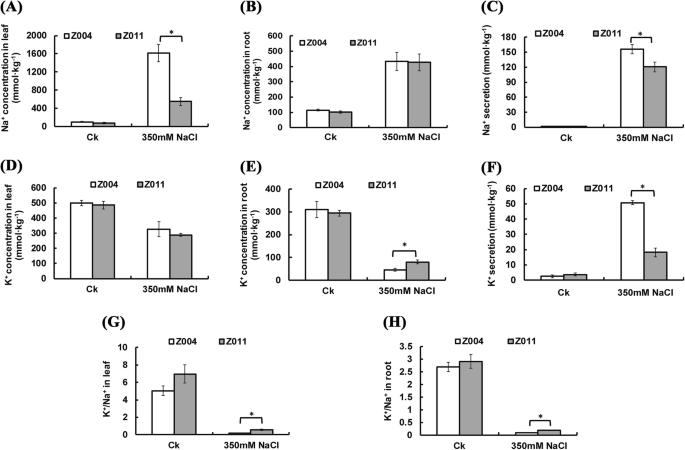
Physiological response of Z. japonica Steud. to salt stress. a The Na+ concentration in Z004 and Z011 leaves after Ck and NaCl treatment. b The Na+ concentration in Z004 and Z011 roots after Ck and NaCl treatment. c Na+ secretion by Z004 and Z011 after Ck and NaCl treatment. d The K+ concentration in Z004 and Z011 leaves after Ck and NaCl treatment. e The K+ concentration in Z004 and Z011 roots after Ck and NaCl treatment. f K+ secretion by Z004 and Z011 after Ck and NaCl treatment. g The K+/Na+ ratio in Z004 and Z011 leaves after Ck and NaCl treatment. h The K+/Na+ ratio in Z004 and Z011 roots after Ck and NaCl treatment. The values are presented as the means ± SEs. The asterisks above the bars indicate significant differences between the respective values (p < 0.05)
After treatment with 350 mM NaCl, the K+ concentrations in the leaves of Z004 and Z011 were lower than those in the leaves of the CK, but there were no differences in the K+ concentrations between Z004 and Z011 (Fig. 2d). In addition, the K+ concentrations in the roots of Z004 and Z011 were lower than those in the roots of the CK, and the K+ concentration in Z011 was significantly greater than that in Z004 (Fig. 2e). However, the K+ secretion in Z004 and Z011 after treatment with NaCl was greater than that in the CK, and the K+ secretion of Z004 was significantly greater than that of Z011 (Fig. 2f). Comparing with Z004, Z011 maintained a greater K+/Na+ ratio in both the leaves and roots (Fig. 2g, h).
Transcriptome sequencing of the Z004 and Z011 accessions
Leaf and root samples for RNA-seq were collected at 0 h, 1 h, 24 h and 72 h after treating Z004 and Z011 with 350 mM NaCl. In total, 16 samples were sequenced on the HiSeq™ 2000 sequencing platform. We obtained an average of 28.8 million raw reads from the 16 libraries, and 97.18% of the sequences were confirmed as clean reads (Online Resource 1). First of all, the total reads of our RNA-seq were mapped to the rice and sorghum genomes as references via Hisat2 (v2.0.5) software [17]. The results showed that the total reads to the rice reference genome (ftp://ftp.ncbi.nlm.nih.gov/genomes/all/GCF/001/433/935/GCF_001433935.1_IRGSP-1.0) was 0.12–0.39% (Online Resource 7), and the total reads to the sorghum reference genome (ftp://ftp.ncbi.nlm.nih.gov/genomes/all/GCF/000/003/195/GCF_000003195.3_Sorghum_bicolor_NCBIv3) was 0.26–0.85% (Online Resource 8). Afterward, the clean reads were mapped to the whole Z. japonica genome, and 62.7–91.39% of the total reads and 61.8–89.84% of the unique reads were mapped to the reference genome. Therefore, it is appropriate to select the zoysia genome as a reference. In addition, multiple-mapped reads constituted 0.85–1.67% of the total reads, and splice-mapped reads constituted 17.58–32.42% of the total reads. Furthermore, 73.44–77.17% of the total reads were mapped to exons in the reference genome, 13.38–16.10% of the reads were mapped to introns, and 8.58–12.06% of the reads were mapped to intergenic regions (Online Resource 2). In total, 59,271 unigenes and 29,675 novel genes were revealed by the RNA-seq assays. There were more genes (62,172, 69.90%) with lengths exceeding 1000 bp than those (21,909, 24.63%) with lengths exceeding 300 bp and fewer than 1000 bp. For the convenience of comparison, we defined 0 h as the CK group and 1 h, 24 h and 72 h as the treatment (Tr) group. Principal component analysis (PCA) revealed that the leaf and root samples of Z004 and Z011 were separated into four different areas (Fig. 3a). Among them, the Z011 root samples had the highest dispersion degree (Fig. 3a). Moreover, the 24 h samples of the roots of Z004 and Z011 were separated from the other samples, indicating that 24 h could be a crucial time (Fig. 3a).

Expression profiles of Z. japonica salt tolerance-related transcripts. a PCA analysis of 16 transcriptome samples including four time points (0 h, 1 h, 24 h, and 72 h) and two tissues (leaves and roots) of Z004 and Z011 under salt treatment. The 0-h time point represents the CK group, and the 1-h, 24-h and 72-h time points constitute the Tr group. b The number of up- and downregulated DEGs in Z0041L vs Z0040L, Z00424L vs Z0040L, Z00472L vs Z0040L, Z0041R vs Z0040R, Z00424R vs Z0040R, Z00472R vs Z0040R, Z0111L vs Z0110L, Z01124L vs Z0110L, Z01172L vs Z0110L, Z0111R vs Z0110R, Z01124R vs Z0110R, Z01172R vs Z0110R. c The number of up- and downregulated DEGs in Z0110L vs Z0040L, Z0111L vs Z0041L, Z01124L vs Z00424L, Z01172L vs Z00472L, Z0110R vs Z0040R, Z0111R vs Z0041R, Z01124R vs Z00424R and Z01172R vs Z00472R
Identification of DEGs in Z004 and Z011 in response to salt stress
To characterize the differences between Z004 and Z011 in response to salt stress, we explored the unigenes whose expression level significantly changed after NaCl treatment. The transcript abundance of each gene was calculated by their fragments per kilobase per million fragments (FPKM) values. edgeR software [41] was used to analyse the significant differences in expression with padj < 0.05 and fold change > 2, and DEGs were identified as having a |log2(fold change)| > 1 and padj < 0.05. Under salt stress conditions, a total of 4701 genes, 2591 genes, 4400 genes and 8846 genes were differentially expressed in the leaves of Z004 (Z0041L vs Z0040L, Z00424L vs Z0040L, Z00472L vs Z0040L), Z004 roots (Z0041R vs Z0040R, Z00424R vs Z0040R, Z00472R vs Z0040R), Z011 leaves (Z0111L vs Z0110L, Z01124L vs Z0110L, Z01172L vs Z0110L) and Z011 roots (Z0111R vs Z0110R, Z01124R vs Z0110R, Z01172R vs Z0110R), respectively. In addition, a total of 12,220 genes were differentially expressed in the leaf comparisons of Z011 and Z004 (Z0110L vs Z0040L, Z0111L vs Z0041L, Z01124L vs Z00424L, Z01172L vs Z00472L), and 22,439 genes were differentially expressed in the root comparisons of Z011 and Z004 (Z0110R vs Z0040R, Z0111R vs Z0041R, Z01124R vs Z00424R, Z01172R vs Z00472R) (Fig. 3c). Interestingly, the number of DEGs of Z011 roots was obviously more than that in the Z004 roots, and the number of DEGs of roots was obviously more than leaves in comparisons of Z011 and Z004 (Fig. 3b,c). These results indicated that the roots might make a significant contribution to the difference in salt tolerance between Z004 and Z011. Moreover, comparisons of the Z004 leaves, Z004 roots and Z011 leaves revealed more downregulated genes than upregulated ones (Fig. 3b). However, in the comparisons of Z011 roots, there were more upregulated genes than downregulated ones (Fig. 3b). In addition, the number of DEGs in the 24-h sample (Z01124R vs Z0110R) was 2.28 and 5.64 times that in the 1-h (Z0111R vs Z0110R) and 72-h (Z01172R vs Z0110R) samples. Venn diagrams were constructed that also show that, in the comparisons of the Z004 roots, Z011 leaves and Z011 roots, the number of specific DEGs was greater at 24 h than at 1 h and 72 h (Supplementary Figure S1). These results indicated that 24 h might be a relatively important time point for the salt-stress response.
GO analysis of DEGs in the Z004 and Z011 roots
For the functional characterization of DEGs, we assigned GO terms and selected significant GO classifications of DEGs in each comparison (padj < 0.05). Fourteen GO classes of ‘molecular function’ in the Z0041R vs Z0040R comparison were identified. In the comparison between Z00424R and Z0040R, 4 GO classes, 1 GO class and 20 GO classes fell into the categories ‘biological process’, ‘cellular component’ and ‘molecular function’ respectively. Meanwhile, in the Z00472R vs Z0040R comparison, the category ‘biological process’ had 2 GO classes, ‘cellular component’ had 1 GO class and ‘molecular function’ had 23 GO classes. In Z004R, 11 GO classes most relevant to the salt-stress response were concentrated in the Z00424R vs Z0040R comparison and Z00472R vs Z0040R comparison: ‘response to oxidative stress’, ‘response to stress’, ‘extracellular region’, ‘oxidoreductase activity, acting on paired donors, with incorporation or reduction of molecular oxygen’, ‘oxidoreductase activity, acting on peroxide as acceptor’, ‘antioxidant activity’, ‘peroxidase activity’, ‘iron ion binding’, ‘ubiquitin-protein transferase activity’, ‘ubiquitin-like protein transferase activity’ and ‘sequence-specific DNA binding’ (Online Resource 3). These results showed that Z004 responded slowly to salt stress. A significant stress response did not occur after 1 h of NaCl treatment but did occur after 24 h and 72 h.
Six GO classes of ‘molecular function’ in the Z0041R vs Z0040R comparison were identified. In the comparison between Z00424R and Z0040R, 4 GO classes, 1 GO class and 20 GO classes fell into the categories ‘biological process’, ‘cellular component’ and ‘molecular function’ respectively. Meanwhile, in the Z00472R vs Z0040R comparison, the category ‘biological process’ had 2 GO classes, ‘cellular component’ had 1 GO class and ‘molecular function’ had 23 GO classes.
In the comparison between Z0111R and Z0110R, 6 GO classes, 16 GO classes and 10 GO classes fell into the category ‘biological process’, ‘cellular component’ and ‘molecular function’ respectively. In the comparison between Z01124R vs Z0110R, 10 and 5 GO classes fell into the category ‘biological process’ and ‘molecular function’ respectively. In the comparison between Z01172R vs Z0110R, 2 and 8 GO classes fell into the category ‘biological process’ and ‘molecular function’ respectively. In Z011R, 5 GO classes most relevant to the salt-stress response were identified within its three comparisons: ‘response to stress’, ‘response to oxidative stress’, ‘antioxidant activity’, ‘peroxidase activity’ and ‘oxidoreductase activity, acting on peroxide as acceptor’ (Online Resource 3). These results showed that Z011 responded to salt stress faster than did Z004. The stress response occurred after 1 h of NaCl treatment. When the GO classes most relevant to salt stress in Z004R and Z011R were compared, it was found that the 5 GO classes in Z011R coincided with those in Z004R. However, ‘extracellular region’, ‘oxidoreductase activity, acting on paired donors, with incorporation or reduction of molecular oxygen’, ‘iron ion binding’, ‘ubiquitin-protein transferase activity’, ‘ubiquitin-like protein transferase activity’ and ‘sequence-specific DNA binding’ were unique to Z004R and might be related to the differences in salt tolerance between Z004 and Z011.
In the Z0110R vs Z0040R comparison, the category ‘biological process’ had 1 GO class and ‘molecular function’ had 8 GO classes. In the Z0111R vs Z0041R comparison, the category ‘biological process’ had 2 GO classes, ‘cellular component’ had 1 GO class and ‘molecular function’ had 22 GO classes. In the Z01124R vs Z00424R comparison, the category ‘biological process’ had 11 GO classes and ‘molecular function’ had 8 GO classes. In the Z01172R vs Z00472R comparison, the category ‘biological process’ had 2 GO classes and ‘molecular function’ had 8 GO classes (Online Resource 3). Comparing with 0 h, the mutual GO class of Z011R vs Z004R comparisons among 1 h, 24 h and 72 h was ‘response to stress’. These results showed Z011 had faster and stronger stress response in salt tolerance.
KEGG pathway analysis of DEGs in the Z004 and Z011 roots
The DEGs in the Z004 and Z011 roots were mapped to KEGG pathways of Oryza sativa. In the Z0041R vs Z0040R, Z00424R vs Z0040R and Z00472R vs Z0040R comparisons, 40, 67 and 72 DEGs, respectively, involving 23, 40 and 32 pathways, respectively, were assigned to KEGG pathways (Online Resource 4). In the Z0111R vs Z0110R, Z01124R vs Z0110R and Z01172R vs Z0110R comparisons, 100, 202 and 39 DEGs, respectively, involving 41, 52 and 26 pathways, respectively, were assigned to KEGG pathways (Online Resource 4). In the Z0110R vs Z0040R, Z0111R vs Z0041R, Z01124R vs Z00424R and Z01172R vs Z00472R comparisons, 266, 114, 54 and 119 DEGs, respectively, involving 61, 44, 36 and 52 pathways, respectively, were assigned to KEGG pathways (Online Resource 4). The major pathways identified in the above comparisons were ‘metabolic pathways’, ‘biosynthesis of secondary metabolites’, ‘plant hormone signal transduction’, ‘MAPK signalling pathway – plant’ and ‘phenylpropanoid biosynthesis’.
Statistical analysis of the number of DEGs in the above five pathways revealed that the expression of most in Z004 was downregulated, while the expression of most in Z011 was upregulated (Fig. 4). Especially in the MAPK signalling pathway, which is closely related to the plant response to abiotic stress, the expression of all DEGs in Z004 was downregulated; however, in Z011, there were only 2 DEGs whose expression was downregulated, whereas that of the all other DEGs was upregulated (Fig. 4d). In Z011, the number of DEGs was greatest after 24 h of NaCl treatment, and the number of DEGs was lowest after 72 h (Fig. 4). The comparisons of Z011 and Z004 in different time points performed that the number of downregulated DEGs was decreased obviously after the salt treatment (Fig. 4). In general, the number of DEGs involved in the salt-stress response in Z011 was significantly greater than that in Z004, and the number genes whose expression was upregulated obviously increased.

Number of up- or downregulated DEGs enriched in five KEGG pathways in Z004 roots and Z011 roots. a The number of up- or downregulated DEGs enriched in metabolic pathways in Z0041R vs Z0040R, Z00424R vs Z0040R, Z00472R vs Z0040R, Z0111R vs Z0110R, Z01124R vs Z0110R, Z01172R vs Z0110R, Z0110R vs Z0040R, Z0111R vs Z0041R, Z01124R vs Z00424R and Z01172R vs Z00472R. b The number of up- or downregulated DEGs enriched in the biosynthesis of secondary metabolites in Z0041R vs Z0040R, Z00424R vs Z0040R, Z00472R vs Z0040R, Z0111R vs Z0110R, Z01124R vs Z0110R, Z01172R vs Z0110R, Z0110R vs Z0040R, Z0111R vs Z0041R, Z01124R vs Z00424R and Z01172R vs Z00472R. c The number of up- or downregulated DEGs enriched in plant hormone signal transduction in Z0041R vs Z0040R, Z00424R vs Z0040R, Z00472R vs Z0040R, Z0111R vs Z0110R, Z01124R vs Z0110R, Z01172R vs Z0110R, Z0110R vs Z0040R, Z0111R vs Z0041R, Z01124R vs Z00424R and Z01172R vs Z00472R. d The number of up- or downregulated DEGs enriched in the MAPK signaling pathway - plant in Z0041R vs Z0040R, Z00424R vs Z0040R, Z00472R vs Z0040R, Z0111R vs Z0110R, Z01124R vs Z0110R, Z01172R vs Z0110R, Z0110R vs Z0040R, Z0111R vs Z0041R, Z01124R vs Z00424R and Z01172R vs Z00472R. e The number of up- or downregulated DEGs enriched in phenylpropanoid biosynthesis in Z0041R vs Z0040R, Z00424R vs Z0040R, Z00472R vs Z0040R, Z0111R vs Z0110R, Z01124R vs Z0110R, Z01172R vs Z0110R, Z0110R vs Z0040R, Z0111R vs Z0041R, Z01124R vs Z00424R and Z01172R vs Z00472R
Identification of DEGs from comparisons of the Z004 and Z011 roots
To narrow the selection range of the DEGs, we focused on those within plant hormone signal transduction families, TF families and other gene families that have been reported to be involved in salt tolerance. A total of 233 DEGs were identified with a |log2(fold change)| ≥ 2 and padj < 0.05 in any one comparison and selected from six different comparisons of Z004 and Z011 roots. With respect to the hormone pathways, the ABA signalling pathway had the most DEGs (26 genes), followed by the auxin signal pathway (19 genes) (Fig. 5a, Online Resource 5). The DEGs in the ABA signalling pathway all belonged to the protein phosphatase 2C (PP2C) family; however, in the auxin signalling pathway, 14 DEGs were related to auxin induction, and 5 DEGs were related to the auxin response (Fig. 5a, Online Resource 5). In addition, 6 DEGs in the ethylene signalling pathway belonged to the ethylene insensitive 3 (EIN3) family (Fig. 5a, Online Resource 5). With respect to TFs, a total of 8 TF families were identified. The WRKY TF family had the most DEGs (37 genes), followed by the bHLH TF family (29 genes) (Fig. 5b, Online Resource 5). In addition, members of the bZIP TF family (22 genes), GRAS TF family (18 genes), WD40 TF family (12 genes), F-box TF family (8 genes), TCP TF family (7 genes) and SBP TF family (5 genes) were identified (Fig. 5b, Online Resource 5). Moreover, a total of 25 genes in the DUF family, 13 ubiquitin genes and 6 heat-shock protein 70 (HSP70) gene were also identified (Fig. 5c, Online Resource 5).

Heatmap of 233 DEGs in the roots of Z004 and Z011 at four time points after salt treatments. The 233 DEGs were grouped into 3 main categories, and the red and blue rectangles represent the scale of the expression levels of each gene (log2FPKM). The red rectangles represent upregulated genes, and blue rectangles represent the downregulated genes
From the above 233 DEGs, we selected 44 whose expression was significantly contrastingly up- or downregulated between the Z004 and Z011 roots after salt treatment (Table 1). The expression of seven DEGs in the hormone signalling pathway was downregulated in the Z004 roots and upregulated in the Z011 roots. Among these DEGs, three belonged to the auxin-responsive protein small auxin-up RNA (SAUR) family in the auxin signalling pathway, one belonged to the auxin response factor family in the auxin signaling pathway, one DEG belonged to the EIN3 family in the ethylene signalling pathway, and two DEGs belonged to the PP2C family in the ABA signalling pathway. Six of these DEGs in the Z011 roots had the highest FPKM values at 24 h after salt treatment except novel.25809, which suggested that these six genes might have significant effects on salt tolerance (Table 1). In our research, members of various TF families involved in salt tolerance were identified. The major TF families identified were the WRKY and bHLH families. Twelve WRKY and nine bHLH TFs are listed in Table 1. The expression of all the WRKY was downregulated in the Z004 roots and upregulated in the Z011 roots. Moreover, with the exception of that of Zjn_sc00039.1.g03650.1.am.mk (bHLH30), the expression of 8 bHLH TFs was downregulated in the Z004 roots and 7 of them upregulated in the Z011 roots. In the bZIP TF family, six DEGs were selected, three of whose expression was upregulated in the Z004 roots and downregulated in the Z011 roots; and novel.1352 (bZIP53) had the opposite tendency of expression. In addition, the expression of three GRAS TF family members, two WD40 TF family members and one SBP TF family member was downregulated in the Z004 roots and upregulated in the Z011 roots, except Zjn_sc00016.1.g06200.1.am.mk (SCL9). The expression of the TCP TF family member novel.30217 (TCP7) was upregulated in the Z004 roots and downregulated in Z011 roots (Table 1), and two DUF family members, Zjn_sc00012.1.g05940.1.sm.mkhc (DUF315) and novel.26532 (DUF1671), were also selected and displayed a contrasting expression trend, which might indicate that they have opposite functions (Table 1). From the above, the expression of 27 DEGs was downregulated in the Z004 roots and upregulated in the Z011 roots, and that of 4 DEGs was upregulated in the Z004 roots and downregulated in the Z011 roots, indicating that these genes might be related to the salt tolerance of zoysiagrass. Among them, the number of upregulated genes in the roots of the salt-tolerant accession Z011 roots was significantly greater than the number of downregulated genes.
Verification of the transcriptome sequencing data of the Z004 and Z011 roots
To verify the reliability of the transcriptome sequencing data of the Z004 and Z011 roots, twenty of the 39 DEGs whose expression was significantly contrastingly up- and downregulated signal pathway in the Z004 and Z011 roots after salt treatment were selected and validated via quantitative real-time PCR (qRT-PCR). With the exception of Zjn_sc00029.1.g04940.1.sm.mkhc and Zjn_sc00011.1.g02540.1.sm.mk, approximately 90.0% of the DEGs were consistent between the RNA-seq and qRT-PCR data (Supplementary Figure S2). The results of the qRT-PCR and RNA-seq data were generally consistent, indicating that our transcriptome sequencing data of the Z004 and Z011 roots were reliable.
Discussion
Phenotypic and physiological responses to salt stress in Z. japonica Steud
Zoysia is a warm-season turfgrass that is widely used in home lawns, football fields and ecological management [50]. Zoysiagrass is recognized for its salt tolerance, hardiness, and drought tolerance and is suitable as a high-quality salt-tolerant turfgrass for landscaping in areas with saline soils [10]. Previous studies have shown that the salt tolerance of Zoysia is negatively correlated with the content of Na+ and positively correlated with the content of K+ in leaf fluids [25]. Salt-tolerant plants materials have a strong ability to maintain the K+/Na+ ratio in their leaves and roots [25, 33, 34]. Our data from two accessions the (salt-sensitive material Z004 and salt-tolerant material Z011) with contrasting salt tolerances support these previous studies. After 350 mM NaCl treatment for 40 days, Z011 was more salt tolerant than was Z004, grew better, and had greater biomass (Fig. 1a-e). Compared with those of Z004, the Na+ concentrations in the leaves and secretions of Z011 were maintained at significantly lower levels, but there were no differences in the roots (Fig. 2a-c). Moreover, there was no difference in K+ concentration in the leaves of Z011 compared with Z004; however the K+ concentration was significantly greater in the the roots of Z011, and the K+ secretion was also lower in the roots of Z011 (Fig. 2d-f). These results indicated that, compared with Z004, Z011 may have improved salt tolerance by reducing the transport of Na+ from the roots to the leaves, increasing the absorption of K+ in the roots and reducing the secretion of K+ from leaves to maintain a significantly greater K+/Na+ ratio (Fig. 2g, h).
Transcriptome sequencing of Z004 and Z011 and DEG identification in response to salt stress
Xie et al. [58] presented the first comprehensive transcriptome data of Z. japonica Steud. roots after 30 min of NaCl treatment, and a total of 32,849 unigenes and 4842 SSRs were identified. However, the important regulatory capabilities of the roots and leaves of this species under salt stress, and the key time point for salt tolerance regulation remain unknown. Our research involved the sampling of leaves and roots from Z004 and Z011 at 0 h, 1 h, 24 h and 72 h after treatment with 350 mM NaCl, and a total of 59,271 unigenes and 29,675 novel genes were revealed by RNA-seq. PCA revealed that the Z011 root samples had the highest dispersion degree, and the 24-h samples of the roots of both Z004 and Z011 were separated from those of other samples (Fig. 3a). Moreover, the number of DEGs of Z011 roots was obviously more than that in the Z004 roots, and the number of DEGs at 24 h (Z01124R vs Z0110R) was 2.28 and 5.64 times that at 1 h (Z0111R vs Z0110R) and 72 h (Z01172R vs Z0110R) (Fig. 3b, c, Supplementary Figure S1). Comparing the Z011 and Z004, the number of DEGs of roots was obviously more than leaves (Fig. 3b). These results indicated that the roots might make a significant contribution to the difference in salt tolerance between Z004 and Z011 and the 24 h might be a relatively important time point for the salt-stress response.
Plant hormone signal transduction is involved in salt tolerance
Further evidence from the KEGG pathway enrichment analysis of the DEGs in the Z004 and Z011 roots demonstrated that plant hormone signal transduction has important effects on salt tolerance (Fig. 4c). Seven DEGs involved in plant hormone signal transduction were selected, and the expression of six of them was downregulated in the Z004 roots and upregulated in the Z011 roots. Among these DEGs, one SAUR41 and two SAUR77 genes belonged to the auxin-responsive protein SAUR family in the auxin signalling pathway, one ARF6 gene belonged to the auxin response factor (ARF) family in the auxin signaling pathway, one ethylene-insensitive-3-like-1 (EIL1) gene belonged to the EIN3 family in the ethylene signalling pathway and one PP2C12 and one PP2C27 gene each belonged to the PP2C family in the ABA signalling pathway (Table 1).
SAURs compose a family of auxin-responsive genes that play an important role in the regulation of plant growth and development. However, the function of members of the SAUR family in terms of salt tolerance has rarely been reported. Previous studies have shown only that the expression of TaSAUR75 is downregulated in wheat roots after salt stress, and increased root length, survival rate and expression of some salt and drought stress-responsive genes were detected in TaSAUR75-overexpressing transgenic plants compared with CK plants [13]. In Arabidopsis, overexpression of AtSAUR41 promotes hypocotyl elongation and increases both primary root growth and lateral root number [19]. Yeast two-hybrid experiments showed that AtSAUR77 might participate in ethylene receptor signalling and promote plant growth [27]. However, the function of these two genes in salt tolerance has not yet been reported. In our research, under salt tolerance, the expression of both ZmSAUR41 and ZmSAUR77 was downregulated in the Z004 roots and upregulated in the Z011 roots, indicating that ZmSAUR41 and ZmSAUR77 might improve salt tolerance (Table 1). ARF family bind to promoters of many auxin-regulated genes with auxin response elements (AuxREs, 5′ tgtctc 3′) and regulate the expression of auxin-induced genes [14, 29]. In Arabidopsis, ARF6 and ARF8 are the target genes of miR167, and miR167 is induced by salinity and drought [20]. In our research, the expression of ZmARF6 was downregulated in the Z011 roots after salt treatments, indicating that ZmARF6 might negative regulated salt tolerance (Table 1).
Ethylene considered a stress hormone involved in the plant response to salt tolerance. EIN3 and EIL1 are two ethylene-activated TFs and have been reported to be important for improving salt tolerance. In Arabidopsis, accumulation of EIN3/EIL1 is induced by high salinity and likely enhances reactive oxygen species (ROS) scavenging at the seedling stage to promote salinity tolerance, as compared with wild-type plants, ein3 eil1 double mutants have greater levels of ROS and lower levels of peroxidase-encoding transcripts and are hypersensitive to salt tolerance [38]. However, in contrast, overexpression OsEIL1 and OsEIL2 in rice resulted in salt hypersensitivity at the seedling stage, and the lack of OsEIL1 and OsEIL2 functionality increased salt tolerance. Furthermore, the negative regulation of OsEIL1 and OsEIL2 in salt tolerance might contribute to the regulation of high-affinity K+transporter 2;1 expression and the absorption of Na+ in roots [60]. In our research, under salt tolerance, the expression of ZmEIL1 was downregulated in Z004 roots and upregulated in Z011 roots, indicating that ZmEIL1 might have a positive effect on salt tolerance, which is consistent with the function of AtEIL1 in Arabidopsis (Table 1).
PP2C enzymes are key elements involved in the ABA signalling pathway. In the present study, the expression levels of PP2C family genes differed in response to salt tolerance. Overexpressing AtPP2CG1 (A. thaliana protein phosphatase 2C G Group 1) in Arabidopsis can enhance salt tolerance, whereas a lack of AtPP2CG1 function reduces salt tolerance. In addition, AtPP2CG1 upregulated the expression levels of some stress-responsive genes under salt treatment, including RD29A, RD29B, DREB2A and KIN1 [31]. In maize, salt treatment induced intron methylation of ZmPP2C and then significantly downregulated the expression of ZmPP2C [47]. Transcriptomic analysis of Camellia sinensis revealed that multiple PP2C members participate in the salt tolerance response, such as PP2C2, PP2C3, PP2C14, PP2C51 and PP2C60, whose expression was upregulated under salt treatment; however, the expression of PP2C12, PP2C27 and PP2C54 was downregulated [52]. In our study, after salt treatment, the expression of both ZmPP2C12 and ZmPP2C27 was downregulated in the Z004 roots and upregulated in the Z011 roots, indicating that ZmPP2C12 and ZmPP2C27 might be positive regulators of salt tolerance (Table 1).
TFs involved in salt tolerance
In our research, members of various TF families involved in salt tolerance were identified. Among them, the members of the WRKY and bHLH TF families were the most common (Table 1). The WRKY TF family is known to be involved in various physiological processes and many aspects of the plant defence system. We identified twelve differentially expressed WRKY genes, and eight of them were reported to be related to salt tolerance. In Gossypium raimondii, Cai et al. [3] reported that WRKY35, WRKY40 and WRKY64 were induced by salt, and the expression levels were significantly upregulated. Moreover, AtWRKY40 was found to be induced in response to salt stress in Arabidopsis [42]. Overexpressing FcWRKY40 of Fortunella crassifolia in tobacco and lemon increased salt tolerance, while silencing FcWRKY40 decreased salt tolerance [8]. Wang et al. [55] cloned the WRKY56 gene from Populus simonii × Populus nigra, which was significantly induced by salt treatment, and transformed it into Arabidopsis; the resulting WRKY56-overexpressing transgenic Arabidopsis plants were more salt tolerant than were the wild-type plants, and the fresh weight and germination of the latter increased [55]. A PsnWRKY70 gene was also cloned from P. simonii × P. nigra and confirmed the response to salt stress in PsnWRKY70-repressed plants, which exhibited enhanced salt tolerance [64]. In addition, AtWRKY70 has been reported to regulate salt stress by interacting with the Cys2/His2 zinc finger protein Zat7 [7]. WRKY71 and WRKY28 are homologues and are induced by high salinity. Overexpression of WRKY71 or WRKY28 resulted in insensitive flowering of Arabidopsis plants in response to high salinity, while downregulated of WRKY71 and WRKY28 resulted in more sensitive flowering of Arabidopsis [62]. Given that the expressions of WRKYs in our research were mainly downregulated in the Z004 roots and upregulated in Z011 roots, WRKY genes may play positive roles in salt tolerance.
The bHLH TF family has been reported to participate in the regulation of abiotic stress-related signal transduction. Nine differentially expressed bHLH genes were identified in our research, and five of them have been reported to be regulated by NaCl (Table 1). The bHLH30 genes in chrysanthemum, evergreen tree and upland cotton are induced under salt stress and have been reported to increase salt tolerance in yeast [6, 45, 56]. In Arabidopsis, two presumptive paralogues of bHLH92, bHLH41 and bHLH42, are induced by salt treatment [16]. Moreover, transcriptome analysis of the salinity tolerance of Brassica juncea revealed that the expression of bHLH101 was downregulated under salt treatment [44]. In our research, the expressions of the bHLH13, bHLH41, bHLH92, bHLH94, bHLH96 and bHLH101 genes were downregulated in the Z004 roots and upregulated or maintained in the Z011 roots, indicating that these bHLH genes might be positive regulators of salt tolerance. Among them, the expression trend of bHLH101 in Zoysia was opposite that in B. juncea [44], indicating that bHLH101 may have different functions in different species. In addition, bHLH30, whose expression was upregulated in the Z004 roots and downregulated in the Z011 roots, might play a negative role in the salt tolerance of Zoysia, which contrasts with the results of previous reports.
Members of the bZIP TF family have important roles in many biological processes, and some bZIP TF family members have been reported to exert biological functions under salt stress. Transgenic plants overexpressing AtbZIP1, ZmbZIP72, GmbZIP132 and ZmABP9 presented enhanced tolerance to salt stress [28, 46, 53, 61]. Six differentially expressed bZIP genes were identified in our research, and bZIP2, bZIP44 and bZIP53 were reported to be involved in salt tolerance (Table 1). The transcript level of the LebZIP2 gene in Lycopersicon esculentum increased after salt-stress treatments, and the bZIP1 and bZIP53 mutants displayed reduced salt tolerance [15, 43]. Overexpressing GmbZIP44 gene could increase the salt tolerance of transgenic plants in soybean [28]. In our research, the expression of TGAL6, bZIP2, bZIP11 and bZIP44 was upregulated in the Z004 roots and downregulated in the Z011 roots, while the expression of bZIP53 was downregulated in the Z004 roots and upregulated in the Z011 roots, indicating that different bZIP members might play different roles in the salt tolerance process in Z. japonica.
Among the remaining seven TFs (Table 1), only the salt tolerance function of the RACK1A gene has been clearly elucidated. In rice, suppression of OsRACK1A increased salt tolerance by maintaining low Na+ and high K+ concentrations in both the roots and leaves [63]. Our data showed that the expression of three GRAS TF family members (SCL9 and NSP1), two WD40 TF family members (WDR44 and RACK1A) and one SBP TF family member (SPL15) was downregulated in the Z004 roots and upregulated in the Z011 roots, while the expression of one GRAS TF family member (SCL9) and one TCP TF family member (TCP7) was upregulated in the Z004 roots and downregulated in the Z011 roots. Thus, these genes may have important roles in salt tolerance, but their functions require additional research.
The DUF family is involved in the salt tolerance of Z. japonica
DUF family members compose a large number of uncharacterized protein families within the Pfam database (http://pfam.xfam.org/family), which contains approximately 3000 families [1]. Some DUF proteins are active in plant development [2, 4], and other members of DUF families are involved in the stress response [18, 54], especially the salt-stress response. The AhDGR2 gene in Amaranthus hypochondriacus encodes a DUF642 domain-containing protein, and plants overexpressing AhDGR2 present increased sensitivity to NaCl treatment [37]. OsDSR2, which encodes a DUF966 domain-containing protein, also negatively regulates salt stress in rice [32]. However, overexpressing SIDP361 (a DUF1644 protein-coding gene) in rice significantly enhances salt tolerance at both the seedling and heading stages [24]. The expression of OsDUF810.7 significantly increases under salt treatment, and overexpression of this gene in E. coli improves the salt tolerance of the bacterium [23]. Two DUF family members, ROPGEF7 (a DUF 315 protein-coding gene) and UFSP (a DUF 1671 protein-coding gene), were selected in our research and showed an inverse expression trend (Table 1), indicating that these two DUF genes might play important roles in the salt tolerance process in Z. japonica and might have contrasting functions.
Conclusions
Our research performed that salt-tolerant Z. japonica accession Z011 may have improved salt tolerance by reducing Na+ transport from the roots to the leaves, increasing K+ absorption in the roots and reducing K+ secretion from the leaves to maintain a significantly greater K+/Na+ ratio. Twenty-four hours might be a relatively important time point for the salt-stress response of zoysiagrass. The auxin signal transduction family, ABA signal transduction family, WRKY TF family and bHLH TF family may be the most important families in Zoysia salt-stress regulation. This study provides fundamental information concerning the salt-stress response of Zoysia and improves the understanding of molecular mechanisms in salt-tolerant plants.
Methods
Plant materials and treatment
On the basis of the salt tolerance of 206 zoysiagrass accessions identified by their leaf firing, relative shoot clipping dry weight, verdure dry weight and root dry weight (H. L. Guo, unpublished data), the salt-sensitive Z. japonica accession Z004 and the salt-tolerant Z. japonica accession Z011 were used in this study. Both accessions were collected in 1995 by Jianxiu Liu, turfgrass major of Institute of Botany, Jiangsu Province and Chinese Academy of Sciences, China. Z004 was collected in a wild grassland in Lushan area (Jiangxi, China, 28°36′N, 116°00′E) and Z011 was collected in a hilly land of Lanxi area (Zhejiang, China, 29°13′N, 119°30′E). As Zoysia Willd. is not endangered, collection of samples for scientific purposes was permitted by local legislation. Professor Shouliang Chen, taxonomy major, and Jianxiu Liu, turfgrass major of Institute of Botany, Jiangsu Province and Chinese Academy of Sciences, undertook the formal identification of the samples according to flora of Reipublicae Popularis Sinicae (Vol.10, No.1, 1990). Previous morphological and DNA analyses also confirmed the correct identification of the two accessions [12, 30]. Both accessions were maintained at an experimental field of the Institute of Botany, Jiangsu Province and Chinese Academy of Sciences. Twenty uniform sprigs of both materials were transplanted from the experimental field of the Institute of Botany were planted into 9-cm-diameter and 6-cm-deep plastic pots filled with coarse silica sand. Ten pots were planted per treatment and material. The pots were suspended over tanks (66.56 × 45.56 × 17.0 cm3) filled with 45 L of 1/2-strength Hoagland’s solution. The grasses were clipped weekly until growth was consistent and were cultivated in a greenhouse with a day/night temperature of 35/28 °C, 16 h of light/8 h of dark, 75% relative humidity and 800 μmol m− 2 s− 1 of photosynthetically active radiation. NaCl treatment (350 mM) was initiated after 2 months of cultivation.
Observations and measurements of the salt tolerance of Z. japonica Steud
After the turfgrasses were subjected to salt treatment for 40 days, the leaf firing was assessed by visual rating via a scale of 1 (slight firing) to 9 (severe firing). All the treated grasses and CK grasses were divided into three parts: shoot clippings, verdure and roots. Among them, the part of the grass blades clipped to a height of 4.0 cm were considered shoot clippings, and the part excluding the shoot clippings and roots was considered the verdure. These three parts were dried at 70 °C for 48 h, after which the dry weight was determined. The relative dry weights were then calculated according to the following equation: relative dry weight = Wt/Wo × 100%, where Wt is the dry weight in the NaCl group, and Wo is the dry weight in the CK group. Three biological replicates were tested, and data from individual measurements were averaged and analysed via SPSS statistical software 18.0 (t test) (SPSS Inc., Chicago, IL, USA).
Determination of the concentrations of Na+ and K+
To determine the concentrations of Na+ and K+ in the leaves and roots, 20 mg of dry powder samples was placed into sealed test tubes that contained 15 ml of ddH2O. All the samples were boiled for 1 h and incubated at room temperature for 24 h. After the samples were filtered, the extracted Na+ and K+ concentrations were measured by flame photometry (Model FP6410; Shanghai Xinyi Instruments Inc., Shanghai, China) and calculated on the basis of the tissue dry weight (mmol kg− 1). To determine the secretion of Na+ and K+, the leaves were washed with ddH2O 3 times after 5 days of salt treatment to remove the salt crystals secreted from the leaf surface. Seven days later, 4–8 pieces of mature leaves were removed and placed into centrifuge tubes. Each centrifuge tube was supplemented with 10 ml of ddH2O and shaken for 5 s to fully dissolve the salt crystals on the leaf surface into the ddH2O. Afterward, the leaves in the centrifuge tubes were removed and dried at 70 °C for 48 h, after which the dry weight was determined. The Na+ and K+ concentrations within 10 ml of ddH2O were measured by flame photometry and calculated on the basis of the corresponding leaf dry weight (mmol kg− 1). The K+/Na+ ratio was considered the ratio of the K+ concentration to the Na+ concentration. Three biological replicates were analysed, and the data from the individual measurements were averaged and analysed using SPSS statistical software 18.0 (t test) (SPSS Inc., Chicago, IL, USA).
RNA-seq
The leaf and root tissues of Z004 and Z011 at four time points (0 h, 1 h, 24 h, and 72 h) after salt treatment were sampled, frozen in liquid nitrogen and stored at − 80 °C. Each collected sample was 0.1 g, and three biological replicates were analysed. The total RNA was extracted [58], and every three biological replicate RNA samples were mixed fully into one RNA library. A total of 16 RNA libraries were generated after the samples were pooled: Z0040L (Z004, 0 h, leaf), Z0041L (Z004, 1 h, leaf), Z00424L (Z004, 24 h, leaf), Z00472L (Z004, 72 h, leaf), Z0040R (Z004, 0 h, root), Z0041R (Z004, 1 h, root), Z00424R (Z004, 24 h, root), Z00472R (Z004, 72 h, root), Z0110L (Z011, 0 h, leaf), Z0111L (Z011, 1 h, leaf), Z01124L (Z011, 24 h, leaf), Z01172L (Z011, 72 h, leaf), Z0110R (Z011, 0 h, root), Z0111R (Z011, 1 h, root), Z01124R (Z011, 24 h, root), and Z01172R (Z011, 72 h, root). The cDNA library construction and transcriptome sequencing were performed by Novogene (Tianjin, China) (http://www.novogene.com/) on an Illumina HiSeq™ 2000 platform, and 125 bp/150 bp paired-end reads were generated. The datasets are available in the NCBI repository http://www.ncbi.nlm.nih.gov/bioproject/PRJNA559944.
De novo assembly, gene expression levels and identification of DEGs
Clean reads were obtained from the raw data by the removal of reads containing adapters, reads with ambiguous ‘N’ bases and reads of low quality. The Q20, Q30 and GC content of the clean reads were calculated, and the subsequent analyses were based on the high-quality clean reads. De novo assembly of the Z. japonica transcriptome from the reference genome of zoysiagrass [48] was accomplished via Hisat2 (v2.0.5) [17]. The mapped reads of each sample were then assembled, and the novel transcripts were predicted by StringTie (v1.3.3b) [39]. The gene expression levels were calculated according to the FPKM method [36]. The edgeR R package (3.18.1) [41] was subsequently used to analyse significant differences in expression with padj < 0.05 and fold change > 2, and DEGs were identified with a |log2(fold change)| > 1 and padj < 0.05.
GO and KEGG enrichment analyses of DEGs
All the DEGs were mapped to terms identified from the GO and KEGG (http://www.genome.jp/kegg/) enrichment analyses, and the clusterProfiler R package was used to analyse the GO enrichment of the DEGs and to test the statistical enrichment of the DEGs in the KEGG pathways. The GO terms and KEGG categories with padj < 0.05 (corrected P-value) were selected as significant GO classifications and KEGG pathways for the DEGs in each comparison.
qRT-PCR validation of transcription
Twenty DEGs were selected from the 44 DEGs whose expression was significantly contrastingly up- or downregulated in the Z004 and Z011 roots after salt treatment to validate the reliability of the transcriptome data. The primers of the DEGs were designed using Primer 5.0 software, and ZjActin (GenBank: GU290545.1) was used as a housekeeping gene. Each sample consisted of three biological replicates, and the qRT-PCR assays were carried out as described by Xie et al. [58]. The gene primers used are listed in Online Resource 6.
Availability of data and materials
The sequencing data are available in the NCBI repository http://www.ncbi.nlm.nih.gov/bioproject/PRJNA559944. The datasets analyzed during the current study are available from the corresponding author on reasonable request. All data generated or analyzed during this study are included in this published article [and its Additional files].
Abbreviations
- cDNA:
-
Complementary DNA
- CK:
-
Control group
- DEGs:
-
Differentially expressed genes
- FPKM:
-
Fragments per kb per million fragments
- GO:
-
Gene ontology
- KEGG:
-
Kyoto Encyclopedia of Genes and Genomes
- NCBI:
-
National Center for Biotechnology Information
- PCA:
-
Principal component analysis
- qRT-PCR:
-
Quantitative real-time PCR
- RNA-seq:
-
RNA sequence
- TF:
-
Transcription factors
- Tr:
-
The treatment group
References
Bateman A, Coggill P, Finn RD. DUFs: families in search of function. Acta Crystallogr Sect F Struct Biol Cryst Commun. 2010;66(10):1148–52. https://doi.org/10.1107/S1744309110001685.
Bischoff V, Nita S, Neumetzler L, Schindelasch D, Urbain A, Eshed R, Persson S, Delmer D, Scheible W. TRICHOME BIREFRINGENCE and its homolog AT5G01360 encode plant-specific DUF231 proteins required for cellulose biosynthesis in Arabidopsis. Plant Physiol. 2010;153(2):590–602. https://doi.org/10.1104/pp.110.153320.
Cai CP, Niu E, Du H, Zhao L, Feng Y, Guo WZ. Genome-wide analysis of the WRKY transcription factor gene family in Gossypium raimondii and the expression of orthologs in cultivated tetraploid cotton. Crop J. 2014;2(2):87–101. https://doi.org/10.1016/j.cj.2014.03.001.
Cao X, Yang KZ, Xia C, Zhang XQ, Chen LQ, Ye D. Characterization of DUF724 gene family in Arabidopsis thaliana. Plant Mol Biol. 2010:61–73. https://doi.org/10.1007/s11103-009-9551-5.
Chen Y, Zong JQ, Tan ZQ, Li LL, Hu BY, Chen CM, Chen JB, Liu JX. Systematic mining of salt-tolerant genes in halophyte-zoysia matrella through cdna expression library screening. Plant Physiol Bioch. 2015;89:44–52. https://doi.org/10.1016/j.plaphy.2015.02.007.
Cheng PL, Gao JJ, Feng YT, Zhang ZX, Liu YN, Fang WM, Chen SM, Chen FD, Jiang JF. The chrysanthemum leaf and root transcript profiling in response to salinity stress. Gene. 2018:161–9. https://doi.org/10.1016/j.gene.2018.06.075.
Ciftciyilmaz S, Morsy MR, Song L, Coutu A, Krizek BA, Lewis MW, Warren D, Cushman J, Connolly EL, Mittler R. The EAR-motif of the Cys2/His2-type zinc finger protein Zat7 plays a key role in the defense response of Arabidopsis to salinity stress. J Biol Chem. 2007;282(12):9260–8. https://doi.org/10.1074/jbc.M611093200.
Dai WS, Wang M, Gong XQ, Liu JH. The transcription factor FcWRKY40 of Fortunella crassifolia functions positively in salt tolerance through modulation of ion homeostasis and proline biosynthesis by directly regulating SOS2 and P5CS1 homologs. New Phytol. 2018;219(3):972–89. https://doi.org/10.1111/nph.15240.
Du YH, Hei Q, Liu YX, Zhang H, Xu K, Xia T. Isolation and characterization of a putative vacuolar Na+/H+ Antiporter gene from Zoysia japonica L. J Plant Biol. 2010;53:251–8. https://doi.org/10.1007/s12374-010-9107-x.
Ge YX, Norton T, Wang ZY. Transgenic zoysiagrass (Zoysia japonica) plants obtained by agrobacterium-mediated transformation. Plant Cell Rep. 2006;25:792–8. https://doi.org/10.1007/s00299-006-0123-8.
Guo HL, Ding WW, Chen JB, Chen X, Zheng YQ, Wang ZY, Liu JX. Genetic linkage map construction and QTL mapping of salt tolerance traits in Zoysiagrass (Zoysia japonica). PLoS One. 2014;9:e107249. https://doi.org/10.1371/journal.pone.0107249.
Guo HL, Liu JX, Zhou ZF, Xuan JP. Interspecific relationship and genetic diversity of zoysiagrass revealed by SSR markers. Acta Agrestia Sinica. 2008;16(6):552–7.
Guo Y, Jiang QY, Hu Z, Sun XJ, Fan SJ, Zhang H. Function of the auxin-responsive gene TaSAUR75 under salt and drought stress. Crop J. 2018:181–90. https://doi.org/10.1016/j.cj.2017.08.005.
Hagen G, Guilfoyle T. Auxin-responsive gene expression: genes, promoters, and regulatory factors. Plant Mol Biol. 2002;49:373–85. https://doi.org/10.1023/A:1015207114117.
Hartmann LH, Pedrotti L, Weiste C, Fekete A, Schierstaedt J, Gottler J, Kempa S, Krischke M, Dietrich K, Mueller MJ, Carbajosa JV, Hanson J, Dröge-Laser W. Crosstalk between two bZIP signaling pathways orchestrates salt-induced metabolic reprogramming in Arabidopsis roots. Plant Cell. 2015;27(8):2244–60. https://doi.org/10.1105/tpc.15.00163.
Jiang YQ, Yang B, Deyholos MK. Functional characterization of the Arabidopsis bHLH92 transcription factor in abiotic stress. Mol Gen Genomics. 2009;282(5):503–16. https://doi.org/10.1007/s00438-009-0481-3.
Kim D, Langmead B, Salzberg SL. Hisat: a fast spliced aligner with low memory requirements. Nat Methods. 2015;12(4):357–60. https://doi.org/10.1038/nmeth.3317.
Kim SJ, Ryu MY, Kim WT. Suppression of Arabidopsis RING-DUF1117 E3 ubiquitin ligases, AtRDUF1 and AtRDUF2, reduces tolerance to ABA mediated drought stress. Biochem Biophys Res Commu. 2012;420:141–7. https://doi.org/10.1016/j.bbrc.2012.02.131.
Kong YY, Zhu YB, Gao C, She WJ, Lin WQ, Chen Y, Han N, Bian HW, Zhu MY, Wang JH. Tissue-specific expression of SMALL AUXIN UP RNA41 differentially regulates cell expansion and root meristem patterning in Arabidopsis. Plant Cell Physiol. 2013;54:609–21. https://doi.org/10.1093/pcp/pct028.
Kord H, Fakheri B, Ghabooli M, Solouki M, Emamjomeh A, Khatabi B, Sepehri M, Salekdeh GH, Ghaffari MR. Salinity-associated micrornas and their potential roles in mediating salt tolerance in rice colonized by the endophytic root fungus piriformospora indica. Funct Integr Genomic. 2019;19:659–72. https://doi.org/10.1007/s10142-019-00671-6.
Lee GJ, Yoo YK, Kim KS. Comparative salt tolerance study in Zoysiagrasses II. Interspecific comparison among eight zoysiagrasses (Zoysia spp.). J. Kor. Soc. Hort. Sci. 1994a;35(2):178–85.
Lee GJ, Yoo YK, Kim KS. Comparative salt tolerance study in Zoysiagrasses III. Changes in inorganic constituents and Proline contents in eight Zoysiagrasses (Zoysia spp.). J. Kor. Soc. Hort. Sci. 1994b;35(3):241–50.
Li LH, Lv MM, Li X, Ye TZ, He X, Rong SH, Dong YL, Guan Y, Gao XL, Zhu JQ, Xu ZJ. The Rice OsDUF810 family: OsDUF810.7 may be involved in the tolerance to salt and drought. Mol Biol. 2018;52(4):489–96. https://doi.org/10.1134/S002689331804012X.
Li M, Guo LJ, Guo CM, Wang LJ, Chen L. Over-expression of a DUF1644 protein gene, SIDP361, enhances tolerance to salt stress in transgenic rice. J Plant Biol. 2016;59(1):62–73. https://doi.org/10.1007/s12374-016-0180-7.
Li S, Chen JB, Guo HL, Zong JQ, Zhang F, Chu XQ, Jiang QF, Ding WW, Liu JX. Salinity tolerance evaluation of Zoysia turfgrass germplasm. Acta Prataculturae Sin. 2012;21(4):43–51.
Li Y, Geng L, Liu JX. Assessment on salt–tolerance of Zoysia spp. in China. Acta Agrestia Sin. 2004;12:8–11. https://doi.org/10.1088/1009-0630/6/5/011.
Li ZG, Chen HW, Li QT, Tao JJ, Bian XH, Ma B, Zhang WK, Chen SY, Zhang J. Three SAUR proteins SAUR76, SAUR77 and SAUR78 promote plant growth in Arabidopsis. Sci Rep. 2015;5:12477. https://doi.org/10.1038/srep12477.
Liao Y, Zhang J, Chen SY, Zhang WK. Role of soybean GmbZIP132 under abscisic acid and salt stresses. J Integr Plant Biol. 2008;50(2):221–30. https://doi.org/10.1111/j.1744-7909.2007.00593.x.
Liscum E, Reed JW. Genetics of aux/IAA and ARF action in plant growth and development. Plant Mol Biol. 2002;49:387–400. https://doi.org/10.1023/A:1015255030047.
Liu JX, Guo HL, Zhu XH, Gao H, Sun ZY. The comprehensive assessment on the germplasm of zoysia spp. Acta Agrestia Sinica. 2005;13(3):219–56.
Liu X, Zhu YM, Zhai H, Cai H, Ji W, Luo X, Li J, Bai X. AtPP2CG1, a protein phosphatase 2C, positively regulates salt tolerance of Arabidopsis in abscisic acid-dependent manner. Biochem Bioph Res Co. 2012;422(4). https://doi.org/10.1016/j.bbrc.2012.05.064.
Luo CK, Guo CM, Wang WJ, Wang LJ, Chen L. Overexpression of a new stress-repressive gene OsDSR2, encoding a protein with a DUF966 domain increases salt and simulated drought stress sensitivities and reduces aba sensitivity in rice. Plant Cell Rep. 2014;33(2):323–36. https://doi.org/10.1007/s00299-013-1532-0.
Marcum KB, Anderson SJ, Engelke MC. Salt gland ion secretion: a salinity tolerance mechanism among five zoysiagrass species. Crop Sci. 1998;38:806–10. https://doi.org/10.2135/cropsci1998.0011183X003800030031x.
Marcum KB, Murdoch CL. Growth responses, ion relations, and osmotic adaptations of eleven C4 turfgrasses to salinity. Agron J. 1990;82:892–6. https://doi.org/10.2134/agronj1990.00021962008200050009x.
Marcum KB, Murdoch CL. Salinity tolerance mechanisms of six C4 Turfgrasses. J AMER Soc Hort Sci. 1994;119(4):779–84. https://doi.org/10.21273/jashs.119.4.779.
Mortazavi A, Williams BA, Mccue K, Schaeffer L, Wold BJ. Mapping and quantifying mammalian transcriptomes by RNA-Seq. Nat Methods. 2008;5(7):621–8. https://doi.org/10.1038/nmeth.1226.
Palmeros-Suárez PA, Massange-Sánchez JA, Sánchez-Segura L, Martínez-Gallardo NA, Espitia RE, Gómez-Leyva JF, Délano-Frier JP. AhDGR2, an amaranth abiotic stress-induced DUF642 protein gene, modifies cell wall structure and composition and causes salt and ABA hyper-sensibility in transgenic Arabidopsis. Planta. 2016;245(3):1–18. https://doi.org/10.1007/s00425-016-2635-y.
Peng JY, Li ZH, Wen X, Li WZ, Shi H, Yang LS, Zhu HQ, Guo HW. Salt-induced stabilization of EIN3/EIL1 confers salinity tolerance by deterring ROS accumulation in Arabidopsis. PLoS Genet. 2014;10(10):e1004664. https://doi.org/10.1371/journal.pgen.1004664.
Pertea M, Pertea G, Antonescu CM, Chang TC, Mendell JT, Salzberg SL. StringTie enables improved reconstruction of a transcriptome from RNA-seq reads. Nat Biotechnol. 2015;33(3):290–5. https://doi.org/10.1038/nbt.3122.
Qian YL, Engelke MC, Foster MJV. Salinity effects on zoysiagrass cultivars and experimental lines. Crop Sci. 2000;40:488–92. https://doi.org/10.2135/cropsci2000.402488x.
Robinson MD, McCarthy DJ, Smyth GK. edgeR: a bioconductor package for differential expression analysis of digital gene expression data. Bioinformatics. 2010;26(1):139–40. https://doi.org/10.1093/bioinformatics/btp616.
Seki M, Narusaka M, Ishida J, Nanjo T, Fujita M, Oono Y, Kamiya A, Nakajima M, Enju A, Sakurai T, Satou M, Akiyama K, Taji T, Yamaguchi-Shinozaki K, Carninci P, Kawai J, Hayashizaki Y, Shinozaki K. Monitoring the expression profiles of 7000 Arabidopsis genes under drought, cold and high-salinity stresses using a full-length cDNA microarray. Plant J. 2002;31(3):14. https://doi.org/10.1046/j.1365-313X.2002.01359.x.
Seong ES, Kwon SS, Ghimire BK, Yu CY, Cho DH, Lim JD, Kim KS, Heo K, Lim ES, Chung IM, Kim MJ, Lee YS. LebZIP2 induced by salt and drought stress and transient overexpression by agrobacterium. J Biochem Mol Biol. 2008;41(10):693–8. https://doi.org/10.5483/BMBRep.2008.41.10.693.
Sharma R, Mishra M, Gupta BK, Parsania C, Singlapareek SL, Pareek A. De novo assembly and characterization of stress transcriptome in a salinity-tolerant variety CS52 of Brassica juncea. PLoS One. 2015;10(5). https://doi.org/10.1371/journal.pone.0126783.
Shi GY, Guo XY, Guo JY, Liu LH, Hua JP. Analyzing serial cDNA libraries revealed reactive oxygen species and gibberellins signaling pathways in the salt response of upland cotton (Gossypium hirsutum L.). Plant Cell Rep. 2015;34(6):1005–23. https://doi.org/10.1007/s00299-015-1761-5.
Sun XL, Li Y, Cai H, Bai X, Ji W, Ding XD, Zhu YM. The Arabidopsis AtbZIP1 transcription factor is a positive regulator of plant tolerance to salt, osmotic and drought stresses. J Plant Res. 2012;125(3):429–38. https://doi.org/10.1007/s10265-011-0448-4.
Tan MP. Analysis of DNA methylation of maize in response to osmotic and salt stress based on methylation-sensitive amplified polymorphism. Plant Physiol Bioch. 2010;48(1):21–6. https://doi.org/10.1016/j.plaphy.2009.10.005.
Tanaka H, Hirakawa H, Kosugi S, Nakayama S, Ono A, Watanabe A, Hashiguchi M, Gondo T, Ishigaki G, Muguerza M, Shimizu K, Sawamura N, Inoue T, Shigeki Y, Ohno N, Tabata S. Sequencing and comparative analyses of the genomes of zoysiagrasses. DNA Res. 2016;23(2):171–80. https://doi.org/10.1093/dnares/dsw006.
Teng K, Tan PH, Guo WE, Yue YS, Fan XF, Wu JY. Heterologous expression of a novel Zoysia japonica C2H2 zinc finger gene, ZjZFN1, improved salt tolerance in Arabidopsis. Front Plant Sci. 2018;9:1159. https://doi.org/10.3389/fpls.2018.01159.
Teng K, Tan PH, Xiao GZ, Han LB, Chang ZH, Chao YH. Heterologous expression of a novel Zoysia japonica salt-induced glycine-rich RNA-binding protein gene, ZjGRP, caused salt sensitivity in Arabidopsis. Plant Cell Rep. 2017;36:179–91. https://doi.org/10.1007/s00299-016-2068-x.
Tsuruta SI, Kobayashi M, Ebina M. Zoysia. In: Kole C, editor. Wild crop relatives: genomic and breeding resources. Berlin; Heidelberg: Springer; 2011. p. 297–309.
Wan SQ, Wang WD, Zhou TS, Zhang YH, Chen JF, Xiao B, Yang YJ, Yu YB. Transcriptomic analysis reveals the molecular mechanisms of Camellia sinensis in response to salt stress. Plant Growth Regul. 2018;84(1):1–12. https://doi.org/10.1007/s10725-017-0354-4.
Wang CL, Lu GQ, Hao YQ, Guo HM, Guo Y, Zhao J, Cheng HM. ABP9, a maize bZIP transcription factor, enhances tolerance to salt and drought in transgenic cotton. Planta. 2017;246(3):453–69. https://doi.org/10.1007/s00425-017-2704-x.
Wang L, Shen RX, Chen LT, Liu YG. Characterization of a novel DUF1618 gene family in rice. J Integr Plant Biol. 2014;56(2):151–8. https://doi.org/10.1111/jipb.12130.
Wang L, Yao WJ, Sun Y, Wang JY, Jiang TB. Association of transcription factor WRKY56 gene from Populus simonii×P. nigra with salt tolerance in Arabidopsis thaliana. PeerJ. 2019;7:e7291. https://doi.org/10.7717/peerj.7291.
Wang XH, Gao BW, Liu X, Dong XJ, Zhang ZX, Fan HY, Zhang L, Wang J, Shi S, Tu PF. Salinity stress induces the production of 2-(2-phenylethyl) chromones and regulates novel classes of responsive genes involved in signal transduction in Aquilaria sinensis calli. BMC Plant Biol. 2016;16:1. https://doi.org/10.1186/s12870-016-0803-7.
Weng JH, Chen YC. Variation of salinity tolerance in Zoysia clones collected from different habitats in Taiwan. Plant Prod Sci. 2001;4(4):313–6. https://doi.org/10.1626/pps.4.313.
Xie Q, Niu J, Xu XL, Xu LX, Zhang YB, Fan B, Liang XH, Zhang LJ, Yin SX, Han LB. De novo assembly of the Japanese lawngrass (Zoysia japonica Steud.) root transcriptome and identification of candidate unigenes related to early responses under salt stress. Front Plant Sci. 2015;6. https://doi.org/10.3389/fpls.2015.00610.
Xu LX, Zhang ML, Zhang XZ, Han LB. Cold acclimation treatment-induced changes in abscisic acid, cytokinin, and antioxidant metabolism in Zoysiagrass (Zoysia japonica). HortScience. 2015;50:1075–80. https://doi.org/10.1007/s10142-011-0213-8.
Yang C, Ma B, He SJ, Xiong Q, Duan KX, Yin CC, Chen H, Lu X, Chen SY, Zhang JS. Maohuzi6/ethylene insensitive3-like1 and ethylene insensitive3-like2 regulate ethylene response of roots and coleoptiles and negatively affect salt tolerance in rice. Plant Physiol. 2015;169(1):148–65. https://doi.org/10.1104/pp.15.00353.
Ying S, Zhang DF, Fu J, Shi YS, Song YC, Wang TY. Cloning and characterization of a maize bZIP transcription factor, ZmbZIP72, confers drought and salt tolerance in transgenic Arabidopsis. Planta. 2012;235(2):253–66. https://doi.org/10.1007/s00425-011-1496-7.
Yu YC, Wang L, Chen JC, Liu ZH, Park CM, Xiang FN. WRKY71 acts antagonistically against salt-delayed flowering in Arabidopsis thaliana. Plant Cell Physiol. 2017;59(2):414–22. https://doi.org/10.1093/pcp/pcx201.
Zhang DP, Wang YZ, Shen JY, Yin JF, Li DH, Gao Y, Xu WF, Liang JS. OsRACK1A, encodes a circadian clock-regulated WD40 protein, negatively affect salt tolerance in rice. Rice. 2018;11(1). https://doi.org/10.1186/s12284-018-0232-3.
Zhao H, Jiang J, Li KL, Liu GF, Tsai CJ. Populus simonii × Populus nigra WRKY70 is involved in salt stress and leaf blight disease responses. Tree Physiol. 2017;37(6):1–18. https://doi.org/10.1093/treephys/tpx020.
Acknowledgments
We thank Novogene Company (Beijing) for helping with transcriptome sequencing.
Funding
This work was funded by the National Natural Science Foundation of China [31572155, 31672195], the Natural Science Foundation of Jiangsu Province, China [BK20151371], and National Key R&D Program of China [SQ2016FY326000402].
Author information
Authors and Affiliations
Contributions
HG, XY, JC and JZ performed the physiological experiments. JW, CA and JJL performed the transcriptomic analyses and verification experiments. HG and JXL designed the experiment. JW and HG participated in writing the manuscript. All authors read and approved the final manuscript.
Corresponding author
Ethics declarations
Ethics approval and consent to participate
Not applicable.
Consent for publication
Not applicable.
Competing interests
The authors declare that they have no competing interests.
Additional information
Publisher’s Note
Springer Nature remains neutral with regard to jurisdictional claims in published maps and institutional affiliations.
Supplementary information
Additional file 1: Figure S1.
Venn diagram of the number of DEGs in the leaves and roots of Z004 and Z011 after salt treatment (a) Venn diagram of the number of DEGs in Z0041L vs Z0040L, Z00424L vs Z0040L, and Z00472L vs Z0040L. (b) Venn diagram of the number of DEGs in Z0041R vs Z0040R, Z00424R vs Z0040R, and Z00472R vs Z0040R. (c) Venn diagram of the number of DEGs in Z0111L vs Z0110L, Z01124L vs Z0110L, and Z01172L vs Z0110L. (d) Venn diagram of the number of DEGs in Z0111R vs Z0110R, Z01124R vs Z0110R, and Z01172R vs Z0110R. Figure S2. qRT-PCR validation of 20 genes randomly selected from the 39 DEGs in Table 1 in Z004 and Z011 roots. The error bars indicate the SEs.
Additional file 2: Online Resource 1
Summary of RNA-seq results and their matches to the Z. japonica genome.
Additional file 3: Online Resource 2
The proportion of reads in the Z. japonica genomic exon, intron and intergenic regions.
Additional file 4: Online Resource 3
Significant GO classification of DEGs in each comparison.
Additional file 5: Online Resource 4
Pathway classification of the DEGs in each comparison.
Additional file 6: Online Resource 5
Two hundred twenty-three DEGs selected from each comparison of Z004 and Z011 roots.
Additional file 7: Online Resource 6
Primer sequences used for qRT-PCR.
Additional file 8: Online Resource 7
Summary of RNA-seq results and their matches to the rice (Oryza sativa L. japonica) genome.
Additional file 9: Online Resource 8
Summary of RNA-seq results and their matches to the Sorghum bicolor genome.
Rights and permissions
Open Access This article is licensed under a Creative Commons Attribution 4.0 International License, which permits use, sharing, adaptation, distribution and reproduction in any medium or format, as long as you give appropriate credit to the original author(s) and the source, provide a link to the Creative Commons licence, and indicate if changes were made. The images or other third party material in this article are included in the article's Creative Commons licence, unless indicated otherwise in a credit line to the material. If material is not included in the article's Creative Commons licence and your intended use is not permitted by statutory regulation or exceeds the permitted use, you will need to obtain permission directly from the copyright holder. To view a copy of this licence, visit http://creativecommons.org/licenses/by/4.0/. The Creative Commons Public Domain Dedication waiver (http://creativecommons.org/publicdomain/zero/1.0/) applies to the data made available in this article, unless otherwise stated in a credit line to the data.
About this article

Cite this article
Wang, J., An, C., Guo, H. et al. Physiological and transcriptomic analyses reveal the mechanisms underlying the salt tolerance of Zoysia japonica Steud. BMC Plant Biol 20, 114 (2020). https://doi.org/10.1186/s12870-020-02330-6
Received:
Accepted:
Published:
DOI: https://doi.org/10.1186/s12870-020-02330-6