
Abstract
Background
Obesity is a classified risk factor for several of the world’s leading causes of death. In this study, we combined information contained in body mass index (BMI), total percentage body fat (TPBF) and relative fat mass (RFM) to estimate obesity prevalence and examine the risk factors associated with obesity.
Methods
The study recruited 1027 undergraduate students aged between 16 and 25 years using a cross-sectional study design and two-stage stratified random sampling between January and April 2019 from the Kwame Nkrumah University of Science and Technology, Kumasi, Ghana. Demographic, lifestyle, and family history of chronic disease data, were collected using a structured questionnaire. Bioelectrical impedance, along with height, weight, age, and gender, were used to estimate BMI and TPBF. The RFM was calculated using a published equation. The TPBF and RFM ranges were evaluated based on standard BMI thresholds and an informative combined obesity prevalence estimated in a Bayesian framework. Multiple logistic regression analysis was used to evaluate potential risk factors of overweight/obesity.
Results
Concordance between BMI, TPBF and RFM for obesity classification was 84% among female and 82.9% among male students. The Bayesian analysis revealed a combined prevalence means of obesity of 9.4% (95%CI: 6.9-12.2%) among female students and 6.7% (95%CI:4.3-9.5%) among male students. The odds of obesity were increased between 1.8 and 2.5 for females depending on the classification index. A significant increasing trend of obesity was observed with university-level. A family history of obesity was associated with a high estimate of general, central, and high TPBF.
Conclusion
Using multiple adiposity indicators conjointly in a Bayesian framework offers a greater power to examine obesity prevalence. We have applied this and reported high obesity prevalence, especially among female students. University level and family history of obesity were key determinants for obesity among the student population.
Introduction
Obesity is a classified risk factor for several of the world’s leading causes of death including cardiovascular diseases, diabetes, and various types of cancers [1]. It represents the 5th and 6th major level two public health problem among women and men, respectively, leading to the toll of death and disability worldwide [2]. Obesity stands out among the top leading causes of attributable disability-adjusted life years (DALYs) this is due to the rate of exposure increasing by more than 0.5% per year [3]. The prevalence of obesity has increased in pandemic dimensions over the past 50 years [4] with 650 million adults, 340 million adolescents and 39 million children classified as obese [5]. As the obesity pandemic continues, estimates indicate that approximately 167 million adults and children will become less healthy due to being overweight or obese by 2025 [4]. Especially in developing countries, the possible implications of obesity on current and future population health and healthcare spending are likely to be enormous [6].
According to existing nationwide data, the prevalence of being overweight and obese is estimated at 25.4% and 17.1%, respectively [7]. Among the adult Ghanaian population, obesity is higher in women than men and mimics the level of urbanization [7]. A meta-analysis involving 29,160 Ghanaian children (≤ 19 years) across sixteen studies reported 8.6% obesity and 10.7% overweight [8]. There exists a significant number of studies that quantify the burden of obesity in Ghana with a special focus on the general adult population [9,10,11,12,13,14], women [15,16,17,18,19,20,21], school-aged children [22,23,24], adolescents [25,26,27], healthcare workers [28,29,30,31,32], civil servants [33,34,35,36,37,38] and commercial workers [39]. However, knowledge and data about the experiences of being overweight and obese among young Ghanaian adults are inadequate. Among the few existing studies in Ghana [20, 40,41,42], there is an inconclusive estimate of those who are overweight/obese (4.2-39.3%) among the young adult population. This is due to population non-representativeness, that is, varying lifestyle habits and health-related behaviours of these age groups.
Among undergraduate students, which mainly represent the young adult population group, poor lifestyle habits, including decreased quality of diet and physical activity, sedentary lifestyle, alcohol use and smoking, as well as decreased quality sleep, are associated with obesity [42,43,44]. Also, the concurrence of altered eating behaviours (emotional eating, uncontrolled eating, and restrained eating), depression and poor sleep are estimated to be high among undergraduate students, mainly females [45]. These are fundamental factors driving the obesity epidemic [1]. Thus, exploring obesity experiences using representative sampling among undergraduate students will allow for the acquisition of information related to young Ghanaian adults. This knowledge will go a long way in informing strategies to combat the obesity epidemic and hopefully, related medical conditions among university students and the general young adult population.
We have mainly relied on the routine use of the body mass index (BMI) as an obesity measure. However, BMI has a limitation in differentiating between body composition and body fat distribution [46,47,48,49]. Alternative measures, including the bioelectrical impedance analysis (BIA) and BIA-derived body fat indices [50], like the body adiposity index [51] and relative fat mass (RFM) [52], have been proposed. These measures claim to adjust the limitations of BMI and alternatively represent cost-effective indices to appropriately identify individuals with accuracy close to that of underwater weighing [53] and dual-energy X-ray absorptiometry [54]. In particular, RFM and total percentage body fat (TPBF) have been validated as being a more accurate measure compared to BMI to estimate whole-body fat percentage, in addition to improving body fat-defined obesity misclassification among different population groups [55].
In this study, we have combined information contained in body mass index (BMI), TPBF and relative fat mass (RFM) to estimate an informative obesity prevalence. Because there is no single universally accepted measure of adiposity and each index has its drawbacks, we performed an evaluation analysis of waist-to-height derived RFM, corresponding to central fatness and TPBF corresponding to overall adiposity based on the routinely used weight-to-height derived BMI thresholds. By using data from the evaluation analysis assessing concordance and the estimate of measurement properties of TPBF and RFM with BMI, we combined this classification in a Bayesian framework. Thus, we reported an informative obesity prevalence corresponding to central and general adiposity, with much power. Our governing hypothesis was that a combined estimate of obesity in a Bayesian framework does not offer a more representative estimate than commonly used BMI, RFM and TPBF in isolation.
Because it is common in population surveys to have one or multiple measures investigating the same condition, the Bayesian framework has been useful in drawing inferences on disease prevalence and measurement properties while adjusting for the possibility of conditional dependence between several disease measures [56,57,58]. In practice, two aspects exist, that can be used to estimate uncertainty and improve the accuracy of population estimate of prevalence. The first is to use the prior information from existing studies, while the second requires the integration of multiple population-based measures into one estimate [57, 58]. In our case, we employed the second approach for this study.
Methodology
This was a cross-sectional study undertaken at the Kwame Nkrumah University of Science and Technology (KNUST), Kumasi, between August 2018 and July 2019. All students provided written informed consent for their participation in the study. Ethical approval with reference ID (CHRPE/AP/030/19) was obtained from the Committee on Human Research, Publications and Ethics (CHRPE), School of Medicine and Dentistry, Kwame Nkrumah University of Science & Technology.
Sample design
A two-stage stratified random sampling was used to select 1027 first to fourth-year undergraduate students aged 16–25 years. These students were selected to cover the six Colleges in KNUST including the College of Science (CoS), Art and Built Environment (CABE), Humanities and Social Sciences (CoHSS), Health Sciences (CoHS), Engineering (CoE), and Agric and Natural Resources (CANR). Students who were feverish, bodybuilders or highly trained athletes, and students with osteoporosis or oedema (swelling in the body) were excluded.
The targeted population consisted of undergraduate students’ population from 1st to 4th year of their academic level, across the six colleges of KNUST. The operational definition of a student’s year directly depended on the recruitment dates between January and April 2019. This period represents the second semester where first-year students have spent at least one complete semester in the college. We used a two-stage stratified cluster survey design. The study population and sampling consisted of the entire student population at KNUST (43,757) during the 2018/2019 academic year. Considering the low probability of sampling 5th and 6th -year students, available only for health sciences, were excluded from the sample. The first stage of clustering involved censoring all colleges with probabilities relative to the number of departments. From each selected college, a fixed number of departments was sampled. Eight students (two students, male and female, from levels 1st, 2nd, 3rd, and 4th year) are sampled at random at the department level.
Sample size
The required sample size to assess overweight/obesity prevalence among students was calculated assuming p = 0.18 [41], level of acceptable precision d = 0.05 (or ± 5%) at 95% CI corresponds to 227 which relate to 28 departments of 8 students in each. Using analysis of data from a previous study [41] within the same KNUST student population, the design effect was estimated at 1.9 for overweight/obesity. This was based on 6 clusters with an average of 50 students per cluster (n = 300) and an intra-cluster coefficient of 0.1. Considering these figures and while assuming a college response rate of 90% and individual students response rate at 85%, the actual sample size was estimated to be 83 departments of 8 students each (n = 664) with male and female students having equal proportion of being sampled. In the end, we recruited 1027 participants to increase the power of our estimate. Table 1 illustrates the minimum possible sampling expectations.
The equation for sample size calculation:
\(n=(z^2 \times p(1-p\left)\right(DEEF\left)\right)/\left(\right(j\left)\right(k\left)\right(l\left)\right(d^2\left)\right)\) [59].
Z was taken at 1.96, j = is the expected response rate as a proportion (0.85 × 0.9); k is the average department size (n = 8). The proportion of the student population accounted for by the targeted of interest (l) was set at 0.8. DEFF is the design effect.
Data collection and anthropometric measurement
A structured questionnaire was used to collect data on socio-demographic characteristics, lifestyle risk factors and family history of obesity, diabetes and hypertension (Table 2). socio-demographic data included age, sex, year of study, and college. Lifestyle data included alcohol intake, smoking and exercise history. Height was measured with a portable height rod Stadiometer with students in a straight posture, feet placed together and flat on the ground. Waist circumference (WC) was measured using a tape measure at the point of the umbilicus and maximum gluteal protrusion. Each participant was asked to stand straight on the main unit of the OMRON BF511 Clinically Validated Full Body Composition Monitor with 8 high-precision sensors for hand-to-foot measurement (OMRON HEALTHCARE Co., Ltd.), looking straight, barefooted and with arms horizontally raised holding a display unit, extended at a 90° angle for weight, body fat mass (BFM) and TPBF estimation. The machine conforms to EN60601-1-2:2015 Electro Magnetic Compatibility (EMC) standard and uses the bioelectrical impedance, along with height, weight, age and gender information to generate results based on the OMRON’s data of body composition [60]. The Omron Full Body Sensor Body Composition Monitor and Scale estimates the TPBF by the Bioelectrical Impedance Method. The instrument sends an extremely weak electrical current of 50 kHz and less than 500 µA through the participant’s body to determine the amount of water in each tissue. The instrument takes measurements from both hands and feet to reduce the influence of water movement on body composition results. The output of the OMRON BF511 monitor included TPBF, relative visceral fat content, body mass index (BMI), and skeletal muscle. We included the TPBF and BMI output together with RFM for the analysis. RFM was calculated from WC and height:
Obesity was defined based on BMI thresholds for overweight (≥ 25 Kg/m2), and obesity (≥ 30 Kg/m2) according to the World Health Organization’s criteria [1].
Statistical analyses
Patient characteristics were stratified by primary clusters (colleges). Counts and corresponding percentages were used to describe categorical variables and compared using the Chi-square test. Mean and standard deviations were used to describe continuous variables if they followed the Gaussian normal distribution. Median and interquartile ranges were used if otherwise distributed. Either the One-way analysis of variance or Kruskal-Willi’s test was used to compare continuous variables among primary clusters. Multiple comparison analysis with Bonferroni correction was performed when the probability value was < 0.05. Sex-stratified prevalence estimates for obesity were determined according to BMI thresholds and the corresponding TPBF and RFM thresholds for age. The Passing and Bablok regression analysis was used to evaluate the measurement agreement and possible systematic bias for TPBF and RFM against BMI [61]. The diagnostic accuracy of TPBF and RFM was estimated based on the optimal cut-off, sensitivity, and specificity analysis, considering the area under the curve (AUC) estimated with the receiver-operating characteristic curves (ROC) analysis. We integrated the results from TPBF and RFM for obesity definition based on BMI threshold in a Bayesian framework, to report a combined obesity prevalence. Twenty chains were used to sample 50,000 samples per chain (25,000 warmups and 25,000 post warmups). Posterior densities were estimated using the Hamiltonian Monte Carlo (HMC) method. Summaries of posterior distributions including the mean and 95% credible interval were used to interpret the results. Multiple logistic regression analysis was used to evaluate potential risk factors of overweight/obesity. A two-sided p-value of 0.05 was considered statistically significant. Statistical analyses were performed using R version 4.3.0 (2023-04-21 ucrt) and MedCalc software Bvba, version 18.9.1.
Results
Table 2 displays the characteristics of the study participants by sampling strata. There was a significant over-representation of female students at CoHSS and underrepresentation at CABE and CoE (p-value < 0.001). The proportion of students that consume alcohol was comparatively low in CoHS (p-value = 0.039). Compared with CANR and CoHSS, a significant proportion of students from CoHS (31.2%), CoE and CoS (18.4% each) never engaged in regular exercise (p-value < 0.001). We observed significant variance in TPBF% measurements compared across the colleges (p-value < 0.001).
Prevalence of being overweight and Obese based on standard BMI thresholds
Using BMI ≥ 25.0 Kg/m2, approximately 31% and 15% of female and male students were classified as overweight/obese. However, only 2.4% of male students and 8.0% of female students were classified as obese using BMI ≥ 30.0 Kg/m2 (Table 3). We observed a trend towards increased overweight/obesity with age. Among students < 20 years, 26.3% and 13.6% female and male, respectively, were classified as being overweight and/or obese. Among ≥ 20 years female and male students, 34.5% and 15.5% were classified as overweight and/or obese.
Evaluation of RFM and BAI-derived TPBF based on BMI
Passing and Bablok regression analysis are shown in Table S1. Here we emphasised the interpretation based on the observed random difference. The null assumption was that the observed random differences within ± 1.96 residual standard deviation (RSD) > 10%. Linearity between the variables was evaluated based on the custom test for linearity probability value (Table S1, Figure S1). Concordance was observed between TPBF and BMI (RSD = 1.60, ± 1.96 = -3.14 to 3.14) compared with RFM (RSD = 2.64, ± 1.96 = -5.17 to 5.17) among male students. Similarly, among female students, TPBF demonstrated good agreement with BMI (RSD = 2.23, ± 1.96 = -4.37 to 4.37) compared to RFM (RSD = 2.98, ± 1.96 = -5.83 to 5.83). The linearity test revealed a significant deviation from linearity between TPBF and BMI (p-value < 0.01) and between BMI and RFM (p-value > 0.05). The ROC curve analysis (Fig. 1) identified TPBF threshold values of > 20.3% and > 20.8% and was associated with high information values for defining being overweight (BMI > 29.9 Kg/m2) among male students: 15–19 years (AUC = 0.941, sensitivity = 100.0%, specificity = 87.8%) and 20–25 years (AUC = 0.942, sensitivity = 94.4%, specificity = 89.6%), respectively. Also, TPBF threshold values for defining obesity (BMI ≥ 30.0 Kg/m2) among 15–19 years and 20–25 years female students were > 35.4% and > 35.2%, respectively (Fig. 1).

Threshold of TPBF and RFM estimates corresponding to WHO-defined BMI thresholds for overweight among male and female students
An optimal threshold value for TPBF > 26.2% (AUC = 0.981, sensitivity = 100.0%, specificity = 95.2%) for males (15–19 years) and > 24.4% (AUC = 0.938, sensitivity = 80.0%, specificity = 92.0%) had exceptional diagnostic accuracy for obesity (BMI ≥ 29.9 Kg/m2) among male students (Fig. 2). The TPBF threshold of > 35.4% and > 35.2 was optimal for defining overweight female students 15–19 years and 20–25 years, respectively. TPBF values > 41.8% and 44.3% were optimal for defining obesity among female students 15–19 years and 20–25 years.

Threshold of TPBF and RFM estimates corresponding to WHO-defined BMI thresholds for obesity among male and female students
The ROC curve analysis of RFM for defining overweightness revealed an optimal cut-off of > 18.6 and > 20.5 among 15–19 years and 20–25 years male students, respectively (Fig. 1c and f). RFM thresholds for defining obesity were > 25.4 and > 22.6 among male students 15–19 years and 20–25 years respectively (Fig. 2a and f). Among female students (Fig. 3a and b), RFM thresholds of > 20.7 and > 20.9 were associated with high information values for defining overweight among 15–19 years and 20 − 15 years, respectively. Moreover, obesity definition thresholds were > 24.5 and > 25.2, respectively among female students 15–19 years and 20 − 15 years (Fig. 3c and d).

Threshold of RFM estimates corresponding to WHO-defined BMI thresholds for overweight and obesity among female students
The concordance between BMI, TPBF and RFM for obesity classification was 84% (95% lower limit = 82.0%) among female students and 82.9% (95% lower limit = 80.5%) among male students. The findings of the posterior predictive checks using the simulated data are presented in Figure S3. The results of the Bayesian analysis suggest that the combined prevalence mean of overweight/obesity for TPBF and RFM were 33.8% (95%CI: 29.2-38.6%) among female students and 17.0% (95%CI: 13.1-21.3%) among male students. The combined prevalence mean of obesity for TPBF and RFM was 9.4% (95%CI: 6.9-12.2%) among female students and 6.7% (95%CI: 4.3-9.5%) among female students (Fig. 4).
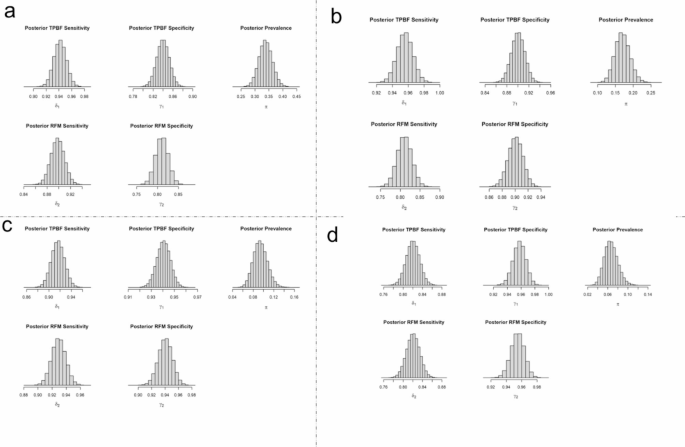
Marginal posterior density for the prevalence of obesity using combined data from TBPF and RFM. Note: π represents posterior prevalence using both TPBF and RFM data, δ1 represents sensitivity for TPBF data, γ1 represents specificity for TPBF data, δ2 represents sensitivity for RFM data, and γ2 represents specificity for RFM data
Factors associated with overweight/obesity among students
From the Multiple Logistic Regression analysis sex and family history of education were found to be consistent factors associated with general and central adiposity and percentage body fat distribution. The odds of being overweight were increased between 1.8 and 2.5, for women, depending on the classification criteria (Table 4). Family history of obesity was associated with increased odds of general obesity (OR = 3.48, 95%CI: 2.04–5.91), central obesity (OR = 1.98, 95%CI: 1.18–3.30) and high percentage body fat distribution (OR = 2.36, 95%CI: 1.42–3.94). Compared with first years students, the odds of central obesity and high percentage body fat were increased among third year students: OR = 2.77(1.59–4.82) and OR = 1.79(1.05–3.08), and fourth year students: OR = 3.26(1.76–6.04) and OR = 2.34(1.29–4.23), respectively.
Discussion
This study sought to investigate the prevalence and risk factors of obesity among undergraduate students using multiple adiposity indices in a Byersian framework. In general the prevalence of being overweight/obese in this age group of young adults was high: 33.8% among female students and 17.0% among male students. Significant association were found between being overweight/obese and potential factors including sex, family history of obesity and university level.
Using the combined informative estimate, we observed an obesity prevalence of 6.7% among male students and 9.4% among female students. More generally, 17.0% of male students and 33.8% of female students were classified as having weight status corresponding to abnormal central and general adiposity as well as high body fat accumulation. These estimates are within the obesity prevalence range of 1.7–19.0% as estimated by a previous study in the same population group using different anthropometric indices [41]. Among the university student population in Botswana [43] and Ghana [44], similar estimates of overweight and/or obesity prevalence have been reported. In a larger study representing university students from 22 countries [62], 14.1% and 5.2% of female students and 18.9% and 5.8% of male students were reported to be overweight and obese, respectively. These data highlight the significant burden of obesity among undergraduate university students, which has a potential future health impact. In line with the current 16.2%, tertiary enrolment rate in Ghana [63], the current estimate of obesity reflects a significant national obesity problem among the young adult population with significant future health consequences.
We believe our estimate may be a true reflection of the obesity burden among student populations. First, TPBF and RFM contain high information values for obesity and fat distribution classification. Second, RFM is less accurate than BMI in lean individuals [64] whiles BAI-derived TPBF is less accurate than BMI in obese individuals [65]. Thus, combining these measures in a population estimation of obesity would provide a value informed by a broader distribution of obesity and fat distribution among the population group. Third, we relied on prior information from the concordance between both RFM and TPBF with standard BMI thresholds and a previous study from the same population [41]. Finally, the method adapted for the estimation of the combined prevalence of obesity has been successfully applied elsewhere [66]. Because this approach could be more flexible and adaptable, there is a need to test its performance in other settings with other related adiposity estimates.
An important observation of concern was the proportion of overweight/obese female students, which was higher compared with male students. This observation is consistent in several other studies [40, 41, 43, 62], suggesting an increased risk for weight gain in young women and the critical need for interventions to prevent obesity and the host of associated adverse health outcomes. The evidence has been confirmed in several nationally representative surveys, where greater increases in weight are observed in young women aged 18 to 35 years compared with those seen in older women [67]. In a study among young Ghanain women aged between 15 and 24 years [20], overweight/obesity increased by 49% between 1993 and 2014 and projected a future prevalence of 35% by the year 2040. Fat deposition in women usually begins with the onset of puberty and continues unless consciously controlled [68]. Some studies has reported that female transition from adolescence to adulthood is associated with certain obesogenic dietary and physical activity behaviours to satisfy a historic valorization of large body size as a function of beauty, sexual attraction, prosperity, health and prestige [20, 69, 70].
In a prospective analysis of mother-daughter dyads and father-son dyads, the study reported a large and concerning increase in obesity rates over two generations of young adults, especially females [71]. These findings indicate that young adulthood represents periods of crucial importance regarding the establishment of life-long lifestyle habits and skills to control obesity. Studies have attributed this to a lack of knowledge and skills around food and nutrition, depression, anxiety, stress, satiety, neural responses, and possibly sleep patterns and premenstrual cravings [42,43,44, 67, 72]. Thus, there is the need to study these factors and their relationship with obesity among undergraduate students in Ghana, which can benefit future interventions.
We observed a trend in increasing obesity prevalence with academic level such that third- and fourth-year students had significantly increased obesity prevalence than first- and second-year students. Similar findings have been observed in other related studies [41, 73, 74] but not all [75]. This relationship may suggest the role of other factors of obesity associated with progressive academic level, which was not the focus of this study. We recommend future research to focus on changing lifestyle and eating habits of students related to progressive academic level. We replicated the association between obesity and family history and increased risk of obesity prevalence. This finding contributes to the evidence that genetics play an important role in the onset of obesity and the severity of obesity [76, 77]. In several studies, sendentary life has been strsongly associated with being overweight/obese [11, 17, 27, 28]. However, we did not find a significant association between being overweight/obese and students engagement in regular physical activity.
We would like to acknowledge some limitations of this study. First, Bayesian modelling is reliance on prior information, in our case we used the prior prevalence, concordance and diagnostic estimates obtained from the linked data and previous studies within the same population. As such, our analyses are limited by the accuracy of standard BMI thresholds for classifying obesity. Second, female students were over-represented in the dataset, which could bias the estimation of obesity prevalence. Although, we considered this in the analysis by reporting sex-specific prevalence estimates. Also, the generalizability of our estimate may be limited as data were obtained from only one tertiary institution in Ghana. This approach is significant to fill a gap in the current lack of consensus on the appropriate adiposity index and serves as the opportunity to unique data linkage and novel analytical techniques to improve obesity surveillance.
Conclusion
As different adiposity indices become increasingly available, multiple indicators used in combination may offer a greater power to examine obesity prevalence. We have demonstrated this by integrating central adiposity and percentage body fat criteria relative to standard BMI thresholds in a Bayesian framework and reported high obesity prevalence, especially among female students. We also demonstrated that obesity prevalence increases with university level and among students with a family history of obesity. The study suggests that the prevalence of being overweight or obese is expected to increase in the coming years, leading to several health issues. It emphasizes the requirement for public health efforts and interventions at a national level to control the problem and its associated costs and co-morbidities. Furthermore, interventions against obesity should be customized to target the socio-demographic disparities highlighted in the study.
Data Availability
The datasets and codes used and/or analysed during the current study are within the manuscript, and available at the GitHub repository (https://github.com/EvansKCCR/obesity_among_students).
Abbreviations
- RFM:
-
Relative fat mass
- TPBF:
-
Total percentage of body fat
- BMI:
-
Body mass index
- BIA:
-
Bioelectrical impedance analysis
- KNUST:
-
Kwame Nkrumah University of Science and Technology
- DEFF:
-
Design effect
- ROC:
-
Receiver operative characteristics curve
- AUC:
-
Area under the curve
- HMC:
-
Hamiltonian Monte Carlo
- RSD:
-
Residual standard deviation
References
Obesity. and overweight. In: Department of Sustainable Development and Healthy Environments World Health Organization; 2021.
Murray CJL, Aravkin AY, Zheng P, Abbafati C, Abbas KM, Abbasi-Kangevari M, Abd-Allah F, Abdelalim A, Abdollahi M, Abdollahpour I et al. Global burden of 87 risk factors in 204 countries and territories, 1990–2019:a systematic analysis for the global burden of Disease Study 2019. The Lancet. 2020;396(10258):1223–49.
Murray CJL, Abbafati C, Abbas KM, Abbasi M, Abbasi-Kangevari M, Abd-Allah F, Abdollahi M, Abedi P, Abedi A, Abolhassani H, et al. Five insights from the global burden of Disease Study 2019. The Lancet. 2020;396(10258):1135–59.
Blüher M. Obesity: global epidemiology and pathogenesis. Nat Reviews Endocrinol. 2019;15(5):288–98.
World Obesity Day. 2022 – Accelerating action to stop obesity. In.: World Health Organization; 2022.
Nugent R. Chronic Diseases in developing countries: health and economic burdens. Ann N Y Acad Sci. 2008;1136(1):70–9.
Ofori-Asenso R, Agyeman AA, Laar A, Boateng D. Overweight and obesity epidemic in Ghana—a systematic review and meta-analysis. BMC Public Health. 2016;16(1):1–18.
Akowuah PK, Kobia-Acquah EJJoN. Metabolism: Childhood obesity and overweight in Ghana: a systematic review and meta-analysis. Journal of Nutrition Metabolism 2020, 2020.
Amegah A, Lumor S, Vidogo FJAJF. Agriculture, Nutrition, Development: prevalence and determinants of overweight and obesity in adult residents of Cape Coast, Ghana: a hospital-based study. Afr J Food Agric Nutr Dev 2011, 11(3).
Anderson AK. Prevalence of anemia, overweight/obesity, and undiagnosed Hypertension and Diabetes among residents of selected communities in Ghana. Int J Chronic Dis 2017, 2017.
Boateng GO, Adams EA, Odei Boateng M, Luginaah IN, Taabazuing M-M. Obesity and the burden of health risks among the elderly in Ghana: a population study. PLoS ONE. 2017;12(11):e0186947.
Nyakotey DA, Ananga AS, Apprey C. Assessing physical activity, nutrient intake and obesity in middle-aged adults in Akuse, Lower Manya Krobo, Ghana. J Health Res. 2022;36(2):199–208.
Obirikorang C, Osakunor DNM, Anto EO, Amponsah SO, Adarkwa OK. Obesity and cardio-metabolic risk factors in an urban and rural population in the Ashanti Region-Ghana: a comparative cross-sectional study. PLoS ONE. 2015;10(6):e0129494.
William K. Obesity and cardiovascular risk factors in a Pentecostal population in Kumasi-Ghana. J Med Sci. 2008;8(8):682–90.
Agbeko MP, Akwasi K-K, Andrews DA, Gifty OB. Predictors of overweight and obesity among women in Ghana. Open Obes J 2013, 5(1).
Asosega KA, Adebanji AO, Abdul IW. Spatial analysis of the prevalence of obesity and overweight among women in Ghana. BMJ open. 2021;11(1):e041659.
Asosega KA, Aidoo EN, Adebanji AO, Owusu-Dabo E. Examining the risk factors for overweight and obesity among women in Ghana: A multilevel perspective. Heliyon 2023.
Marquis GS, Colecraft EK, Bannerman B, Thompson-Colón T. Overweight and obesity among women in a predominantly rural district of Ghana. The FASEB Journal 2016, 30:667.669-667.669.
Tuoyire DA. Television exposure and overweight/obesity among women in Ghana. BMC Obes. 2018;5(1):1–10.
Tuoyire DA. Overweight/obesity among 15-to 24-year-old women in Ghana: 21-year trend, future projections and socio-demographic correlates. J Biosoc Sci. 2021;53(6):839–55.
Tuoyire DA, Kumi-Kyereme A, Doku DT. Socio-demographic trends in overweight and obesity among parous and nulliparous women in Ghana. BMC Obes. 2016;3(1):1–14.
Adom T, De Villiers A, Puoane T, Kengne AP. Prevalence and correlates of overweight and obesity among school children in an urban district in Ghana. BMC Obes. 2019;6:1–11.
Aryeetey R, Lartey A, Marquis GS, Nti H, Colecraft E, Brown P. Prevalence and predictors of overweight and obesity among school-aged children in urban Ghana. BMC Obes. 2017;4:1–8.
Mogre V, Gaa PK, Abukari RNS. Overweight, obesity and thinness and associated factors among school-aged children (5–14 years) in Tamale, Northern Ghana. Eur Sci J 2013, 9(20).
Akoto S, Tandoh MA, Nsiah K, Asamoah-Boakye O, Annaful VT. Lifestyle habits, macronutrient intake, and obesity prevalence among adolescents in rural-periurban community senior high schools in the Ho municipality of Ghana. Front Nutr 2022, 9.
Peltzer K, Pengpid S. Overweight and obesity and associated factors among school-aged adolescents in Ghana and Uganda. Int J Environ Res Public Health. 2011;8(10):3859–70.
Amoh I, Appiah-Brempong E. Prevalence and risk factors of obesity among senior high school students in the Adansi North district of Ghana. Int J Community Med Public Health. 2017;4(10):3762–9.
Aryee P, Helegbe G, Baah B, Sarfo-Asante R, Quist-Therson R. Prevalence and risk factors for overweight and obesity among nurses in the tamale metropolis of Ghana. J Med Biomedical Sci. 2013;2(4):13–23.
Duodu C, Awuni TK, Attito P, Zotor FB. Assessment of overweight and obesity prevalence among practicing nurses and midwives in the Hohoe Municipality of the Volta Region, Ghana. Sci J Public Health. 2015;3(6):842–51.
Obirikorang Y, Obirikorang C, Enoch O, Acheampong E, Tuboseiyefah P, Miriam A, Emmanuella N. Prevalence and risk factors of obesity among practicing nurses at three selected hospitals in Kumasi Metropolis, Ghana. J Med Biomedical Sci. 2016;5(3):45–55.
Amo-Mensah P, Vanotoo L, Davies-Teye B. Prevalence of overweight and Obesity among Health Personnel in an urban Ghana: a descriptive cross-sectional study, 2017. Value in Health. 2017;20(9):A544.
Abubakar MB, Uthman YA, Ibrahim KG. Prevalence of overweight and obesity among health-care workers in Ghana: a systematic review. Nigerian J Experimental Clin Biosci. 2021;9(1):47.
Addo J, Smeeth L, Leon D. Obesity in urban civil servants in Ghana: association with pre-adult wealth and adult socio-economic status. Public Health. 2009;123(5):365–70.
Addo P. Prevalence of obesity and overweight and Associated factors among Financial Institution workers in Accra Metropolis, Ghana: a Case Control Study. Value in Health. 2016;19(7):A579.
Addo PN, Nyarko KM, Sackey SO, Akweongo P, Sarfo B. Prevalence of obesity and overweight and associated factors among financial institution workers in Accra Metropolis, Ghana: a cross sectional study. BMC Res Notes. 2015;8(1):1–8.
Atuahene M, Ganle JK, Adjuik M, Atuahene NF, Kampitib GB. Overweight and obesity prevalence among public servants in Nadowli district, Ghana, and associated risk factors: a cross-sectional study. BMC Obes. 2017;4(1):1–8.
Kumah DB. Prevalence of overweight and obesity among staff of a Tertiary Institution in Kumasi, Ghana. EC Nutr. 2016;5:1277–81.
Nuertey BD, Alhassan AI, Nuertey AD, Mensah IA, Adongo V, Kabutey C, Addai J, Biritwum RB. Prevalence of obesity and overweight and its associated factors among registered pensioners in Ghana; a cross sectional studies. BMC Obes. 2017;4(1):1–12.
Anto EO, Owiredu W, Adua E, Obirikorang C, Fondjo LA, Annani-Akollor ME, Acheampong E, Asamoah EA, Roberts P, Wang W. Prevalence and lifestyle-related risk factors of obesity and unrecognized Hypertension among bus drivers in Ghana. Heliyon. 2020;6(1):e03147.
Mogre V, Nyaba R, Aleyira S. Lifestyle risk factors of general and abdominal obesity in students of the school of medicine and health science of the University of Development Studies, Tamale, Ghana. International Scholarly Research Notices 2014, 2014.
Obirikorang C, Anto EO, Addai P, Obirikorang Y, Acheampong E. Prevalence and risks factors of overweight/obesity among undergraduate students: an institutional based cross-sectional study, Ghana. J Med Biomedical Sci. 2017;6(1):24–34.
Agyei A, Yorke E, Boima V. Prevalence of overweight and obesity and its relation to Diet and physical activity among medical students in Accra, Ghana. Afr J Health Sci. 2022;35(2):99–113.
Tapera R, Merapelo MT, Tumoyagae T, Maswabi TM, Erick P, Letsholo B, Mbongwe B. The prevalence and factors associated with overweight and obesity among University of Botswana students. Cogent Med. 2017;4(1):1357249.
Mogre V, Nyaba R, Aleyira S. Lifestyle risk factors of general and abdominal obesity in students of the school of medicine and health science of the University of Development Studies, Tamale, Ghana. ISRN obesity 2014, 2014.
Amoako M, Amoah-Agyei F, Du C, Fenton JI, Tucker RM. Emotional Eating among Ghanaian University Students: Associations with Physical and Mental Health Measures. 2023, 15(6):1526.
Dolan CM, Kraemer H, Browner W, Ensrud K, Kelsey JL. Associations between body composition, anthropometry, and mortality in women aged 65 years and older. Am J Public Health. 2007;97(5):913–8.
Kontogianni MD, Panagiotakos DB, Skopouli FN. Does body mass index reflect adequately the body fat content in perimenopausal women? Maturitas. 2005;51(3):307–13.
Obirikorang C, Obirikorang Y, Acheampong E, Anto EO, Toboh E, Asamoah EA, Amakwaa B, Batu EN, Brenya P. Association of wrist circumference and waist-to-height ratio with cardiometabolic risk factors among type II diabetics in a Ghanaian population. Journal of diabetes research 2018, 2018.
Frankenfield DC, Rowe WA, Cooney RN, Smith JS, Becker D. Limits of body mass index to detect obesity and predict body composition. Nutrition. 2001;17(1):26–30.
Sun SS, Chumlea WC, Heymsfield SB, Lukaski HC, Schoeller D, Friedl K, Kuczmarski RJ, Flegal KM, Johnson CL, Hubbard VS. Development of bioelectrical impedance analysis prediction equations for body composition with the use of a multicomponent model for use in epidemiologic surveys. Am J Clin Nutr. 2003;77(2):331–40.
Freedman DS, Thornton JC, Pi-Sunyer FX, Heymsfield SB, Wang J, Pierson RN Jr, Blanck HM, Gallagher D. The body adiposity index (hip circumference ÷ height1. 5) is not a more accurate measure of adiposity than is BMI, waist circumference, or hip circumference. Obesity. 2012;20(12):2438–44.
Senkus KE, Crowe-White KM, Locher JL, Ard JD. Relative fat mass assessment estimates changes in adiposity among female older adults with obesity after a 12-month exercise and diet intervention. Ann Med. 2022;54(1):1160–6.
Brodowicz GR, Mansfield RA, McClung MR, Althoff SA. Measurement of body composition in the elderly: dual energy x-ray absorptiometry, underwater weighing, bioelectrical impedance analysis, and anthropometry. Gerontology. 1994;40(6):332–9.
Bi Y, Wang R. Application of DEXA to body composition measurement. Sports Sci Res. 2008;29(1):17.
Woolcott OO, Bergman RN. Relative fat mass (RFM) as a new estimator of whole-body fat percentage a cross-sectional study in American adult individuals. Sci Rep. 2018;8(1):10980.
Joseph L, Gyorkos TW, Coupal L. Bayesian estimation of Disease Prevalence and the parameters of diagnostic tests in the absence of a Gold Standard. Am J Epidemiol. 1995;141(3):263–72.
Erkanli A, Soyer R, Stangl D. Hierarchical bayesian analysis for Prevalence Estimation. Case studies in bayesian statistics: 1997// 1997; New York. NY: Springer New York; 1997. pp. 325–46.
Speybroeck N, Devleesschauwer B, Joseph L, Berkvens DJI. Misclassification errors in prevalence estimation: bayesian handling with care. 2013, 58:791–5.
Arya R, Antonisamy B, Kumar SJTIJP. Sample size estimation in prevalence studies. 2012, 79:1482–8.
Manual OI. Full body Sensor Body Composition Monitor and Scale Model HBF–510. China: Omron Healthcare 2008.
Passing H, Bablok. A new biometrical procedure for testing the equality of measurements from two different analytical methods. Application of linear regression procedures for method comparison studies in clinical chemistry, part I. J Clin Chem Clin Biochem Z fur Klinische Chemie Und Klinische Biochemie. 1983;21(11):709–20.
Peltzer K, Pengpid S, Samuels TA, Özcan NK, Mantilla C, Rahamefy OH, Wong ML, Gasparishvili A. Prevalence of overweight/obesity and its associated factors among university students from 22 countries. Int J Environ Res Public Health. 2014;11(7):7425–41.
Ghana - Gross. enrolment ratio in tertiary education [https://knoema.com/atlas/Ghana/topics/Education/Tertiary-Education/Gross-enrolment-ratio-in-tertiary-education].
Woolcott OO, Bergman RN. Relative Fat Mass as an estimator of whole-body fat percentage among children and adolescents: a cross-sectional study using NHANES. Sci Rep. 2019;9(1):15279.
Li YC, Li CI, Lin WY, Liu CS, Hsu HS, Lee CC, Chen FN, Li TC, Lin CC. Percentage of body fat assessment using bioelectrical impedance analysis and dual-energy X-ray absorptiometry in a weight loss program for obese or overweight Chinese adults. PLoS ONE. 2013;8(4):e58272.
Edwards J, Pananos AD, Thind A, Stranges S, Chiu M, Anderson KK. A bayesian approach to estimating the population prevalence of mood and anxiety disorders using multiple measures. Epidemiol Psychiatric Sci. 2021;30:e4.
Pegington M, French DP, Harvie MN. Why young women gain weight: a narrative review of influencing factors and possible solutions. 2020, 21(5):e13002.
Ersoy C, Imamoglu S. Comparison of the obesity risk and related factors in employed and unemployed (housewife) premenopausal urban women. Diabetes Res Clin Pract. 2006;72(2):190–6.
Cohen E, Boetsch G, Palstra FP, Pasquet P. Social valorisation of stoutness as a determinant of obesity in the context of nutritional transition in Cameroon: the Bamiléké case. Social science & medicine (1982) 2013, 96:24–32.
Jokela M, Elovainio M, Kivimäki M. Lower fertility associated with obesity and underweight: the US National Longitudinal Survey of Youth. Am J Clin Nutr. 2008;88(4):886–93.
Alati R, Betts KS, Williams GM, Najman JM, Zalbahar N, Mamun A. Generational increase in obesity among young women: a prospective analysis of mother–daughter dyads. Int J Obes. 2016;40(1):176–80.
Eating Patterns of Young Women (18–25 y) with Overweight and Obesity: A Preliminary Investigation. 2023, 15(7):1652.
Elham AA, Anas A, Ikram K, Jayakumary M. Obesity among university students: a cross-sectional study in Ajman, UAE. 2015.
Ghazawy ER, Mahfouz EM, Rahman A-E, Ahmed T. Emam SAJMJoMR: Obesity/Overweight among University students. Minia Egypt. 2022;33(3):30–6.
Boukrim M, Obtel M, Lahlou L, Razine R. University students’ perceptions and factors contributing to obesity and overweigh in Southern of Morocco. Afr Health Sci. 2021;21(2):942–50.
Corica D, Aversa T, Valenzise M, Messina MF, Alibrandi A, De Luca F. Wasniewska MJFie: Does family history of obesity, cardiovascular, and metabolic diseases influence onset and severity of childhood obesity? 2018, 9:187.
van der Sande MA, Walraven GE, Milligan PJ, Banya WA, Ceesay SM, Nyan OA. McAdam KPJBotWho: family history: an opportunity for early interventions and improved control of Hypertension, obesity and Diabetes. 2001, 79(4):321–8.
Acknowledgements
We would like to thank the students of KNUST who dedicated their time and participation to this study. We also express our gratitude to the KNUST Counselling unit and the University Hospital for their support during the data collection.
Funding
This research did not receive any specific grant from funding agencies in the public, commercial, or not-for-profit sectors.
Author information
Authors and Affiliations
Contributions
CO, LB, and AAA conceptualized, designed the study, and edited the manuscript. EAA, EOA and AOB analyzed, interpreted the data, and drafted the paper. ANB, GOS and PNA assisted in data acquisition and measurement. YO, IOB, ENYN and AGA contributed to writing and editing the manuscript. All authors have read and approved the final version before submission.
Corresponding author
Ethics declarations
Ethical approval and consent to participate
Ethical approval with reference ID (CHRPE/AP/030/19) was obtained from the Committee on Human Research, Publications and Ethics (CHRPE), School of Medicine and Dentistry, Kwame Nkrumah University of Science & Technology. Written informed consent was obtained from participants 18 years and above and assent from minors (< 18 years) who opted to participate in the study. Additionally, informed consent to participate was taken from the legal guardians of minor participants. All methods were performed following the guidelines and regulations of the Helsinki Declaration.
Consent for publication
Not applicable.
Competing interests
The authors declare no competing interests.
Additional information
Publisher’s Note
Springer Nature remains neutral with regard to jurisdictional claims in published maps and institutional affiliations.
Electronic supplementary material
Below is the link to the electronic supplementary material.
Rights and permissions
Open Access This article is licensed under a Creative Commons Attribution 4.0 International License, which permits use, sharing, adaptation, distribution and reproduction in any medium or format, as long as you give appropriate credit to the original author(s) and the source, provide a link to the Creative Commons licence, and indicate if changes were made. The images or other third party material in this article are included in the article’s Creative Commons licence, unless indicated otherwise in a credit line to the material. If material is not included in the article’s Creative Commons licence and your intended use is not permitted by statutory regulation or exceeds the permitted use, you will need to obtain permission directly from the copyright holder. To view a copy of this licence, visit http://creativecommons.org/licenses/by/4.0/. The Creative Commons Public Domain Dedication waiver (http://creativecommons.org/publicdomain/zero/1.0/) applies to the data made available in this article, unless otherwise stated in a credit line to the data.
About this article

Cite this article
Obirikorang, C., Adu, E.A., Anto, E.O. et al. Prevalence and risk factors of obesity among undergraduate student population in Ghana: an evaluation study of body composition indices. BMC Public Health 24, 877 (2024). https://doi.org/10.1186/s12889-023-17175-5
Received:
Accepted:
Published:
DOI: https://doi.org/10.1186/s12889-023-17175-5