
Abstract
The rising rate [\(\beta _{\mathrm{a}}\)] of a solar cycle is a good indicator for the subsequent maximum amplitude [\(S_{\mathrm{m}}\)] of sunspot numbers. We compared the correlation between \(S_{\mathrm{m}}\) and \(\beta _{\mathrm{a}}\) and that between \(S_{\mathrm{m}}\) and the early value of the smoothed monthly mean sunspot number [\(S_{\mathrm{N}}\)] \(\Delta m\) months after the solar minimum. Our main conclusions are as follows: i) The correlation coefficient [\(r\)] between \(S_{\mathrm{m}}\) and \(S_{\mathrm{N}}\) is slightly higher than that between \(S_{\mathrm{m}}\) and \(\beta _{\mathrm{a}}\), and both increase with \(\Delta m\) as the cycle progresses; ii) In the first year of the cycle, the correlation is weak [\(r\sim \) 0.56]. At the inflection point [\(\Delta m=21\)], the correlation is stronger [\(r = 0.83\)]. After the inflection point, \(r\) increases slowly with \(\Delta m\). Three years after the solar minimum, \(r\geqslant 0.90\). Around the average rise time [52 months], \(r=0.95\); iii) The correlation between \(S_{\mathrm{m}}\) and \(S_{\mathrm{N}}\) (or \(\beta _{\mathrm{a}}\)) in even-numbered cycles is stronger than that in odd-numbered ones, and the latter is slightly weaker than that for all the cycles; iv) The mean relative error [\(\eta \)] of \(S_{\mathrm{m}}\) decreases and the MSE (Mean Square Error) skill score [\(S_{\mathrm{c}}\)] increases with \(\Delta m\). One, two, three, and four years after the solar minimum: \(\eta \leqslant 19\%\), \(14\%\), \(10\%\), and \(6.5\%\), \(S_{\mathrm{c}}\geqslant 0.24\), 0.68, 0.86, and 0.97, respectively; v) Currently [\(\Delta m=20\)], the maximum amplitude of Cycle 25 is predicted to be \(135.5\pm 33.2\) and to occur around December 2024 (± 11 months).


Data Availability
The data can be downloaded from the Sunspot Index and Long-term Solar Observations (SILSO) website (wwwbis.sidc.be/silso/datafiles).
References
Burud, D.S., Jain, R., Awasthi, A.K., Chaudhari, S., Tripathy, S.C., Gopalswamy, N., Chamadia, P., Kaushik, S.C., Vhatkar, R.: 2021, Spotless days and geomagnetic index as the predictors of solar cycle 25. Res. Astron. Astrophys. 21, 215. DOI.
Cameron, R., Schüssler, M.: 2007, Solar cycle prediction using precursors and flux transport models. Astrophys. J. 659, 801. DOI.
Cameron, R., Schüssler, M.: 2008, A robust correlation between growth rate and amplitude of solar cycles: consequences for prediction methods. Astrophys. J. 685, 1291. DOI.
Choudhuri, A.R., Chatterjee, P., Jiang, J.: 2007, Predicting solar cycle 24 with a solar dynamo model. Phys. Rev. Lett. 98, 131103. DOI.
Chowdhury, P., Kilcik, A., Yurchyshyn, V., Obridko, V.N., Rozelot, J.P.: 2019, Analysis of the hemispheric sunspot number time series for the solar cycles 18 to 24. Solar Phys. 294, 142. DOI.
Chowdhury, P., Jain, R., Ray, P.C., Burud, D., Chakrabarti, A.: 2021, Prediction of amplitude and timing of solar cycle 25. Solar Phys. 296, 69. DOI.
Clette, F., Cliver, E., Lefèvre, L., Svalgaard, L., Vaquero, J., Leibacher, J.: 2016, Preface to topical issue: recalibration of the sunspot number. Solar Phys. 291, 2479. DOI.
Clette, F., Lefèvre, L.: 2016, The new sunspot number: assembling all corrections. Solar Phys. 291, 2629. DOI.
Dikpati, M., de Toma, G., Gilman, P.A.: 2006, Predicting the strength of solar cycle 24 using a flux-transport dynamo-based tool. Geophys. Res. Lett. 33, L05102. DOI.
Du, Z.L.: 2006, Relationship between solar maximum amplitude and max-max cycle length. Astron. J. 132, 1485. DOI.
Du, Z.L.: 2020a, Predicting the shape of solar cycle 25 using a similar-cycle method. Solar Phys. 295, 134. DOI.
Du, Z.L.: 2020b, Predicting the amplitude of solar cycle 25 using the value 39 months before the solar minimum. Solar Phys. 295, 147. DOI.
Du, Z.L.: 2020c, The solar cycle: predicting the peak of solar cycle 25. Astrophys. Space Sci. 365, 104. DOI.
Du, Z.L.: 2022, The solar cycle: a modified Gaussian function for fitting the shape of the solar cycle and predicting cycle 25. Astrophys. Space Sci. 367, 20. DOI.
Du, Z.L., Du, S.Y.: 2006, The relationship between the amplitude and descending time of a solar acticity cycle. Solar Phys. 238, 431. DOI.
Du, Z.L., Wang, H.N.: 2010, Does a low solar cycle minimum hint at a weak upcoming cycle? Res. Astron. Astrophys. 10, 950. DOI.
Du, Z.L., Wang, H.N.: 2011, The prediction method of similar cycles. Res. Astron. Astrophys. 11, 1482. DOI.
Du, Z.L., Wang, H.N.: 2012, Predicting the solar maximum with the rising rate. Sci. China Ser. G, Phys. Mech. Astron. 55, 365. DOI.
Du, Z.L., Wang, H.N., He, X.T.: 2006, The relation between the amplitude and the period of solar cycles. Chin. J. Astron. Astrophys. 6, 489. DOI.
Gleissberg, W.: 1971, The probable behaviour of sunspot cycle 21. Solar Phys. 21, 240. DOI.
Gnevyshev, M.N., Ohl, A.I.: 1948, On the 22-year cycle of solar activity. Astron. Zh. 25, 18.
Han, Y.B., Yin, Z.Q.: 2019, A decline phase modeling for the prediction of solar cycle 25. Solar Phys. 294, 107. DOI.
Hathaway, D.H.: 2010, The solar cycle. Living Rev. Solar Phys. 7, 1. DOI.
Hathaway, D.H., Upton, L.A.: 2016, Predicting the amplitude and hemispheric asymmetry of solar cycle 25 with surface flux transport. J. Geophys. Res. 121, 10,744. DOI.
Hathaway, D.H., Wilson, R.M., Reichmann, E.J.: 1994, The shape of the sunspot cycle. Solar Phys. 151, 177. DOI.
Hathaway, D.H., Wilson, R.M., Reichmann, E.J.: 1999, A synthesis of solar cycle prediction techniques. J. Geophys. Res. 104, 22375. DOI.
Javaraiah, J.: 2016, North-South asymmetry in small and large sunspot group activity and violation of even-odd solar cycle rule. Astrophys. Space Sci. 361, 208. DOI.
Kakad, B., Kakad, A.: 2021, Forecasting peak smooth sunspot number of solar cycle 25: a method based on even-odd pair of solar cycle. Planet. Space Sci. 209, 105359. DOI.
Kane, R.P.: 2007, A preliminary estimate of the size of the coming solar cycle 24, based on Ohl’s precursor method. Solar Phys. 243, 205. DOI.
Kitiashvili, I.N.: 2021, Effects of observational data shortage on accuracy of global solar activity forecast. Mon. Not. Roy. Astron. Soc. 505, 6085. DOI.
Murphy, A.H., Epstein, E.S.: 1989, Skill scores and correlation coefficient in model verification. Mon. Weather Rev. 117, 572. DOI.
Nandy, D.: 2021, Progress in solar cycle predictions: sunspot cycles 24-25 in perspective. Solar Phys. 296, 54. DOI.
Nordemann, D.J.R., Trivedi, N.B.: 1992, Sunspot number time series – exponential fitting and periodicites. Solar Phys. 142, 411. DOI.
Ohl, A.I., Ohl, G.I.: 1979, A new method of very long-term prediction of solar activity. In: Donnelly, R.F. (ed.): NASA Marshall Space Flight Center Solar-Terr. Pred. Proc. 2 258. ADS.
Pesnell, W.D.: 2012, Solar cycle predictions (invited review). Solar Phys. 281, 507. DOI.
Pesnell, W.D., Schatten, K.H.: 2018, An early prediction of the amplitude of solar cycle 25. Solar Phys. 293, 112. DOI.
Petrovay, K.: 2020, Solar cycle prediction. Living Rev. Solar Phys. 17, 2. DOI.
Ramesh, K.B., Lakshmi, N.B.: 2012, The amplitude of sunspot minimum as a favorable precursor for the prediction of the amplitude of the next solar maximum and the limit of the Waldmeier effect. Solar Phys. 276, 395. DOI.
Sarp, V., Kilcik, A., Yurchyshyn, V., Rozelot, J.P., Ozguc, A.: 2018, Prediction of solar cycle 25: a non-linear approach. Mon. Not. Roy. Astron. Soc. 481, 2981. DOI.
Schatten, K.H.: 2005, Fair space weather for solar cycle 24. Geophys. Res. Lett. 32, L21106. DOI.
Schatten, K., Myers, D.J., Sofia, S.: 1996, Solar activity forecast for solar cycle 23. Geophys. Res. Lett. 23, 605. DOI.
Schatten, K.H., Scherrer, P.H., Svalgaard, L., Wilcox, J.M.: 1978, Using dynamo theory to predict the sunspot number during solar cycle 21. Geophys. Res. Lett. 5, 411. DOI.
Singh, P.R., Tiwari, C.M., Saxena, A.K., Agrawal, S.L.: 2019, Quasi-biennial periodicities and heliospheric modulation of geomagnetic activity during solar cycles 22. Phys. Scr. 94, 105005. DOI.
Singh, P.R., Saad, F.A.I., Singh, A.K., Pant, T.K., Aly, A.A.: 2021, Predicting the maximum sunspot number and the associated geomagnetic activity indices AA and Ap for solar cycle 25. Astrophys. Space Sci. 366, 48. DOI.
Solanki, S.K., Krivova, N.A., Schussler, M., Fligge, M.: 2002, Search for a relationship between solar cycle amplitude and length. Astron. Astrophys. 396, 1029. DOI.
Stewart, J.Q., Panofsky, H.A.A.: 1938, The mathematical characteristics of sunspot variations. Astrophys. J. 88, 385. DOI.
Svalgaard, L., Cliver, E.W., Kamide, Y.: 2005, Sunspot cycle 24: smallest cycle in 100 years? Geophys. Res. Lett. 32, L01104. DOI.
Takalo, J.: 2020, Comparison of latitude distribution and evolution of even and odd sunspot cycles. Solar Phys. 295, 49. DOI.
Thompson, R.J.: 1988, The rise of solar cycle number 22. Solar Phys. 117, 279. DOI.
Thompson, R.J.: 1993, A technique for predicting the amplitude of the solar cycle. Solar Phys. 148, 383. DOI.
Usoskin, I.G., Mursula, K.: 2003, Long-term solar cycle evolution: review of recent developments. Solar Phys. 218, 319. DOI.
Waldmeier, M.: 1939, Über die struktur der sonnenflecken. Astron. Mitt. Zürich 14, 439. ADS.
Wang, J.L., Gong, J.C., Liu, S.Q., Le, G.M., Han, Y.B., Sun, J.L.: 2002, Verification of a similar cycle prediction for the ascending and peak phases of solar cycle 23. Chin. J. Astron. Astrophys. 2, 396. DOI.
Wilson, R.M.: 1990, On the maximum rate of change in sunspot number growth and the size of the sunspot cycle. Solar Phys. 127, 199. DOI.
Yin, Z.Q., Han, Y.B.: 2018, An improved prediction of sunspot maximum by Vondrak smoothing method. Astron. Nachr. 339, 30. DOI.
Yoshida, A.: 2014, Difference between even- and odd-numbered cycles in the predictability of solar activity and prediction of the amplitude of cycle 25. Ann. Geophys. 32, 1035. DOI.
Yoshida, A., Yamagishi, H.: 2010, Predicting amplitude of solar cycle 24 based on a new precursor method. Ann. Geophys. 28, 417. DOI.
Acknowledgments
The author is grateful to the anonymous reviewer for valuable suggestions that improved this manuscript.
Funding
This work was supported by National Key R&D Program of China under grant 2021YFA1600504 and the National Science Foundation of China (NSFC) under grants 11873060 and 11973058.
Author information
Authors and Affiliations
Contributions
The data analysis and the manuscript were completed by DZL.
Corresponding author
Ethics declarations
Conflict of Interest
The author declares that he has no conflicts of interest.
Additional information
Publisher’s Note
Springer Nature remains neutral with regard to jurisdictional claims in published maps and institutional affiliations.
Appendices
Appendix A: Predicting \(S_{\mathrm{m}}\) of Cycle 24 Using the Sunspot Numbers of Version 1.0
As an example, we examine the predictive ability of the methods in this work and Du (2020b) on the maximum amplitude [\(S_{\mathrm{m}}\)] of Cycle 24 using the sunspot number series [\(S_{\mathrm{N}}\)] of Version V1.0. Du and Wang (2012) predicted \(S_{\mathrm{m}}\) for Cycle 24 [\(S_{\mathrm{p}}=S_{\mathrm{p}}(24)\)] by the rising rate [\(\beta _{\mathrm{a}}\), Equation 1]. The result is shown in Figure 6a (for \(\Delta m>0\)). In the original work, data were available only until February 2011 [\(\Delta m=27\)], and the result at \(\Delta m=27\) was \(r(\Delta m)=0.88\) and \(S_{\mathrm{p}}=84.0\) (marked with an asterisk in Figure 6a), slightly higher than the observed value [\(S_{\mathrm{m}}(24)=81.9\), the horizontal dash-dotted line]. Now, we extended the result to \(\Delta m=60\) months (four months before the peak timing of Cycle 24, April 2014). We see that with the increase of \(\Delta m\), the correlation coefficient [\(r( \Delta m)\), dotted] between \(S_{\mathrm{m}}\) and \(\beta _{\mathrm{a}}\) for Cycles 1 – 23 increases (if \(\Delta m\leqslant 50\)), and the predicted value [\(S_{\mathrm{p}}\), solid] decreases from 102.3 [with an error of \(\Delta S_{\mathrm{p}}=|S_{\mathrm{p}}-S_{\mathrm{m}}(24)|=20.4\), dashed] at \(\Delta m=1\) to 82.8 (\(\Delta S_{\mathrm{p}}= 0.9\)) at \(\Delta m=60\). There is a local peak, \(S_{\mathrm{p}}=96.0\) (\(\Delta S_{\mathrm{p}}=14.1\)) at \(\Delta m=32\), two (three) months earlier than the peak of Cycle 22 (3) and six months earlier than the secondary peak of Cycle 24 [66.9, February 2012]. If \(\Delta m>50\), \(r(\Delta m)\) may decrease. The mean absolute (relative) prediction error is \(\overline{\Delta S}_{\mathrm{p}}= 7.2\) (\(\overline{E}_{\mathrm{r}}=8.8\%\)) over \(\Delta m=[1, 60]\).

Predicting the maximum amplitude of Cycle 24 [\(S_{\mathrm{p}}(24)\), solid] by (a) the decreasing (\(\Delta m<0\)) and rising (\(\Delta m>0\)) rate, and (b) the sunspot number [\(S_{\mathrm{N}}\)] of Version V1.0 at the declining (\(\Delta m<0\)) and rising (\(\Delta m>0\)) phase as a function of \(\Delta m\) (months) from the solar minimum [\(\Delta m=0\)]. The horizontal dash-dotted line represents the observed \(S_{\mathrm{m}}(24)=81.9\). The dashed line indicates the prediction error, \(\Delta S_{\mathrm{p}}=|S_{\mathrm{p}}(24)-S_{\mathrm{m}}(24)|\). The dotted line represents the correlation coefficient [\(r(\Delta m)\)]. The left vertical dash-dotted line indicates \(\Delta m=-39\) months. The right vertical dash-dotted line in (a) indicates \(\Delta m=27\) months at which Du and Wang (2012) obtained the result: \(r(27)=0.88\) and \(S_{\mathrm{p}}=84.0\).
Du (2020b) analyzed the correlation between \(S_{\mathrm{m}}\) and the decrease rate [\(\beta _{\mathrm{d}}\)], calculated from the timing of solar minimum [\(t_{\mathrm{min}}\)] to \(\Delta m\) months earlier. They found that the correlation coefficient [\(r(\Delta m)\)] between \(S_{\mathrm{m}}\) and \(\beta _{\mathrm{d}}\) for Cycles 1 – 24 is the highest at \(\Delta m=-39\) months, using the sunspot numbers of Version 2.0. Now, we use the sunspot numbers of Version 1.0 to predict \(S_{\mathrm{m}}(24)\) by \(\beta _{\mathrm{d}}\), as shown in the left part of Figure 6a (for \(\Delta m<0\)). As \(\Delta m\) varies from −1 to −60, \(r(\Delta m)\) for Cycles 1 – 23 tends to increase (if \(\Delta m\geqslant -50\)) and the predicted value [\(S_{\mathrm{p}}\)] decreases from 109.3 (\(\Delta S_{\mathrm{p}}= 27.4\)) at \(\Delta m=-1\) to 58.0 (\(\Delta S_{\mathrm{p}}=23.9\)) at \(\Delta m=-60\). The correlation coefficient decreases if \(\Delta m<-50\) and may be negative if \(\Delta m<-58\). At \(\Delta m=-39\) months, \(r(-39)=0.78\), and \(S_{\mathrm{p}}=87.1\) (\(\Delta S_{\mathrm{p}}= 5.2\)). The mean prediction error is \(\overline{\Delta S}_{\mathrm{p}}= 10.3\) (\(\overline{E}_{\mathrm{r}}=12.6 \%\)) over \(\Delta m=[-1,-60]\).
Figure 6b shows the predicted \(S_{\mathrm{p}}(24)\) by the sunspot number [\(S_{\mathrm{N}}\)] at the preceding declining (\(\Delta m<0\)) and rising (\(\Delta m>0\)) phase \(\Delta m\) months from the solar minimum. As \(\Delta m\) increases from 1 to 60, the correlation coefficient [\(r( \Delta m)\)] between \(S_{\mathrm{m}}\) and \(S_{\mathrm{N}}(\Delta m)\) for Cycles 1 – 23 increases (if \(\Delta m\leqslant 50\)), and \(S_{\mathrm{p}}\) varies in the range [73.9, 93.0] with the largest prediction error [\(\Delta S_{\mathrm{p}}=11.1\)] at \(\Delta m=32\). As \(\Delta m\) varies from −1 to −60, \(r(\Delta m)\) tends to increase (if \(\Delta m\geqslant -50\)), and \(S_{\mathrm{p}}\) decreases from 87.0 (\(\Delta S_{\mathrm{p}}= 5.1\)) at \(\Delta m=-1\) to 58.3 (\(\Delta S_{\mathrm{p}}=23.6\)) at \(\Delta m=-60\). The correlation coefficient decreases if \(\Delta m<-50\) and may be negative if \(\Delta m<-58\). At \(\Delta m=-39\) months, \(r(-39)=0.79\) and \(S_{\mathrm{p}}=83.2\) (\(\Delta S_{\mathrm{p}}= 1.3\)). Over \(\Delta m=[1,60]\), the mean prediction error is \(\overline{\Delta S}_{\mathrm{p}}= 4.4\) (\(\overline{E}_{\mathrm{r}}=5.3\%\)), smaller than that, 7.2 (8.8%), using \(\beta _{\mathrm{a}}\) in Figure 6a. Over \(\Delta m=[-1,-60]\), the mean prediction error is \(\overline{\Delta S}_{\mathrm{p}}= 5.9\) (\(\overline{E}_{\mathrm{r}}=7.3\%\)), smaller than that, 10.3 (12.6%), using \(\beta _{\mathrm{d}}\) in Figure 6a.
In summary, the prediction error by the sunspot number [\(S_{\mathrm{N}}\)] is smaller than the one computed by the rate. The lowest correlation coefficient is around the solar minimum, \(r=0.16\) at \(\Delta m=-1\) for the rate and \(r=0.56\) at \(\Delta m=0\) for \(S_{\mathrm{N}}\). At the rising phase, \(r(\Delta m)\) increases with the increase of \(\Delta m\) and \(r(\Delta m)>0.75\) if \(\Delta m\geqslant 16\). At the declining phase, \(r(\Delta m)\) also tends to increase with the increase of \(|\Delta m|\) and \(r(\Delta m)>0.75\) if \(-52\leqslant \Delta m \leqslant -29\). The prediction error near the solar minimum tends to be larger than those computed at other \(\Delta m\) in the range [−50, 50].
Appendix B: Predicting \(S_{\mathrm{m}}\) of Cycle 24 Using the Sunspot Numbers of Version 2.0
Figure 7 shows the results obtained by using the sunspot numbers of Version 2.0 in a similar manner as was done in Figure 6.
-
i)
Using the decrease (\(\Delta m<0\)) and rising (\(\Delta m>0\)) rate (Figure 7a), the lowest correlation coefficient for Cycles 1 – 23 is \(r(\Delta m)=0.19\) at \(\Delta m=3\), also close to the solar minimum in time. With the increase of \(|\Delta m|\), \(r(\Delta m)\) tends to increase and the prediction error [\(\Delta S_{\mathrm{p}}=|S_{\mathrm{p}}-S_{\mathrm{m}}(24)|\)] tends to decrease. \(r(\Delta m)>0.75\) if \(\Delta m\leqslant -30\) or \(\Delta m\geqslant 20\). The maximum prediction error is \(\Delta S_{\mathrm{p}}=61.1\) (\(E_{\mathrm{r}}=52.5\%\)) at \(\Delta m=1\). The mean prediction error is \(\overline{\Delta S}_{\mathrm{p}}= 24.7\) (\(\overline{E}_{\mathrm{r}}=21.2 \%\)) for \(\Delta m>0\) and \(\overline{\Delta S}_{\mathrm{p}}= 23.4\) (\(\overline{E}_{\mathrm{r}}=20.1\%\)) for \(\Delta m<0\). At \(\Delta m=-39\), \(r(-39)=0.80\) and \(\Delta S_{\mathrm{p}}=18.8\) (16.2%). At \(\Delta m=20\) (similar to the time for predicting Cycle 25), \(r(20)=0.77\), \(S_{\mathrm{p}}=132.2\) (asterisk), and \(\Delta S_{\mathrm{p}}=15.8\) (13.6%).
Figure 7 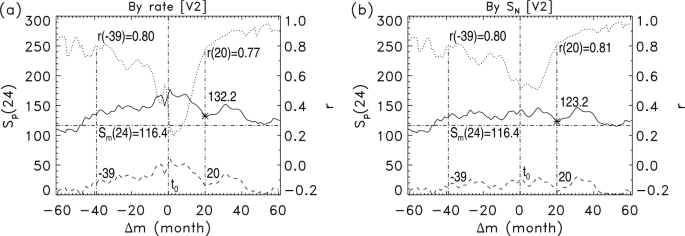
Similar to Figure 6 but using the sunspot numbers of Version 2.0. The horizontal dash-dotted line indicates the maximum amplitude [\(S_{\mathrm{m}}(24)=116.4\)] of Cycle 24.
-
ii)
Using the sunspot number at the declining (\(\Delta m<0\)) and rising (\(\Delta m>0\)) phase (Figure 7b), the lowest correlation coefficient for Cycles 1 – 23 is \(r(\Delta m)=0.51\) at \(\Delta m=9\). With the increase of \(|\Delta m|\), \(r(\Delta m)\) tends to increase and \(r(\Delta m)>0.75\) if \(\Delta m\leqslant -16\) or \(\Delta m\geqslant 18\). The mean prediction error is \(\overline{\Delta S}_{\mathrm{p}}= 14.4\) (\(\overline{E}_{\mathrm{r}}=12.3 \%\)) for \(\Delta m>0\) and \(\overline{\Delta S}_{\mathrm{p}}= 14.5\) (\(\overline{E}_{\mathrm{r}}=12.4\%\)) for \(\Delta m<0\). At \(\Delta m=-39\), \(r(-39)=0.80\) and \(\Delta S_{\mathrm{p}}=13.2\) (\(E_{\mathrm{r}}=11.3\%\)). For \(\Delta m>0\), the prediction error is minimum (maximum), \(\Delta S_{\mathrm{p}}=0.4\) (30.5), at \(\Delta m=51\) (31) and has a local minimum [6.4] at \(\Delta m=21\). At \(\Delta m=20\) (similar to the time for predicting Cycle 25), \(r(20)=0.81\), \(S_{\mathrm{p}}=123.2\) (asterisk), and \(\Delta S_{\mathrm{p}}=6.8\) (\(E_{\mathrm{r}}=5.8\%\)).

Using the sunspot number (Figure 7b), the correlation coefficient is slightly higher, and the prediction error tends to be smaller than that using either a decrease or rising rate (Figure 7a). Near the solar minimum, the correlation coefficient tends to be weaker, and the prediction error tends to be larger than those at other \(\Delta m\). The mean relative prediction error for Cycle 24 using the data of the new version is larger than that using the data from Version 2.0.
Rights and permissions
About this article

Cite this article
Du, Z. Predicting the Maximum Amplitude of Solar Cycle 25 Using the Early Value of the Rising Phase. Sol Phys 297, 61 (2022). https://doi.org/10.1007/s11207-022-01991-w
Received:
Accepted:
Published:
DOI: https://doi.org/10.1007/s11207-022-01991-w