
Abstract
Background
Commercial biogas upgrading facilities are expensive and consume energy. Biological biogas upgrading may serve as a low-cost approach because it can be easily integrated with existing facilities at biogas plants. The microbial communities found in anaerobic digesters typically contain hydrogenotrophic methanogens, which can use hydrogen (H2) as a reducing agent for conversion of carbon dioxide (CO2) into methane (CH4). Thus, biological biogas upgrading through the exogenous addition of H2 into biogas digesters for the conversion of CO2 into CH4 can increase CH4 yield and lower CO2 emission.
Results
The addition of 4 mol of H2 per mol of CO2 was optimal for batch biogas reactors and increased the CH4 content of the biogas from 67 to 94%. The CO2 content of the biogas was reduced from 33 to 3% and the average residual H2 content was 3%. At molar H2:CO2 ratios > 4:1, all CO2 was converted into CH4, but the pH increased above 8 due to depletion of CO2, which negatively influenced the process stability. Additionally, high residual H2 content in these reactors was unfavourable, causing volatile fatty acid accumulation and reduced CH4 yields. The reactor microbial communities shifted in composition over time, which corresponded to changes in the reactor variables. Numerous taxa responded to the H2 inputs, and in particular the hydrogenotrophic methanogen Methanobacterium increased in abundance with addition of H2. In addition, the apparent rapid response of hydrogenotrophic methanogens to intermittent H2 feeding indicates the suitability of biological methanation for variable H2 inputs, aligning well with fluctuations in renewable electricity production that may be used to produce H2.
Conclusions
Our research demonstrates that the H2:CO2 ratio has a significant effect on reactor performance during in situ biological methanation. Consequently, the H2:CO2 molar ratio should be kept at 4:1 to avoid process instability. A shift toward hydrogenotrophic methanogenesis was indicated by an increase in the abundance of the obligate hydrogenotrophic methanogen Methanobacterium.
Background
Anaerobic digestion of biomass typically produces biogas with 50 to 70% CH4 and 30 to 50% CO2 [1,2,3]. Biogas may be upgraded to contain more than 90% CH4, which has higher heating value and can be used as a vehicle fuel or injected into natural gas grids [2]. Recently, interest has developed in upgrading the biogas through biological reduction of CO2 into CH4 by addition of exogenous hydrogen (H2) [4,5,6,7,8,9]. The microbial communities found in anaerobic digesters contain hydrogenotrophic methanogens, which use H2 as a reducing agent for the conversion of CO2 into CH4. Addition of H2 to such digesters has been shown to increase overall CH4 yield and to result in CH4 content above 90% [2, 10, 11]. The CO2 losses to the environment with commercial upgrading technology (scrubbing, pressure swing adsorption and membrane separation) can be minimized through biological biogas upgrading (BBU) by converting the CO2 into CH4 [12]. BBU may serve as a low capital cost upgrading technology because it can be easily integrated with existing biogas plants [4]. Moreover, this technology can be applied under mild operating conditions [13], without the need for high pressure or temperature. However, the present expense of H2 production is a limitation that must be overcome for large-scale application to become feasible.
An approach to reduce the H2 production cost is to utilize excess electricity produced from renewable sources such as wind and solar power [5] and convert it into H2 by water electrolysis. Water electrolysis is the only environmentally friendly technology for large-scale production of H2 [10]. However, the low density of H2 necessitates infrastructure to support its high storage volume. While the direct utilization of H2 as transport fuel remains under development [5, 10], the infrastructure for large-scale storage and utilization of CH4 (or natural gas) is already in place [14]. Thus, BBU may become a key technology for the storage of excess renewable electricity in the form of CH4.
Biological biogas upgrading can be implemented either in situ, where H2 is directly injected into anaerobic digesters or ex situ, where upgrading occurs in a separate reactor containing enriched cultures of hydrogenotrophic methanogens [8, 15,16,17]. Both approaches have allowed increases in CH4 content up to 90% and higher [2, 11]. In situ BBU is an attractive, low-cost option since it does not require investment for a second reactor and can be easily integrated with the existing anaerobic reactor at biogas plants [4, 18]. However, volumetric CH4 production rates are usually higher for ex situ BBU [8, 19, 20]. Maintaining stable reactor performance during in situ biogas upgrading is challenging due to several factors such as depletion in the buffering capacity of CO2 and high H2 partial pressure, which may lead to an increase in pH and volatile fatty acid (VFA) accumulation [21, 22]. Rigorous bioprocess development is required to improve in situ BBU.
The rate-limiting step in BBU is the low solubility of H2 in the aqueous reactor environment, which hinders H2 uptake by hydrogenotrophic methanogens [8, 23]. One approach to improve H2 availability in aqueous media is to increase the residence time of injected H2 by using batch reactors [5, 19, 20, 23,24,25,26]. In this approach, H2 is injected directly into the headspace of the reactor, which creates a concentration gradient from the headspace into the liquid phase, thus increasing H2 availability and thereby facilitating increased uptake of H2 by hydrogenotrophic methanogens [5, 23]. Szuhaj et al. [23] demonstrated a favourable outcome on BBU using fed-batch fermentation system where they achieved an increase in CH4 content from 18 to 80% with 99% H2 utilization. Mulat et al. [5] reported an increase of CH4 content up to 89% due to H2 addition and a decrease in CO2 content from 60 to 11%. Both experiments were performed with a gas retention time of 24 h. Voelklein et al. [17] examined the influence of gas retention time on ex situ BBU using a 9.5-L reactor. It was observed that the gas conversion peaked at the highest gas retention time (24 h). Under these conditions, the CH4 concentration was upgraded to 96% with 2.9% and 1.6% of CO2 and H2 remaining in the gas mixture, respectively. Biogas upgrading of this sort may be implemented easily at existing biogas plant facilities because of its simplicity.
While BBU clearly has demonstrated potential to upgrade biogas, knowledge about effects on the microbial community is still limited [27]. Such knowledge is important because the changes in the microbial community are one of the bottlenecks for CH4 enrichment in in situ BBU [27, 28]. Hence, the aims of the present study were to evaluate the influence of in situ BBU at mesophilic conditions (37 °C) on gas yield, gas composition, pH, VFA, total ammonium nitrogen (TAN), and total chemical oxygen demand (TCOD). During the experiment, the H2 retention time was kept at 24 h and the H2:CO2 ratio was gradually increased until maximum H2 conversion was observed. The in situ BBU was examined for different phases; start-up, initial H2 addition and inhibition, experimental and stable phases. Moreover, the effects on the microbial community throughout the different phases were investigated. The influence of variable H2 inputs on CH4 production was also evaluated in order to simulate a scenario where fluctuating excess electricity produced from wind and solar are used to generate H2.
Results and discussion
Reactor performance
The performance of all reactors was analysed based on four phases: phase 1—start-up (day 1 to 9), phase 2—initial H2 addition and inhibition phase (day 10 to 33), phase 3—experimental phase (day 34 to 56) and phase 4—stable phase (day 57 to 81) (Fig. 1). We also define day 81 as the final timepoint in the context of the microbial community analyses, beyond which the composition began to diverge from the stable phase composition. At start-up, OLR for both reactors was changed twice due to overloading of glucose fed to the reactors, causing a drop in CH4 content up to 58% (day 1–9). Reduction of CH4 content due to glucose overload has been reported previously [29]. The calculated anaerobic biodegradability during this period was less than 40% in all reactors (data not shown). Later, at an OLR rate of 0.05 gCOD L−1 day−1, anaerobic biodegradability was improved to nearly 100%. Moreover, at this OLR, the CH4 content in the control reactors was increased to 67%.

The average (a) CH4 production rate and (b) gas compositions of control and H2-supplemented reactors. 1—start-up phase, 2—initial H2 and inhibition phase, 3—experimental phase and 4—stable phase. C: control reactor; H2: H2-supplemented reactor; H2_Glu: CH4 production rate from glucose digestion; H2_Conv: CH4 production rate from H2 conversion; Res H2: residual H2
Start-up phase
In this phase, both sets of reactors were running at similar operating conditions without addition of H2 until at day 9, when H2 was supplied to three of the reactors. The CH4 production rate, gas compositions, pH and VFA concentrations of both reactors were comparable during this phase (Figs. 1 and 2). The average CH4 production rates from control and H2-supplemented reactors were 3.61 ± 0.27 and 3.73 ± 0.32 mL L−1 h−1 (Fig. 1a), respectively. Methane content ranged from 58 to 63% while CO2 content ranged from 37 to 42% (Fig. 1b). The initial pH for both reactors was adjusted to 7.80, and after 4 days of anaerobic digestion, the pH dropped to 7.50 (days 5 to 8) and further reduced to 7.30 at day 9 (Fig. 2a). The drop in pH may have been due to glucose overloading at the OLR of 0.23 gCOD L−1 day−1, which corresponded to a drop in CH4 content from 63 to 58% (Fig. 2b).

a pH and b total volatile fatty acid concentrations of the control and H2-supplemented reactors. C: control reactor; H2: H2-supplemented reactor
Initial H2 addition and inhibition phase
H2 uptake by methanogens was rapid as 93% of H2 was consumed within 24 h upon the first H2 injection (data not shown). The fast H2 consumption is in accordance with observations by Agneessens et al. [4] and Kern et al. [30] who noted that this occurred without any prior pre-enrichment of hydrogenotrophic methanogens. During the second phase, the CH4 production rate of the H2-supplemented reactors ranged from 2.87 to 4.10 mL L−1 h−1 (Fig. 1a). In this period, the H2:CO2 ratio was gradually increased up to an 11:1 ratio in an attempt to achieve full conversion of CO2 into CH4 (Fig. 1b). However, depletion of CO2 adversely affected reactor performance as the pH in H2-supplemented reactors increased to more than 8.5 with a maximum recorded pH of 9.4 (Fig. 2a). The optimal pH for mesophilic biogas reactors is reported in the range of 6.7 to 7.4, while methanogens have optimum growth between pH 7.0 to 8.0 [31]. An excessively alkaline pH may limit the methanogenic activity, which may lead to process inhibition and decreased CH4 production [31]. This fact was corroborated by the reduction in CH4 production rate observed from day 26 to 31 (Fig. 1a). The CH4 production rate from glucose (H2_Glu) dropped in this period sharply from 1.9 to 0 mL L−1 h−1 indicating severe inhibition of the anaerobic digestion process. Similar observations have been reported previously [32, 33] where reactors supplied with H2:CO2 ratios above 4:1 led to an increase in pH as CO2 was depleted. Furthermore, Agneessens et al. [4] observed a strong increase in pH when H2 was supplied at a H2:CO2 ratio of 10:1.
Besides CO2 depletion, high H2 partial pressure (11 to 25% residual H2) in the reactors due to H2 overloading may also explain the reduction in CH4 yield [34]. The H2 partial pressure during this period reached a maximum of 25 mbar. Hydrogen partial pressures exceeding 10−3 mbar may disturb propionate conversion to acetate, leading to accumulation of intermediate products and in extreme cases to complete process failure [17, 21, 35]. Additionally, Ahring et al. [36] reported that high H2 partial pressure (> 2.5 × 10⁻³ mbar) inhibits Methanosarcina and restricts acetate consumption. In our study, total VFA concentrations in the H2-supplemented reactors were increased from 0.04 to 0.15 g L−1 (Fig. 2b). The acetic and propionic acid increased from 0.004 to 0.096 g L−1, and from 0.028 to 0.048 g L−1, respectively. Similar findings were reported by Mulat et al. [5], where VFA levels were higher when H2 was added in excess into batch reactors, demonstrating the negative influence of excess H2 supply on the degradation of VFAs.
Experimental phase
As the pH of the H2-supplemented reactors rose, the reactors were fed with an acidified glucose solution from day 33 until 43, causing a pH reduction from 9.4 to 6.6. As a result, the VFA concentration decreased by 40% while the CH4 production rate increased beginning on day 34. The CH4 concentration also rose from 85 to 93%. The H2:CO2 ratio was adjusted to 4:1 after 45 days and kept constant until the end of the digestion period. Our results agree with previous research by Wang et al. [33]. These authors observed that BBU was severely inhibited when the gas injection rate was increased from 1300 (H2:CO2 ratio ~ 4:1) to 2882 mL day−1 (H2:CO2 ratio ~ 8:1). Similarly, rapid recovery of BBU was observed after addition of HCl into the reactor, indicating the robustness of BBU and the importance of pH control for achieving high CH4 content and efficient H2 conversion.
Stable phase
The stable phase of the H2-supplemented reactors began at day 57 and lasted until the end of the experiment. The average CH4 production rate and CH4 content from the reactor supplied with H2 were significantly higher than for the control reactor (Fig. 1a and b). It was noted that the amount of CH4 from glucose degradation was comparable (Fig. 1a). The average CH4 production rate in the H2-supplemented reactor was 1.68 ± 0.11 mL L−1 h−1 (0.59 ± 0.09 mL L−1 h−1 calculated from H2 conversion) while it was 1.03 ± 0.02 mL L−1 h−1 in the control reactor (Table 1). Approximately 54% of the additional CH4 was calculated to result from H2 and CO2 conversion. The CH4 concentration in the H2-supplemented reactors increased from 66.7 to 94.5%, approximately 42% higher than the control. At the same time, CO2 levels decreased from 33.3 to 3.1% due to H2 addition, and the average residual H2 concentration was around 2.5%. Nearly 98% of H2 added into the reactors was utilized for conversion of CO2 into CH4. During this phase, the pH of both reactors decreased below 8, and the VFA level was gradually reduced towards the end of the experiment. The average pH and VFA concentration of the control reactors were 7.07 ± 0.11 and 35.4 ± 20.40 mg L−1, respectively, while the corresponding values for the H2-supplemented reactors were 7.64 ± 0.15 and 37.5 ± 10.40 mg L−1.
Based on the data obtained during stable phase, the mass balance of CH4 production from glucose with and without H2 addition was calculated following the procedure of Mulat et al. [5]. The mass balance calculation considered (1) the measured CH4 yield from the experiment, (2) the CH4 yield expected from the stoichiometric H2 consumption and (3) the potential CH4 yield from unconsumed VFAs in the reactors. The average CH4 yields per day were 9.55 mL in the control reactor and 15.67 mL in the H2-supplemented reactor (Table 2). It was estimated that addition of 21.75 mL of H2 into the reactor yielded 5.44 mL of CH4 based on the 4:1 H2:CO2 molar ratio. Potential extra CH4 yields estimated from unconverted VFAs in the control and the H2-supplemented reactors were 1.42 and 1.78 mL, respectively. Theoretical total CH4 yield for the H2-supplemented reactor, calculated from CH4 produced from the control reactor + CH4 estimated from unconsumed VFA + CH4 estimated due to H2 addition, was 16.41 mL, while the observed CH4 yield was 17.45 mL. Our calculation showed 100% recovery of the added H2 and glucose substrate in the form of CH4 produced and residual VFA.
Pulsed H2 feeding
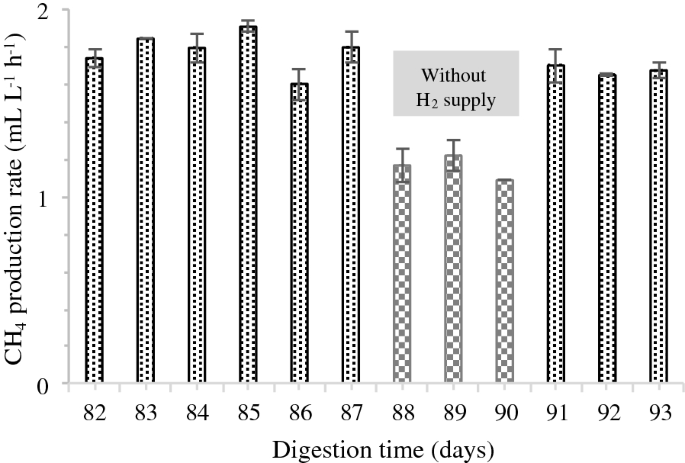
To investigate the flexibility of the BBU system towards variable H2 input (fluctuating supply of H2), a test was conducted for 12 consecutive days (days 82 to 93) during stable phase using the three H2-supplemented reactors. During this test, the reactors were fed with glucose solution once daily at an OLR of 0.05 gCOD L−1 day−1, and H2 was injected into the reactor with the H2:CO2 ratio of 4:1. From day 82 to 87, addition of H2 into the reactors was performed every 24 h, and starting at day 88, H2 addition was ceased for 3 consecutive days. H2 supply was resumed from day 91 until day 93, with conditions similar to those prior to the cessation of H2 supply.
The average CH4 production rate from the reactors fluctuated with the H2 supply (Fig. 3). When H2 supply ceased, the CH4 production rate dropped from 1.80 ± 0.10 to 1.20 ± 0.10 mL L−1 h−1 and then increased again to 1.70 ± 0.04 mL L−1 h−1 once H2 addition resumed on day 91. The average CH4 production rate under H2 supply in this fluctuation experiment was comparable with that observed during the normal supply of H2 at stable phase (Fig. 1a). In addition, the average CH4 production rate when H2 was not supplied was similar to the production rate of the control reactor. These observations demonstrate that the BBU system responds favourably to fluctuating H2 supply by not compromising CH4 yield and content. Moreover, the results indicate rapid response of hydrogenotrophic methanogens to conversion of CO2 and H2 into CH4. Agneessens et al. [4] reported a similar observation where initial H2 uptake rates increased during consecutive pulse injections of H2 into an anaerobic reactor.
Methane production rate during continuous and intermittent H2 addition
Even though favourable outcomes were demonstrated in our study, one should keep in mind that the implementation of BBU at larger scales is not economical in the short term due to high investment costs [12]. Currently, BBU seems to be more expensive than the cost of CO2 removal per kWh of biomethane produced [37]. The total cost of BBU is greatly influenced by the H2 production costs, which are estimated to be around 0.09 €/kWh [37]. However, in the long term, it is expected that there will be increased incentives for upgrading biogas through the conversion of H2 and CO2. The decline in renewable electricity production costs (solar and wind) is predicted to continue, which will contribute to decreased H2 costs [37]. The high efficiency of biomethanation, the low feedstock prices and the potential for CH4 prices to increase are the other factors that may lead to BBU becoming a more economical process [12].
Microbial community
We applied the multivariate statistical procedure principal component analysis (PCA) to compare reactor timepoints according to their unique set of process parameter values (Fig. 4a), and we additionally analysed the microbial community composition for each reactor timepoint by performing non-metric multidimensional scaling (NMDS) ordination on the Bray–Curtis distances (Fig. 4b), a metric which considers both the species present in a sample as well as their abundance. The PCA analysis allows assessment of the similarity in reactor environment for the different reactor timepoints (Fig. 4a), whereas the NMDS analysis evaluates similarity in the microbial community composition across reactor timepoints (Fig. 4b), and comparing the process parameter PCA plot with the microbial community, NMDS plot allows for inference of the process parameters that correspond to changes in microbial community composition. The characteristics of each reactor environment changed over the time course of the experiment (Fig. 4a), as did the microbial community composition (Fig. 4b) in the reactors. The reactor timepoints were grouped into (1) start-up phase (days 4 and 9), (2) inhibition phase (day 30), (3) experimental phase (days 37, 44, 45 and 52), (4) stable phase (days 59, 66 and 70) and (5) end phase (day 81). The timepoints cluster together by phase and form a continuum from start-up phase to end phase, which indicates that the reactor conditions and the microbial community gradually changed over time. The two main principle components (PC) explain 84% of the variation in the process parameter data, and the NMDS ordination has a stress of 0.16 which indicates that the plot provides an acceptable two-dimensional representation of the Bray–Curtis distances (Fig. 4b). The CO2 and CH4 concentrations in the reactor biogas clearly separate the reactors with H2 addition from the control reactors (Fig. 4a), but it is not as apparent in the microbial data (Fig. 4b). Also, the TAN, COD, and biogas production rate distinguish the start-up phase from the other phases. An increase in pH in the H2-supplemented reactors corresponds to the divergence of its microbial community (Fig. 4b). Hence, stabilization of pH (Fig. 2a) and VFA concentrations (Fig. 2b) after about day 40 resulted in another shift in the microbial community.

a PCA analysis of select process parameters whose identities are indicated by the red text and b NMDS ordination of microbial community composition in each sample based on Bray–Curtis distances calculated from ASV abundances. The variation explained by the first two principal components is indicated in the axis labels (a) and the stress for the NMDS ordination is indicated by the text in (b). Samples are coloured by phase of reactor operation while samples from the control reactor are distinguished from those from the hydrogen-supplemented reactor by symbol shape as indicated in the legend at the bottom of the figure. Samples with less than 1000 sequences were omitted from the NMDS ordination (b)
Both the distribution of bacterial phyla (Fig. 5) and ASVs (Amplicon Sequence Variants; Additional file 1: Figure S1) changed during the experiment. Initially, Bacteroidetes dominated both reactors, followed by Firmicutes and Cloacimonetes. The abundance of Bacteroidetes and Firmicutes accounted for almost 90% of the bacterial sequence reads. Bacteroidetes and Firmicutes are typically the most abundant bacterial phyla in biogas reactors [28, 38]. During digester operation, the abundance of other phyla including Chloroflexi, Spirochaetes, Proteobacteria, Euryarchaeota, Actinobacteria and Synergistetes increased in both reactors. The WPS-2 phylum was also observed in the H2-supplemented reactors. In accordance with previous studies, Firmicutes dominate H2-supplemented reactors and account for approximately 40% of the microbial community [2, 39, 40]. Firmicutes are involved in various metabolic processes for the degradation of carbohydrates and fatty acids, including the Wood–Ljungdahl pathway (homoacetogenesis) and syntrophic acetate oxidation [39, 41], which may explain the dominance of this phylum in the H2-supplemented reactors. Compared to the H2-supplemented reactors, the control reactors had lower abundance of Firmicutes and Bacteroidetes, and a higher abundance of Proteobacteria and Chloroflexi was observed in them at day 81. Both Proteobacteria and Chloroflexi are known as important taxa that consume glucose in digesters [42, 43].

Stacked barplot of the relative abundance of phyla detected in each sample. Phyla are indicated by the colours displayed in the legend at the bottom of the figure. Reactor type and replicate are indicated in the horizontal axis labels in each facet (e.g. C1 is control reactor replicate 1, and H indicates the hydrogen-supplemented reactors). The text at the top of each facet indicates the sampling timepoint in days since reactor start-up. Samples with less than 1000 sequences were omitted from the figure
During day 23 to 34 the pH was high in the H2-supplemented reactors relative to the controls (Fig. 2b), and from day 32 to 43 acid was added to the H2-supplemented reactors to equilibrate the pH to that of the controls. Some bacteria in the H2-supplemented reactors, such as the unidentified species of Rikenellaceae DMER64, corresponding to ASV2 (Additional file 1: ASV Catalogue S1), clearly responded during this period of pH disturbance, but quickly returned to the abundances found in the control reactor after the pH again returned to below 8. Rikenellaceae is a fermentative anaerobic microorganism which is involved in VFA (acetate, succinate, propionate), NH3, CO2 and H2 production [28]. It has previously been detected in mesophilic biogas reactors [39, 44] and has been shown to be negatively affected by H2 addition [44]. Our results confirmed the adverse effect of H2 on Rikenellaceae, as a sharp decline in its relative abundance was observed at high H2:CO2 ratios. Interestingly, when the H2:CO2 ratio was adjusted to 4:1, Rikenellaceae responded positively and its abundance continuously increased until day 81. A pH below 8 is favourable for Rikenellaceae, and the lower partial pressure of H2 at the 4:1 H2:CO2 ratio is also beneficial for the H2 producing pathways of Rikenellaceae.
In contrast to this transient divergence, the abundance of some microorganisms remained divergent after the spike in pH had subsided, supporting an effect of H2 addition on those particular taxa. For instance, the hydrogenotrophic methanogen Methanobacterium sp. (ASV76, Fig. 6a) followed this pattern. Methanobacterium sp. is a dominant methanogen for biogas production via syntrophic acetate oxidation and hydrogenotrophic methanogenesis [28] and has been observed in sugar-processing wastewater plants [45]. Methanobacterium sp. was detected in the H2-supplemented reactors by day 30, increased in abundance thereafter and continued to be detected in the H2-supplemented reactors, but was not present in the control reactors throughout the course of the experiment (Fig. 6a). The enrichment of Methanobacterium sp. in the H2 fed reactors has also been observed by Mulat et al. [5] and Rachbauer et al. [28], demonstrating a general shift towards hydrogenotrophic methanogens. The shift from acetoclastic to hydrogenotrophic methanogenesis was expected, agrees well with previous observations and shows that enrichment of hydrogenotrophic methanogens is possible under these conditions.

Percent abundance of 5 methanogen ASVs in the control and hydrogen-supplemented reactors. The hydrogenotrophic Methanobacterium (a), acetoclastic Methanosaeta (b) and 3 ASVs of Methanosarcina (c–e), which may carry out both forms of methanogenesis, were detected among the top 100 most abundant ASVs. Datapoints in each figure indicate the abundance of the ASV in a reactor replicate sample at the time in days since reactor start-up. The solid line indicates the mean of control reactor abundances and the dashed line indicates that for the hydrogen-supplemented reactors, while symbol shape and fill indicate whether the datapoint corresponds to a reactor without H2 addition (control) or with (H2 supplemented), as indicated in the legend in the plot (a). Samples with less than 1000 sequences were omitted from the figure
Methanosaeta sp. (ASV10, Fig. 6b) is an acetoclastic methanogen whose abundance was consistent in both the control and H2-supplemented reactors. Its abundance appeared to increase over the duration of the experiment in both reactor types. Methanosaeta sp. are obligate acetoclastic methanogens and are mainly observed in mesophilic anaerobic reactors [46]. Methanosaeta sp. has a relatively slow growth rate but possesses a high affinity for VFAs, and it may thus dominate anaerobic reactors with low acetate concentrations [47]. This is in agreement with the present study, as Methanosaeta sp. was enriched when the VFA concentrations were reduced over time. This finding suggests that Methanosaeta sp. might be the main producer of CH4 from acetoclastic methanogenesis in the latter period of the AD, although definitive support of this supposition would require transcriptomic, proteomic, or stable isotope probing data.
Methanosarcina sp. was the only other detected methanogen capable of hydrogenotrophic methanogenesis present in the reactors, although it can also carry out acetoclastic methanogenesis [48]. Differences between the control and H2-supplemented reactors for ASV61 and ASV14 affiliated to this genus were transient and occurred around days 45 and 50 (Fig. 6c, d). Methanosarcina sp. was the dominant methanogen in both reactors at the start of the experiments. However, it is likely that the abundance of Methanosarcina sp. was negatively affected by the gradual reduction of the VFA and TAN concentrations. In the end phase, the abundance of Methanosarcina sp. (ASV14 and ASV61) was below 2% in both reactors. As mentioned previously, acetate utilization seemed to shift from Methanosarcina sp. (ASV14 and ASV61) in the early phase to Methanosaeta sp. at the later stage of the experiment. This finding agrees with previous studies [42, 49, 50], thereby demonstrating high abundance of Methanosarcina sp. at elevated VFA concentrations, while Methanosaeta sp. dominated under low VFA concentrations.
It is likely that Methanosarcina sp. (ASV14 and ASV61) was inhibited by the high H2 partial pressure and high pH in the H2 fed reactors. This observation was corroborated by the reduced CH4 production in this period along with the VFA accumulation. Previously, it has been reported that Methanosarcina sp. was negatively affected by high H2 partial pressure [36], and the optimum pH for Methanosarcina sp. lies between 5 and 8 [51]. It is known [4] that an increase in pH favours the conversion of H2 to acetate by homoacetogens and reduces the activity of acetoclastic methanogens. Our study confirmed this as the abundance of Methanosarcina sp. decreased after day 30. The abundance of ASV91, also affiliated to this genus, did not significantly diverge between the control and H2-supplemented reactors (Fig. 6e).
ASV42, ASV64 and ASV67 (Additional file 2: ASV Catalogue) emerged after day 30 in the H2-supplemented reactors and correspond to species of Sporomusa, and a strain of this species has been characterized as a homoacetogen [52]. Homoacetogens are H2 consumers and are able to grow at the expense of H2 and CO2 as sole energy source [53]. They do not compete well with methanogens because of their less favourable thermodynamic characteristics. The affinity of methanogens for H2 was shown to be 10–100 times higher than that for homoacetogens [53]. However, if methanogens were inhibited, then the accumulation of H2 might be favourable for homoacetogenesis. Chen et al. [54] observed significant acetate accumulation and low CH4 yield when H2 and CO2 were supplied as substrate to a municipal solid waste landfill, indicating that homoacetogens outcompeted hydrogenotrophic methanogens in the landfill samples. The finding was comparable with our study as Sporomusa was only detected starting at day 30 (inhibition phase). Acetate accumulation and low CH4 production were observed during this period. It has been reported previously that the addition of H2 into anaerobic reactors results in an increase in homoacetogen abundance [44]. Acetate formed by this process may support acetotrophic methanogenesis, although this is not supported by our observations given that the acetoclastic methanogens did not increase in abundance in the H2-supplemented reactors relative to the control reactors (Fig. 6b–e). The acetate produced by Sporomusa, however, may enter into catabolic pathways and support growth and the corresponding increase in abundance observed in the Sporomusa ASVs in the present study.
ASV23, ASV32 and ASV52 (Additional file 2: ASV Catalogue) correspond to a species designated W5 within the Cloacimonadaceae family. Their abundance increased in the control reactors above that of the H2-supplemented reactors, a difference that persists well through the stable phase until day 70 (Additional file 2: ASV Catalogue) and reached 1 to 3% maximum abundance. The related ASV5 Candidatus Cloacimonas reached up to 15% abundance but only exhibited divergence between the H2 and control reactors during the period of pH increase whereby it decreased in the H2-supplemented reactors from day 30 to 45. Cloacimonadaceae W5 and Candidatus Cloacimonas are known to be anaerobic mesophilic acetogens [55]. High abundance of Cloacimonadaceae W5 and Candidatus Cloacimonas in biogas reactors has been observed previously [55, 56].
There are several ASVs with noteworthy abundance changes (Additional file 2: ASV Catalogue). ASV25, whose abundance increased in the control reactors from day 30 onward, corresponds to Smithella, species of which are known propionate oxidizing bacteria [57]. Smithella remained at low abundance in the H2-supplemented reactors during the 70 days of reactor operation. Smithella was the dominant species in a mesophilic reactor and its abundance was reduced to 40% due to H2 addition [33]. It was reported that propionate oxidizing bacteria are highly sensitive and can be easily inhibited by increases of H2 in the system [58].
ASV31 is an uncharacterized order of Clostridia named DTU014 and exhibited a persistent increase due to H2 addition. Clostridia DTU014 has been observed in biogas reactors and plays an important role in oligosaccharide and monosaccharide utilization [39]. ASV 44 (Desulfovibrio) and ASV66 (Desulfomicrobium) emerged and persisted in the control reactor. Both ASVs are sulphate-reducing bacteria that utilize H2 or organic matter as an electron donor and sulphate as an electron acceptor. It has been reported that under standard conditions, sulphate-reducing bacteria outcompete methanogens and homoacetogens as H2 consumers [59]. However, H2 was previously observed to be mainly consumed by a sulphate reducer under H2 limiting conditions in the presence of sufficient sulphate [60]. Our results support this prior observation as Desulfomicrobium and Desulfovibrio abundances were suppressed at high H2 partial pressure, indicating that H2 was mainly utilized by methanogens or homoacetogens during BBU. ASV94 is an uncharacterized organism in the Selenomonadales order of the Firmicutes, and it emerged first in the H2-supplemented reactors after day 50 and reached a maximum of 2% abundance.
Conclusions
This study demonstrated the feasibility of biogas upgrading through biological means in a batch reactor and showed that addition of H2 into a batch reactor increased CH4 content from 67 to 94%. H2:CO2 ratios above 4:1 in the system fully utilized CO2, yet led to process imbalance due to bicarbonate consumption and high H2 partial pressure. This clearly indicated that the H2:CO2 ratio is an important parameter which should be kept at 4:1 to ensure stable upgrading with pH < 8 and low VFA concentrations. The resilience of biological biogas upgrading to fluctuating H2 inputs was demonstrated by immediate CO2 conversion into CH4 after pulsed H2 addition. In addition, the observed increase in abundance of Methanobacterium, a hydrogenotrophic methanogen, demonstrated that H2 addition selects for hydrogenotrophic methanogenesis.
Methods
Substrate and inoculum
A d-glucose (99.5%, Sigma-Aldrich) solution at 1% w/v concentration was used as a model substrate. Mesophilic inoculum was collected from a lab-scale 10 L digester at the biogas laboratory of the Norwegian University of Life Sciences (NMBU) in Ås, Norway. The mesophilic digester, running at 37 °C, was primarily digesting cattle manure collected from a cattle farm in Ås, Norway. The inoculum was filtered through a 1-mm sieve and degassed for 10 days at 35 °C to minimize the background biogas production. Substrate and inoculum characteristics are shown in Table 3.
In-situ batch fermentation
The batch experiments were carried out at 37 °C in 0.5 L glass bottles (diameter: 76 mm, height: 188 mm, Nordic pack, Sweden) operating at 21 days hydraulic retention time (HRT) for 81 days. Both control reactions (bottles without H2 addition) and reactions supplied with H2 were carried out in triplicate. Initially, the bottles (reactors) were loaded with 200 mL of manure-based inoculum. Water was added to the bottles to reach 388.5 mL working volume. After filling, the bottles were sealed with a butyl rubber stopper and aluminium crimp, and the headspace was flushed with pure N2 for 3 min. The experiment was conducted in an incubator shaker (Multitron Standard, Infors HT, Switzerland) with 100 rpm mixing speed. Every 24 h, 18.5 mL of 1% glucose solution was fed into the reactors after the same amount of effluent was discharged. For the first 8 days, all reactors were operated under the same conditions, but from day 9 onward, H2 was supplied to the three experimental reactors but not to the three control reactors. Before each H2 injection, the headspace pressure of the reactor was vented to atmospheric pressure. The ratio of H2 injected to daily produced CO2 ranged from 4:1 to 11:1 in the early phase (day 9 to 44) to achieve full CO2 conversion and later adjusted to 4:1 ratio (day 45 onwards). During the initial phase of reactor operation, the organic loading rate (OLR) was changed twice from 0.23 to 0.18 gCOD L−1 day−1 and from 0.18 to 0.05 gCOD L−1 day−1 by reducing the concentration of glucose. Nutrients were supplied to the reactors by replacing the liquid mixture with 10 mL diluted manure at days 31, 49, 55 and 65.
Analytical methods and calculations
Prior to the H2 injections, which occurred every 24 h, gas volume and gas composition (CH4, CO2 and H2) were measured. The gas overpressure in the reactor was measured with a digital pressure meter (GMH 3161, Greisinger, Germany). Methane and CO2 contents were analysed using a gas chromatograph (GC) (3000 Micro GC, Agilent Technologies, USA) equipped with a thermal conductivity detector (TCD). The Micro GC utilizes two capillary columns for gas separation. The two types of columns are (1) Molecular Sieve 5A (MolSieve) and (2) PLOT Q. The temperature for the sample inlet was maintained at 60 °C for both columns. The injector and column temperatures for MolSieve were 90 and 70 °C while those for the PLOT Q were 50 and 45 °C, respectively. Helium was used as the carrier gas for the GC. GC calibration was performed before biogas measurement using standard mixture of CH4 and CO2 (AGA, Norway).
Methane production was expressed at standard conditions, (temperature = 0 °C, pressure = 1 atm) according to the recommendations made by Angelidaki and Sanders [61]. The volume of biogas was calculated using the ideal gas law as described previously [62]. The H2 content was determined by GC (HP 5890A, California, USA) equipped with a TCD and a capillary column CarboPLOT P7 from Varian. The injector and detector temperature was set at 150 °C while the oven temperature was set at 30 °C. Nitrogen was used as the carrier gas for the GC.
The H2 conversion efficiency (ɳH2) was calculated according to Eq. 1 [16]:
where VH2 injected is the volume of H2 (mL L−1 h−1) injected into the anaerobic reactor, and VH2 residual is the volume of H2 (mL L−1 h−1) left in the reactor after 24 h of H2 injection.
The pH of the liquid effluent was measured immediately after sampling to avoid CO2 loss from the liquid phase using a digital pH meter (Thermo Scientific Orion Dual Star, USA). Liquid effluent from the reactors was collected for TCOD, TAN and VFA analysis once per week. Total chemical oxygen demand was determined using a Merck Spectroquant® COD cell test with 500–10,000 mg L−1 range and TAN was measured using the Merck Spectroquant® photometric kit with 4.0–80.0 mg L−1 NH4-N range. The VFA analysis was performed using a previously described protocol [63] with some minor modifications as indicated below. Samples for VFA analysis were centrifuged at 14,000 rpm for 5 min. Approximately 10 µL of sulphuric acid (95% concentration) was added to the supernatant and then mixed before analysis by high-pressure liquid chromatography (HPLC) using a Dionex Ultimate 3000 system (Dionex, Sunnyvale, CA, USA) equipped with a UV detector and fitted with an Aminex® HPX-87H column (300 × 7.8 mm and 9 µm particle size). The column was operated at 0.6 mL min−1 at 50 °C, and 1 µL of sample was injected. A gradient flow was applied using 4 mM H2SO4 as eluents. Based on the analysis, the concentration of individual VFAs such as acetic acid, propionic acid, butyric acid and valeric acid was determined by reference to dilution series of standards of known concentration.
Microbial community analysis
DNA sampling and extraction
The liquid effluent (15 mL) from each reactor was collected weekly and stored at − 20 °C prior to DNA extraction. To obtain DNA for 16S amplicon sequencing, 1 mL of the liquid effluent was centrifuged and the pellet was used for DNA extraction. The template DNA was extracted using the PowerMag Soil DNA Isolation Kit (MO BIO Laboratories Inc., Carlsbad, CA, USA) on a KingFisher Flex DNA extraction robot (Thermo Fisher Scientific, Waltham, MA, USA). The DNA extraction was performed following the manufacturer protocol except that samples were subjected to bead beating at maximum intensity on a FastPrep-96 Homogenizer (MP Biomedicals LLC., Santa Ana, CA, USA) for 4 pulses of 30 s each and a 5-min interval between pulses. DNA template concentration was determined using a Qubit Fluorometer (Invitrogen/Thermo Fisher Scientific, Waltham, MA, USA), and these reactor digest DNA extracts were stored at − 20 °C until further use.
16S amplicon sequencing
The PCR amplification of the 16S rRNA gene for sequencing was performed using the primers Pro341F (5′- TCGTCGGCAGCGTCAGATGTGTATAAGAGACAGCCTACGGGNBGCASCAG -3′) and Pro805R (5′- GTCTCGTGGGCTCGGAGATGTGTATAAGAGACAGGACTACNVGGGTATCTAATCC -3′) that include the Illumina overhang adapter sequences on the 5′ end, which are specified in the Illumina protocol for 16S Metagenomic Sequencing Library Preparation (Part # 15044223 Rev. A), in addition to the underlined target-specific sequences from Takahashi et al. [64], which are designed to target both Bacteria and Archaea. The 25-µL PCR reactions contained 0.25 µM primers, 1× iProof High-Fidelity Master Mix (Biorad, Hercules, CA, USA), and 0.5 ng of reactor digestate DNA. The PCR thermal cycling consisted of a hot start step at 98 °C for 180 s followed by 25 cycles of 98 °C for 30 s, 55 °C for 30 s, 72 °C for 30 s and then a final 72 °C extension step for 300 s. The amplification quality was then confirmed by 1% agarose gel electrophoresis. A PCR clean-up was performed with Agencourt AMPure XP beads (Beckman Coulter Inc., Brea, CA, USA) according to the Illumina protocol for 16S Metagenomic Sequencing Library Preparation (Part # 15044223 Rev. A). A second PCR was carried out using Nextera XT Index Kit (Illumina Inc., San Diego, CA, USA), followed by PCR clean-up with Agencourt AMPure XP beads. The pool of purified index PCR products was quantified using a Qubit™ Fluorometer (Invitrogen, USA), and the final pool concentration was adjusted. The pool was then spiked with 15% PhiX control and an 8 pM denatured DNA library was prepared. The denatured library was sequenced on an Illumina MiSeq instrument using the Miseq Reagent kit V3.
Sequencing analysis
The demultiplexed fastq files consisting of 16S amplicon reads were downloaded from the Illumina MiSeq and analysed with the DADA2 [65] and PhyloSeq [66] packages in R [67]. DADA2 parameters for the ‘filterAndTrim’ function included a truncation length of 300 for forward and 270 bases for reverse reads, a maximum of 4 expected errors per read, truncation of reads at the first instance of a QC score below 2, removal of phiX reads and trimming of 17 and 21 bases from the left side of the forward and reverse reads, respectively, to remove the primer sequences. Further data visualization was accomplished with the ggplot2 [68] package in R.
Abbreviations
- ASV:
-
Amplicon Sequence Variant
- BBU:
-
Biological biogas upgrading
- HRT:
-
Hydraulic retention time
- NMDS:
-
Non-metric multidimensional scaling
- OLR:
-
Organic loading rate
- PCA:
-
principal components analysis
- SRA:
-
Sequence Read Archive
- TAN:
-
Total ammonium nitrogen
- TCOD:
-
Total chemical oxygen demand
- VFA:
-
Volatile fatty acid
References
Ács N, Bagi Z, Rákhely G, Minárovics J, Nagy K, Kovács KL. Bioaugmentation of biogas production by a hydrogen-producing bacterium. Bioresour Technol. 2015;186:286–93.
Bassani I, Kougias PG, Treu L, Porté H, Campanaro S, Angelidaki I. Optimization of hydrogen dispersion in thermophilic up-flow reactors for ex situ biogas upgrading. Bioresour Technol. 2017;234:310–9.
Díaz I, Pérez C, Alfaro N, Fdz-Polanco F. A feasibility study on the bioconversion of CO2 and H2 to biomethane by gas sparging through polymeric membranes. Bioresour Technol. 2015;185:246–53.
Agneessens LM, Ottosen LDM, Voigt NV, Nielsen JL, de Jonge N, Fischer CH, et al. In-situ biogas upgrading with pulse H2 additions: the relevance of methanogen adaption and inorganic carbon level. Bioresour Technol. 2017;233:256–63.
Mulat DG, Mosbæk F, Ward AJ, Polag D, Greule M, Keppler F, et al. Exogenous addition of H2 for an in situ biogas upgrading through biological reduction of carbon dioxide into methane. Waste Manag. 2017;68:146–56.
Bassani I, Kougias PG, Treu L, Angelidaki I. Biogas upgrading via hydrogenotrophic methanogenesis in two-stage continuous stirred tank reactors at mesophilic and thermophilic conditions. Environ Sci Technol. 2015;49:12585–93.
Bassani I, Kougias PG, Angelidaki I. In-situ biogas upgrading in thermophilic granular UASB reactor: key factors affecting the hydrogen mass transfer rate. Bioresour Technol. 2016;221:485–91.
Rittmann SK-MR. A critical assessment of microbiological biogas to biomethane upgrading systems. In: Guebitz GM, Bauer A, Bochmann G, Gronauer A, Weiss S, editors. Biogas science and technology. Cham: Springer International Publishing; 2015. p. 117–35.
Seifert AH, Rittmann S, Bernacchi S, Herwig C. Method for assessing the impact of emission gasses on physiology and productivity in biological methanogenesis. Bioresour Technol. 2013;136:747–51.
Kougias PG, Treu L, Benavente DP, Boe K, Campanaro S, Angelidaki I. Ex-situ biogas upgrading and enhancement in different reactor systems. Bioresour Technol. 2017;225:429–37.
Luo G, Angelidaki I. Integrated biogas upgrading and hydrogen utilization in an anaerobic reactor containing enriched hydrogenotrophic methanogenic culture. Biotechnol Bioeng. 2012;109:2729–36.
Vo TTQ, Wall DM, Ring D, Rajendran K, Murphy JD. Techno-economic analysis of biogas upgrading via amine scrubber, carbon capture and ex situ methanation. Appl Energy. 2018;212:1191–202.
Strübing D, Huber B, Lebuhn M, Drewes JE, Koch K. High performance biological methanation in a thermophilic anaerobic trickle bed reactor. Bioresour Technol. 2017;245:1176–83.
Inkeri E, Tynjälä T, Laari A, Hyppänen T. Dynamic one-dimensional model for biological methanation in a stirred tank reactor. Appl Energy. 2018;209:95–107.
Guneratnam AJ, Ahern E, FitzGerald JA, Jackson SA, Xia A, Dobson ADW, et al. Study of the performance of a thermophilic biological methanation system. Bioresour Technol. 2017;225:308–15.
Martin MR, Fornero JJ, Stark R, Mets L, Angenent LT. A single-culture bioprocess of Methanothermobacter thermautotrophicus to upgrade digester biogas by CO2-to-CH4 conversion with H2. Archaea. 2013. https://doi.org/10.1155/2013/157529.
Voelklein MA, Rusmanis D, Murphy JD. Biological methanation: strategies for in situ and ex situ upgrading in anaerobic digestion. Appl Energy. 2019;235:1061–71.
Götz M, Lefebvre J, Mörs F, McDaniel Koch A, Graf F, Bajohr S, et al. Renewable power-to-gas: a technological and economic review. Renew Energy. 2016;85:1371–90.
Rittmann SKMR, Seifert AH, Bernacchi S. Kinetics, multivariate statistical modelling, and physiology of CO2-based biological methane production. Appl Energy. 2018;216:751–60.
Seifert AH, Rittmann S, Herwig C. Analysis of process related factors to increase volumetric productivity and quality of biomethane with Methanothermobacter marburgensis. Appl Energy. 2014;132:155–62.
Lecker B, Illi L, Lemmer A, Oechsner H. Biological hydrogen methanation—a review. Bioresour Technol. 2017;245:1220–8.
Luo G, Johansson S, Boe K, Xie L, Zhou Q, Angelidaki I. Simultaneous hydrogen utilization and in situ biogas upgrading in an anaerobic reactor. Biotechnol Bioeng. 2012;109:1088–94.
Szuhaj M, Ács N, Tengölics R, Bodor A, Rákhely G, Kovács KL, et al. Conversion of H2 and CO2 to CH4 and acetate in fed-batch biogas reactors by mixed biogas community: a novel route for the power-to-gas concept. Biotechnol Biofuels. 2016;9:1–14.
Abdel Azim A, Pruckner C, Kolar P, Taubner RS, Fino D, Saracco G, et al. The physiology of trace elements in biological methane production. Bioresour Technol. 2017;241:775–86.
Rittmann S, Seifert A, Herwig C. Essential prerequisites for successful bioprocess development of biological CH4 production from CO2 and H2. Crit Rev Biotechnol. 2015;35:141–51.
Rittmann S, Seifert A, Herwig C. Quantitative analysis of media dilution rate effects on Methanothermobacter marburgensis grown in continuous culture on H2 and CO2. Biomass Bioenergy. 2012;36:293–301.
Aryal N, Kvist T, Ammam F, Pant D, Ottosen LDM. An overview of microbial biogas enrichment. Bioresour Technol. 2018;264:359–69.
Rachbauer L, Beyer R, Bochmann G, Fuchs W. Characteristics of adapted hydrogenotrophic community during biomethanation. Sci Total Environ. 2017;595:912–9.
Marchaim U, Krause C. Propionic to acetic acid ratios in overloaded anaerobic digestion. Bioresour Technol. 1993;43:195–203.
Kern T, Theiss J, Röske K, Rother M. Assessment of hydrogen metabolism in commercial anaerobic digesters. Appl Microbiol Biotechnol. 2016;100:4699–710.
Sandberg M, Ahring BK. Anaerobic treatment of fish meal process waste-water in a UASB reactor at high pH. Appl Microbiol Biotechnol. 1992;36:800–4.
Rachbauer L, Voitl G, Bochmann G, Fuchs W. Biological biogas upgrading capacity of a hydrogenotrophic community in a trickle-bed reactor. Appl Energy. 2016;180:483–90.
Wang W, Xie L, Luo G, Zhou Q, Angelidaki I. Performance and microbial community analysis of the anaerobic reactor with coke oven gas biomethanation and in situ biogas upgrading. Bioresour Technol. 2013;146:234–9.
Lee JC, Kim JH, Chang WS, Pak D. Biological conversion of CO2 to CH4 using hydrogenotrophic methanogen in a fixed bed reactor. J Chem Technol Biotechnol. 2012;87:844–7.
Fukuzaki S, Nishio N, Shobayashi M, Nagai S. Inhibition of the fermentation of propionate to methane by hydrogen, acetate, and propionate. Appl Environ Microbiol. 1990;56:719–23.
Ahring BK, Westermann P, Mah RA. Hydrogen inhibition of acetate metabolism and kinetics of hydrogen consumption by Methanosarcina thermophila TM-1. Arch Microbiol. 1991;157:38–42.
Angelidaki I, Treu L, Tsapekos P, Luo G, Campanaro S, Wenzel H, et al. Biogas upgrading and utilization: current status and perspectives. Biotechnol Adv. 2018;36:452–66.
Treu L, Kougias PG, de Diego-Díaz B, Campanaro S, Bassani I, Fernández-Rodríguez J, et al. Two-year microbial adaptation during hydrogen-mediated biogas upgrading process in a serial reactor configuration. Bioresour Technol. 2018;264:140–7.
Campanaro S, Treu L, Kougias PG, De Francisci D, Valle G, Angelidaki I. Metagenomic analysis and functional characterization of the biogas microbiome using high throughput shotgun sequencing and a novel binning strategy. Biotechnol Biofuels. 2016;9:1–17.
Porté H, Kougias PG, Alfaro N, Treu L, Campanaro S, Angelidaki I. Process performance and microbial community structure in thermophilic trickling biofilter reactors for biogas upgrading. Sci Total Environ. 2019;655:529–38.
Treu L, Kougias PG, Campanaro S, Bassani I, Angelidaki I. Deeper insight into the structure of the anaerobic digestion microbial community; the biogas microbiome database is expanded with 157 new genomes. Bioresour Technol. 2016;216:260–6.
Meng X, Yuan X, Ren J, Wang X, Zhu W, Cui Z. Methane production and characteristics of the microbial community in a two-stage fixed-bed anaerobic reactor using molasses. Bioresour Technol. 2017;241:1050–9.
Ros M, de Souza Oliveira Filho J, Perez Murcia MD, Bustamante MA, Moral R, Coll MD, et al. Mesophilic anaerobic digestion of pig slurry and fruit and vegetable waste: dissection of the microbial community structure. J Clean Prod. 2017;156:757–65.
Treu L, Campanaro S, Kougias PG, Sartori C, Bassani I, Angelidaki I. Hydrogen-fueled microbial pathways in biogas upgrading systems revealed by genome-centric metagenomics. Front Microbiol. 2018;9:1–16.
Narihiro T, Nobu MK, Kim NK, Kamagata Y, Liu WT. The nexus of syntrophy-associated microbiota in anaerobic digestion revealed by long-term enrichment and community survey. Environ Microbiol. 2015;17:1707–20.
Conklin AS, Stensel HD, Ferguson JF. The growth kinetics and competition between Methanosarcina and Methanosaeta in mesophilic anaerobic digestion. Proc Water Environ Fed. 2012;2005:100–21.
Venkiteshwaran K, Bocher B, Maki J, Zitomer D. Relating anaerobic digestion microbial community and process function. Microbiol Insights. 2016;8:37.
Demirel B, Scherer P. The roles of acetotrophic and hydrogenotrophic methanogens during anaerobic conversion of biomass to methane: a review. Rev Environ Sci Biotechnol. 2008;7:173–90.
Ziganshin AM, Ziganshina EE, Kleinsteuber S, Nikolausz M. Comparative analysis of methanogenic communities in different laboratory-scale anaerobic digesters. Archaea. 2016;2016:1–12.
Kobayashi T, Yasuda D, Li YY, Kubota K, Harada H, Yu HQ. Characterization of start-up performance and archaeal community shifts during anaerobic self-degradation of waste-activated sludge. Bioresour Technol. 2009;100:4981–8.
De Vrieze J, Hennebel T, Boon N, Verstraete W. Methanosarcina: the rediscovered methanogen for heavy duty biomethanation. Bioresour Technol. 2012;112:1–9.
Villamizar GAC, Daniel RPA. First insights into the genome sequence of the strictly anaerobic homoacetogenic. Genome Announc. 2017;5(12):e00037-17.
Xu K, Liu H, Chen J. Effect of classic methanogenic inhibitors on the quantity and diversity of archaeal community and the reductive homoacetogenic activity during the process of anaerobic sludge digestion. Bioresour Technol. 2010;101:2600–7.
Chen A, Ohashi A, Harada H. Acetate synthesis from H2/CO2 in simulated and actual landfill samples. Environ Technol. 2008;24:435–43.
Lee J, Kim E, Han G, Tongco JV, Shin SG, Hwang S. Microbial communities underpinning mesophilic anaerobic digesters treating food wastewater or sewage sludge: a full-scale study. Bioresour Technol. 2018;259:388–97.
Solli L, Håvelsrud OE, Horn SJ, Rike AG. A metagenomic study of the microbial communities in four parallel biogas reactors. Biotechnol Biofuels. 2014;7:1–15.
Panichnumsin P, Ahring BK, Nopharatana A, Chaipresert P. Comparative performance and microbial community of single-phase and two-phase anaerobic systems co-digesting cassava pulp and pig manure. World Acad Sci Eng Technol. 2010;62:721–6.
Hao L, Bize A, Conteau D, Chapleur O, Courtois S, Kroff P, et al. New insights into the key microbial phylotypes of anaerobic sludge digesters under different operational conditions. Water Res. 2016;102:158–69.
Dar SA, Kleerebezem R, Stams AJM, Kuenen JG, Muyzer G. Competition and coexistence of sulfate-reducing bacteria, acetogens and methanogens in a lab-scale anaerobic bioreactor as affected by changing substrate to sulfate ratio. Appl Microbiol Biotechnol. 2008;78:1045–55.
Isa Z, Grusenmeyer S, Vestraete W. Sulfate reduction relative to methane production in high-rate anaerobic digestion: technical aspects. Appl Environ Microbiol. 1986;51:572–9.
Angelidaki I, Sanders W. Assessment of the anaerobic biodegradability of macropollutants. Rev Environ Sci Biotechnol. 2004;3:117–29.
Mulat DG, Dibdiakova J, Horn SJ. Microbial biogas production from hydrolysis lignin: insight into lignin structural changes. Biotechnol Biofuels. 2018;11:61.
Zamanzadeh M, Hagen LH, Svensson K, Linjordet R, Horn SJ. Anaerobic digestion of food waste—effect of recirculation and temperature on performance and microbiology. Water Res. 2016;96:246–54.
Takahashi S, Tomita J, Nishioka K, Hisada T, Nishijima MN. Development of a prokaryotic universal primer for simultaneous analysis of Bacteria and Archaea using next-generation sequencing. PLoS ONE. 2014;9:1–9.
Callahan BJ, McMurdie PJ, Rosen MJ, Han AW, Johnson AJA, Holmes SP. DADA2: high resolution sample inference from Illumina amplicon data. Nat Methods. 2016;13:581–3.
McMurdie PJ, Holmes S. Phyloseq: an R package for reproducible interactive analysis and graphics of microbiome census data. PLoS ONE. 2013;8:e61217.
R Core Team. R: a language and environment for statistical computing. R Foundation for Statistical Computing, Vienna, Austria; 2018. https://www.R-project.org/.
Wickham H. ggplot2: elegant graphics for data analysis. New York: Springer-Verlag; 2016.
Authors’ contributions
RW, DGM and SJH conceived the study. RW set-up and operated the reactors, collected samples and process parameter data. RW extracted DNA from the samples, performed the 16S amplicon PCR and prepared the sequencing libraries. JCG analysed, visualized and interpreted the 16S amplicon data. DGM contributed to some aspects of reactor maintenance and data collection. RW did the initial analysis and interpretation of the reactor data. RW wrote the initial draft of the manuscript, JCG wrote the sections pertaining to the microbial community analysis, and DGM, JCG and SJH reviewed and edited subsequent versions of the manuscript. All authors read and approved the final manuscript.
Acknowledgements
The authors wish to thank Kine Svensson and staff at biogas laboratory at the Norwegian University of Life Sciences (NMBU) in Ås, Norway for their assistance.
Competing interests
The authors declare that they have no competing interests.
Availability of data and materials
The sequence dataset generated and/or analysed during this study is available in the Sequence Read Archive (https://www.ncbi.nlm.nih.gov/sra) under BioProject Accession PRJNA517383 with BioSample Accessions SAMN10840281 to SAMN10840346 and SRA Accessions SRR8502958 to SRR8503023. The bioprocess data corresponding to the microbial community sampling time points are provided as a spreadsheet (Additional file 3: Spreadsheet), and as scatterplot matrices of pairwise comparisons between the bioprocess parameters (Additional file 4: Scatterplot Matrices). The 16S amplicon sequences for ASV1 to ASV100 are available as a FASTA format, plain text file (Additional file 5: FASTA file). Additional bioprocess data, R scripts, ASV sequences beyond the top 100 most abundant already provided, and additional data files used for the analyses presented herein are available from the corresponding author on reasonable request.
Consent for publication
Not applicable.
Ethics approval and consent to participate
Not applicable.
Funding
This work was financially supported by the Research Council of Norway project no. 257622 (Bio4Fuels).
Publisher’s Note
Springer Nature remains neutral with regard to jurisdictional claims in published maps and institutional affiliations.
Author information
Authors and Affiliations
Corresponding author
Additional files
Additional file 1: Figure S1.
Stacked barplot of the relative abundance of ASVs detected in each sample. ASVs are indicated by the colours displayed in the legend at the bottom of the figure. Reactor type and replicate are indicated in the horizontal axis labels in each facet (e.g. C1 is control reactor replicate 1, and H indicates the hydrogen-supplemented reactors). The text at the top of each facet indicates the sampling timepoint in days since reactor start-up. Samples with less than 1000 sequences were omitted from the figure. The taxonomic identity of each ASV may be found in the header for each facet in the ASV Catalogue, Additional file 2, and the 16S amplicon sequence for each ASV within the top 100 most abundant ASVs may be found in Additional file 5.
Additional file 2.
ASV Catalogue. Multipage PDF format file with 100 facets corresponding to the top 100 most abundant ASVs. The ASV number and associated taxonomy are indicated by the text at the top of each facet. Datapoints in each figure indicate the abundance of the ASV in a reactor replicate sample at the time in days since reactor start-up. The solid line indicates the mean of control reactor abundances and the dashed line indicates that for the hydrogen-supplemented reactors, while symbol shape and fill indicate whether the datapoint corresponds to a reactor without H2 addition (control) or with (H2 supplemented), as indicated in the legend above each plot. Some ASVs indicate zero abundance across all timepoints, presumably because the elimination of samples with less than 1000 sequences resulted in the removal of spurious ASVs that comprised nearly the entirety of the few sequences present in the sample.
Additional file 3.
Bioprocess data. Excel format spreadsheet of bioprocess data and factors corresponding to the microbial samples analysed. Columns are variables and factors, and rows are samples. Units are indicated in the column headers.
Additional file 4.
Scatterplot matrices. Multipage PDF format file of pairwise scatterplots of bioprocess variables. The legend at the top of each page indicates the colouring of datapoints by phase of reactor operation or H2 supplementation (i.e. control vs. H2-supplemented). There are two plots for each colouring because some variables were not measured across all samples, and the two matrices with the lesser number of variables include all samples.
Additional file 5.
FASTA sequences. FASTA format, 16S amplicon sequence file of the top 100 most abundant ASV sequences, with names in the FASTA headers corresponding to the names referenced in the article text and figures (e.g. ASV76 corresponds to Methanobacterium as discussed in the text and as indicated in the figures).
Rights and permissions
Open Access This article is distributed under the terms of the Creative Commons Attribution 4.0 International License (http://creativecommons.org/licenses/by/4.0/), which permits unrestricted use, distribution, and reproduction in any medium, provided you give appropriate credit to the original author(s) and the source, provide a link to the Creative Commons license, and indicate if changes were made. The Creative Commons Public Domain Dedication waiver (http://creativecommons.org/publicdomain/zero/1.0/) applies to the data made available in this article, unless otherwise stated.
About this article

Cite this article
Wahid, R., Mulat, D.G., Gaby, J.C. et al. Effects of H2:CO2 ratio and H2 supply fluctuation on methane content and microbial community composition during in-situ biological biogas upgrading. Biotechnol Biofuels 12, 104 (2019). https://doi.org/10.1186/s13068-019-1443-6
Received:
Accepted:
Published:
DOI: https://doi.org/10.1186/s13068-019-1443-6