
Abstract
Background
Nowadays, is emerging a new generation of highly promising inhibitors bearing the β-ketoenol functionality. The present work relates to the first synthesis, the structure determination, the DFT studies and the use of a new biomolecule designed with a β-ketoenol group bounded to a pyrazolic moiety.
Result
A novel β-ketoenol-pyrazole has been synthesized, well characterized and its structure was confirmed by single crystal X-ray diffraction. The electron densities and the HOMO–LUMO gap have been calculated using the DFT method with BLYP, PW91, PWC functionals and 6-31G* basis set. An evaluation of the molecule stability is provided by a NBO analysis and the calculated Fukui and Parr functions have been used to locate the reactive electrophile and nucleophile centers in the molecule. The synthesized compound, screened for its in vitro antifungal behavior against the Fusarium oxysporum f.sp. albedinis FAO fungal strains, shows a moderate activity with an inhibition percentage of 46%. The product was also tested against three bacterial strains (Escherichia coli, Bacillus subtilis and Micrococcus luteus), but no significant effect was observed against these organisms.
Conclusions
Density functional calculations are used to evaluate the HOMO–LUMO energy gap, the molecular electrostatic potential and to provide a natural bond orbital analysis. The measured antimicrobial activities encourage us to continue searching for other structures, likely to be good antifungal candidates.

Introduction
Pyrazoles represent a class of compounds endowed with a great interest in many domains. They have been widely described in the literature as chelating ligands [1,2,3,4,5,6] and several works have been gathered in reviews [7,8,9,10]. According to numerous literature reports, these derivatives are also well-known as important heterocyclic biologically active compounds, acting as antitumor [11], antiviral [12], anti-inflammatory [13] anti-anxiety [14] or antimicrobial [15] agents.
On the other hand, β-ketoenols form an important class of compounds, with an interest both in medical and pharmaceutical fields, regarded as drugs against HIV [16,17,18], cancer [19,20,21,22] and influenza [23] but also as antioxidant [24] and anti-inflammatory [25] substances. The β-ketoenol derivatives play also an important role in the development of coordination chemistry, as they are able to easily form stable complexes with most transition metals involving different modes of coordination and different functionalities [26, 27].
The pyrazoles associated with β-ketoenol groups lead to compounds with promising properties in both medicinal and coordination chemistry fields. In our recent works, some heterocycles containing the β-keto-enol functionality have been reported, that show significant biological activity [28] as well as interesting coordination properties [29,30,31,32,33].
The intention of this work was to develop of a novel pyrazole-based compound bearing a β-ketoenol functionality. Its crystal structure was solved from X-ray single crystal data and DFT studies were realized. The compound was also evaluated for its in vitro antifungal activity against Fusarium oxysporum f.sp. albedinis FAO fungal strains and against three bacterial strains (Escherichia coli, Bacillus subtilis and Micrococcus luteus).
Results and discussion
Chemistry
The target biomolecule based on β-ketoenol and pyrazole entities was prepared by a one-pot in situ condensation method which is similar to the procedures given in our previous works [28]. A solution of pyrazolic carboxylate was added to a suspension of sodium in toluene, then 1-(3-bromophenyl)ethanone was added at 0 °C (Scheme 1). After 2-days stirring at room temperature, the resulting precipitate has been treated and neutralized. The extracted organic layer was concentrated, dried and purified by silica gel column chromatography (see “Experimental section” part for details).

Synthesis of the target compound 1
The β-keto-enol form was confirmed by the 1H-NMR analysis of the compound whose spectrum (Additional file 1: Figure S1) shows a strong signal assigned to the =C–H group of the keto-enol form at 6.54 ppm, it represents 85% of the compound. The diketone form is also present in a maximal proportion of 15% and was detected by the weak signal at 4.54 ppm which was attributed to the CH2 group of the diketone form. Traces of the keto form have also been detected in DEPTQ-135, which shows quaternary carbon atoms (C) and CH2 group as very small negative signals (Additional file 1: Figures S2 and S3). Good quality crystals of the major β-ketoenol structure were grown from methanolic solution by slow evaporation. The FT-IR spectrum confirms the formation of the ketoenol form with an enolic band at 1531 cm−1 (Additional file 1: Figure S4). Also in good agreement, the mass spectrum shows a molecular peak at 320.97. (Additional file 1: Figure S5).
X-ray crystal structure description
Single crystals of (Z)-3-(3-bromophenyl)-1-(1,5-dimethyl-1H-pyrazol-3-yl)-3-hydroxyprop-2-en-1-one (1) were analyzed by X-ray diffraction in order to determine the compound structure.
The main crystal data are given with principal refinement parameters in Table 1 and the atom position and displacement parameters are listed in Table 2. The full CIF file deposited at the Cambridge Crystallographic Data Center (CCDC 1817604) is available at http://www.ccdc.cam.ac.uk/conts/retrieving.html.
The asymmetric unit contains two independent molecules. Each molecule is built with two rings, a bromophenyl ring bonded (at meta position) to a dimethyl pyrazole ring through a central core unit –CO–C–COH– (Fig. 1). According to the root mean square deviations of the fitted atoms in each group, ranging from 0.003 to 0.008, these three units are planar. The dihedral angles between the central core and the two rings, between 4.3 and 8.7°, indicate a slight deviation to flatness within each of the independent molecules. The two independent molecular units are almost coplanar, as shown by the angle of only 1.96(3)° measured between their mean planes (calculated with all the non-H atoms). The bonds lengths and angles measured in the two molecules are very close and in range of values found in the literature for similar compounds [34,35,36,37,38].

Ortep molecular representation of C14 H13 Br N2 O2 (30% probability ellipsoids)
The molecular arrangement in the solid is such as one unit cell contains four molecules, two-by-two symmetry-related. As a consequence of the co-planarity of the independent molecular units, the packing in the crystal results in a layered arrangement shown in Fig. 2. Within planes parallel to \(\left( {1\bar{1}\bar{1}} \right)\) and separated by ~ 3.5 Å, each molecule is surrounded by six homologous units, this molecular organization is studied later in this work for evaluation of in-plane interactions. On the other hand, no π-stacking interaction must be expected because of relative position of the successive planes without ring overlapping.

Molecular packing in the triclinic lattice enhancing the peculiar layered arrangement of molecules in planes parallel to (\(1\bar{1}\bar{1}\))
DFT calculations
To investigate the molecular geometry and the electron distribution in the solid, density functional theory (DFT) calculations were carried out using the program Dmol3 at three DFT levels: with PW91 or BLYP functional within the GGA (generalized gradient approximation) and with PWC functional within the LDA (local density approximation) [39,40,41]. Double numerical plus polarization DNP basis sets were taken in all calculations.
Full geometry optimization (LDA-PWC) by minimization of the total energy was first carried out, both starting from experimental geometry and from three planar geometries built by rotation of the rings around the C1–C9 and C3–C4 bonds (Fig. 3).
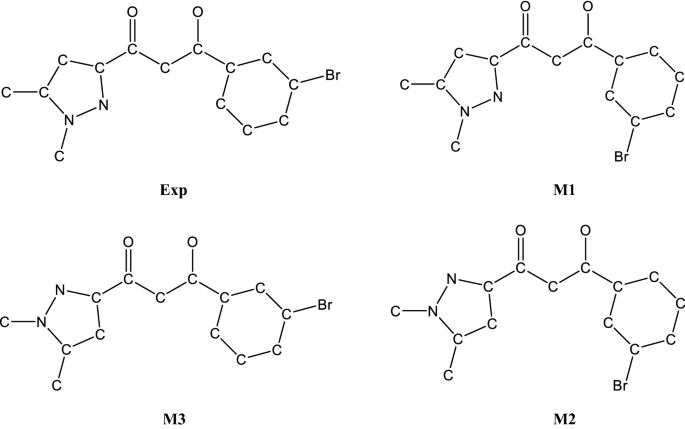
Experimental molecule and hypothetical models built by changing the rings orientation
The total energies calculated indicate a lower stability, by 0.16 and 0.17 eV, for the M2 and M3 models compared to experimental geometry. This potentially results from the occurrence of some N···O repulsive interactions in these configurations. Instead, the M1 model is almost as stable (only differing by 0.001 eV) as the experimental molecule in which the central core and the rings are rigorously coplanar (dihedral angles lower than 2°).
Trying to evaluate intermolecular interactions within the solid, geometry was optimized for a large molecular fragment consisting of a molecule and its six surrounding neighbors. The three dimensional contour of the total density, drawn at the 0.04e−/Å3 isolevel and mapped with the electron deformation density, has been represented in Fig. 4. The deformation density, computed as the total electron density with the density of isolated atoms subtracted, points outs the electron localization as positive regions and the electron losses as negative regions. Looking at its representation, one can conclude that no strong intermolecular interaction exists in this compound. Nevertheless, the positive domains (yellow zones in Fig. 4) indicate the occurrence of an interaction between the bromine atom of a molecule and the nitrogen N2 atom of a neighboring molecule.

Representation of the 3D isosurface electron density (volumic contour) mapped with the deformation density. Positive value (yellow domains) indicate electron localization
As expected, the periodic calculations in the solid confirm the absence of any bonding density between the molecular planes separated by 3.5 Å. Selected bonds and angles given in Table 3 illustrate the structural, and rather weak, packing constraints onto the molecular geometry. It is interesting to remark that the dihedral angle between mean planes of the two independent molecules in the unit cell is about 4° in the optimized structures, a value which is nearly twice the angle in the experimental crystal. On the other hand, the experimental torsion angles C4–C3–C2–C1 and C3–C2–C1–C9, which reflect the molecule flatness, range from 176.8 to 179.6° and do not differ much from the values in optimized molecular (177.8–179.9°) and 3D periodic (175.6–179.8°) models.
Within the overall context of the FMO theory, the energetic level and the form of the frontier orbitals are relevant parameters for analysis of the molecular reactivity [42]. Regardless of the DFT level of theory, an HOMO–LUMO energy separation of about 2.3 eV has been calculated with DMol3 for the molecule (2.7 eV in the crystal), this value should be compared with the gap of 3.46 eV measured experimentally from UV experiments (absorption peak at 358 nm) (Additional file 1: Figure S6). Both orbitals display a π-type character mainly localized on the central part of the molecule, which is bonding at the HOMO and antibonding at the LUMO levels.
Fukui and Parr functional analysis
Calculated electron deformation density is strongly related to molecular electrostatic potential and for this reason may be equally used to discuss the reactivity [43]. The latter is also seen as a useful tool in evaluation of the regiochemistry, especially in reactions that are dominated by electrostatic effects. The electrophilic f(−) and nucleophilic f(+) Fukui functions, whose extreme values reflect the ability for an electrophilic or a nucleophilic attack, are defined as electron density derivatives with respect to the number of electrons at a constant potential. They can give a measure of the local reactivity and they have been considered suitable to rationalize the regioselectivity [44,45,46,47].
Though, it has been stated that regioselectivity in polar reactions should be predictable alternately using the local electrophilicity [48]. Then electrophilic and nucleophilic Parr functions P +k and P −k are powerful tools to study the molecular reactivity and they are well adapted to localize the electrophile and nucleophile centers in an organic molecule [49, 50]. They have been computed from the atomic spin density (difference between α and β electron densities) for the radical anion and the radical cation having the geometry optimized for the neutral molecule.
The spatial distribution of the atomic spin density mapped on the electrostatic potential provides a graphical view of the localization of electrophilic and nucleophilic centers (Fig. 5). In the present case, the Parr functions quite well validate the results predicted by Fukui functions with an electrophile center at C2 atom (and at a less extent at N2 and C10 atoms) while the nucleophile center is situated at the central core of the molecule mainly at O2 atom, most likely to undergo a nucleophilic attack.

Atomic spin density spatial distribution mapped onto the electrostatic potential showing the electrophilic (left image) and nucleophilic (right image) centers as red zones
The global electrophilicity index ω, expressed as μ2/2η [51], takes here the value of 2.28. It has been obtained from the electronic chemical potential μ (μ = 1/2 × (EHOMO + ELUMO) = –4.37 eV) and the chemical hardness η (η = ELUMO − EHOMO = 4.17 eV), both calculated with G03W code from the one-electron energies of the frontier orbitals. The maximal charge transfer (− μ/η) is found close to unity and the nucleophilicity index N close to 3. The latter is calculated comparatively to TCE taken as a reference from N = EHOMO − EHOMO(TCE) where EHOMO(TCE) = 9.4083 eV is the energy calculated in the same conditions for tetracyanoethylene. Based on these calculated theoretical reactivity indices, the molecule is characterized with a moderate nucleophile and rather good electrophile character.
Natural bond orbital (NBO) analysis
The NBO analysis is a helpful way to study the interactions among bonds and to examine the charge transfer resulting of conjugative interactions in a molecular system [52, 53]. The hyperconjugative interaction energy is deduced from a second-order perturbation approach [53]. Considering a donor (i) and an acceptor (j), the stabilization energy E(2) associated with delocalization is estimated as qi × F(i, j)2/(εi − εj), where qi is the donor orbital occupancy, εi and εj are diagonal elements (orbital energies) and F(i, j) is the off-diagonal NBO Fock matrix element. The larger the stabilization energy, the stronger the donor-to-acceptor interaction, i.e. more important is the electron-donor trend towards acceptor and greater is the extent of conjugation on the whole system. Table 4 summarizes the highest interactions between bonding and antibonding (Lewis/non-Lewis) natural orbitals as for example between the π C1–C2 donor and the π* O2–C3 acceptor with a stabilizing energy of 32.54 kcal.mol−1. The lone pair (LP) orbitals are also seen to have important stabilizing contributions as illustrated with interaction of the lone pair at O1 atom with the π* C1–C2 acceptor (44.40 kcal.mol−1).
Biological activity
The in vitro antibacterial and antifungal activities of compound 1 were tested by the agar diffusion technique [54,55,56] using fungal strains (Fusarium oxysporum f.sp. albedinis FAO) and bacterial strains (Escherichia coli, Bacillus subtilis, and Micrococcus luteus). Tests were also performed for comparison on several compounds already prepared in our former works (Fig. 6).

Molecular structures of compounds 1–6
Results of the tests carried out towards bacterial strains for the new compound 1 and also for the other products 2–6 revealed no significant effect against these organisms.
On the contrary, the structure 1 led to a moderate inhibiting antifungal activity of 46% occurring at 500 μL of sample. This antifungal effect remains rather modest with regard to the benomyl fungicide (94%) as reported in Table 5.
Generally, the results obtained for this new structure are in agreement with activities of the similar compounds 2–4 [28]. The inhibiting percentage of 46% found for 1 is in the range of values obtained for compounds 2–4, between 36 and 54%. Instead, the antifungal performances found for structures 5 and 6, also belonging to the same family, reach values very close to the benomyl fungicide taken as reference. Such differences in the biological activity are obviously dependent on the radical group attached to the pyrazol ketoenol fragment. The best inhibiting activities are obtained with a methyl or a phenyl group while the presence of substituted phenyl groups (m-bromophenyl, p-methyl phenyl or p-metoxy phenyl) provide lower antifungal properties. These findings push us to dig deeper to find much more interesting molecules. Of course, various structural modifications to bring to these compounds as antifungal candidates are currently in progress.
Experimental section
General information
All solvents and other chemicals (purity > 99.5%, Aldrich, Saint-Louis, MO, USA) of analytical grade were used without further purification. An Xcalibur four circle CCD diffractometer (Oxford Diffraction, Abingdon, Oxfordshire, England) was used to collect the X-ray intensities diffracted by a parallelepiped colorless selected crystal (CNRS, ICGM, France). Elemental analyses were performed by the Microanalysis Centre Service (CNRST, Rabat, Morocco). Melting points were measured using a Büchi 510 m.p. apparatus (LCAE, Oujda, Morocco). 1H and 13C-NMR spectra were recorded using an AC 300 spectrometer (CNRST) (Bruker, LLN, Belgium) (300 MHz for 1H and 75.47 MHz for 13C spectra). A JMS DX-300 mass spectrometer (JEOL, Rabat, Morocco) was used for the determination of molecular weights. Infrared (IR) spectra were recorded on a Shimadzu infrared spectrophotometer (LCAE, Oujda, Morocco) using the KBr disc technique. Geometry optimizations and DFT calculations were carried out using Dmol3 and Gaussian G03W programs (CNRS, ICGM, France).
Procedure for the synthesis of pyrazole-ketoenol
To a solution of toluene (20 mL) containing metallic sodium (15.21 mmol) was added the pyrazolic carboxylate (12.01 mmol) solubilized in toluene (20 mL); then 3-bromophenyl methyl ketone (12.01 mmol) in toluene (10 mL) was added at 0 °C. The resulting mixture was stirred at room temperature for 2 days. The resulting precipitate was filtered, washed, dissolved in water, and neutralized with acetic acid to pH 5. The CH2Cl2 extracted fraction was dried over anhydrous sodium sulfate and concentrated to dry. The final product, as a white solid, was obtained after purification through silica gel column chromatography using CH2Cl2/MeOH in 28% yield. The β-ketoenol form was recrystallized from methanol (95%) to obtain the (Z)-3-(3-bromophenyl)-1-(1,5-dimethyl-1H-pyrazol-3-yl)-3-hydroxyprop-2-en-1-one compound which was confirmed by FT-IR, 1H-NMR, 13C NMR, and mass spectroscopy. yield: 28%; m.p. 124 °C; Rf = 0.52 (CH2Cl2/MeOH 9/1)/silica. IR (KBr, cm−1): ν (OH) = 3431; ν (C=O) = 1676; ν (enolic C=C) = 1531; 1H NMR [CDCl3, δ(ppm)]: 2.24 (s, 3H, Pz-CH3); 3.78 (s, 3H, CH3–N); 4.54 (s, 0.1H, keto, CH2); 6.54 (s, 0.9H, enol, C–H); 7.39 (m, 3H, Ar-2H, Pz–H); 7.91(m, 2H, Ar–H). 13C NMR [CDCl3, δ(ppm)]: 11.29 (1C, Pz-CH3); 36.88 (1C, CH3–N); 49.39 (1C, keto CH2); 93.24 (1C, enol C–H); 106.14 (1C, =CH, Pz); 127.01 (1C, Ar–C3); 128.53 (1C, Ar–C6); 132.04 (1C, Ar–C5); 133.31(1C, Ar–C2); 134.97 (1C, Ar–C1); 140.37 (1C, Ar–C4); 147.72 (2C, PzN=C, PzN–C=); 181.99 (1C, C–OH); 183.19 (1C, C=O). Anal. Calcd. for C14H13BrN2O2: C 52.36, H 4.08, N 8.72. Found: C 52.25, H 4.12, N 8.65. m/z: 320.97.
X-ray data collection and treatment
Fairly regularly shaped crystals were selected using a stereomicroscope equipped with a polarizing filter. Diffracted intensities were collected at room temperature within the complete diffraction sphere on the four-circle diffractometer (Mo-Kα radiation, λ = 0.71073 Å) and data reduction was carried out using CrysAlis software [57]. The lattice dimensions and corresponding standard deviations were determined by least-squares method from the entire data set of reflections. Full-matrix least-squares refinements on F2 used the complete data set of 18,366 collected reflections (including symmetry equivalent and redundant) of which 6297 are unique and 3027 observed according to the criterion I > 2σ(I). The diffracted intensities were corrected for Lorentz and polarization effects. The structure solution and subsequent refinements were performed using SHELX-2013 program packages [58]. Atoms positions and anisotropic displacement parameters were refined for all non-hydrogen atoms. The hydrogen atoms at the keto enol OH group were detected in the final Fourier difference and were treated as riding, following the HFIX/AFIX instructions, in the final refinement (even if they could have been freely refined). The hydrogen atoms have been considered with an isotropic displacement parameter equal to 1.2 times (1.5 for terminal –CH3) the Ueq of the parent atom. Molecular pictures are drawn with ORTEP-3 for windows [59].
Full CIF file can be obtained free of charge via http://www.ccdc.cam.ac.uk/conts/retrieving.html (or from the CCDC, 12 Union Road, Cambridge CB2 1EZ, UK; Fax: +44 1223 336033; E-mail: deposit@ccdc.cam.ac.uk).
Computation details
Calculations were performed within the framework of the density functional theory DFT using DMol3 module [60, 61] provided in Materials Studio software. A DNP basis set (Double Numerical with extra Polarization function on all atoms) was used in these calculations, its size is equivalent to the Gaussian 6-31G*. All-electrons geometry optimizations were performed at fine quality level, for both the molecule and the periodic crystal packing, with LDA-PWC, GGA-PW91 and GGA-BLYP functionals. The Fukui and Parr functions have been computed to give a description of the global reactivity. Gaussian 03 W optimizations using the Berny analytical gradient method with B3LYP functional and 6.31G+(d,p) basis set have been done prior to calculate the reactivity indices and to perform the NBO analysis [53].
Anti-fungal tests
In vitro antibacterial and antifungal activities were tested by the agar diffusion technique (ADT) [54, 55]. ADT has been investigated using susceptibility test of NCCLS (National Committee for Clinical Laboratory Standards) recommended by the WHO and the French standard NF-U-47-107 AFNOR 2004. The agar media were inoculated with test organisms and a solution of the tested compound in DMSO/EtOH (50/50) was added to different concentrations in the culture media. The growth was followed by counting the bacteria or the yeast colonies and by measuring the mycelium diameter. The inhibition percentage of a molecule is equal to the ratio of the colonies number (or the mycelium diameter of the culture) in the presence of a dose of the tested compound over the colonies number (or the mycelium diameter) of the reference culture, multiplied by 100. The minimum inhibition concentration (MIC) is the least dose of the compound which causes an inhibition of the micro-organism growth. Calculation of the concentration IC50 was done using the same bacterial inocula mentioned above with decreasing concentration of the tested products. The Do value was measured for each culture at 625 nm. The inhibition percentage (%) is expressed as (D° − Dx)/D° × 100 where D° is the diameter of the mycelial growth of the culture witness and Dx the diameter of the mycelial growth in the presence of the product to be tested.
Conclusion
A novel pyrazole-β-ketoenol compound has been synthesized, it has been characterized by NMR and IR techniques and its XRD single crystal structure was determined. Density functional calculations are used to evaluate the HOMO–LUMO energy gap, the molecular electrostatic potential (MEP) and to provide a natural bond orbital (NBO) analysis. From reactivity indices, the present molecule displays a moderate electrophile character. Computed Parr functions quite well agree with Fukui functions, indicating the position of the nucleophile and electrophile centers in the molecule. The title compound has been tested against Fusarium oxysporum f.sp. albedinis FAO fungal strains and three bacterial strains (Escherichia coli, Bacillus subtilis, and Micrococcus luteus). The measured activities encourage us to continue searching for other structures, likely to be good antifungal candidates.
Abbreviations
- DFT:
-
density functional theory
- NBO:
-
natural bond orbital
- MEP:
-
molecular electrostatic potential
- HOMO:
-
highest occupied molecular orbital
- LUMO:
-
lowest unoccupied molecular orbital
- HIV:
-
human immunodeficiency virus
- LDA:
-
local density approximation
- DNP:
-
double numerical plus polarization
References
Dowling C, Murphy VJ, Parkin G (1996) Bis(pyrazolylethyl) ether ligation to zinc and cobalt: meridional vs facial coordination and the suitability of such ligands in providing a NNO donor set for modeling bioinorganic aspects of zinc chemistry. Inorg Chem 35:2415–2420
Haanstra WJ, Driessen WL, Van Roon M, Stoffels ALE, Reedijk J (1992) Co-ordination compounds with the N 2 S-donor ligand 1, 5-bis (3, 5-dimethylpyrazol-1-yl)-3-thiapentane. J Chem Soc Dalton Trans 3:481–486
Driessen WL, Wiesmeijer WGR, Schipper-Zablotskaja M, De Graaff RAG, Reedijk J (1989) Transition metal coordination compounds of two pyrazole-substituted ammonia ligands. X-ray structure of [Biss(1-pyrazolylmethyl)aminecobalt(II)] bis(nitrate). Inorg Chim Acta 162:233–238
Pennings YCM, Driessen WL, Reedijk J (1988) Copper(I) coordination compounds with two bidentate chelating pyrazole ligands. X-ray crystal structures of DI-μ-chloro-bis[[N, N-bis(1- pyrazolylmethyl)aminoethane]copper(I)] and [bis(N, N-bis(1-pyrazolylmethyl)aminoethane]copper(I) triflate. Polyhedron 7:2583–2589
Veldhuis JB, Driessen WL, Reedijk JA (1986) A pyrazole derivative of aminoethane as a tridentate chelating ligand towards transition metals. The X-ray structure of [N, N-bis(pyrazol-1-ylmethyl)aminoethane]dibromocopper(II. Chem Soc Dalton Trans 3:537–541
Blonk HJ, Driessen WL, Reedijk J (1985) Transition-metal co-ordination compounds of a novel aniline-based pyrazole derivative. X-Ray crystal structures of [NN-bis(3,5-dimethylpyrazol-1-ylmethyl) aminobenzene]-dichlorocobalt(II) and -dibromocopper(II. Chem Soc Dalton Trans 8:1699–1705
Mukherjee R (2000) Coordination chemistry with pyrazole-based chelating ligands: molecular structural aspects. Coord Chem Rev 203:151–218
Trofimenko S (1993) Recent advances in poly (pyrazolyl) borate (scorpionate) chemistry. Chem Rev 93:943–980
Trofimenko S (1986) The coordination chemistry of pyrazole-derived ligands. Prog Inorg Chem 34:115–210
Radi S (2016) Acyclic and macrocyclic polypyrazoles: Coordination chemistry. LAP Lambert Academic Publishing, Saarbrücken
Bouabdallah I, M’barek LA, Zyad A, Ramadan A, Zidane I, Melhaoui A (2006) Anticancer effect of three pyrazole derivatives. Nat Prod Res 20:1024–1030
Janus SL, Magdif AZ, Erik BP, Claus NN (1999) Synthesis of triazenopyrazole derivativesas potential inhibitors of HIV-1. Monatsh Chem 130:1167–1174
Tewari AK, Mishra A (2001) Synthesis and anti-inflammatory activities of N4, N5-disubstituted-3-methyl-1H-pyrazolo [3, 4-c] pyridazines. Bioorg Med Chem 9:715–718
Wustrow DJ, Capiris T, Rubin R, Knobelsdorf JA, Akunne H, Davis MD, MacKenzie R, Pugsley TA, Zoski KT, Heffner TG (1998) Pyrazolo [1, 5-a] pyrimidine CRF-1 receptor antagonists. Bioorg Med Chem Lett 8:2067–2070
Pimerova EV, Voronina EV (2001) Antimicrobial activity of pyrazoles and pyridazines obtained by intreraction of 4-aryl-3-arylhydrazono-2, 4-dioxobutanoic acids and their esters with hydrazines. Pharm Chem J 35:602–604
Goldgur Y, Craigir R, Cohen GH, Fujiwara T, Yoshinaga T, Fujishita T, Sugimoto H, Endo T, Murai H, Davies DR (1999) Structure of the HIV-1 integrase catalytic domain complexed with an inhibitor: a platform for antiviral drug design. Proc Natl Acad Sci USA 96:13040–13043
Hazuda DJ, Felock P, Witmer M, Wolfe A, Stillmock K, Grobler JA, Espeseth A, Gabryelski L, Schleif W, Blau C (2000) Inhibitors of strand transfer that prevent integration and inhibit HIV-1 replication in cells. Science 287:646–650
Minassi A, Sanchez-Duffhues G, Collado JA, Munoz E (2013) Appendino G. Dissecting the pharmacophore of curcumin. Which structural element is critical for which action? J Nat Prod 76:1105–1112
Pluymers W, Pais G, Maele BV, Pannecouque C, Fikkert V, Burke JTR, de Clercq E, Witvrouw M, Neamati N, Debyser Z (2002) Inhibition of human immunodeficiency virus type 1 integration by diketo derivatives. Antimicrob Agents Chemother 46:3292–3297
Adams BK, Cai J, Armstrong J, Herold M, Lu YJ, Sun A, Snyder JP, Liotta DC, Jones DP (2005) EF24, a novel synthetic curcumin analog, induces apoptosis in cancer cells via a redox-dependent mechanism. Anti-Cancer Drug. 16:263–275
Tan KL, Ali A, Du Y, Fu H, Jin HX, Chin TM, Khan M, Go ML (2014) Synthesis and evaluation of bisbenzylidenedioxotetrahydrothiopranones as activators of endoplasmic reticulum (ER) stress signaling pathways and apoptotic cell death in acute promyelocytic leukemic cells. J Med Chem 57:5904–5918
Liang G, Shao L, Wang Y, Zhao C, Chu Y, Xiao J, Zhao Y, Li X, Yang S (2009) Exploration and synthesis of curcumin analogues with improved structural stability both in vitro and in vivo as cytotoxic agents. Bioorg Med Chem 17:2623–2631
Ishikawa Y, Fujii S (2011) Binding mode prediction and inhibitor design of anti-influenza virus diketo acids targeting metalloenzyme RNA polymerase by molecular docking. Bioinformation. 6:221–225
Anand P, Thomas SG, Kunnumakkara AB, Sundaram C, Harikumar KB, Sung B, Tharakan ST, Misra K, Priyadarsini IK, Rajasekharan KN (2008) Biological activities of curcumin and its analogues (Congeners) made by man and Mother Nature. Biochem Pharmacol 76:1590–1611
Liang G, Li X, Chen L, Yang S, Wu X, Studer E, Gurley E, Hylemon PB, Ye F, Li Y (2008) Synthesis and anti-inflammatory activities of mono-carbonyl analogues of curcumin. Bioorg Med Chem Lett 18:1525–1529
Hui YY, Shu HM, Hu HM, Song J, Yao HL, Yang XL, Wu QR, Yang ML, Xue GL (2010) Syntheses, structures and magnetic properties of tetranuclear and trinuclear nickel (II) complexes with β-diketone-functionalized pyridinecarboxylate ligand. Inorg Chim Acta 363:3238–3243
Verma PN, Juneja HD (2012) Synthesis and characterization of 1-(2′, 4′-dihydroxy-5-nitrophenyl)-3-(pyridin-3-yl)- propane-1, 3-dione and its metal complexes. J Chem Tech Res. 4:1000–1006
Radi S, Tighadouini S, Feron O, Riant O, Bouakka M, Benabbes R, Mabkhot YN (2015) Synthesis of novel β-Keto-enol derivatives tethered pyrazole, pyridine and furan as new potential antifungal and anti-breast cancer agents. Molecules 20:20189–20194
Tighadouini S, Radi S, Bacquet M, Degoutin S, Zaghrioui M, Jodeh S, Warad I (2017) Removal efficiency of Pb(II), Zn (II), Cd (II) and Cu (II) from aqueous solution and natural water by ketoenol–pyrazole receptor functionalized silica hybrid adsorbent. Sep Sci Technol 52:608–621
Radi S, Tighadouini S, Bacquet M, Degoutin S, Garcia Y (2016) New hybrid material based on a silica-immobilised conjugated β-ketoenol-bipyridine receptor and its excellent Cu (II) adsorption capacity. Anal Methods 8:6923–6931
Radi S, Tighadouini S, Bacquet M, Degoutin S, Dacquin JP, Eddike D, Tillard M, Mabkhot YN (2016) β-keto-enol tethered pyridine and thiophene: synthesis, crystal structure determination and its organic immobilization on silica for efficient solid-liquid extraction of heavy metals. Molecules 7:888–900
Radi S, Tighadouini S, El-Massaoudi M, Bacquet M, Degoutin S, Revel B, Mabkhot YN (2015) Thermodynamics and kinetics of heavy metals adsorption on silica particles chemically modified by conjugated β-ketoenol furan. J Chem Eng Data 60:2915–2925
Radi S, Tighadouini S, Bacquet M, Degoutin S, Revel B, Zaghrioui M (2015) Quantitative removal of Zn (II) from aqueous solution and natural water using new silica-immobilized ketoenol–pyridine receptor. J Env Chem Eng. 3:1769–1778
Radi S, Tighadouini S, Eddike D, Tillard M, Mabkhot YN (2017) Crystal structure of (Z)-1-(1, 5-dimethyl-1H-pyrazol-3-yl)-3-hydroxy-3-(4-methoxyphenyl) prop-2-en-1-one, C15H16N2O3. Z Kristallogr NCS. 232:199–200
Radi S, Tighadouini S, Eddike D, Tillard M, Mabkhot YN (2017) Crystal structure of (Z)-1-(1, 5-dimethyl-1H-pyrazol-3-yl)-3-hydroxy-3-phenylprop-2-en-1-one, C14H14N2O2. Z Kristallogr NCS. 232:201–202
Radi S, Tighadouini S, Eddike D, Tillard M, Mabkhot YN (2017) Crystal structure of (Z)-1-(1, 5-dimethyl-1H-pyrazol-3-yl)-3-(4-ethoxyphenyl)-3-hydroxyprop-2-en-1-one, C16H18N2O3. Z Kristallogr NCS. 232:207–208
Radi S, Tighadouini S, Eddike D, Tillard M, Mabkhot YN (2017) Crystal structure of (Z)-3-hydroxy-3-(4-methoxyphenyl)-1-(pyridin-2-yl)prop-2-en-1-one, C15H13NO3. Z Kristallogr NCS. 232:209–210
Radi S, Tighadouini S, Eddike D, Tillard M, Mabkhot YN (2017) Crystal structure of (Z)-3-hydroxy-3-(4-methoxyphenyl)-1-(pyridin-2-yl)prop-2-en-1-one, C15H13NO3. Z Kristallogr NCS. 232:235–236
Becke AD (1988) A multicenter numerical integration scheme for polyatomic molecules. J Chem Phys. 88:2547–2553
Lee C, Yang W, Parr RG (1988) Development of the Colle-Salvetti correlation-energy formula into a functional of the electron density. Phys Rev B. 37:785–789
Perdew JP, Wang Y (1992) Accurate and simple analytic representation of the electron-gas correlation energy. Phys Rev B. 45:13244–13249
Yang W, Parr RG (1985) Hardness, softness, and the fukui function in the electronic theory of metals and catalysis. Proc Natl Acad Sci USA 82:6723–6726
Weber J, Roch M, Williams AF (1986) Molecular electrostatic potentials and electron deformation densities of chromium(V), molybdenum(VI) and niobium(V) tetraperoxo complexes. Chem Phys Let. 123:246–253
Berger B (2013) Using conceptual density functional theory to rationalize regioselectivity: a case study on the nucleophilic ring-opening of activated aziridines. Comput Theor Chem. 1010:11–18
Khaled KF (2010) Experimental, density function theory calculations and molecular dynamics simulations to investigate the adsorption of some thiourea derivatives on iron surface in nitric acid solutions. Appl Surf Sci 256:6753–6763
Koubský T, Kalvoda L (2015) Application of ab initio molecular electronic structure calculations of radiolytic and hydrolytic stabilities of prospective extractants. J Radioanal Nucl Chem 304:227–235
Lakbaibi Z, Abou El Makarim H, Tabyaoui M, El Hajbi A (2014) Theoretical study of the formation of. α. -chloroglycidic esters in aliphatic series using the quantum DFT method with B3LYP/6-311G (d, p). Intern J Innov Appl Stud. 7:602–616
Cedillo A, Contreras R (2012) Stability and bonding in the borane-H2 complexes. J Mex Chem Soc 56:257–260
Domingo LR, Pérez P, Saez JA (2013) Understanding the local reactivity in polar organic reactions through electrophilic and nucleophilic Parr functions. RSC Adv. 3:1486–1494
Domingo LR, Ríos-Gutiérrez M, Pérez P (2016) Applications of the conceptual density functional theory indices to organic chemistry reactivity. Molecules 21:748–769
Thomson HW, Torkington P (1945) The vibrational spectra of esters and ketones. J Chem Soc 171:640–645
Snehalatha M, Ravikumar C, Joe IH, Sekar N, Jayakumar VS (2009) Spectroscopic analysis and DFT calculations of a food additive Carmoisine. Spectrochim Acta A. 72:654–662
Frisch MJ, Trucks GW, Schlegel HB, Scuseria GE, Robb MA, Cheeseman JR et al (2003) Gaussian 03, Revision E.01. Gaussian Inc., Pittsburgh
Carrod LP, Grady ED (1972) Antibiotics and chemotherapy, 3rd edn. Churchill Livingstone, Edinburgh, p 477
Neri F, Mari M, Brigati S (2006) Control of Penicillium expansum by plant volatile compounds. Plant Pathol 55:100–105
Sudha G, Priya MS, Shree RI, Vadivukkarasi S (2011) In vitro free radical scavenging activity of raw pepino fruit (Solanum muricatum aiton). Int J Curr Pharm Res. 3:137–140
Rigaku Oxford Diffraction (2015) CrysAlisPro software system, version 1.171.38.41. Rigaku Corporation, Oxford
Sheldrick GM (2013) SHELXS: A program for crystal structures solution; SHELXL: A program for refining crystal structures. University of Göttingen, Göttingen
Farrugia LJ (2012) ORTEP-3 for windows, an update. J Appl Crystallogr 45:849
Delley B (1990) An all-electron numerical method for solving the local density functional for polyatomic molecules. J Chem Phys. 92:508
Delley B (2000) From molecules to solids with the DMol3 approach. J Chem Phys. 113:7756
Authors’ contributions
ST, SR, KH and KK carried out of the experimental work and cooperated in the preparation of the manuscript. MT performed the density functional theory calculations. MT and DE determined the X-ray crystal structure. RB carried out the Biological activity. All authors read and approved the final manuscript.
Acknowledgements
The authors extend their appreciation to the PPR2-MESRSFC-CNRST-P10 project (Morocco) for its supporting this work.
Competing interests
The authors declare that they have no competing interests.
Availability of data and materials
All samples of the synthesized compounds as well as their data are available from the authors.
Consent for publication
Not applicable.
Ethics approval and consent to participate
Not applicable.
Funding
Not applicable.
Publisher’s Note
Springer Nature remains neutral with regard to jurisdictional claims in published maps and institutional affiliations.
Author information
Authors and Affiliations
Corresponding authors
Additional file
Additional file 1: Figure S1.
1H NMR spectrum of 1, Figure S2. 13C NMR spectrum of 1. Figure S3. 13C NMR-DEPTQ-135 spectrum of 1. Figure S4. Mass spectrum of 1. Figure S5. FT-IR spectrum of 1. Figure S6. UV-Vis spectrum of 1.
Rights and permissions
Open Access This article is distributed under the terms of the Creative Commons Attribution 4.0 International License (http://creativecommons.org/licenses/by/4.0/), which permits unrestricted use, distribution, and reproduction in any medium, provided you give appropriate credit to the original author(s) and the source, provide a link to the Creative Commons license, and indicate if changes were made. The Creative Commons Public Domain Dedication waiver (http://creativecommons.org/publicdomain/zero/1.0/) applies to the data made available in this article, unless otherwise stated.
About this article

Cite this article
Tighadouini, S., Benabbes, R., Tillard, M. et al. Synthesis, crystal structure, DFT studies and biological activity of (Z)-3-(3-bromophenyl)-1-(1,5-dimethyl-1H-pyrazol-3-yl)-3-hydroxyprop-2-en-1-one. Chemistry Central Journal 12, 122 (2018). https://doi.org/10.1186/s13065-018-0492-4
Received:
Accepted:
Published:
DOI: https://doi.org/10.1186/s13065-018-0492-4