
Abstract
Background
Despite its good salt-tolerance level, key genes and pathways involved with temporal salt response of common bermudagrass (Cynodon dactylon (L.) Pers.) have not been explored. Therefore, in this study, to understand the underlying regulatory mechanism following the different period of salt exposure, a comprehensive transcriptome analysis of the bermudagrass roots was conducted.
Results
The transcripts regulated after 1 h, 6 h, or 24 h of hydroponic exposure to 200 mM NaCl in the roots of bermudagrass were investigated. Dataset series analysis revealed 16 distinct temporal salt-responsive expression profiles. Enrichment analysis identified potentially important salt responsive genes belonging to specific categories, such as hormonal metabolism, secondary metabolism, misc., cell wall, transcription factors and genes encoded a series of transporters. Weighted gene co-expression network analysis (WGCNA) revealed that lavenderblush2 and brown4 modules were significantly positively correlated with the proline content and peroxidase activity and hub genes within these two modules were further determined. Besides, after 1 h of salt treatment, genes belonging to categories such as signalling receptor kinase, transcription factors, tetrapyrrole synthesis and lipid metabolism were immediately and exclusively up-enriched compared to the subsequent time points, which indicated fast-acting and immediate physiological responses. Genes involved in secondary metabolite biosynthesis such as simple phenols, glucosinolates, isoflavones and tocopherol biosynthesis were exclusively up-regulated after 24 h of salt treatment, suggesting a slightly slower reaction of metabolic adjustment.
Conclusion
Here, we revealed salt-responsive genes belonging to categories that were commonly or differentially expressed in short-term salt stress, suggesting possible adaptive salt response mechanisms in roots. Also, the distinctive salt-response pathways and potential salt-tolerant hub genes investigated can provide useful future references to explore the molecular mechanisms of bermudagrass.
Background
Soil salinity is a significant abiotic factor limiting plant growth and development. To mitigate salt-induced osmotic stress, ion toxicity and oxidative damage, plants have evolved a series of physiological and molecular response mechanisms [1,2,3]. Common bermudagrass (Cynodon dactylon (L.) Pers.) is a popular and extensively used turf species which can be spread by stolons, rhizomes, and seed [4, 5]. Despite having good salt tolerance level, there is a wide intraspecies variation. Thus, the growth and development of relatively sensitive cultivars could be seriously inhibited by salinity stress, greatly limiting the promotion and application of bermudagrass in saline soils [6, 7]. Therefore, an in-depth analysis of salt tolerance mechanism and mining key response genes and pathways will contribute to its application in saline environments.
In plants, salt stress triggers a genome-wide transcriptomic reprogramming to response to this environmental stimuli. As a result, groups of genes related to many physiological traits and salt-response pathways are regulated to alleviate the adverse effects, making salt response to be a complex quantitative trait [1, 8]. Immediately after plants perceive salt stress signal from the environment, multiple signal transduction pathways can be rapidly activated [9, 10] and an elevation in the calcium ion (Ca2+) concentration is among the first response to external stimuli [11]. To cope with the stress, the action of stimuli Ca2+ sensors (e.g., CBLs: calcineurin B-like proteins; CIPKs: Ca2+-independent protein kinases; CDPKs: Ca2+-dependent protein kinases; CMLs: calmodulin-like proteins) [11] precedes a chain of reactions such as the SOS (salt overly-sensitive) and MAPK (mitogen-activated protein kinase) pathways [12,13,14]. Along Ca2+ signalling, other second messengers such as ROS (reactive oxygen species) are also participated [3]. Although ROS can function as signalling molecules in response to environmental cues [2, 15], its excessive accumulation can result in cell oxidative damage [16]. To curb ROS-induced oxidative damage, plants have evolved a complex scavenging system consisting of antioxidants enzyme (e.g. superoxide dismutase, SOD; peroxidase, POD; catalase, CAT) and non-enzymatic scavengers (e.g. tocopherols; carotenoids; phenols) have been developed to scavenge excessively produced ROS and protect themselves from salt-induced oxidative stress [17, 18]. Also, the phytohormones-mediated signalling pathways (e.g. auxin; abscisic acid, ABA; jasmonic acid, JA; cytokinin, CTK; gibberellin, GA; ethylene, ETH) also play key roles in the adaptive growth of plants after environmental stimulation [19].
To further protect plants from damage, activated cascades such as Ca2+, ROS, and hormone signaling cascades can further activate other regulators like transcription factors (TFs) (e.g. ABA-responsive element-binding protein/ABA-binding factor, ABRE/ABF) [20] to regulate other downstream salt response genes. For instance, genes regulating levels of osmoprotectants are reported to be the first stress-inducible transcripts during initial response to initial osmotic stress. The intracellular concentrations of osmolytes such as proline, soluble sugar and dehydrins are elevated to improve cellular osmotic pressure [2, 21]. After prolonged exposure to salt stress, other strategies are adopted to mitigate Na+ toxicity (24 h or beyond), for example, the ion transporters such as HKT (high-affinity K+ transporter) and NHX (Na+/H+ antiporters) gene families could be regulated to further sequester or compartmentalize excess Na+ in the vacuole with a higher cytosolic K+/Na+ and resist to salt stress in glycophytes [22, 23]. In soybean, after treated for 24 h or beyond, the seedlings entered a new physiological state with lower photosynthetic rates and stomatal conductance, followed by the accumulation of Na+ in the leaf that could be detrimental to the plants. Therefore, 24 h might be a turning point at which salt response strategy might begin to change in many plants [24].
Under excessive salt exposure, roots are the first organs to detect the stress and likely to suffer more damage due to their closer proximity compared to the shoots [25, 26]. As a result, roots perceive an early-onset osmotic stress and respond. Subsequently, these initial reactions can be passed on to the whole plant [2]. This makes roots to be ideal for providing a sensitive target to study the molecular mechanisms underlying plant salt tolerance and adaptation [27]. In other species, several salt-responsive transcriptomic studies in the roots have been done so far [24, 28, 29]. In bermudagrass roots, using two cultivars with contrasting salt tolerance level, a transcriptome analysis was performed after 7 days of salt stress [30]. However, transcriptomic studies in the roots of bermudagrass that involve in early salt response among multi-time points have not been explored. Taking in consideration these temporal dynamic changes when evaluating a plant’s response to a stress factor could provide a more systematic analysis in the expression profiles [25, 28, 29]. In this study, we investigated and compared gene expression reprogramming under short-term salt stress to investigate the shared and exclusive response patterns and expression connections of salt response genes in the roots of bermudagrass. Some key regulatory pathways, gene families and hub genes induced during the early stages of salt stress imposition were identified. These results could give an overview of the early-salt response transcription map and provide more useful information for further study of the salt response of bermudagrass.
Results
Effect of salt stress on the physiological parameters of bermudagrass roots
To study the early salt response in the roots of bermudagrass, the plants were treated with 200 mM NaCl for 1 h, 6 h and 24 h respectively. The roots samples were collected for physiological parameters determination and transcriptome analysis. Due to a relatively shorter exposure time to salt stress, the growth parameters such as plant height, shoot biomass and root length were not significantly affected (data not shown). However, physiologically, the roots of 24 h salt-treated plants displayed higher malondialdehyde (MDA) content than control plants (Fig. 1a). The POD activity was significantly elevated in the roots of 1 h and 6 h salt-treated plants compared to that in their respective control regimes (Fig. 1b). The SOD activity of 1 h and 6 h salt-treated roots showed an upward trend, but the increase was not significant compared to their respective control plants (Fig. 1c). Besides, salt stress induced a higher proline accumulation of roots compared to non-salinity conditions (Fig. 1d). The accumulation of these metabolites indicated that the roots of plants were experiencing salt stress and producing a stress response at the time when used for transcriptome analysis.

Physiological parameters of bermudagrass roots grown under control and salt conditions. The uniform stolons were planted in growth media for one month, and the plants mowed to the same height were then transferred into CK (0 mM NaCl) and salt stress (200 mM NaCl) conditions for 1 h, 6 h or 24 h in a hydroponic culture. The MDA content (a), POD activity (b), SOD activity (c) and proline content (d) were measured. Data are means ± SD of three independent experiments; * indicate statistically significant difference between control and salt stress under certain time point at P < 0.05 by Student’s t–test
General transcriptomic responses and expression profiles of differential expression genes in the roots of bermudagrass
Totally 695,542 transcripts and 694,799 unigenes with an N50 of 1391 bp were obtained. Gene expression analysis showed that the expression of 58,979 genes was significantly altered in response to salt stress at one or more time points. The Venn diagram indicated that 229 genes were up-regulated while 764 genes were down-regulated at all the three-time points (Fig. 2a, b). Among the up-regulated genes under salt stress, 3812, 2670, and 1258 genes were exclusively expressed in 1 h, 6 h and 24 h respectively (Fig. 2a). Among the down-regulated genes, the expression of 31,409 genes was regulated specifically at 1 h; the expression of 6538 genes was modulated only at 6 h whereas the expression of 3054 genes was exclusive for 24 h (Fig. 2b; Table S1). Overall, most of the responsive genes showed down-regulated expression by NaCl at all the three-time points, respectively (Fig. 2c). Also, the number of differentially expressed genes (DEGs) after 1 h salt treatment was relatively more than the number after 6 h and 24 h-salt treated (Fig. 2c, d).

Summary of different expression genes after salt exposure at different time point. Venn diagram showing the overlap of up-regulated genes (a) and down-regulated genes (b) at various time points (1 h, 6 h, 24 h). The numbers of DEGs exclusively expressed in one sample are shown in each circle. The numbers of DEGs with a common tendency of expression changes between the two treatments are shown in the overlapping regions. (S1_R_salt, NaCl treated for 1 h; CK1_Control, without NaCl treated for 1 h; S6_R_salt, NaCl treated for 6 h; CK6_Control, without NaCl treated for 6 h; S24_R_salt, NaCl treated for 24 h; CK1_Control, without NaCl treated for 24 h). c The number DEGs under different time points. d A heatmap of the relative expression levels of of DEGs under different time point
To detect the expression pattern of DEGs, the STEM (Short Time-series Expression Miner) software package (Table S1) was used and 16 distinct temporal expression patterns were identified (Fig. 3). The predominant profiles indicated that, following salt treatment, the expression pattern of the most DEGs changed rapidly within the first 1 h following salt treatment (Fig. 3). Some genes expression peaked (repression or induction) at 1 h (Fig. 3e, i, o) while other groups of genes peaked at 6 h (Fig. 3d, g) or 24 h respectively (Fig. 3b, j, l, m, p). Some genes responded at 1 h continued along the same trajectory at the subsequent time points (Fig. 3b, m) or reverted to untreated state levels (Fig. 3i, o). Some genes were induced at 1 h and persisted (Fig. 3e, f). Other genes displayed slight changes until 24 h (Fig. 3l, p). Also, as compared to 1 h or 24 h, some genes displayed converse patterns of induction and repression at 6 h (Fig. 3c, n). Moderate responses of some genes were observed at 1 h and 6 h and showed a slight response at 24 h (Fig. 3h, k). Still other genes repressed at 1 h were slightly repressed at 6 h and reached a highly suppressed expression at 24 h (Fig. 3a). These gene expression profiles indicated that there might be a time-specific response pattern in the roots of bermudagrass.

Different expression genes grouped according to temporal expression profiles using STEM software. DEGs were mainly divided into 16 distinct temporal profiles. Each of the profiles (a-p) is represented as a different plot, with ratios log2 Fold change (S vs CK) for each of the assigned transcripts at each time point
Functional categorization of deferentially expressed genes
To understand the transcript pattern changes of genes belonging to different categories, and to detect the existence of differently expressed genes, PageMan analysis was then used to analyse the relationship between the enriched transcripts of different response time points and their biological significance. Results showed that bins involved in major metabolism (2), cell wall (10), secondary metabolism (16), hormone metabolism (17), stress (20), misc. (26), development (bin 33) and transport (34) were all up-enriched (Fig. 4a-f; Table S2) while the DNA (28), protein (29), energy-related (8: TCA/org transformation; 9: mitochondrial electron transport/ATP synthesis) and cell (31) related bins showed significant depletion of up-regulated genes under salt stress at all three time points (Fig. S1; Table S2). These consistently and continuously up-regulated gene categories mainly included genes that participated in ABA synthesis and signaling transduction (e.g. 9-cis-epoxycarotenoid dioxygenase, NCED; protein phosphatase 2C, PP2C; ABRE binding factors, ABFs) (Fig. 5a), transcription factors (e.g. members of HB, MYB and bZip) (Fig. 5b), several groups of transporters (Fig. 5d) (e.g. transporters of sugars, amino acids, peptides and oligopeptides; ABC transporters; multidrug resistance systems; major intrinsic proteins.PIP), genes regulating levels of osmoprotectants (e.g. S-adenosylmethionine decarboxylase; galactinol synthases; raffinose sythases; trehalose; callose; galactose), transcripts that encode antioxidant enzymes (e.g. peroxidase), genes involved in oxidases stress, such as oxidases-copper, glutathione S transferases, beta 1,3 glucan hydrolases, plastocyanin-like proteins) and other proteins (e.g. the late embryogenesis abundant proteins and AWPM-19-like membrane family proteins participated in osmotic stress response; genes involved in phenylpropanoids, carotenoids, flavonoids and polyamine metabolism such as 4-coumarate--CoA ligase 1 (4CL-like), peroxidase 1, phytoene synthase gene (PSY3) and 2-oxoglutarate (2OG) and Fe(II)-dependent oxygenase superfamily protein) (Fig. S2a; Table S1). Although the protein synthesis and amino acid activation sub bins showed significant depletion of up-regulated genes under all three time points, the protein modification sub-bin significantly enriched the up-regulated genes (e.g. members of PP2C, HAB, HAI, WIN, CIPK family) (Fig. 5c). However, genes involved in protein translational modification such as kinase and ubiquitination pathway-related genes were up-regulated (Fig. S3).

PageMan display of coordinated changes of selected gene categories activated by salt exposure. a Hormone metabolism, b Secondary metabolism, c Transport, d Misc, e Stress, f Cell wall. The log2 Fold change of SvsCK1h (left column), SvsCK6h (middle column) and SvsCK24h (right column) were subjected to over-representation analysis. Colour scale is: red, significant enrichment of up-regulated genes; blue, significant depletion of up-regulated genes. The complete analysis and its display are provided in Supplemental Fig. S6 and Table S2

Expression of selected co-upregulated genes after salt stress displayed by Heatmap diagram. a Members of ABA metabolism-related gene. b Transcription regulators. c Protein modification-related genes. d Transporters. SvsCK1h (left column), SvsCK6h (middle column) and SvsCK24h (right column)
Salt responsive genes categories at different time points
Salt treatment triggered exclusive response at different time points (Table S2). For instance, the receptor-like kinase sub-bin (30.2) involved in signaling bin (30) was specifically over-represented immediately after salt exposure for 1 h (Table S2; Fig. S4a), including receptors such as leucine-rich repeat (LRR V, VIII and XII), thaumatin-like, Catharanthus roseus-like RLK1, domain of unknown function (DUF) 26, legume-lectin domain (LLD), LRK10 like; lysine motif, proline extension-like (PERK), S-locus glycoprotein like and wall-associated receptor kinase (WAK). Some calcium signaling-related genes were specifically up-regulated immediately after the roots were exposed to salt for 1 h (e.g. calcium-dependent protein kinase, CDPK11; Calmodulin, CAM3; calmodulin-domain protein kinase, CPK5; calmodulin-like, CML43). A mitogen-activated protein kinase MAPK2 (cluster-342,212.26954), which is a homolog to At2g43790 was also up-regulated exclusively at 1 h (Fig.S2b). Sub bins involved in hormone metabolism (17) such as JA synthesis-degradation (17.7.1) and signal transduction (17.7.2), CTK metabolism (17.4) and ETH metabolism (17.5) were specifically induced at 1 h (Table S2; Fig. 4a). Genes that participated in ETH biosynthesis (one ACC synthase and four ACC oxidase), ethylene signal transduction (three ERF and one DREB), JA biosynthesis (one allene oxide synthase, AOS1; one allene oxide cyclase, AOC4), JA signal transduction (JAZ1) and CTK metabolism degradation (five UDP-glucosyl transferase and nine cytokinin oxidase) were significantly up-regulated under 1 h salt treatment, indicating that these hormones could be involved with early response to salt stress in the roots of bermudagrass (Table S2, Fig. 4a). In addition, a series of TFs sub bins (e.g. ARF: 27.3.4; ARR: 27.3.12; C3H: 27.3.5; NAC: 27.3.27; Trihelix: 27.3.30; AS2: 27.3.37; JUMONJI: 27.3.57; PHOR1: 27.3.64; Psudo ARR: 27.3.68) were over-represented after 1 h salt treatment compared to the later time points, implying that these TFs might be exclusively involved in early salt response in the roots of bermudagrass (Table S2; Fig. S5). Other genes were also exclusively expressed at 1 h, including several groups of transporters (e.G. major intrinsic proteins NIP, PIP); stress response molecules (e.g. typsin inhibitor, PR proteins, MLO-like receptors), lipid metabolism (e.g. choline kinase) (Table S2).
More map-bins enriched by PageMan were found exclusively over-represented after plants were exposed to salt for 1 h compared to the latter two-time points (16 at 1 h, 10 at 6 h and 11 at 24 h respectively) (Fig. S6). These included bins of tetrapyrrole synthesis (19) (Fig. S4c), biodegradation of xenobiotics (24) (Fig. S4e), lipid metabolism (11) (Fig. S4b), suggesting a relative earlier response to salt (Fig. S4). However, the polyamine synthesis sub-bin was over-represented only after 6 h and 24 h salt treatments (Fig. S6). In the secondary metabolism bin, the sub bins related to isoprenoid, phenylpropanoid and flavonoids metabolism were presented upregulated at all the three-time points of salt exposure. However, some sub-bins included in secondary metabolism (16) such as simple phenol (16.10), glucosinolates (16.5.1), isoflavones (16.8.5) and tocopherol biosynthesis (16.1.3) (Table S2) were exclusively over-represented at 24 h (Fig. 4b), indicating a slightly delayed response to salt. These results revealed that regulators or effectors involved in different salt-responsive categories might be active at different time point following the perception of salt stress.
Coexpression network analysis and hub gene investigating by WGCNA
WGCNA was further performed to identify the specific genes that are highly associated with salt response in the roots of bermudagrass (Table. S4). Based on pairwise correlations analysis of gene expression, fifteen network modules in the co-expression network, designated darkviolet, lightpink3, coral, skyblue3, coral1, lavenderblush1, mediumpurple1, lavenderblush2, pink4, brown4, honeydew, darkolivegreen, antiquewhite2, firebrick4 and grey were identified (Fig. 6a, b). Investigating the relationships between salt response physiological indexes (proline\POD\SOD) and module eigengenes revealed that the correlation coefficients value varied from − 0.67 to 0.70 in proline, from − 0.55 to 0.70 in POD and from − 0.55 to 0.70 in SOD (Fig. 6b). At the p value < 0.05 level, four modules were associated with proline content, while five modules with POD and two modules with SOD. The eigengenes of lavenderblush2 and brown4 modules showed significant positive correlations (p < 0.01) with proline and POD, suggesting these two modules might have greater relevance in salt response (Fig. 6b). Further, the lavenderblush2 and brown4 modules, representing 882 and 438 genes respectively, were visualized with the Cytoscape software. The top three hub genes of brown4 co-expression network contained one homologue of hypothetical protein MTR_3g035650 from Medicago truncatula (Cluster-342,212.125010), one hypothetical mitochondrion protein homolog to AGC78945.1 from Vicia faba (Cluster-342,212.139315) and one classical transcription factor HSF (cluster-342,212.125010) (Fig. 6c; Table S4). The top three hub genes of lavenderblush2 co-expression network visualized by Cytoscape contained one gene encoding β-amylase (Cluster-342,212.182369) which belong to glycosyl hydrolase family 14 (Fig. 6d; Table S4). However, the other hub genes of these two modules were not annotated.

Weighted gene co-expression network analysis of salt-related physiological indicators associated genes. a Fifteen modules of co-expressed genes showed on Hierarchical cluster tree. A leaf represents each of the DEGs and a major tree branch represents each of the fifteen modules. Modules in designated colours. The modules in designated colours were shown in lower panel. b Correlation between gene expression modules and physiological parameters (proline, POD and SOD) in the whole co-expression gene network. The left panel shows fifteen modules. The correlation value and the p value were shown within each cell. The right panel is a colour scale for module trait correlation from − 1 to 1. Visualization of key co-expression network lavenderblush2 module (c) and brown4 (d) module by Cytoscape. Key hub genes identified by WGCNA indicated by larger and red circles
RT-qPCR validation of selected deferentially expressed hub genes
Because hub genes were investigated based on the relationship between FPKM of genes and the physiological parameters, the accuracy of FPKM value of these hub genes in the transcriptome data should be confirmed. The expression levels of eight hub genes with different expression pattern (Fig. 7) from two WGCNA modules lavenderblush2 and brown4 were further determined by RT-qPCR analysis (Fig. S7; Table. S5). The expression profiles of top three hub genes from the module lavenderblush2 showed an induced expression after 1 h salt stress but a decreased expression or no obvious alteration at the latter time points (Fig. 7a-c; Fig. S7a-c). The expression of top five hub genes from the module brown4 showed a significant induction at all the three-time points under salt exposure (Fig. 7d-h; S7d-h). The expression patterns of these selected hub genes verified by RT-qPCR and their FPKM values from the transcriptome showed a consistent trend under the corresponding treatments. These results not only confirmed the differential response pattern of these hub genes from different modules but also confirmed the reliability of the transcriptome data.
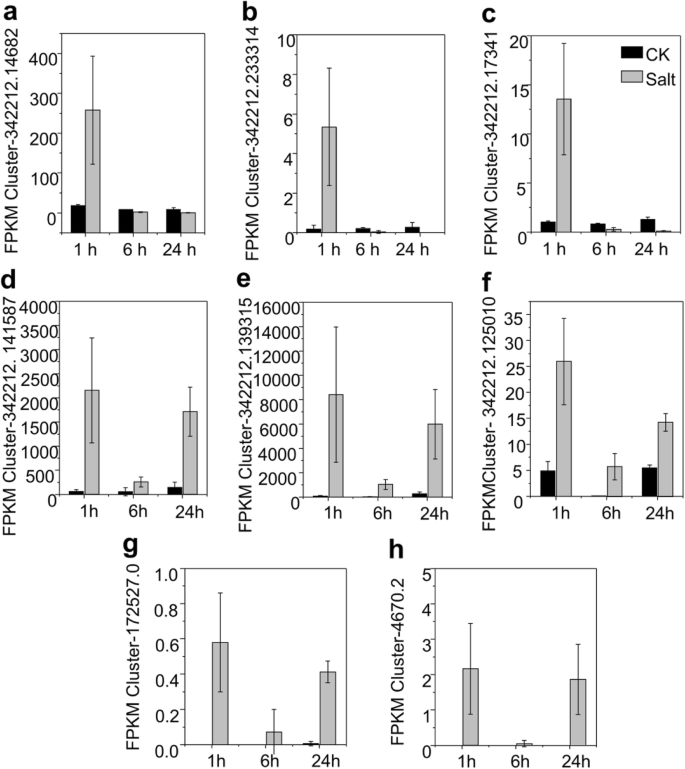
Transcript abundance of hub genes in the lavenderblush2 and brown4 modules. a-c, Hub genes from lavenderblush2 module. d-h, Hub genes from brown4 module. Transcript abundance is presented as the mean ± SE of FPKM values, n = 3 at each time point
Discussion
Time-specific quick salt response modules in the roots of bermudagrass
Previous transcriptome analysis of plants reveals differential response strategy at different stages of salt stress [31, 32]. For instance, plants response to the initial osmotic stress by increasing the intracellular concentrations of osmolytes [2]. After NaCl exposure for 24 to 72 h, alleviating Na+ toxicity raises to a more urgent task [23, 24]. To investigate the transcriptome adjustments of bermudagrass roots to the salt shock in the early phase, 1 h was firstly chosen to study the immediate salt response. We next chose 6 h as a treat time point to investigate the immediate following reaction after the earliest response to salt (1 h) based on the previous study showing that soybean faced to an initial osmotic stress stage in 1 h to 4 h after salt treatment [2]. Moreover, 24 h was still chosen to investigate if the salt response strategy begins to change in bermudagrass because 24 h might be a turning point at which the salt response strategy might begin to change in some plants [23, 24].
In bermudagrass, about 2.4 and 6 times more specific salt-responsive genes derived from different gene categories were differentially regulated in the roots exposed to salt for 1 h compared to those exposed to salt for 6 h or 24 h respectively, suggesting a quick response after salt exposure (Fig. 3). For example, several signal receptors like kinases (e.g. LRR, thaumatin-like, RLK1, DUF26, LLD, LRK10 like, PERK, and WAK) were detected immediately and exclusively up-regulated at 1 h (Fig. S4a). These signal receptors kinases always response at an earlier time point to function in protein phosphorylation and modification, which is an important step in initiating salt response signalling pathways and ultimately leading to a transcriptional regulation [33,34,35,36,37]. Moreover, the salt signal could also immediately trigger the downstream hormones pathways, which are known to be involved in stress responses in a wide range [19, 38]. In this study, genes involved with ABA biosynthesis and signal transduction sub-bins (17.1.1, 17.1.2, 17.1.3) were consistently up-enriched at all three-time points (e.g. NCED; PP2C and ABFs) (Fig. 5a), suggesting the established role to salt response [9]. However, we also noticed that transcripts involved in the metabolism of biosynthesis and signal transduction of ETH (e.g. ACC synthase; ACC oxidase and ERF) and JA (e.g. AOS1 and AOC4), were exclusively over-represented at 1 h of salt exposure (Fig. 4a; Table S2), indicating that these salt responsive hormones metabolism pathways might participate in the quick salt response progress in the roots of bermudagrass [32, 39, 40]. In addition, the induction of transcripts involved in CTK and GA degradation was noticed (Fig. 4a; Table S2). Transcripts encoding gibberellin-degrading enzyme gibberellin 2-oxidase (homologs of At4g21200 and At1g75450 respectively) suggested the cell growth were partly inhibited to survive under environmental salt stress. The expression of at least 9 transcripts of AtCKX6 (At1g75450) homologs were regulated (Table S2), which encoding a cytokinin oxidase/dehydrogenase that participates in catalysing the degradation of cytokines [41, 42]. These results suggested that hormone signaling does not work alone while mediating salt response but might function in multifarious crosstalk network with other hormones.
Intracellular phosphorylation events are downstream of secondary messengers, such as CDPKs [9,10,11,12,13,14] and MAPK cascades [43,44,45], which are reported to be essential sensor-transducers in plants. In this study, some gene members involved in calcium signaling responded immediately after salt exposure for 1 h (e.g. CDPK11, CAM3, CPK5 and CML43) (Fig. S4a; Table S2). Some calcium-transporting ATPase encoding genes were specifically over-represented at 1 h, which could further promote the transmembrane transport of Ca2+ (Table S2). A MAPK2 gene (cluster-342,212.26954), which is a homolog to At2g43790 was also up-regulated exclusively at 1 h (Fig. S2b) and might interplay with ROS and hormone in salt response [46, 47]. The immediate up-regulation of these protein kinases encoding genes might further trigger downstream transcriptome reconfiguration to cope with the stressful salt condition [48].
In the roots of bermudagrass, we also identified over ten transcription factor families, which were significantly induced at one or more time points after salt exposure (Fig. S5). The induced TFs number was much more at 1 h than latter time points. Among those TFs, AP2, WRKY, bHLH and HB families accounted for a large ratio of the total number of salt-induced TFs identified and the three families (MYB, HB, bZip) were significantly induced at all three time points (Fig. 5b; Table S2). One HSF transcription factor was investigated as a hub gene of brown4 co-expression network in this study (Fig. 6d). The expression of this HSF transcription factor showed up-regulated by salt at all three time points and it could be a good target for future studies (Fig. 7f; S7). Consistent with the previous studies that WRKY TFs could positively or negatively participate in salt tolerance [49], we also observed that 20 of the 23 WRKY TFs detected significantly induced in response to 1 h salt treatment in the roots (Fig. S5; Table S2). The AP2/EREBP family was also reported to include some stress-responsive TFs [50]. We also observed that 16 of 17 AP2 transcripts were up-regulated after 1 h salt treatment (Table S2). Under salt stress, another most affected TF family in the roots was bHLH, with 24 of 28 transcripts being induced at 1 h and 10 of 19 were increased at 6 h by salt stress (Table S2). Among these induced bHLH TFs, some important members which have been reported to positively participate in salt stress response such as bHLH92 [51]. The Aux/IAA families were significantly enriched in salt-responsive transcripts especially at 1 h with all 12 transcripts all up-regulated by salt stress (e.g. IAA5, 12, 20, 24, 18, 23) (Table S2). These salt response Aux/IAA genes have a central role in auxin response and might act to integrate the signal from environmental stimuli into the auxin-related gene regulatory network [52]. Therefore, here, we noticed that some biological processes responded at the early stage of salt stress, mainly including signal transduction, hormone metabolism and regulation of TFs. These quick responses might then form a cascade to active a series of downstream response factors.
Common and distinctive positive salt response mechanisms in the roots of bermudagrass
Plants have evolved diverse gene families to detoxify ROS caused by harsh environments such as salt [19, 20]. In our study, the POD activity was significantly higher in the roots of 1 h and 6 h salt-treated plants compared to that in their respective control roots (Fig. 1b). However, the SOD activity of 1 h and 6 h salt-treated roots showed an upward trend, but the increase was not significant compared to their respective control plants (Fig. 1c). Accordingly, a few members of POD encoding genes were up-regulated but SOD encoding genes were not up-regulated in our transcriptome data (Fig. 4d; Table S2). Because oxidative stress is a consequence of the deterioration of lipid peroxidation (indicated by MDA) brought about by ROS, we also measured the MDA content in the roots. However, the roots MDA content displayed a higher value than control plants until exposed to salt for 24 h (Fig. 1a), suggesting a progressive accumulation with the increased treatment time. Other members of gene families encoding oxidases-copper, glutathione S transferases, beta 1,3 glucan hydrolases, UDP glucosyl and glucoronyl transferases, plastocyanin-like proteins (Fig. 4d; Table S2) were also up-regulated at one or more time points to cope with the salt stress. For example, UDP glucosyl transferases UGT79B2/B3 in Arabidopsis was reported to contribute abiotic stress tolerance such as salt and drought via affecting anthocyanin accumulation and enhancing ROS scavenging [53]. Consistent with the previous studies in plants, some bioactive secondary metabolites in the roots of bermudagrass (e.g. carotenoids, tocopherols and flavonoids) [54,55,56] were also over-represented under salt and might also serve as ROS scavengers (Fig. 4b; Table S2). As expected, the genes regulating osmoprotectants levels were also highly upregulated in this study. They included genes encoding galactinol synthases, raffinose synthase, trehalose, callose and galactose (Fig. S4d), which were reported to be the first stress-inducible genes under salt stress [23,24,25,26].
The plant cell wall consists of cellulose, hemicellulose, lignin, pectin and many glycoproteins [57, 58] and is considered to be an important factor to sense and response to salt stress. We also noticed that genes involved in cellulose synthase (10.2), hemicellulose synthesis (10.3) and lignin synthesis (16.2.1) were over-represented in the salt-treated roots of bermudagrass (Fig. 4f). The expression of glycoside hydrolase (GH17) family genes was significantly induced under 1 h of salt stress (Fig. 4d; Table S2), suggesting it may participate in the post-translational modifications of cell wall-related proteins and lead to the alteration of cell wall flexibility [59, 60]. In addition, other cell-wall related gene families which function in cell wall extensibility were also showed differential regulation in salt responsive transcripts. For example, the expression of MUR4 was found up-regulated in the roots of bermudagrass (Fig. 4f), and was reported to function in the biosynthesis of UDP-arabinose. Mutation in MUR4 affects cell wall integrity and leads to an defective cell-cell adhesion with a reduced root elongation under high salinity [61]. Moreover, several AGPs (arabinogalactan proteins) encoding genes were found up-regulated by salt at the transcript level in our study (Fig. 4f). The AGPs on cell walls or plasma membranes are also reported to be associated with cell growth [62, 63] and one AGP (SOS5) was known to contribute to salt tolerance in Arabdiopsis [64]. We further noticed an earlier response of lipid metabolism in the roots of bermudagrass. In particular, the expression of genes involved in FA synthesis and elongation were down-regulated while genes involved in FA desaturation and lipid degradation were significantly up-regulated immediately when exposed to salt for 1 h (Fig. S4b). Studies have shown that FA desaturases play an important role in the maintenance of the biological function of membranes in plant cells under different conditions including salt stress [65, 66]. Here, salt stress markedly changed the expression of genes encoding ω-3 FA desaturases which might lead to an alteration of FA composition (Fig. S4b, Table S2). The immediate regulation of genes coding for a recombination of lipid composition can provide novel insights to improve salt tolerance of bermudagrass.
Other than secondary metabolisms-related genes which significantly participated in cell wall modification (Fig. 4f), some important secondary metabolism pathways were significantly induced at a prolonged time point, suggesting slightly slower reactions that may involve metabolic adjustment [67, 68]. For example, the polyamine synthesis sub-bin was over-represented only after 6 h and 24 h salt treatments. Some sub-bins included in secondary metabolism such as simple phenol, glucosinolates, isoflavones and tocopherol biosynthesis were specifically over-represented at 24 h (Fig. 4b; Table S2). These secondary metabolisms were previously reported to be involved in plants oxidative response in some species [67, 68]. For example, the expression of laccase encoding genes was found up-regulated especially when exposed to salt for 24 h, which might participate in the oxidation and reduction of simple phenols in the roots of bermudagrass and alleviate the oxidize stress caused by salt stress [69, 70].
Categories of down-regulated genes by salt stress in the roots of bermudagrass
In this study, down-regulated genes were more abundant at all three time points respectively (Fig. 2c), suggesting an impact of the huge negative regulation of transcription on plant metabolism and functioning. Actually, important enriched gene categories such as hormone metabolism, transcription factors, misc. and secondary metabolism also contained large number of down-regulated genes (Table S2). For instance, genes involved in brassinosteroid synthesis or degradation (e.g. CYP450 family members) and signal transduction (e.g. BRI) were significantly down-regulated by salt stress (Table S2), suggesting an interaction of hormones to participate in salt response in bermudagrass [71]. Although a series of TF families showed up-regulation, other TF families such as C2H2 and HAP showed a large number down-regulated genes at one or more time points (Table S2). HAP transcription factor AtHAP3b and C2H2 protein Zat7 were previously reported to play key roles in primary root elongation to promote drought tolerance and in salt resistance in Arabidopsis, respectively [72, 73].
In previous proteomic studies, NaCl treatment decreased protein translation, which is consistent with the downregulation of most ribosomal proteins related transcripts in this study (Fig. S3; Table S2) [27, 74]. We also noticed that the number of DEGs after 1 h salt treatment was relatively higher than the number after 6 h and 24 h salt treated (Fig. 2c, d). More ribosomal proteins encoding genes and protein metabolism related genes also were significant over-represented in down-regulated genes immediately after exposed to salt for 1 h, suggesting that more genes involved in protein or amino acid metabolism were quickly and negatively regulated. Genes involved in protein translational modification such as kinase and ubiquitination pathways were up-regulated (Fig. S3). Notably, the majority of E3 RING and E3 SCF proteins related genes were significantly induced by salt stress (Fig. S3; Table S2), suggesting that these enzymes may function in ways that might be independent on the 26S proteasome during salt response [75]. The inhibited protein synthesis and enhanced protein degradation might hike the concentration of free amino acid, especially proline, which can act as an osmotic protective substance. In this study, the proline content in the roots of bermudagrass was significantly induced after NaCl exposure (Fig. 1d). These free amino acids could further initiate synthesis of dehydrin or polyamine, which might function in the maintenance of the structure of the protein and cell membrane under salt [2]. However, proline synthetic related category was not significantly over-represented, suggesting that genes involved in proline metabolism might not receive significant transcriptional regulation at all treat time points in this study.
Moreover, salt stress downregulated the expression of genes involved in tricarboxylic acid cycle (TCA), which is the main respiratory pathway in aerobe organisms (Fig. S1a; Table S2). For example, genes encoding pyruvate dehydrogenases, which function in the conversion of pyruvate to acetyl-CoA and thereby links the glycolytic pathway to the TCA cycle, were enriched among down-regulated gene categories (Fig. S1a; Table S2). Also, genes encoding the mitochondrial electron transport chain components such as NAD(P)H dehydrogenases and F1-ATPase were also exclusively enriched among down-regulated gene categories (Fig. S1b; Table S2). This suggests that the mitochondria might be damaged by oxidative stress. Also, we noticed that genes involved in DNA synthesis and cell organization were down-regulated especially at 1 h and 6 h (Fig. S1c, 1d). These gene categories might function together to save energies and materials to maintain plants growth and development under salt stress. A proposed model of key categories of genes positively and negatively affected by salt stress in the roots of bermudagrass was provided (Fig. 8). Generally, genes belonging to signaling pathways, involved in signal perception and transduction, such as signaling receptor kinase, hormone, and signal pathways, respond immediately after NaCl exposure. The transcription factors that respond at an earlier time point further positively or negatively regulate the downstream response genes. In these salt-responsive gene categories, some categories such as lipid metabolism and protein synthesis respond much earlier while other categories involved in secondary metabolite biosynthesis respond at latter time point [26, 76].

A proposed model of key gene categories significantly affected by salt in the roots of bermudagrass. Red arrows indicated the main negatively affected gene categories after salt stress and green arrows indicated some positively regulated gene categories. The blue arrow indicated the time course of salt response from signal perception and transduction to later salt response
Conclusions
Here, to understand the underlying regulatory mechanism following salt exposure in bermudagrass roots, a comprehensive transcriptome analysis was conducted. Groups of important salt response gene categories were identified. In addition, the distinctive salt-response pathways, time-specific response and potential hub genes investigated in this study can provide useful references to further study the salt response mechanism of bermudagrass in depth.
Methods
Plant materials and growth conditions
Bermudagrass accession ‘A12359’ (provided by Dr. Yanqi Wu in Oklahoma State University) was used in this study. Uniform stolons (ten stolons per pot) were planted in pots filled with sand for about 1 month. The plants were irrigated by Hoagland’s solution every 2 days. The roots of the plants were washed clean and transferred into a hydroponic culture with Hoagland’s solution for about 1 week to make the plants to adapt. Before treatments, the plants were mowed to the uniform height and transferred into a hydroponic culture consisting of CK (Hogland solution with 0 mM NaCl) and salt stress (Hogland solution with 200 mM NaCl) conditions. The plants were then treated for 1 h, 6 h and 24 h respectively. Each treatment comprised three replications and 18 root samples were collected for RNA extraction and physiological parameters measurement. The hydroponic culture was processed under the following conditions: 22/18 °C (day/night), 65% relative humidity, 16 h photoperiod with a photon flux density of 300 μmol m− 2 s− 1.
Transcriptome analysis
Root samples of 1 h, 6 h and 24 h NaCl treated plants (Salt 1 h_R; Salt 6 h_R; Salt 24h_ R) and their respective control regimes (CK 1 h_R; CK 6 h_R; CK 24 h_ R) were used for transcriptome analysis. Each treatment comprised three replications and 18 sequencing libraries were prepared for RNA sequencing. Total RNA extraction was conducted following the Spectrum Plant RNA extraction kit (Sigma-Aldrich, USA). The RNA concentration was checked after DNase I digestion (NanoDrop ND-1000 UV-Vis spectrophotometer). The RNA integrity was measured using Bioanalyzer 2100 system (Agilent Technologies). The following steps were conducted as described before [31]. Generally, RNA libraries were generated according to NEBNext® Ultra™ RNA Library Prep Kit for Illumina® (NEB, USA). RNA fragments were attached to sequencing adaptors and sequenced on an Illumina HiSeq 2000 platform (Illumina, USA) to generate paired-end reads. Clean reads were generated after removing raw reads and adapters of all samples and then were de novo assembled by Trinity program to get assembly transcriptome [77]. The cufflinks program (version 2.0.2) was used to analysis the expression of transcripts and FPKM value were used to estimate their expression distribution [31]. DEGs (defined as genes up- or down-regulated by salt at one or more time points) were identified by comparing the expression alterations of the control and NaCl-treated samples. The significance of differential gene expression was assessed according to the following thresholds after salt treatment: log2 fold change value ≥1or ≤ − 1 and FDR (false discovery rate) ≤0.05 and FPKM value ≥1 [31].
PageMan analysis
The log2 Fold change of SvsCK1h (left column), SvsCK6h (middle column) and SvsCK24h (right column) were imported into PageMan (a new version included in MapMan which was used for pathway analysis) and subjected to a comparative overview of over-representation in all of the treatments [78, 79]. To predict BINs significantly affected, we applied the statistical analysis provided in PageMan. The data was analyzed by Wilcoxon test. Significant differences of BINs were defined based on a p-value < 0.05. Red colour indicates a significant enrichement of up-regulated genes and blue colour indicates a significant depletion of up-regulated genes.
Gene expression pattern analysis by STEM
For temporal expression profiles analysis, STEM software was used [80]. The DEGs whose salt-treated (S): untreated control (CK) log2 expression ratio differed significantly from 0 at one or more time points were used for analysis. The log2 expression ratio of genes was listed in Table S1. The maximum number of profiles was set to 16 and maximum unit change was set to 3 according to the method described before [27].
WGCNA
WGCNA analyses were conducted using the expression of genes against the physiological parameters from the same samples by hypergeometric tests [81]. Generally, the RPKM values were firstly normalized by square root transformation and the cutoff for significant enrichment was FDR < 0.05 [82]. Network construction and module detection were conducted using the automatic one-step method with default settings. Then, the calculated module eigengene value was used to determine the association of modules with each salt responsive-related physiological parameter of 18 samples. Using Cytoscape, the modules which showed greater relevance with physiological parameters were visualized. The genes connecting to a greater number of genes was denoted with bigger size and dark red and were speculated to be more important for their interaction with other genes.
Analysis of gene expression by RT-qPCR
The total RNA was extracted from the roots of three biological replicates at all three time points using RNeasy kit (Qiagen) according to the manufacturer’s instructions. First-strand cDNA of each sample was synthesized from DNase I-treated total RNA (1-5 μg) using TaqMan reverse transcription kit (Applied Biosystems). Each RT-qPCR reaction in a total volume of 20 μl contained 2 μl of cDNA template, 0.2 μM of primers and 10 μl SYBR Green qPCR mix (Toyobo, Japan) and was conducted using ABI real-time PCR system (Applied Biosystems, FosterCity, CA) as described before [30]. Each reaction had three technical duplications. Transcript pattern of each gene was determined by following the 2-ΔCt method [83]. The CdActin2 was used as a reference gene for gene expression normalization. All the technical aspects of RT-qPCR experiments fitted the requirements of MIQE Guidelines [84]. Before gene expression analysis, RNA integrity of all samples was evaluated on agarose gels electrophoresis and RNA absorbance OD260/280 ratios were examined. The original cDNA of each sample was made tenfold serial dilutions (10, 100, 1000x) with sterile ddH2O. The original cDNA and diluted cDNA were used as template to make standard curves (Plots of log gene copy number versus Ct value) to further calculate the gene-specific primer efficiency and R2 (regression coefficient) [85]. The primer efficiency of all primers used in study was over 90%. The specificity of each primer was confirmed by the single peak of the melting curve of all samples. The primers used were listed in Table S5.
Statistical analysis
One-way ANOVA was performed using SPSS17.0 for Windows (SPSS). All of the above tests had at least three independent replicates. Results were expressed as mean ± SD, and * show significant differences (P < 0.05) by Student’s t–test.
Availability of data and materials
All data generated or analyzed during this study are included in the article with its supplementary material. We have deposited our transcriptome data in Sequence Read Archive (SRA) (http://www.ncbi.nlm.nih.gov/sra/), the accession number for our submission is: PRJNA645038.
Abbreviations
- ABC:
-
ATP-binding cassette
- ABI:
-
ABA insensitive
- AOC:
-
Allene oxide cyclase
- AOS:
-
Allene oxide synthase
- AP2:
-
Apetala-2
- ARF:
-
Auxin response factor
- bHLH:
-
Basic helix-loop-helix
- bZIP:
-
Basic leucine zipper
- CAM:
-
Calmodulin
- CDPK:
-
Calcium-dependent protein kinase
- CAT:
-
Catalase
- CML:
-
Calmodulin like
- CPK:
-
Calmodulin-domain protein kinase
- COMT:
-
Caffeic acid O-methyltransferase-like
- DEGs:
-
Differentially expressed genes
- EREBP:
-
Ethylene response element binding protein
- ERF:
-
Ethylene response factor
- FDR:
-
False discovery rate
- GH:
-
Glycoside hydrolases
- GST:
-
Glutathione S-transferase
- GT:
-
Glycosyltransferases
- HB:
-
Homeobox
- HKT:
-
High-affinity K+ transporter
- HSF:
-
Heat shock factor
- LLD:
-
Legume-lectin domain
- MAPK:
-
Mitogen-activated protein kinase
- MDA:
-
Malondialdehyde
- MYB:
-
Myeloblastosis
- NCED:
-
9-cis-epoxycarotenoid dioxygenase
- NHX:
-
Na+/K+ exchanger
- PAL:
-
Phenylalanine-ammonia lyase
- PERK:
-
Proline extensin like
- PP2C:
-
Protein phosphatase 2C
- POD:
-
Peroxidase
- ROS:
-
Reactive oxygen species
- SKP:
-
Sphase-associated kinase protein kinases
- SOD:
-
Superoxide dismutase
- TCA:
-
Tricarboxylic
- UGE:
-
UDP-glucose 4-epimerase
- WAK:
-
S-locus glycoprotein like and wall associated receptor kinase
- XTH:
-
Xyloglucan endotransglucosylase
References
Gupta B, Huang B. Mechanism of salinity tolerance in plants: physiological, biochemical, and molecular characterization. Int J Genomics. 2014;2014(1):701596.
Munns R, Tester M. Mechanisms of salinity tolerance. Annu Rev Plant Biol. 2008;59(1):651–81. https://doi.org/10.1146/annurev.arplant.59.032607.092911.
Zhu JK. Salt and drought stress signal transduction in plants. Annu Rev Plant Biol. 2002;53(1):247–73. https://doi.org/10.1146/annurev.arplant.53.091401.143329.
Giolo M, Macolino S, Barolo E, Rimi F. Stolons reserves and spring green-up of seeded bermudagrass cultivars in a transition zone environment. HortScience. 2013;48(6):1–5.
Harivandi MA, Butler JD, Wu L. Salinity and turfgrass culture. In: Turfgrass. Waddington DV, Carrow RN, Shearman RC, editors. Amer. Soc. Agron. Monograph; 1992. p. 207–229.
Marcum KB, Pessarakli M. Salinity tolerance and salt gland excretion efficiency of bermudagrass turf cultivars. Crop Sci. 2006;46(6):2571–4. https://doi.org/10.2135/cropsci2006.01.0027.
Peacock CH, Lee DJ, Reynolds WC, Gregg JP, Cooper RJ, Bruneau AH. Effects of salinity on six bermudagrass turf cultivars. Acta Hortic. 2004;661:193–7.
Munns R. Genes and salt tolerance: bringing them together. New Phytol. 2005;167(3):645–63. https://doi.org/10.1111/j.1469-8137.2005.01487.x.
Fernando VCD, Schroeder DF. Role of ABA in Arabidopsis salt, drought, and desiccation tolerance. In: Shanker AK, Shanker C, editors. Abiotic and biotic stress in plants-recent advances and future perspectives. InTech; 2016. p. 22.
Ji H, Pardo JM, Batelli G, Van Oosten MJ, Bressan RA, Li X. The salt overly sensitive (SOS) pathway: established and emerging roles. Mol Plant. 2013;6(2):275–86. https://doi.org/10.1093/mp/sst017.
Knight H, Trewavas AJ, Knight MR. Calcium signalling in Arabidopsis thaliana responding to drought and salinity. Plant J. 1997;12(5):1067–78. https://doi.org/10.1046/j.1365-313X.1997.12051067.x.
Guo Y. Molecular characterization of functional domains in the protein kinase SOS2 that is required for plant salt tolerance. Plant Cell. 2001;13(6):1383–400. https://doi.org/10.1105/TPC.010021.
Mahajan S, Pandey GK, Tuteja N. Calcium- and salt-stress signaling in plants: shedding light on SOS pathway. Arch Biochem Biophys. 2008;471(2):146–58. https://doi.org/10.1016/j.abb.2008.01.010.
Mehlmer N, Wurzinger B, Stael S, Hofmann-Rodrigues D, Csaszar E, Pfister B, et al. The Ca2+-dependent protein kinase CPK3 is required for MAPK-independent salt-stress acclimation in Arabidopsis. Plant J. 2010;63(3):484–98. https://doi.org/10.1111/j.1365-313X.2010.04257.x.
Dietz KJ, Mittler R, Noctor G. Recent progress in understanding the role of reactive oxygen species in plant cell signaling. Plant Physiol. 2016;171(3):1535–9. https://doi.org/10.1104/pp.16.00938.
Miller G, Suzuki N, Ciftci-Yilmaz S, Mittler R. Reactive oxygen species homeostasis and signalling during drought and salinity stresses. Plant Cell Environ. 2010;33(4):453–67. https://doi.org/10.1111/j.1365-3040.2009.02041.x.
Noctor G, Reichheld JP, Foyer CH. ROS-related redox regulation and signaling in plants. Semin Cell Dev Biol. 2017;80:3–12.
Pang CH, Wang BS. Oxidative stress and salt tolerance in plants. In: Lüttge U, Beyschlag W, Berlin MJ, editors. Progress in Botany. Berlin, Heidelberg: Springer Berlin Heidelberg; 2008. p. p231–45.
Zhao C, Zhang H, Song C, Zhu JK, Shabala S. Mechanisms of plant responses and adaptation to soil salinity. Innovation. 2020;1(1):100017. https://doi.org/10.1016/j.xinn.2020.100017.
Lata C, Yadav A, Prasad M. Role of plant transcription factors in abiotic stress tolerance. In: Shanker A, editor. Abiotic stress response in plants-physiological, biochemical and genetic perspectives. InTech; 2011. p. 10.
Hanin M, Brini FA, Ebel C, Toda Y, Takeda S, Masmoudi K. Plant dehydrins and stress tolerance. Plant Signal Behav. 2011;6(10):1503–9. https://doi.org/10.4161/psb.6.10.17088.
Assaha DVM, Akihiro U, Hirofumi S, Rashid AY, Yaish MW. The role of Na+ and K+ transporters in salt stress adaptation in glycophytes. Front Physiol. 2017;8:509. https://doi.org/10.3389/fphys.2017.00509.
Brini F, Masmoudi K. Ion transporters and abiotic stress tolerance in plants. ISRN Mol Biol. 2012;927436.
Liu A, Xiao Z, Li MW, Wong FL, Yung WS, Ku YS, et al. Transcriptomic reprogramming in soybean seedlings under salt stress. Plant Cell Environ. 2019;42(1):98–114. https://doi.org/10.1111/pce.13186.
Coudert Y, Périn C, Courtois B, Khong NG, Gantet P. Genetic control of root development in rice, the model cereal. Trends Plant Sci. 2010;15(4):219–26. https://doi.org/10.1016/j.tplants.2010.01.008.
Hochholdinger F, Tuberosa R. Genetic and genomic dissection of maize root development and architecture. Curr Opin Plant Biol. 2009;12(2):172–7. https://doi.org/10.1016/j.pbi.2008.12.002.
Jiang Y, Deyholos MK. Comprehensive transcriptional profiling of NaCl-stressed Arabidopsis roots reveals novel classes of responsive genes. BMC Plant Biol. 2006;6(1):25. https://doi.org/10.1186/1471-2229-6-25.
Postnikova OA, Shao J, Nemchinov LG. Analysis of the alfalfa root transcriptome in response to salinity stress. Plant Cell Physiol. 2013;54(7):1041–55. https://doi.org/10.1093/pcp/pct056.
Song L, Prince S, Valliyodan B, Joshi T, Maldonado dos Santos JV, Wang J, et al. Genome-wide transcriptome analysis of soybean primary root under varying water-deficit conditions. BMC Genom. 2016;17(1):57.
Hu L, Li H, Chen L, Lou Y, Amombo E, Fu J. RNA-seq for gene identification and transcript profiling in relation to root growth of bermudagrass (Cynodon dactylon) under salinity stress. BMC Genomics. 2015;16(1):575. https://doi.org/10.1186/s12864-015-1799-3.
Anuradha U, Tulsi G, Kumar UA, Satisha J, Shinde MP, Kadoo NY, et al. Global transcriptome analysis of grapevine (Vitis vinifera L.) leaves under salt stress reveals differential response at early and late stages of stress in table grape cv. Thompson seedless. Plant Physiol Bioch. 2018;129:168–79.
Geng Y, Wu R, Wee CW, Xie F, Wei X, Chan PM, et al. A Spatio-temporal understanding of growth regulation during the salt stress response in Arabidopsis. Plant Cell. 2013;25(6):2132–54. https://doi.org/10.1105/tpc.113.112896.
de Lorenzo L, Merchan F, Laporte P, Thompson R, Clarke J, Sousa C, et al. A novel plant leucine-rich repeat receptor kinase regulates the response of Medicago truncatula roots to salt stress. Plant Cell. 2009;21(2):668–80. https://doi.org/10.1105/tpc.108.059576.
Marshall A, Aalen RB, Audenaert D, Beeckman T, Broadley MR, Butenko MA, et al. Tackling drought stress: receptor-like kinases present new approaches. Plant Cell. 2012;24(6):2262–78. https://doi.org/10.1105/tpc.112.096677.
Ouyang SQ, Liu YF, Liu P, Lei G, Chen SY. Receptor-like kinase OsSIK1 improves drought and salt stress tolerance in rice (Oryza sativa) plants. Plant J. 2010;62(2):316–29. https://doi.org/10.1111/j.1365-313X.2010.04146.x.
Vaid N, Macovei A, Tuteja N. Knights in action: lectin receptor-like kinases in plant development and stress responses. Mol Plant. 2013;6(5):1405–18. https://doi.org/10.1093/mp/sst033.
Osakabe Y, Yamaguchi-Shinozaki K, Shinozaki K, Tran LS. Sensing the environment: key roles of membrane-localized kinases in plant perception and response to abiotic stress. J Exp Bot. 2013;64(2):445–58. https://doi.org/10.1093/jxb/ers354.
Shkolnik-Inbar D, Bar-Zvi D. ABI4 mediates abscisic acid and cytokinin inhibition of lateral root formation by reducing polar auxin transport in Arabidopsis. Plant Cell. 2010;22(11):3560–73. https://doi.org/10.1105/tpc.110.074641.
Cao YR, Chen SY, Zhang JS. Ethylene signaling regulates salt stress response. Plant Signal Behav. 2008;3(10):761–3. https://doi.org/10.4161/psb.3.10.5934.
Kazan K. Diverse roles of jasmonates and ethylene in abiotic stress tolerance. Trends Plant Sci. 2015;20(4):219–29. https://doi.org/10.1016/j.tplants.2015.02.001.
Feng J, Shi Y, Yang S, Zuo J. 3-Cytokinins. In: Li J, Li C, Smith SM, editors. Hormone metabolism and signaling in plants: Academic Press; 2017. p. 77–106.
Ryu H, Cho YG. Plant hormones in salt stress tolerance. J Plant Biol. 2015;58(3):147–55. https://doi.org/10.1007/s12374-015-0103-z.
Teige M, Scheikl E, Eulgem T, Dóczi R, Ichimura K, Shinozaki K, et al. The MKK2 pathway mediates cold and salt stress signaling in Arabidopsis. Mol Cell. 2004;15(1):141–52. https://doi.org/10.1016/j.molcel.2004.06.023.
Wang F, Jing W, Zhang W. The mitogen-activated protein kinase cascade MKK1-MPK4 mediates salt signaling in rice. Plant Sci. 2014;227:181–9. https://doi.org/10.1016/j.plantsci.2014.08.007.
Yu L, Nie J, Cao C, Jin Y, Yan M, Wang F, et al. Phosphatidic acid mediates salt stress response by regulation of MPK6 in Arabidopsis thaliana. New Phytol. 2010;188(3):762–73. https://doi.org/10.1111/j.1469-8137.2010.03422.x.
Raja V, Majeed U, Kang H, Andrabi KI, John R. Abiotic stress: interplay between ROS, hormones and MAPKs. Environ Exp Bot. 2017;137:142–57. https://doi.org/10.1016/j.envexpbot.2017.02.010.
Smékalová V, Doskočilová A, Komis G, Šamaj J. Crosstalk between secondary messengers, hormones and MAPK modules during abiotic stress signalling in plants. Biotechnol Adv. 2014;32(1):2–11. https://doi.org/10.1016/j.biotechadv.2013.07.009.
Kumar J, Singh S, Singh M, Srivastava PK, Mishra RK, Singh VP, et al. Transcriptional regulation of salinity stress in plants: a short review. Plant Gene. 2017;11:160–9. https://doi.org/10.1016/j.plgene.2017.04.001.
Jiang JJ, Ma SH, Ye NH, Jiang M, Cao JS, Zhang JH. WRKY transcription factors in plant responses to stresses. J Integr Plant Biol. 2017;59(2):86–101. https://doi.org/10.1111/jipb.12513.
Gilmour SJ, Zarka DG, Stockinger EJ, Salazar MP, Houghton JM, Thomashow MF. Low temperature regulation of the Arabidopsis CBF family of AP2 transcriptional activators as an early step in cold-induced COR gene expression. Plant J. 2001;16(4):433–42.
Jiang Y, Yang B, Deyholos MK. Functional characterization of the Arabidopsis bHLH92 transcription factor in abiotic stress. Mol Gen Genomics. 2009;282(5):503–16. https://doi.org/10.1007/s00438-009-0481-3.
Shani E, Salehin M, Zhang Y, Sanchez SE, Doherty C, Wang R, et al. Plant stress tolerance requires auxin-sensitive Aux/IAA transcriptional repressors. Curr Biol. 2017;27(3):437–44. https://doi.org/10.1016/j.cub.2016.12.016.
Li P, Li YJ, Zhang FJ, Zhang GZ, Jiang XY, Yu HM, et al. The Arabidopsis UDP-glycosyltransferases UGT79B2 and 79B3, contribute to cold, salt and drought stress tolerance via modulating anthocyanin accumulation. Plant J. 2017;89(1):85–103. https://doi.org/10.1111/tpj.13324.
Gill SS, Tuteja N. Reactive oxygen species and antioxidant machinery in abiotic stress tolerance in crop plants. Plant Physiol Biochem. 2010;48(12):909–30. https://doi.org/10.1016/j.plaphy.2010.08.016.
Mittler R, Vanderauwera S, Gollery M, Van Breusegem F. Reactive oxygen gene network of plants. Trends Plant Sci. 2004;9(10):490–8. https://doi.org/10.1016/j.tplants.2004.08.009.
Winkel-Shirley B. Biosynthesis of flavonoids and effects of stress. Curr Opin Plant Biol. 2002;5(3):218–23. https://doi.org/10.1016/S1369-5266(02)00256-X.
Feng W, Kita D, Peaucelle A, Cartwright HN, Doan V, Duan Q, et al. The FERONIA receptor kinase maintains cell-wall integrity during salt stress through Ca2+ signaling. Curr Biol. 2018;28(5):666–75. https://doi.org/10.1016/j.cub.2018.01.023.
Zhao C, Zayed O, Yu Z, Jiang W, Zhu JK. Leucine-rich repeat extensin proteins regulate plant salt tolerance in Arabidopsis. P Natl Acad Sci USA. 2018;115(51):201816991.
Lee Y, Choi D, Kende H. Expansins: ever-expanding numbers and functions. Curr Opin Plant Biol. 2001;4(6):527–32. https://doi.org/10.1016/S1369-5266(00)00211-9.
Vissenberg K, Oyama M, Osato Y, Yokoyama R, Verbelen JP, Nishitani K. Differential expression of AtXTH17, AtXTH18, AtXTH19 and AtXTH20 genes in Arabidopsis roots. Physiological roles in specification in cell wall construction. Plant Cell Physiol. 2005;46(1):192–200. https://doi.org/10.1093/pcp/pci013.
Zhao C, Zayed O, Zeng F, Liu C, Zhang L, Zhu P, et al. Arabinose biosynthesis is critical for salt stress tolerance in Arabidopsis. New Phytol. 2019;224(1):274–90. https://doi.org/10.1111/nph.15867.
Ellis M, Egelund J, Schultz CJ, Bacic A. Arabinogalactan-proteins: key regulators at the cell surface? Plant Physiol. 2010;153(2):403–19. https://doi.org/10.1104/pp.110.156000.
Majewska-Sawka A, Nothnagel EA. The multiple roles of arabinogalactan proteins in plant development. Plant Physiol. 2000;122(1):3–10. https://doi.org/10.1104/pp.122.1.3.
Shi H, Kim Y, Guo Y, Stevenson B, Zhu JK. The Arabidopsis SOS5 locus encodes a putative cell surface adhesion protein and is required for normal cell expansion. Plant Cell. 2003;15(1):19–32. https://doi.org/10.1105/tpc.007872.
Sui N, Wang Y, Liu S, Yang Z, Wang F, Wan S. Transcriptomic and physiological evidence for the relationship between unsaturated fatty acid and salt stress in peanut. Front Plant Sci. 2018;9:7.
Zhang JT, Zhu JQ, Zhu Q, Liu H, Gao XS, Zhang HX. Fatty acid desaturase-6 (Fad6) is required for salt tolerance in Arabidopsis thaliana. Biochem Biophys Res Commun. 2009;390(3):469–74. https://doi.org/10.1016/j.bbrc.2009.09.095.
Akula R, Ravishankar GA. Influence of abiotic stress signals on secondary metabolites in plants. Plant Signal Behav. 2011;6(11):1720–31. https://doi.org/10.4161/psb.6.11.17613.
Thakur M, Bhattacharya S, Khosla PK, Puri S. Improving production of plant secondary metabolites through biotic and abiotic elicitation. J Appl Res Med Aroma. 2019;12:1–12.
Liang M, Haroldsen V, Cai X, Wu Y. Expression of a putative laccase gene, ZmLAC1, in maize primary roots under stress. Plant Cell Environ. 2006;29(5):746–53. https://doi.org/10.1111/j.1365-3040.2005.01435.x.
Ranocha P. Laccase Down-regulation causes alterations in phenolic metabolism and cell wall structure in poplar. Plant Physiol. 2002;129(1):145–55. https://doi.org/10.1104/pp.010988.
Divi UK, Rahman T, Krishna P. Brassinosteroid-mediated stress tolerance in Arabidopsis shows interactions with abscisic acid, ethylene and salicylic acid pathways. BMC Plant Biol. 2010;10(1):151. https://doi.org/10.1186/1471-2229-10-151.
Ballif J, Endo S, Kotani M, MacAdam J, Wu Y. Over-expression of HAP3b enhances primary root elongation in Arabidopsis. Plant Physiol Bioch. 2011;49(6):579–83. https://doi.org/10.1016/j.plaphy.2011.01.013.
Ciftci-Yilmaz S, Morsy MR, Song L, Coutu A, Krizek BA, Lewis MW, et al. The EAR-motif of the Cys2/His2-type zinc finger protein Zat7 plays a key role in the defense response of Arabidopsis to salinity stress. J Biol Chem. 2007;282(12):9260–8. https://doi.org/10.1074/jbc.M611093200.
Ndimba BK, Chivasa S, Simon WJ, Slabas AR. Identification of Arabidopsis salt and osmotic stress responsive proteins using two-dimensional difference gel electrophoresis and mass spectrometry. Proteomics. 2005;5(16):4185–96. https://doi.org/10.1002/pmic.200401282.
Smalle J, Vierstra RD. The ubiquitin 26S proteasome proteolytic pathway. Annu Rev Plant Biol. 2004;55(1):555–90. https://doi.org/10.1146/annurev.arplant.55.031903.141801.
Moller IM. Plant mitochondria and oxidative stress: Electron transport, NADPH turnover, and metabolism of reactive oxygen species. Annu Rev Plant Phys. 2001;52(1):561–91. https://doi.org/10.1146/annurev.arplant.52.1.561.
Grabherr MG, Haas BJ, Yassour M, Levin JZ, Thompson DA, Amit I, et al. Full-length transcriptome assembly from RNA-Seq data without a reference genome. Nat Biotechnol. 2011;29(7):644–52. https://doi.org/10.1038/nbt.1883.
Usadel B, Nagel A, Steinhauser D, Gibon Y, Bläsing OE, Redestig H, et al. PageMan: an interactive ontology tool to generate, display, and annotate overview graphs for profiling experiments. BMC Bioinform. 2006;7(1):535. https://doi.org/10.1186/1471-2105-7-535.
Thimm O, Bläsing O, Gibon Y, Nagel A, Meyer S, Krüger P, et al. MAPMAN: a user-driven tool to display genomics data sets onto diagrams of metabolic pathways and other biological processes. Plant J. 2004;37(6):914–39. https://doi.org/10.1111/j.1365-313X.2004.02016.x.
Ernst J, Bar-Joseph Z. STEM: a tool for the analysis of short time series gene expression data. BMC Bioinform. 2006;7(1):1–11.
Langfelder P, Horvath S. WGCNA: an R package for weighted correlation network analysis. BMC Bioinform. 2008;9(1):559. https://doi.org/10.1186/1471-2105-9-559.
Bai Y, Dougherty L, Cheng L, Zhong GY, Xu K. Uncovering co-expression gene network modules regulating fruit acidity in diverse apples. BMC Genomics. 2015;16(1):612. https://doi.org/10.1186/s12864-015-1816-6.
Vandesompele J, Preter KD, Pattyn F, Poppe B, Roy NV, Paepe AD, et al. Accurate normalization of real-time quantitative RT-PCR data by geometric averaging of multiple internal control genes. Genome Biol. 2002;3 research 0034.1 (2002).
Bustin SA, Benes V, Garson JA, Hellemans J, Huggett J, Kubista M, et al. The MIQE guidelines: minimum information for publication of quantitative real-time PCR experiments. Clin Chem. 2009;55(4):611–22. https://doi.org/10.1373/clinchem.2008.112797.
Schmittgen T, Livak K, Schmittgen TD, Livak KJ. Analyzing real-time PCR data by the comparative C(T) method. Nat Protoc. 2008;3(6):1101–8. https://doi.org/10.1038/nprot.2008.73.
Acknowledgements
We thank the novogene company at WuHan, China, for supporting computational work. We also thank for the fund supporting by the National Natural Science Foundation of China and Natural Science Foundation of Shandong Province.
Funding
This work was supported by the National Natural Science Foundation of China (grant no. 31801892) and Natural Science Foundation of Shandong Province, China (grant no. ZR2019PC012). Funding bodies were not involved in the design of the study, collection of data, analysis, and interpretation of data or in writing the manuscript.
Author information
Authors and Affiliations
Contributions
A.S. and W.W. performed most of the experiments, analyzed most of the data and wrote the article with contributions of all the authors; S.F. provided technical assistance; X.X., Y.Y., X.L., G.W. and H.W. provided experiment assistance; J.F. supervised the experiments. E.A. edited the manuscript. All the authors reviewed the draft. The author(s) read and approved the final manuscript.
Corresponding author
Ethics declarations
Ethics approval and consent to participate
Not applicable.
Consent for publication
Not applicable.
Competing interests
The authors declare that they have no competing interests
Additional information
Publisher’s Note
Springer Nature remains neutral with regard to jurisdictional claims in published maps and institutional affiliations.
Supplementary Information
Additional file 1: Fig. S1
. Example of down-regulated gene categories following salt treatment at different time points using PageMan. Fig. S2. Examples of genes commonly up-regulated at three-time points or specifically up-regulated at 1 h. Gene IDs and are indicated at the right side of each heat map. Fig. S3. Protein metabolism regulated following salt treatment at different time points using PageMan. SvsCK1h (left column), SvsCK6h (middle column) and SvsCK24h (right column). Fig. S4. Example of gene categories specifically up-regulated following 1 h salt treatment using PageMan. SvsCK1h (left column), SvsCK6h (middle column) and SvsCK24h (right column). Fig. S5. Transcription factors up-regulated following salt treatment at different time points using PageMan. Fig. S6. The complete view of enriched gene categories using pageman analysis. SvsCK1h (left column), SvsCK6h (middle column) and SvsCK24h (right column). Fig. S7. Relative expression levels of hub genes in the lavenderblush2 and brown4 modules. a-c, Hub genes from lavenderblush2 module. d-h, Hub genes from brown4 module. Relative expression level is presented as the mean ± SD of three replicates at each time point. Expression levels of hub genes were calculated using the 2−△CT approach using Actin2 as the reference gene. Table S1. The list of DEGs genes under different time point respectively and the fold change of DEGs for STEM package. Table S2. The list of time-specific enriched sub-bins of DEGs using MapMan systems. The genes from different enriched categories at each time point are given in log2 scale, and can be distinguished by the column headers. Table S3. The list of DEGs commonly regulated at all three time points. The genes from different enriched categories at each time point is given in log2 scale. Table S4. The physiological index used for WGCNA analysis and hub genes involved in lavenderblush2 and brown4 modules. Table S5. The primes of hub genes used for RT-qPCR.
Rights and permissions
Open Access This article is licensed under a Creative Commons Attribution 4.0 International License, which permits use, sharing, adaptation, distribution and reproduction in any medium or format, as long as you give appropriate credit to the original author(s) and the source, provide a link to the Creative Commons licence, and indicate if changes were made. The images or other third party material in this article are included in the article's Creative Commons licence, unless indicated otherwise in a credit line to the material. If material is not included in the article's Creative Commons licence and your intended use is not permitted by statutory regulation or exceeds the permitted use, you will need to obtain permission directly from the copyright holder. To view a copy of this licence, visit http://creativecommons.org/licenses/by/4.0/. The Creative Commons Public Domain Dedication waiver (http://creativecommons.org/publicdomain/zero/1.0/) applies to the data made available in this article, unless otherwise stated in a credit line to the data.
About this article

Cite this article
Shao, A., Wang, W., Fan, S. et al. Comprehensive transcriptional analysis reveals salt stress-regulated key pathways, hub genes and time-specific responsive gene categories in common bermudagrass (Cynodon dactylon (L.) Pers.) roots. BMC Plant Biol 21, 175 (2021). https://doi.org/10.1186/s12870-021-02939-1
Received:
Accepted:
Published:
DOI: https://doi.org/10.1186/s12870-021-02939-1