
Abstract
Background
Paeonia decomposita, endemic to China, has important ornamental, medicinal, and economic value and is regarded as an endangered plant. The genetic diversity and population structure have seldom been described. A conservation management plan is not currently available.
Results
In the present study, 16 pairs of simple sequence repeat (SSR) primers were used to evaluate the genetic diversity and population structure. A total of 122 alleles were obtained with a mean of 7.625 alleles per locus. The expected heterozygosity (He) varied from 0.043 to 0.901 (mean 0.492) in 16 primers. Moderate genetic diversity (He = 0.405) among populations was revealed, with Danba identified as the center of genetic diversity. Mantel tests revealed a positive correlation between geographic and genetic distance among populations (r = 0.592, P = 0.0001), demonstrating consistency with the isolation by distance model. Analysis of molecular variance (AMOVA) indicated that the principal molecular variance existed within populations (73.48%) rather than among populations (26.52%). Bayesian structure analysis and principal coordinate analysis (PCoA) supported the classification of the populations into three clusters.
Conclusions
This is the first study of the genetic diversity and population structure of P. decomposita using SSR. Three management units were proposed as conservation measures. The results will be beneficial for the conservation and exploitation of the species, providing a theoretical basis for further research of its evolution and phylogeography.
Background
The genus Paeonia L. (Paeoniaceae) includes 32 woody and herbaceous species, mainly distributed in the northern hemisphere. Paeonia is divided into three sections: Onaepia, Moutan, and Paeonia [1, 2]. The Moutan section comprises eight species that are native and endemic to China [2] and commonly termed Mudan or tree peonies in Chinese. In China, Mudan is regarded as the ‘King of Flowers’, and the plant is prized both for its pharmaceutical applications and its ornamental value [1, 3]. Seed oil can be extracted from peony seeds, which contain fatty acids, and so the peony has become an important woody oil crop [4].
Paeonia decomposita Handel-Mazzetti is a species from the Moutan section. It is found principally in the remote mountain areas of northwest Sichuan Province, and is both indigenous and endemic to China, with a sporadic and narrow distribution and small population size. It grows in sparse Cupressus chengiana forests, young secondary deciduous broad-leaved forests, and thickets at an altitude of 2000–3100 m and has 2n = 10 chromosomes. It is cross-pollinated by insects [5] and propagates by seeds [6]. In the past, P. decomposita consisted of two subspecies: P. decomposita subsp. rotundiloba and P. decomposita subsp. decomposita [7,8,9]. Based on morphological traits and molecular data, they are now considered separate species [2, 10, 11].
P. decomposita is a celebrated ornamental flower on account of its large, showy, colorful, and fragrant flowers. Thus, local people collect the plants to use in ornamental gardening. It is also a traditional medicinal plant because its root bark (‘Danpi’ in Chinese) is used as a traditional Chinese medicine, having multiple therapeutic properties, for example, clearing heat, cooling blood, activating blood flow, and removing blood stasis [12]. It has recently become considered an important woody oilseed plant. The mean kernel oil content was found to be 32.23 ± 1.96%, consisting of seven fatty acids. Most of the oil (91.94–93.70%) was found to consist of unsaturated fatty acids, with linolenic acid accounting for 40.45–47.68% [13]. The extracted oil from the seeds can be utilized as oleochemicals, cosmetics, and medicines [14]. Therefore, P. decomposita is considered to be not only an ornamental plant but also an important officinal plant with a valuable woody oil crop.
Due to multiple threats including habitat damage, excessive harvesting of seeds, misuse of the root-bark in traditional Chinese medicine, and a naturally poor regenerative ability, P. decomposita’s natural habitats have become increasingly fragmented, with the natural population size and individual numbers of plants decreasing dramatically, resulting in a significant loss of genetic resources. Currently, most populations are small, fragmented, and scattered, increasing the probability of inbreeding and the potential for genetic drift. Also, low seed production, difficult seedling renewal, and the lack of a specific mechanism for long-distance seed dispersal have resulted in poor population regeneration because many communities are short of seedlings and saplings. Following its distribution, biological characteristics, and survival status, P. decomposita has been listed as an endangered plant (EN) [15, 16]. Conservation of the species is therefore critically important. Genetic resource conservation and plant breeding programs require an evaluation of the genetic diversity and structure of the endangered species [17, 18]. However, it is difficult to plan conservation strategies for this plant due to a lack of genetic background knowledge.
The use of molecular markers allows precise estimates of genetic diversity. In the past, researchers have used various molecular markers, including amplified fragment length polymorphisms (AFLP), sequence-related amplified polymorphisms (SRAP), inter simple sequence repeats (ISSR), and random amplified polymorphic DNAs (RAPD), to study the genetic relationships among the species in Section Moutan [19,20,21,22,23]. Compared with AFLP, SRAP, ISSR, and RAPD, simple sequence repeats (SSR) markers have the significant advantages of co-dominance, wide distribution, high transferability, high polymorphism, high reproducibility, and high reliability combined with relatively low expense [24, 25], resulting in them being commonly regarded as ideal molecular markers. They have been widely employed to study genetic diversity, population structure, and the genetic relationships of different plant species [26,27,28,29,30], including tree peonies [31,32,33].
To date, the study of P. decomposita has been limited to the genetic relationships among species and the genetic diversity of ISSRs [34], with no studies exploring the genetic diversity of SSRs, or the genetic relationships or population structures of this important woody oilseed species. No breeding plan has been established from which to select an optimum germplasm or resource conservation strategy, hindering the conservation of P. decomposita. Thus, an accurate understanding of the population structure and genetic diversity of P. decomposita is urgently required.
Accordingly, given its value in medical, industrial, and ornamental applications, a genetic study of the plant was conducted. In the present study, I first selected 16 pairs of polymorphic SSR markers, then evaluated the molecular variance among and within populations to determine the genetic diversity and population structure, to provide crucial information for establishing an appropriate conservation and management strategy of genetic germplasm resources and the deployment of these resources with plans for a future directive breeding strategy.
Results
SSR marker polymorphism
In the present study, a total of 122 alleles at 16 polymorphic microsatellite loci [35,36,37,38,39,40,41,42,43] (Table 1) were amplified across 258 individual plants from 11 natural populations. The number of observed alleles per locus (Na) varied greatly among loci, from two alleles (locus PSMP2) to 20 alleles (locus PAG1) (mean = 7.625). The number of effective alleles per locus (Ne) ranged from 1.045 (locus PSMP2) to 9.929 (locus PAG1) (mean = 3.208). The observed heterozygosity per locus (Ho) ranged from 0.027 (locus WD09) to 0.992 (locus 73A) (mean = 0.385), whereas the expected heterozygosity (He) ranged from 0.043 (locus PSMP2) to 0.901(locus PAG1), with a mean of 0.492. The polymorphic information content (PIC value) of the primers varied from 0.042 (locus PSMP2) to 0.891 (locus PAG1) with a mean of 0.456. In total, 21 private alleles (NP) were identified in 9 populations except for M2 and M4 by 16 markers (Table S1).
At the locus level, the genetic differentiation coefficient (Fst) and gene flow (Nm) calculated from F-statistics at each locus in the species were significantly different. The paired comparison of genetic differentiation between the populations indicated that the maximum values of Fst and Nm were 0.430 (at locus 50F, R) and 2.735 (at locus PSESP5), respectively. The genetic differentiation coefficient (Fst) was estimated to be 0.193 for the 16 loci (ranging from 0.084 at locus PSESP5 to 0.430 at 50F, R). The mean inbreeding coefficient (Fis) was 0.038 (Table 2).
Population genetic diversity
At the population level, genetic diversity indices (in terms of PPL, Na, Ne, I, Ho, He, F) varied across populations of P. decomposita, as listed in Table 3. On average, the percentage of polymorphic loci (PPL) across eleven populations was high (80.68%) and ranged from 68.75% for JC5 to 93.75% for DB1, with most populations (10/11) ≥ 75%. The number of observed alleles (Na) per population varied from 2.563 (M4) to 4.813 (DB2), with a mean of 3.637. The number of effective alleles (Ne) across all populations was 2.322, varying from 1.811 (M1) to 2.813 (DB2). The mean heterozygosity (He) and observed heterozygosity (Ho) across all populations ranged from 0.329 (M1) to 0.538 (DB1) and 0.314 (M2) to 0.464 (DB2), with means of 0.405 and 0.394, respectively. The mean value of Shannon’s Information Index (I) was 0.777 over a range of 0.580 (M1) to 1.017 (DB1). The fixation index (F) averaged 0.032, ranging from − 0.160 (JC5) to 0.154 (DB1) at the population level. The majority of loci were in accord with the Hardy–Weinberg Equilibrium (HWE), but several populations did not fully satisfy the HWE, especially populations DB2 and M3 in which many loci were found to deviate from the HWE (7 and 8 loci, respectively), indicating a panmictic population structure. Loci 56A and 73A deviated from HWE in all populations.
Genetic differentiation and gene flow between populations
The difference in genetic differentiation (Fst) between pairs of populations was highly significant (P < 0.001), varying from 0.041 (between JC1 and JC2) to 0.234 (between DB2 and M2), with a mean value of 0.098 (P < 0.001; Table 4), measured across 11 populations based on 16 markers. Conversely, the values for gene flow (Nm) between populations varied from 0.820 (between DB2 and M2) to 5.890 (between JC1 and JC2), with a mean value of 2.781 (Table 4).
Nei’s genetic distance, calculated from a pairwise comparison, varied from 0.058 (between M2 and M4) to 0.462 (between DB2 and M2) based on SSR markers, with a mean value of 0.178, and the majority of pairwise genetic distances occurring over the range 0.1–0.3 (Table 5). A Mantel test conducted for P. decomposita indicated a positive correlation between geographic and genetic distance among populations (r = 0.592, P < 0.001) (Fig. 1), in line with the IBD (isolation by distance) model. Results of the AMOVA demonstrated that 81.70% of the total molecular variance was due to differences within regions, while the remainder (18.30%) occurred among regions (P < 0.001). At the population level, 73.48% of total molecular variance resulted predominantly from individual differentiation within populations, the remainder (only 26.52%) resulting from molecular variance among populations (all P < 0.001). When total molecular variance was grouped into three hierarchical components, analysis by AMOVA revealed that the proportion of maximum molecular variance (70.61%) was still brought about by genetic differentiation within populations (P < 0.001), whereas 13.39% (P < 0.001) and 16% (P < 0.001) of the total molecular variance resulted from genetic differentiation among regions and populations within regions, respectively (Table 6). The positions of inferred gene flow barriers between regions were identified based upon the matrix of Fst values (Fig. 2).

Correlation test of genetic distance (GD) and geographic distance (GGD)

Barriers to the flow of genes. Gray lines correspond to hypothetical boundaries between populations, which are labeled with corresponding codes. Red solid lines with arrows are used to indicate barriers to the flow of genes, and population abbreviations are as represented for Table 7
Population structure and genetic relationships
The optimal number of genetic clusters equaled 3 when ΔK was at its maximum for K = 3 (Fig. S1). Thus, all 11 populations under study were split into three distinct genetic clusters (Fig. 3). Cluster 1 contained 49 individual plants collected from two populations in Danba county, Cluster 2 consisted of 97 individual plants sampled from five populations in Jinchuan county, and the remaining 112 arising from four populations in Maerkang county were assigned to Cluster 3. It was apparent that the three genetic clusters were identical to the clusters identified in PcoA, representing the natural distribution of P. decomposita. Principal coordinate analysis (PCoA) obtained according to the genetic distance between populations revealed a genetic structure that is presented in Fig. 4. The percentage variance attributable to the three principal coordinate axes was 76.66% (axis 1–50.71%, axis 2–16.95%, and axis 3–9.00%). Furthermore, the results of the PCoA were consistent with those of the structure analysis and supported the UPGMA clustered tree, as described below.

Genetic structure of 11 populations as inferred by STRUCTURE with SSR markers data set

Principal Coordinate Analysis (PCoA) plot of the 11 populations showing three main clusters
The UPGMA dendrogram was constructed from Nei’s genetic distance values and is an accurate reflection of the genetic relationships among and within populations. The UPGMA tree indicated that the 11 populations could be divided into two major clusters: 1 and 2 (Fig. 5). Cluster 1 included two populations, namely DB1 and DB2, with cluster 2 consisting of the remaining 9 populations, which were further divided into two short branches: five populations (JC1, JC2, JC3, JC4, and JC5) from Jinchuan county formed one short branch and four (M1, M2, M3, and M4) from Maerkang county formed another.
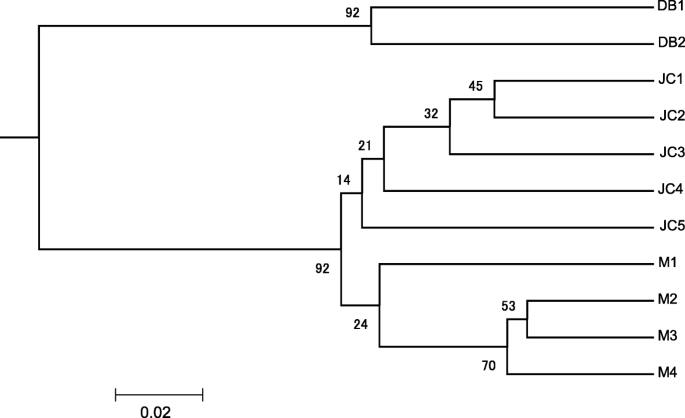
UPGMA dendrogram based on Nei’ genetic distance using SSR marker analysis. The branch length represents genetic distance and the value on the branch is the support rate
Discussion
It is important to maintain the genetic diversity of natural populations to ensure the continued survival, fitness, and evolutionary potential of a species [44]. Traditionally, the analysis of differences in plant morphology and physiological traits have been used to evaluate diversity. However, only limited information was available for this species using these methods because such traits are not stable under different environmental conditions. Recently, a range of DNA molecular marker techniques have been used to analyse tree peonies, including the use of RFLP [21], RAPD [45], ISSR [46], and AFLP markers [47]. However, these studies were focused on investigating the phylogenetic relationships among interspecies or wild species and it is generally recognized that a greater number of molecular markers are required to conduct genetic studies of Paeonia species. SSR is the most practical molecular marker in studies of population genetics because it can measure codominant alleles and display high levels of polymorphism. The present study is the first to investigate the genetic diversity and population structure of P. decomposita through microsatellite markers, important for the conservation, management, and greater understanding of its genetic relationships.
Genetic diversity
Differences in genetic diversity may result from a small number of factors, for example, the life-history or geographic traits of a species [48]. In general, less genetic diversity exists in an endemic species that is not widely distributed compared with that found in a widespread species [49], usually because their population numbers are limited, and as they are isolated from other populations they adapt to their particular habitat [50].
This study demonstrated that the genetic diversity level of P. decomposita was moderate (Ho = 0.394, He = 0.405) among Paeonia species even though it is a rare and endangered species. Compared with previous research of wild tree peonies, the genetic diversity parameters observed in this study were slightly lower than those of P. jishanensis (Ho = 0.446) [31] and P. rockii (Ho = 0.459, He = 0.492) [33], but higher than those of P. ostii (Ho = 0.343, He = 0.321) [51], P. jishanensis (He = 0.340) [31], P. delavayi (Ho = 0.334, He = 0.369) [52] and P. ludlowii (Ho = 0.014, He = 0.013) [52]. Genetic diversity analysis using ISSR markers indicated a level for P. decomposita that was not high [34] and lower than the results of this study.
Levels of genetic diversity in P. decomposita (He = 0.405) were lower than both “endemic” species (He = 0.420) and “widespread” species (He = 0.620) [48]. The possible reason for this result is that the sporadic and narrow distribution range, as well as the small sizes of populations and large spatial distances between populations limit pollination among populations, resulting in selfing and inbreeding and potentially leading to low genetic diversity.
The current methods of analysis have considerably improved the understanding of genetic diversity in populations of P. decomposita, in which the polymorphism levels varied between populations. In this study, genetic diversity (I, Ho, He, PIC) at the population level was relatively uniform and relatively higher in populations DB1 and DB2 than in other populations, related to low levels of human disturbance and a large population size in Danba. Therefore, Danba represents the major genetic diversity center of the species. Estimation of the fixation index (F) revealed that three populations (JC1, JC4, JC5: negative values) displayed an excess of heterozygotes, indicating outbreeding while the other eight populations (positive value) had an excess of homozygotes associated with inbreeding. The mean positive inbreeding coefficient (Fis) values (0.051) indicated an excess of homozygotes in P. decomposita (Table 3).
The results strengthened the assumption that endangered plants within a narrow distribution are generally aplastic. A reduction in genetic variation might suggest a decline in adaptation to a changing environment, leading to an increased danger of extinction and increased inbreeding [44, 53].
Gene flow and genetic differentiation
Two important parameters, gene flow and the genetic differentiation coefficient, are employed to assess the genetic structure of a population [54]. Gene flow and the genetic differentiation coefficient are negatively correlated [55].
Gene flow is a basic micro-evolutionary phenomenon that prevents genetic differentiation among populations and affects the maintenance of genetic diversity [56, 57]. Many endangered plants are isolated and narrowly distributed within a few small populations, possibly leftovers of a formerly widespread species that had a large and continuous population [56, 58]. In the present study, the gene flow (mean Nm value) between P. decomposita populations was > 1, which, in theory, prevents genetic differentiation resulting from genetic drift [59]. Genetic drift has not yet become a predominant factor influencing the genetic structure of P. decomposita. However, P. decomposita populations are now affected by fragmentation and vandalism, with genetic exchanges occurring within most populations. For these reasons, together with the fact that natural populations are spatially distant (isolated by mountain and river barriers), genetic drift may occur gradually.
Although diversity appears to have occurred mostly within populations, the majority of the genetic differentiation between populations has occurred at a moderate and low level except for a high level of genetic differentiation between DB2 and populations from Jinchuan and Maerkang (Table 4), according to the scale suggested by Wright [60]. The mean Fst indicates moderate genetic differentiation among the populations of the species. Barrier 2.2 was used to identify barriers to dispersal, revealing that gene exchange was inhibited by the complex terrains among different geographic regions.
The AMOVA results (P < 0.001) also support population differentiation. AMOVA revealed the presence of molecular variance among and within populations, with major molecular variance within populations rather than among populations, a situation identical to that observed with other cross-pollinating species in Paeonia [33, 51, 52] and other studies using ISSR markers [34]. In outcrossing and long-lived plants in general, most of their genetic variation exists within populations, while selfing plants maintain the majority of genetic variation among populations [48].
Population structure and genetic relationships
A variety of methods are used to detect genetic diversity and population structure [61,62,63,64,65]. It is advisable to combine three effective techniques and so I consider that the combination of PCoA, Structure, and UPGMA analysis is able to produce reliable results. UPGMA was able to expound intuitive relationships although it cannot fully categorize populations. Conversely, Structure software can objectively categorize populations and produce plans for breeding. Therefore, this method was regarded as the most suitable to categorize populations.
In the present study, UPGMA cluster analysis grouped 11 populations collected from three different regions into two clusters, demonstrating that there were two distinct genetic groups in these areas. The results of Structure clearly suggest that the sampling locations behave as three clusters, with some examples of admixed individuals. These signs of admixture suggest that gene flow may still exist among some locations (which is corroborated by the greater Nm estimates for some pairs of populations). This suggests that analyses by Structure software were reliable. Furthermore, the PCoA results were identical to those from Structure and supported the UPGMA clustered tree.
In addition, the genetic relationships among populations reflected those populations’ natural geographical locations which were supported by an IBD (isolation-by-distance) model constructed using a Mantel test. This IBD model for P. decomposita indicated a positive correlation (r = 0.592, P < 0.001) between geographic distance and genetic distance between populations. The differences in genetic differentiation were due to geographic barriers, which isolated different gene pools. Inefficient pollen flow, close seed dispersal, and low germination rates are latent reasons which have led to three distinct P. decomposita gene pools.
Conservation of populations in situ and ex situ
It is essential to understand the genetic diversity, structure, and gene flow of a population to create an appropriate management and conservation strategy. The population resources employed for reintroduction, including reproduction material and germplasm collection must be optimal in terms of genetic variation.
The management of collections and conservation of genetic resources must guarantee that most of the existing variation is conserved. Conservation of diversity among populations must concentrate on maintaining the most genetically distinctive populations while conservation of diversity within populations must conserve large core populations in which diversity is not lost due to genetic drift [66]. In the case of P. decomposita, conservation must consider not only the geographic distance between the populations, but also the existence of different clusters and their different growth habitats. In every cluster, the priorities for the conservation of populations must be selected, by considering the level of genetic diversity, the state of populations’ regeneration, and their level of threat. Construction of large reserves with several populations in every cluster could guarantee a sample of the gene pool, which could embrace the uniqueness and diversity that exists in all populations.
Genetic diversity is especially important for a species in preserving the latent evolutionary capacity to deal with changing environments [67]. The maintenance of genetic diversity and evolutionary potential is a primary goal for the conservation of endangered species in management programs [68, 69]. Therefore, information about genetic variation within and among populations in endangered and rare plants plays an important role in the process of formulating conservation and management strategies [70]. Thus, I suggest that the three natural distribution areas should correspond to three conservation management units. In view of the current circumstances in which a rapid fall in the number of populations and the extreme endangerment of their natural habitats, in situ and ex situ conservation actions are imperative. All populations, particularly those with high levels of genetic diversity or those with large genetic differences, should be protected. In situ conservation is considered the most effective method of protecting endangered plants, through which the whole gene pool can be protected in a natural habitat. Small populations are more likely to become extinct due to habitat damage and environmental fluctuation. It is essential to conserve all individual plants and populations in situ for the sake of preserving genetic variation as far as possible. Traditional methods of protection that primarily concentrate on in situ conservation, such as improving regeneration, controlling overgrazing, and protecting natural habitats, may be sufficient to maintain the size of the population. Consequently, it is essential to prevent the populations’ genetic homogeneity. In situ conservation must be introduced promptly by defining and introducing conservation reserves in core distribution regions and strictly prohibiting the harvesting of wild P. decomposita. Populations DB1 and DB2, with relatively higher genetic diversity than other populations, must be given priority for conservation in situ. Much previous research has demonstrated that heterozygosity is the best method of ensuring populations’ fitness and potential for adaptation [71]. However, a notable heterozygote deficit was found to exist in some populations, including DB1, JC3, and M2, possibly a result of inbreeding in fragments of populations.
The populations of P. decomposita are facing the problems of habitat destruction, loss or fragmentation as a result of grazing (M2, JC5, DB1, DB2), over-harvesting (M2, M3), abusive seed collection (JC2–5), growing close to villages, farm fields, and orchards (JC2–5), or areas practically destroyed by urban expansion (M2, M4). Given this challenge, in addition to in situ conservation, it is very much advised that gene banks in both the field and laboratory are established ex situ for each population for which protection is required for endangered plants [72]. The conservation strategy for P. decomposita should be aimed at preserving the three detected genetic clusters and taking into account the populations with private alleles (except M2 and M4), for taking conservation actions. Populations DB1 and DB2, with relatively higher genetic diversity than the other populations, must be concrete goals for ex situ conservation. Because the degree of genetic differentiation was low among populations, each may represent a large component of genetic variation in a species. Thus, seed collection tactics could be devised for the construction of an ex situ seed germplasm resource bank to collect as many samples of each population as possible from the whole natural geographical distribution with different genetic clusters, and conserve the germplasm using plant tissue culture techniques. In the course of ex situ conservation, artificial hybridization must be performed among populations with large genetic differences to rapidly improve heterozygosity. After ex situ cultivation of seeds collected from the field, saplings should be introduced into source sites. To summarize, in situ and ex situ conservation methods should be combined to protect valuable genetic resources.
Conclusions
Genetic information from this detailed study has provided first-hand data of the genetic diversity and population structure of P. decomposita, which are beneficial for developing measures to conserve and manage endangered plants. Natural populations maintained moderate to low genetic diversity levels, high gene flow, and low genetic differentiation among populations. Eleven natural populations were categorized into three groups/clusters, which should possibly be considered as three management units for the objective of conservation. These populations are precious genetic resources for a future breeding plan and conservation strategy. This is the first time that the genetic diversity of P. decomposita has been studied using SSR, the results representing a reference for improving the germplasm and parental selection for breeding strategy plans.
The markers used in the present study allowed investigation of population structure, genetic diversity, germplasm collection, and conservation strategy for P. decomposita. Important information about the genetic structure was provided by these markers, which significantly contribute to future improvements and breeding plans for the species. The genetic diversity, population structure, and genetic relationships between populations through SSR analysis will be helpful for crop breeding, germplasm management, and conservation. To conclude, these results provide value as important resources to study genetic diversity, assist conservation, management, and research plans in the future.
Methods
Plant materials
The plant materials used in this study were obtained from the wild and permission was obtained to collect samples. The collection of plant materials also complied with institutional, national, or international guidelines. A total of 258 individual plants was sampled from eleven natural populations of P. decomposita across almost the complete regional distribution of China in 2017 prior to the flowering season. Ten–40 individual plants that were at least 10 m apart were sampled from each population. Details of the sampling are listed in Table 7 and Fig. 6. Fresh, tender, and healthy leaves were individually sampled in the wild, then immediately placed in plastic. The bags were sealed and dried using chromotropic silica gel and stored at − 20 °C until isolation of the DNA. The formal identification of the samples used in this study was performed by Shi-Quan Wang. Voucher specimens were deposited in the herbarium of Hainan Normal University.

Geographic locations of P. decomposita populations sampled in this study
DNA extraction and PCR amplification
Total genomic DNA was extracted from the leaves of each sample using the Plant Genomic DNA Kit (Tiangen Biotech, Beijing, China) in accordance with the manufacturer’s instructions. DNA concentration and quality were measured using spectrophotometry and gel electrophoresis in 1% agarose, respectively. The extracted DNA was diluted to a working concentration of 50 ng/μl then stored at − 20 °C until required. Primers previously documented and developed for tree peonies were selected for screening. These primers were screened on 12 representative samples and, after initial screening, 16 polymorphic microsatellite primer pairs [35,36,37,38,39,40,41,42,43] (from genomic, Table 1) producing a high degree of polymorphism and high level of amplification were selected for subsequent analysis.
SSR-PCR amplification reactions were conducted using a total volume of 10 μl consisting of 5 μl of 2 × Taq PCR MasterMix (0.1 U/μl Taq DNA Polymerase, 0.5 mM each of dNTPs, 20 mM Tris-HCl, 100 mM KCl, 3 mM MgCl2), 1 μl of genomic DNA template (50 ng/μl) from each accession, 3 μl of ddH2O, and 1 μl of each primer [labeled with a 5′ fluorescent tag (TGTAAAACGACGGCCAGT, FAM, HEX, TAMRA)]. PCR amplification was conducted using a Bio-Rad thermal cycler (Applied Biosystems) with either of two different cycling protocols, as follows: 1. Pre-denaturation at 95 °C for 5 min, followed by 10 cycles of denaturation at 95 °C for 30 s, annealing at 62–52 °C for 30 s (1 °C drop for each cycle), and extension at 72 °C for 30 s. 2. 25 cycles of denaturation at 95 °C for 30 s, annealing at 52 °C for 30 s, then extension at 72 °C for 30 s, followed by a final extension at 72 °C for 20 min. All PCR products were genotyped using capillary electrophoresis on an ABI 3730XL DNA Analyzer. The alleles of all loci were scored relative to LIZ 500, an internal product size standard, with the aid of GeneMarker Version 4.0 (Softgenetics, USA).
Data analyses
The polymorphic information content (PIC) was computed using Cervus 3.0 software [73], with allelic richness (Ar) and intra-population inbreeding coefficients (Fis) calculated using FSTAT 2.9.3.2 software [74]. The percentage of polymorphic loci (PPL), number of private alleles (NP), number of observed alleles (Na), number of effective alleles (Ne), Shannon’s information index (I), observed heterozygosity (Ho), expected heterozygosity (He), fixation index (F), genetic differentiation coefficient (Fst), gene flow (Nm), Nei’s genetic distance (NGD), genetic identity (NGI), F-statistics, Hardy-Weinberg equilibrium (HWE), Mantel test, Analysis of molecular variance (AMOVA), and Principal coordinate analysis (PCoA) were computed with GenAlEx 6.5 software [75]. The population genetic structure was analysed using a Bayesian clustering analysis method conducted in Structure 2.3.4 software [76]. A total of ten independent runs (K = 2–10) was performed with a run length of 1 × 10⁵ Markov Chain Monte Carlo (MCMC) replicates after a burn-in period of 1 × 10⁵ iterations in an admixture model with correlated allele frequency. The ΔK method [77] was employed to select the most appropriate K value and the optimal number of genetic clusters on Structure Harvester V6.0 software [78]. An unweighted pair group method with arithmetic mean (UPGMA) dendrogram was generated from cluster analysis with 1000 bootstrap replications using PHYLIP V3.67 software [79] on the basis of Nei’s genetic distance, which was then used to assess the genetic relationships among populations.
Monmonier’s maximum difference algorithm was used with BARRIER version 2.2 [80] to explore the geographical sites exhibiting maximal genetic discontinuities among populations. Sampling sits were mapped based upon geographical coordinates using this program, with barriers being indicated on the map via assessing maximum values within a population-pairwise genetic distance matrix.
Availability of data and materials
The sequencing data of the 16 polymorphic microsatellite primers were listed in the manuscript, and no other DNA sequences were applied to this study.
Abbreviations
- AFLP:
-
Amplified fragment length polymorphism
- AMOVA:
-
Analysis of molecular variance
- ISSR:
-
Inter simple sequence repeat
- PcoA:
-
Principal coordinate analysis
- RAPD:
-
Random amplified polymorphic DNA
- RFLP:
-
Restriction fragment length polymorphism
- SRAP:
-
Sequence-related amplified polymorphism
- SSR:
-
Simple sequence repeat
References
Stern FC. A study of the genus Paeonia. London: The Royal Horticultural Society; 1946.
Hong DY. Peonies of the world: taxonomy and phytogeography. London, St. Louis: Royal Botanical Gardens Kew Publishing, Kew & Missouri Botanical Garden Press; 2010.
Cheng FY. Advances in the breeding of tree peonies and a cultivar system for the cultivar group. Int J Plant Sci. 2007;1:89–104.
Zhang YL, Han XY, Niu LX, Zhang J, He LX. Analysis of fatty acid in seed oil from nine wild peony species. J Chin Cereals Oils Assoc. 2015;30:72–9.
Yang Y, Luo JT, Zhang BF, Song HX, Liu GL, Zeng XL. Studies on floral characteristics and breeding system of Paeonia decomposita. J Plant Resour Environ. 2015;24:97–104.
Cheng FY, Li JJ, Chen DZ. The natural propagation characteristics of wild tree peony species in China. Acta Hortic Sin. 1997;24:180–4.
Hong DY. Notes on Paeonia decomposita hand.-Mazz. Kew Bull. 1997;52:957–63.
Hong DY, Pan KY. Taxonomical history and revision of Paeonia sect. Moutan (Paeoniaceae). Acta Phytotax Sin. 1999;37:351–68.
Hong DY, Pan KY, Turland JN. Flora of China. Beijing: Science Press and Missouri Botanical Garden Press; 2001.
Hong DY. Paeonia rotundiloba (DY Hong) DY Hong: A new status in tree peonies (Paeoniaceae). J Syst Evol. 2011;49:464–7.
Zhou SL, Zou XH, Zhou ZQ, Liu J, Xu C, Yu J, et al. Multiple species of wild tree peonies gave rise to the ‘King of Flowers’,Paeonia suffruticosa Andrews. Proc R Soc B. 2014;281:20141687.
Li K, Zhou N, Li HY. Composition and function research of peony flowers and peony seeds. Food Res Dev. 2012;33:228–30.
Yang Y, Liu JK, Zeng XL, Wu Y, Song HX, Liu GL. A comparative study on composition of seed oil fatty acids of some wild populations of Paeonia decomposita. Acta Hortic Sin. 2015;42:1807–14.
Han JG, Li XQ, Liu Z, Hu YH. Potential applications of tree peony as an oil plant. J Chinese Grain Oil. 2014;27:21–5.
Hong DY, Zhou SL, He XJ, Yuan JH, Zhang YL, Cheng FY, et al. Current status of wild tree peony species with special reference to conservation. Biodivers Sci. 2017;25:781–93.
Qin HN, Yang Y, Dong SY, He Q, Jia Y, Zhao LN, et al. Threatened species list of China’s higher plants. Biodivers Sci. 2017;25:696–744.
Cohen JI, Williams JT, Plucknett DL, Shands H. Ex situ conservation of plant genetic resources: global development and environmental concerns. Science. 1991;253:866–72.
Ouborg NJ. Integrating population genetics and conservation biology in the era of genomics. Biol Lett. 2010;6:3–6.
Lin QB, Zhou ZQ, Zhao X, Pan KY, Hong DY. Interspecific relationships among the wild species of Paeonia Sect. Moutan DC. based on DNA sequences of Adh gene family. Acta Hortic Sin. 2004;31:627–32.
Meng L, Zheng GS. Phylogenetic relationship analysis among Chinese wild species and cultivars of Paeonia sect. Moutan using RAPD markers. Sci Silvae Sin. 2004;40:110–5.
Zhao X, Zhou ZQ, Lin QB, Pan KY, Hong DY. Molecular evidence for the interspecific relationships in Paeonia sect. Moutan: PCR-RFLP and sequence analysis of glycerol-3-phosphate acyltransferase (GPAT) gene. Acta Phytotax Sin. 2004;42:236–44.
Zhao X, Zhou ZQ, Lin QB, Pan KY, Li MY. Phylogenetic analysis of Paeonia sect. Mountan (Paeoniacease) based on multiple DNA fragments and morphological data. J Syst Evol. 2008;46:563–72.
Zhou ZQ, Pan KY, Hong DY. Advances in studies on relationship among wild tree peony species and the origin of cultivated tree peonies. Acta Hortic Sin. 2003;30:751–7.
Agarwal M, Shrivastava N, Padh H. Advances in molecular marker techniques and their applications in plant sciences. Plant Cell Rep. 2008;27:617–31.
Varshney RK, Graner A, Sorrells ME. Genic microsatellite markers in plants: features and applications. Trends Biotechnol. 2005;23:48–55.
Kumar GS, Singh R, Choudhury DR, Bharadwaj J, Gupta V, Singoded A. Genetic diversity and population structure study of drumstick (Moringa oleifera lam.) using morphological and SSR markers. Ind Crop Prod. 2014;60:316–25.
Aboukhalid K, Machon N, Lambourdière J, Abdelkrim J, Bakha M, Douaik A, et al. Analysis of genetic diversity and population structure of the endangered Origanum compactum from Morocco, using SSR markers: implication for conservation. Biol Conserv. 2017;212:172–82.
Litkowiec M, Lewandowski A, Wachowiak W. Genetic variation in Taxus baccata L.: a case study supporting Poland’s protection and restoration program. Forest Ecol Manag. 2018;409:148–60.
Ni JL, Zhu AG, Wang XF, Xu Y, Sun ZM, Chen JH, et al. Genetic diversity and population structure of ramie (Boehmeria nivea L.). Ind Crop Prod. 2018;115:340–7.
Wu F, Zhang DY, Ma JX, Luo K, Di HY, Liu ZP, et al. Analysis of genetic diversity and population structure in accessions of the genus Melilotus. Ind Crop Prod. 2016;85:84–92.
Xu XX, Cheng FY, Xian HL, Peng LP. Genetic diversity and population structure of endangered endemic Paeonia jishanensis in China and conservation implications. Biochem Syst Ecol. 2016;66:319–25.
Yu HP, Cheng FY, Zhong Y, Cai CF, Wu J, Cui HL. Development of simple sequence repeat (SSR) markers from Paeonia ostii to study the genetic relationships among tree peonies (Paeoniaceae). Sci Hortic. 2013;164:58–64.
Yuan JH, Cheng FY, Zhou SL. Genetic structure of the tree peony (Paeonia rockii) and the Qinling Mountains as a geographic barrier driving the fragmentation of a large population. PLoS One. 2012;7:e34–55.
Tong F, Xie DF, Zeng XM, He XJ. Genetic diversity of Paeonia decomposita and Paeonia decomposita subsp rotundiloba detected by ISSR markers. Acta Bot Boreal-occident Sin. 2016;36:1968–76.
Zhang JJ, Shu QY, Liu ZA, Ren HX, Wang LS, Keyser DE. Two EST-derived marker systems for cultivar identification in tree peony. Plant Cell Rep. 2012;31:299–310.
Gao ZM, Wu J, Liu ZA, Wang LS, Ren HX, Shu QY. Rapid microsatellite development for tree peony and its implications. BMC Genomics. 2013;14:886–96.
Homolka A, Berenyi M, Burg K, Kopecky D, Fluch S. Microsatellite markers in the tree peony, Paeonia Suffruticosa (Paeoniaceae). Am J Bot. 2010;97:e42–4.
Wang JX, Xia T, Zhang JM, Zhou SL. Isolation and characterization of fourteen microsatellites from a tree peony (Paeonia suffruticosa). Conserv Genet. 2009;10:1029–31.
Hou XG, Guo DL, Wang J. Development and characterization of EST-SSR markers in Paeonia suffruticosa (Paeoniaceae). Am J Bot. 2011;98:e303–5.
Hou XG, Guo DL, Cheng SP, ZHANG JY. Development of thirty new polymorphic microsatellite primers for Paeonia suffruticosa. Biol plantarum. 2011;55:708–10.
Wang DX, Ma H, Zhang YL, Duan AA, Li WJ, Li ZH. Paeonia (Paeoniaceae) expressed sequence tag-derived microsatellite markers transferred to Paeonia delavayi. Genet Mol Res. 2013;12:1278–82.
Gilmore B, Bassil N, Nyberg A, Knaus B, Smith D, Barney DL, Hummer K. Microsatellite marker development in peony using next generation sequencing. J Am Soc Hortic Sci. 2013;138:64–74.
Cai CF. High-density genetic linkage map construction and QTLs analyses for phenofypic traits in tree peony. Dissertation for Ph.D. Beijing: Beijing Forestry University; 2015.
Frankham R, Ballou JD, Briscoe DA. Introduction to conservation genetics. Cambridge: Cambridge University Press; 2002.
Su X, Zhang H, Dong LN, Zhang JQ, Zhu XT, Sun K. RAPD classification and identification of Paeonia rockii varieties planted in Gansu Province. Acta Bot Boreal–Occident Sin. 2006;26:696–701.
Suo ZL, Zhang HJ, Zhang ZM, Chen FF, Chen FH. DNA molecular evidences of the inter-specific hybrids between Paeonia rockii and P. suffruticosa based on ISSR markers. Acta Bot Yunnan. 2005;27:42–8.
Liu P, Wang ZC, Shang F. AFLP analysis of genetic diversity of Paeonia suffruticosa cultivars in Henan Province. Acta Hort Sin. 2006;33:1369–72.
Nybom H. Comparison of different nuclear DNA markers for estimating intraspecific genetic diversity in plants. Mol Ecol. 2004;13:1143–55.
Huh M, Huh HW. Patterns of genetic diversity and population structure of the clonal herb, Potentilla fragarioides var. sprengeliana (Rosaceae) in Korea. Acta Bot Sin. 1999;42:64–70.
Barrett SCH, Kohn JR. Genetic and evolutionary consequences of small population size in plants: implications for conservation. In: Falk DA, Holsinger KE, editors. Genetics and conservation of rare plants. New York: Oxford University Press; 1991. p. 3–30.
Peng LP, Cai CF, Zhong Y, Xu XX, Xian HL, Cheng FY, Mao JF. Genetic analyses reveal independent domestication origins of the emerging oil crop Paeonia ostii, a tree peony with a long-term cultivation history. Sci Rep. 2017;7:5340–52.
Zhang JM, López-Pujol J, Gong X, Wang HF, Vilatersana R, Zhou SL. Population genetic dynamics of Himalayan-Hengduan tree peonies, Paeonia subsect Delavayanae. Mol Phylogenet Evol. 2018;125:62–77.
Tansley SA, Brown CR. RAPD variation in the rare and endangered Leuca-dendron elimense (Proteaceae): implications for their conservation. Biol Conserv. 2000;95:39–48.
Hamrick JL, Godt MJW. Allozyme diversity in plant species. In: AHD B, Clegg MT, Kahler AL, Weir BS, editors. Plant Population Genetics, Breeding and Genetic Resources. Sinauer Associates, Sunderland, MA; 1990. p. 43–63.
Grant V. The evolutionary process: a critical study of evolutionary theory. Stud Hist Phil Sci. 1986;17:65–98.
Slatkin M. Gene flow and population structure. In: Real LA, editor. Ecological Genetics. Princeton: Princeton University Press; 1994. p. 3–17.
Yao XH, Ye QG, Kang M, Huang HW. Microsatellites analysis reveals interpopulation differention and gene flow in endangered tree Changiostyrax dolichocarpa (Styracaceae) with fragmented distribution in Central China. New Phytol. 2007;176:472–80.
Setoguchi H, Mitsui Y, Ikeda H, Nomura N, Tamura A. Genetic structure of the critically endangered plant Tricyrtis ishiiana (Convallariaceae) in relict populations of Japan. Conserv Genet. 2011;12:491–501.
Hamrick JL, Godt MW, Sherman-Broyles SL. Factors influencing levels of genetic diversity in woody plant species. New For. 1992;6:95–124.
Wright S. Evolution and the genetics of populations, Vol. 4: Variability within and among natural populations. Chicago: University of Chicago Press; 1978.
Zhang P, Zhou ZC, Jin GQ, Fan HH, Hu HB. Genetic diversity analysis and provenance zone allocation of Schima superba in China using RAPD markers. Scientia Silvae Sinicae. 2006;42:38–42.
Zong XX, Guan JP, Gu J, Wang H, Ma Y. Differentiation on population structure and genetic diversity of pea core collections separately constituted from Chinese land races and international genetic resources. J Plant Genet Resour. 2009;10:347–53.
Tan XJ, Wu ZK, Cheng WD. Association analysis and its application in plant genetic research. Chin Bull Bot. 2011;46:108–18.
Zhang JS, Yang CY, Wu C, Hu ZY, Wang RG, Guo YS, Ren XL. Study on genetic diversity, population structure and specificity of subpopulations of fluecured tobacco germplasm. Acta Tabacaria Sinica. 2012;18:21–49.
Lai GT, Lai ZX, Liu WH, Ye W, Lin YL, Liu SC, et al. ISSR analysis of 3 natural populations of the wild banana distributed in the middle of Fujian province based on NTSYS and STRUCTURE. Chin J Trop Crops. 2014;35:223–31.
Namkoong G. Sampling for germplasm collections. Hort Sci. 1988;23:79–81.
Booy G, Hendriks RJJ, Smulders MJM, Van Groenendael JM, Vosman B. Genetic diversity and the survival of populations. Plant Biol. 2000;2:379–95.
Margules CR, Pressey RL. Systematic conservation planning. Nature. 2000;405:243–53.
Rodrigues L, Berg CVD, Povoa O, Monteiro A. Low genetic diversity and significant structuring in the endangered Mentha cervina populations and its implications for conservation. Biochem Syst Ecol. 2013;50:51–61.
Milligan BG, Leebens-Mack J, Strand AE. Conservation genetics: beyond the maintenance of marker diversity. Mol Ecol. 1994;3:423–35.
Reed DH, Frankham R. Correlation between fitness and genetic diversity. Conserv Biol. 2003;17:230–7.
Heywood VH, Iriondo JM. Plant conservation: old problems, new perspectives. Biol Conserv. 2003;113:321–35.
Kalinowski ST, Taper ML, Marshall TC. Revising how the computer program CERVUS accommodates genotyping error increases success in paternity assignment. Mol Ecol. 2007;16:1099–106.
Goudet J. FSTAT, a program to estimate and test gene diversities and fixation indices (version 2.9.3). Lausanne: Université de Lausanne, Disponívelem: http://www.unil.ch/izea/softwares/fstat.html (accessed 22 Oct 2001); 2001.
Peakall R, Smouse PE. GenAlEx 6.5: genetic analysis in excel. Population genetic software for teaching and research – an update. Bioinformatics. 2012;28:2537–9.
Pritchard JK, Stephens M, Donnelly P. Inference of population structure using multilocus genotype data. Genetics. 2000;155:945–59.
Evanno G, Regnaut S, Goudet J. Detecting the number of clusters of individuals using the software STRUCTURE: a simulation study. Mol Ecol. 2005;14:2611–20.
Earl DA, von Holdt BM. STRUCTURE HARVESTER: a website and program for visualizing STRUCTURE output and implementing the Evanno method. Conserv Genet Resour. 2012;4:359–61.
Felsenstein J. PHYLIP (Phylogeny Inference Package) Version 3.6.7. Seattle, WA: Department of Genome Sciences, University of Washington; 2007.
Manni F, Guerard E, Heyer E. Geographic patterns of (genetic, morphologic, linguistic) variation: how barriers can be detected by using Monmonier’s algorithm. Hum Biol. 2004;76:173–90.
Acknowledgements
I am grateful to related local institutions and staff in Sichuan for providing research permission inside the forests and help to collect experimental materials. I am thankful to Dr. Chaoju Qian for barrier analysis. I am especially appreciative of the editor and reviewers for their valuable comments and suggestions.
Funding
This study was supported by National Natural Science Foundation of China (Grant Nos. 31670345, 31860085) and Hainan Provincial Natural Science Foundation (Grant Nos. 318MS047, 2019RC172). The funders had no role in the design of the study and collection, analysis, interpretation of data and in writing the manuscript.
Author information
Authors and Affiliations
Contributions
S-QW conceived the study, designed the experiments, performed the experiments, analysed the data and wrote the manuscript. The author read and approved the final manuscript.
Corresponding author
Ethics declarations
Ethics approval and consent to participate
Because this study was carried out on an endangered species, I confirmed that I complied with all relevant institutional, national and international guidelines. This study was supported by National Natural Science Foundation of China and Hainan Provincial Natural Science Foundation, including handling these plants and collecting samples.
Consent for publication
Not applicable.
Competing interests
Not applicable.
Additional information
Publisher’s Note
Springer Nature remains neutral with regard to jurisdictional claims in published maps and institutional affiliations.
Supplementary information
Additional file 1: Fig. S1.
The distribution of ΔK over K = 1–10.
Additional file 2: Table S1.
Summary of Private Alleles by Population.
Rights and permissions
Open Access This article is licensed under a Creative Commons Attribution 4.0 International License, which permits use, sharing, adaptation, distribution and reproduction in any medium or format, as long as you give appropriate credit to the original author(s) and the source, provide a link to the Creative Commons licence, and indicate if changes were made. The images or other third party material in this article are included in the article's Creative Commons licence, unless indicated otherwise in a credit line to the material. If material is not included in the article's Creative Commons licence and your intended use is not permitted by statutory regulation or exceeds the permitted use, you will need to obtain permission directly from the copyright holder. To view a copy of this licence, visit http://creativecommons.org/licenses/by/4.0/. The Creative Commons Public Domain Dedication waiver (http://creativecommons.org/publicdomain/zero/1.0/) applies to the data made available in this article, unless otherwise stated in a credit line to the data.
About this article

Cite this article
Wang, SQ. Genetic diversity and population structure of the endangered species Paeonia decomposita endemic to China and implications for its conservation. BMC Plant Biol 20, 510 (2020). https://doi.org/10.1186/s12870-020-02682-z
Received:
Accepted:
Published:
DOI: https://doi.org/10.1186/s12870-020-02682-z