
Abstract
The adsorption results of Cr(VI) removal from aqueous solutions on Litchi chinensis have been optimized by the Box–Behnken design of response surface methodology. Three experimental parameters (dose, temperature, and pH) were chosen as independent variables. The maximum Cr(VI) adsorption was obtained at the initial pH of 2. Analysis of variance (ANOVA) of the results was successfully used to check the significance of the independent variables and their interactions. The three-dimensional (3D) response surface plots were used to study the interactive effects of the independent variables on % Cr(VI) removal. These figures successfully interpret the effect of interaction between pH (0.1–1.0), adsorbent dose (0.1–1.0 g.) and temperature (0–50 °C). The second-order polynomial equation was generated for the response. A statistical hypothesis test was conducted to critically analyze the experimental data by applying t test, paired t test, and Chi-square test. The comparison of t-calculated and t-tabulated values showed that the results were in favour of the conducted experiment.
Introduction
From many times, the presence of heavy metals in the water sources is a serious environmental problem and is dangerous to the human health worldwide. These inorganic pollutants are highly toxic because they are not biodegradable; thus, researches are going on for decades to find some methods to adsorb metal ions from aqueous solution. Among them, chromium has become a serious health concern because it causes many severe diseases. Strong exposure to Cr(VI) causes cancer in the digestive tract and may cause epigastric pain, nausea, vomiting, severe diarrhoea, and haemorrhage (Mohanty et al. 2005). Chromium is one of the contaminants, which exist in hexavalent [Cr(VI)] and also in the trivalent form [Cr(III)] (Rao et al. 2015). Chromium and its compounds are widely used in many industries such as metal finishing, dyeing, pigments, inks, glass, ceramics, tanning, textile, wood preserving, electroplating, steel fabrication, and canning industries (Rao et al. 2015). Chromium (VI) is more toxic to human physiology because of its mutagenic and carcinogenic properties, which may even lead to death (Rao et al. 2015). The chromate (CrO −42 ) and dichromate (Cr2O −72 ) forms of Cr(VI) are extremely hazardous (Eliodorio et al. 2017), and the maximum acceptable limit by various standards has been set (Uddin 2017). Permissible limits for Cr(VI) in drinking water (mg/L) according to various standards are very low: 0.050 (IS 10500) (FAD 25: Drinking Water 2012), 0.050 (WHO) (Uddin 2017), 0.100 (EPA) (Uddin 2017), 0.050 (EU standard) (Wikipedia).
Many processes like precipitation (Esalah and Husein 2008), chemical oxidation (Kaur and Crimi 2014), reverse osmosis (Çimen 2015), electrochemical treatment (Ruotolo et al. 2006), emulsion (Nosrati et al. 2011), ultrafiltration (Muthumareeswaran et al. 2017), photo-catalysis (Machado et al. 2014), ion exchange (Kononova et al. 2009), pre-concentration (Rao and Kashifuddin 2012a), evaporation (Sachitanand et al. 2013), sedimentation (Vukić et al. 2008), adsorption (Khatoon et al. 2018; Naushad et al. 2015; Alqadmi et al. 2016; Uddin and Bushra 2017) have been developed to remove this toxic Cr(VI) from aqueous solution. Out of these methods, adsorption is a widely used and most efficient method to eliminate heavy metals from contaminated water (Rao and Kashifuddin 2012a, b). This technique is superior because of its low cost, ease of operation, efficiency in treatment, good applicability, high capacity, reliability, less energy consumption, and simplicity (Rao and Kashifuddin 2016; Khan et al. 2014). Various effective and low-cost adsorbents have been used for the removal of Cr(VI) recently (Eliodorio et al. 2017; Suriga 2017; Ali et al. 2016; Eldin et al. 2017; Lee et al. 2017; Mullick et al. 2018; Fan et al. 2017; Qi et al. 2016; Panda et al. 2017; Ali et al. 2016; Gorzin and Abadi 2018).
Red- or pink-red-colored smooth fruit peel of litchi tree (Litchi chinensis) covered with small sharp protuberances was successfully utilized as a low cost, efficient, waste adsorbent for the removal of Cr(VI) from wastewater (Rao et al. 2012; Yi et al. 2017). The results of the research studies investigated by Rao et al. 2012 and Yi et al. 2017 concluded that Litchi peel exhibited remarkable adsorption capacity toward Cr(VI) ions, as investigated by the effect of various parameters such as pH, contact time, temperature, adsorbent amount, and initial Cr(VI) concentration. Different isotherms, thermodynamics, and kinetics parameters also showed the effectiveness of Litchi peel to treat hexavalent chromium containing wastewater (Rao et al. 2012).
To confirm the reliability of experimental data, a statistical optimization process that is known as response surface methodology (RSM) was used (Mondal et al. 2017). RSM is a multivariate, computational statistical technique in which the experimental adsorption data were fitted in a second-order polynomial equation, and finally, it was analyzed by performing tests of variance and lack of fit (Mondal et al. 2017). The Box–Behnken design (BBD) is one of the available designs of response surface methodology that is used to optimize the adsorption process (Simsek et al. 2015). It was used in many successful recent studies to validate the experimental results (Mondal et al. 2017; Loqman et al. 2016; Okwadha and Nyingi 2016; Siva Kiran et al. 2017; Igberase et al. 2017; Kavitha and Thambavani 2016; Ma et al. 2016; Wei et al. 2016; Perez et al. 2017). The objective of the present work is to optimize the efficiency of litchi fruit peel in Cr(VI) removal from electroplating wastewater (Rao et al. 2012). The variables like pH, solution temperature, and adsorbent dose were optimized to evaluate the combined and interactive effects of the variables in the process for the removal of chromium ions from aqueous solution.
Materials and experimental methods
The dried peel of Litchi fruit was used in the form of powder to remove the Cr(VI) using the batch experimental procedure, the same as investigated before by Rao et al. 2012. Cr(VI) adsorption experiments were then conducted by defined concentration and volume of the metal ion with different doses of adsorbent (0.1, 0.5, and 1.0 g) at different pH values (2.0, 6.0, and 10.0) and temperatures (30, 40, and 50 °C). Double-distilled water (DDW) was used in all adsorption experiments.
Percent adsorption of hexavalent chromium ion was calculated as follows:
where C0 and Ce are initial and equilibrium concentrations of Cr(VI), respectively.The adsorption capacity of Cr(VI) was calculated as follows:
where m is mass of adsorbent and V is the volume of solution.
Statistical analysis of adsorption data
In order to test the effect of different variables in terms of statistical design for adsorption process, a three-level, three-factorial Box–Behnken methodology (Box and Behnken 1960a, b) was employed to analyze the optimal combination of independent variables resulting in maximum Cr(VI) adsorption capacity. Box–Behnken model may be represented as
where Y is the objective to optimize the response, β0 is the constant coefficient, βi is the linear coefficient, βii is the quadratic coefficient, βij is the interaction coefficient, ɛ is random error, while Xi and Xj are the coded values of the independent process variables. The variables were dose (0.1, 0.5, and 1.0 g), pH value (2.0, 6.0, and 10.0), and temperature (30, 40, and 50 °C). These parameters of adsorption test were considered as independent variables, while the response was percentage Cr(VI) removal. Experimental results were analyzed by estimated determination and regression coefficients using Minitab 17 (statistical software). Analysis of variance (ANOVA) was conducted to test the statistical significance of the designed model. The predicted values were then plotted in surface response and 3D graphs for the final optimization procedure. To verify the prediction model, three experimental units under optimal conditions were performed. Experimental range and various levels of independent variables are listed in Table 1. As shown in Table 1, the three factors (dose, temperature, and pH) chosen for this study were designated as X1, X2, and X3 (coded) and prescribed into three levels as + 1, 0, − 1 for high, intermediate, and low values, respectively.
The applicability of the adsorption process can also be monitored, qualitatively and quantitatively, by applying statistical hypothesis testing (Kaushal and Singh 2016). In this type of statistical analysis, the effect of different factors like pH value, time, and concentration on % adsorption of Cr(VI) was examined. In each case, the null hypothesis (Ho: µ1 = µ2) was assumed that the factors did not effect on the % adsorption, while the alternative hypothesis (Ha: µ1 > µ2) was assumed that the experimental parameters were effective and caused an increase in % adsorption. The analysis was tested using t test, paired t test, and Chi-square test within 5% level of confidence.
Results and discussion
Response surface methodology and statistical analysis
Box–Behnken design
The Box–Behnken experimental design is a very powerful tool to determine the optimal level of process parameters with less number of experiments when compared with other designs of experimental models. In this paper, the selected variables (temperature, dose, and pH) were taken for optimization. The design matrix of experimental results by putting all three independent variables, in their reaction conditions, and their observed response values are (given in Table 2). A comparison of observed and predicted Cr(VI) percentage removal is also given in the same Table 2. The difference between the values is less, indicating that the experimental values are quite accurate and have reliability with the predicted values.
The empirical model equation for Cr(VI) adsorption performance of Litchi chinensis was then generated and can be described by the following equation:
The linear term of coefficients \( X_{1} {\text{and}} X_{2} \) showed positive, favorable, and a significant effect on the response, while X3 showed a negative effect, which is opposite, if compared, to quadratic terms in which \( X_{1}^{2} {\text{and}} X_{2}^{2} \) showed negative, while \( X_{3}^{2} \) showed a positive effect on the response (Y). Interaction terms (\( X_{1} X_{2} , X_{1} X_{3} \)) of the same parameter indicated positive and favorable effect, while X2X3 showed negative and unfavorable effect on percentage removal of Cr(VI).
To determine the interaction effects of independent variables on Cr(VI) adsorption onto L. chinensis, an ANOVA (analysis of variance) test was also performed as shown in Table 3. The results of ANOVA demonstrated that the effect of various factors on Cr(VI) adsorption was highly significant in describing the observed experimental data as per model F value of 44.45 and low p value (0.000). Table 4 also indicates that all of the study factors have significant linear effects as \( X_{1} {\text{and}} X_{2} \) have positive effects. The good quality of the developed model can also be judged and confirmed by the high value of model coefficients of determination coefficient (R2 = 0.987) (Table 4). The normal probability plot of the residuals is one of the most important diagnostic tools to determine the systematic departures from the assumption that errors have a normal distribution (Yetilmezsoy et al. 2009). Figure 1 of the plot indicates that the most of the data points in the analysis are close to the straight-line means the ideal normal distribution of the experimental data and support the well fitting of experimental results. Figure 2 shows three-dimensional (3D) response surface plots as a function of two variables is the best way to identify the interaction effects of each other. The interactive effect of the combination of independent variables (dose, temperature, and pH) on Cr(VI) percentage adsorption, is shown in Fig. 2a, b. Figure 2a shows the 3D response surfaces representing the influence of adsorbent dose and temperature on Cr(VI) removal, while Fig. 2b represents the influence of adsorbent dose and pH on Cr(VI) removal by L. chinensis. It is clear from Fig. 2a, b that adsorbent dosage had a significant effect which led to increase percentage Cr(VI) removal up to maximum along with increasing temperature and decreasing pH. This finding of increase in Cr(VI) adsorption (%) with decrease in solution pH and maximum at pH 2 is common which is supported by loads of previous studies of Cr(VI) adsorption (Rao et al. 2012, 2015; Mullick et al. 2018; Mondal et al. 2017; Mohanty et al. 2005; Lamhamdi et al. 2017; Igberase et al. 2017). It can also be understand by the speciation of Cr(VI) (adsorbate) ion, as solution pH is an important parameter in Cr(VI) adsorption. At pH 2, Cr(VI) ion exists in solution in the form of HCrO4− (Doke and Khan 2017; Yang et al. 2009), which could adsorb on protonated surface sites of the adsorbent by electrostatic attraction mechanism, and leads to increase in adsorption. At high pH (more than 6), the existence form of hexavalent chromium is CrO42− and surface becomes less protonated that leads to decrease in Cr(VI) adsorption, also due to exchange of Cr(VI) ions with predominant OH− ions (Rao et al. 2015; Yang et al. 2009). These results confirmed that electrostatic attraction or ion exchange process between the surface and species was the main adsorption mechanism for Cr(VI) uptake. The increase in Cr(VI) removal with the increase in temperature indicated the endothermic process, which means the chemical change with absorption of heat. The same results were experimented using L. chinensis by a batch process in previous studies (Rao et al. 2012; Yi et al. 2017).

Normal probability plot

a 3D surface plot of response (Y) vs adsorbent dosage (X1) and solution temperature (X2). b 3D surface plot of response (Y) vs adsorbent dosage (X1) and pH (X3)
Hypothesis testing
The hypothesis testing was conducted: (1) to judge the optimum value of pH, concentration and time for maximum Cr(VI) removal from solution, (2) to judge the success of the experiment by checking higher R2 value, (3) to infer that the higher adsorbent dosage resulted in higher % removal of chromium ions.
In this subsection, the testing hypothesis analysis of the experimental data of pH effect is under consideration. Upon using statistical hypothesis tests, it can confirm that from the result of pH study (Rao et al. 2012), the optimal pH value for maximum removal of Cr(VI) ions from the water solution was 2. To further analyze this, a two-tailed t test was used for the obtained experimental data as shown in Table 5.
-
(a)
To describe the hypothesis testing process qualitatively and quantitatively, the following statistical assumptions were made:
\( {\text{null }}\,{\text{hypothesis }}\left( {H_{0} } \right): \) the optimum pH for Cr(VI) adsorption was 2, and alternate hypothesis (Ha): the optimum pH \( \ne \) 2. It was determined with significance level α = 0.05 and (n − 1) degree of freedom.
Upon using the two-tailed t-test with a degree of freedom 4 using formula \( t = \frac{{\overline{X} - \mu }}{{\frac{S}{\sqrt n }}} \) (Hogg and Craig 2014), it was found that \( t_{\text{calculated}} {\text{was}} - 2.757\, {\text{while}} \,t_{\text{tabulated}} = \pm \,2.776, \) which means that tcalculated < ttabulated. This result of hypothesis testing confirms that null hypothesis H0 can be accepted (that the optimum pH of Cr(VI) adsorption was 2), which also in accordance with the experimental result. Figure 3 shows probability chart for t distribution for testing.
Fig. 3 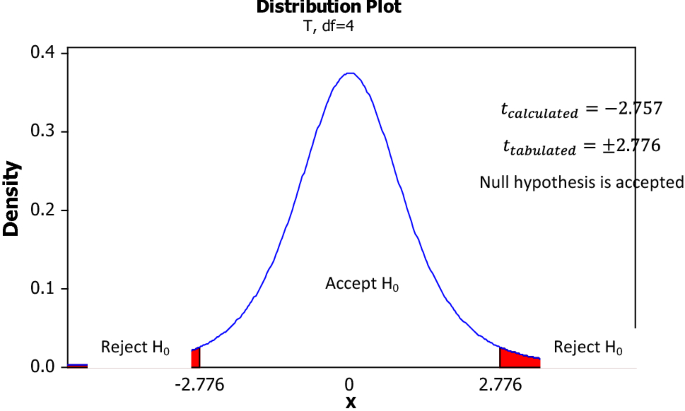
Probability chart for t distribution for two-tailed test
-
(b)
Paired t test was used to test the hypothesis of matched pairs of concentration effect (before and after the adsorption experiment), as shown in Table 6. It was assumed that
Table 6 Cr(VI) ion concentrations in the solution before (Xi) and after (Yi) the experiment H0: no changes in the final concentration of Cr(VI) ions after adsorption experiment.
Ha: Successful adsorption was achieved after the experiment.
The calculations have been done using the formula: \( t = \left( {D^{ - } - \mu } \right)/\left( {S/\surd n} \right) \) (Hogg and Craig 2014), at 6 degree of freedom. It was found that tcalculated (4.056) > ttabulated (± 2.447), which means that the null hypothesis can be rejected and alternative hypothesis (that the adsorption experiment was successfully achieved) can be accepted. Figure 4 shows the probability chart for t distribution for paired t test.
Fig. 4 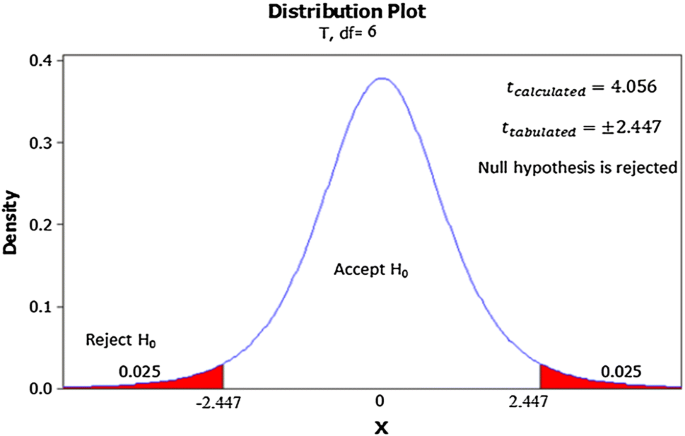
Probability chart for t distribution for paired t test
-
(c)
Chi-square test was applied to test the effectiveness of time on final concentration and equilibrium capacity. To describe this statistically, the assumptions were
H0: There was no effect of time on initial concentration
Ha: Adsorption was rapid, and equilibrium adsorption capacity (qe) increased with the increase in concentration
Under significance level α = 0.05 and using the experimental data (as shown in Table 7), the formula \( \chi^{2} = \mathop \sum \nolimits_{i = 1}^{n} \frac{{\left( {O_{ij} - E_{ij} } \right)^{2} }}{{E_{ij} }} \) (Hogg and Craig 2014) was used to conduct Chi-square test. It was found that \( \chi_{\text{calculated}}^{2} = 0.8220 < \chi_{\text{tabulated }}^{2} = 32.3600 \). Hence, the null hypotheses did not fall in the accepted region and cannot be accepted, which also means that the alternative hypothesis Ha can be accepted at value level of 0.05. It means that adsorption of Cr(VI) was fast and equilibrium capacity (qe) increased with the increase in Cr(VI) concentration and reached equilibrium in short time (Fig. 5).
Table 7 Observed frequencies on the effect of time (min) and concentration (mg/L) for the Cr(VI) ion equilibrium adsorption capacity (qe) Fig. 5 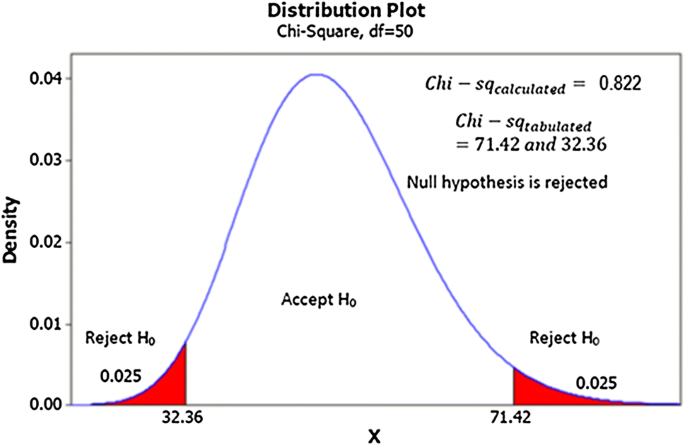
Probability chart for Chi-square distribution


Conclusion
In total, 96% Cr(VI) from polluted water can be removed using the fruit peel of L. chinensis by a batch process, which demonstrated its efficient analytical applicability. Critical analysis of the interactive effects of independent variables: initial pH of the solution, dose, and temperature for better understanding of Cr(VI) adsorption onto L. chinensis was successfully studied by Box–Behnken design. The results showed that the values of R2 and adjusted R2 were quite close to each other, indicated that the model analyzed the experimental data quite well. The linear terms (X1, X2, X3), square values (X 21 , X 22 , and X 23 ), and their two-way interaction (X1X2, X2X3) were found to be significant with low P values, suggesting that these variables have important role in Cr(VI) removal. Hypothesis testing was further studied to confirm the fitting of experimental results. Two-tailed t test, paired t test, Chi-square test within 5% level of confidence were tested, and the results showed that the calculated values were inside the acceptance region in probability chart. Experimental and predictable data of adsorption experiments were close to each other which also confirmed that L. chinensis was an excellent adsorbent to bind Cr(VI) ion.
References
Ali A, Saeed K, Mabood F (2016) Removal of chromium (VI) from aqueous medium using chemically modified banana peels as efficient low-cost adsorbent. Alexandria Eng J 55:2933–2942
Alqadmi A, Naushad Mu, Ahamad T, Abdalla MA, Al-Othman ZA, AlShehri SM (2016) Synthesis and characterization of Fe3O4@TSC nanocomposite: highly efficient removal of toxic metal ions from aqueous medium. RSC Adv 6:22679–22689
Box GEP, Behnken DW (1960a) Simplex-sum designs: a class of second order rotatable designs derivable from those of first order. Ann Math Stat 31:838–864
Box GEP, Behnken DW (1960b) Some new three level designs for the study of quantitative variables. Technometrics 2:455–475
Çimen A (2015) Removal of chromium from wastewater by reverse osmosis. Rus J Phys Chem A 89(7):1238–1243
Doke KM, Khan EM (2017) Equilibrium, kinetic and diffusion mechanism of Cr(VI) adsorption onto activated carbon derived from wood apple shell. Arab J Chem 10:S252–S260
Drinking water [FAD 25: Drinking Water] (2012) Indian standard drinking water-specification (second revision) ICS 13.060.20 IS 10500
Eldin MSM, Al-bogami AS, Aly KM, Khan ZA, Mekky AEM, Saleh TS, Hakamy AAW (2017) Removal of chromium (VI) metal ions using Amberlite IRA-420 anions exchanger. Desalin Water Treat 60:335–342
Eliodorio KP, Andolfatto VS, Martins MRG, de Sá BP, Umeki ER, de Araújo Morandim-Giannetti A (2017) Treatment of chromium effluent by adsorption on chitosan activated with ionic liquids. Cellulose 24(6):2559–2570
Esalah J, Husein MM (2008) Removal of heavy metals from aqueous solutions by precipitation-filtration using novel organo-phosphorus ligands. Sep Sci Technol 43(13):3461–3475
Fan S, Wang Y, Li Y, Tang J, Wang Z, Tang J, Li X, Hu K (2017) Facile synthesis of tea waste/Fe3O4 nanoparticle composite for hexavalent chromium removal from aqueous solution. RSC Adv 7:7576–7590
Gorzin F, Abadi MMBR (2018) Adsorption of Cr(VI) from aqueous solution by adsorbent prepared from paper mill sludge: kinetics and thermodynamics studies. Adsorp Sci Tech 36:149–169
Hogg RV, Craig A (2014) Introduction to mathematical statistics, 7th edn. Pearson Education Limited. https://en.wikipedia.org/wiki/Drinking_water_quality_standards. Accessed 18 Jan 2012
Igberase E, Osifo P, Ofomaja A (2017) Chromium (VI) ion adsorption by grafted cross- linked chitosan beads in aqueous solution—a mathematical and statistical modeling study. Environ Technol 38:3156–3166. https://doi.org/10.1080/09593330.2017.1290152
Kaur K, Crimi M (2014) Release of chromium from soils with persulfate chemical oxidation. Groundwater 52:748–755
Kaushal A, Singh S (2016) Critical analysis of adsorption data statistically. Appl Water Sci. https://doi.org/10.1007/s13201-016-0466-4
Kavitha B, Thambavani SD (2016) Kinetics, equilibrium isotherm and neural network modeling studies for the sorption of hexavalent chromium from aqueous solution by Quartz/Feldspar/Wollastonite. RSC Adv 6:5837–5847
Khan MA, Uddin MK, Bushra R, Ahmad A (2014) Synthesis and characterization of polyaniline Zr(IV) molybdophosphate for the adsorption of phenol from aqueous solution. React Kinet Mech Catal 113:499–517
Khatoon A, Uddin MK, Rao RAK (2018) Adsorptive remediation of Pb(II) from aqueous media using Schleichera oleosa bark. Environ Technol Innov 11:1–14
Kononova ON, Shatnykh KA, Prikhod’ko KV, Kashirin DM (2009) Ion-exchange recovery of gold(I) and silver(I) from thiosulfate solutions. Rus J Phys Chem A 83(13):2340–2345
Lamhamdi A, Lamhamdi A, Razzouki B, Mejdoubi EM, Al Zabadi H, Ellouzi K, Azzaoui K, Hamed O, Bouhlassa S, Jodeh S (2017) Adsorption of chromium (VI) on calcium phosphate: mechanisms and stability constants of surface complexes. Appl Sci 7:1–14
Lee CG, Lee S, Park JA, Park C, Lee SJ, Kim SB, An B, Yun ST, Lee SH, Choi JW (2017) Removal of copper, nickel and chromium mixtures from metal plating wastewater by adsorption with modified carbon foam. Chemosphere 166:203–211
Loqman A, El Bali B, Lützenkirchen J, Weidler PG, Kherbeche A (2016) Adsorptive removal of crystal violet dye by a local clay and process optimization by response surface methodology. App Water Sci. https://doi.org/10.1007/s13201-016-0509-x
Ma X, Li D, Wu Z, Zhang H, Chen X, Liu Z (2016) Mercury removal by adsorption on pectin extracted from sugar beet pulp: optimization by response surface methodology. Chem Eng Technol 39:371–377
Machado TC, Lansarin MA, Matte N (2014) Reduction of hexavalent chromium: photocatalysis and photochemistry and their application in wastewater remediation. Water Sci Technol 70(1):55–61
Mohanty K, Jha M, Meikap BC, Biswas MN (2005) Removal of chromium (VI) from dilute aqueous solutions by activated carbon developed from Terminalia arjuna nuts activated with zinc chloride. Chem Eng Sci 60:3049–3059
Mondal NK, Samanta A, Dutta S, Chattoraj S (2017) Optimization of Cr(VI) biosorption onto Aspergillus niger using 3-level Box–Behnken design: equilibrium, kinetic, thermodynamic and regeneration studies. J Genet Eng Biotechnol. https://doi.org/10.1016/j.jgeb.2017.01.006
Muthumareeswaran MR, Alhoshan M, Agarwal GP (2017) Ultrafiltration membrane for effective removal of chromium ions from potable water. Sci Rep 7:41423
Naushad M, Ahamad T, Al-Othman ZA, Shar MA, Al-Hokbany NS, Alshehri SM (2015) Synthesis, characterization and application of curcumin formaldehyde resin for the removal of Cd2+ from wastewater: kinetics, isotherms and thermodynamic studies. J Ind Eng Chem 29:78–86
Nosrati S, Jayakumar NS, Hashim MA (2011) Extraction performance of chromium (VI) with emulsion liquid membrane by Cyanex 923 as carrier using response surface methodology. Desalination 266:286–290
Okwadha GDO, Nyingi PW (2016) Effectiveness of rice husk ash in stabilizing Kenyan red coffee soil for road subgrades construction. Int J Environ Sci Technol 13:2731–2734
Panda H, Tiadi N, Mohanty M, Mohanty CR (2017) Studies on adsorption behavior of an industrial waste for removal of chromium from aqueous solution. S Afr J Chem Eng 23:132–138
Perez JVD, Nadres ET, Nguyen HN, Dalida MLP, Rodrigues DF (2017) Response surface methodology as a powerful tool to optimize the synthesis of polymer-based graphene oxide nanocomposites for simultaneous removal of cationic and anionic heavy metal contaminants. RSC Adv 7:18480–18490
Qi W, Zhao Y, Zheng X, Jia M, Zhang Z (2016) Adsorption behavior and mechanism of Cr(VI) using Sakura waste from aqueous solution. Appl Surface Sci 360:470–476
Rao RAK, Kashifuddin M (2012a) a Adsorption Properties of Coriander Seed Powder (Coriandrum sativum): extraction and Pre-concentration of Pb(II), Cu(II) and Zn(II) Ions from Aqueous Solution. Adsorpt Sci Technol 30:127–146
Rao RAK, Kashifuddin M (2012b) Pottery glaze—an excellent adsorbent for the removal of Cu(II) from aqueous solution. Chin J Geochem 31:136–146
Rao RAK, Kashifuddin M (2016) Adsorption studies of Cd (II) on ball clay: comparison with other natural clays. Arab J Chem 9:S1233–S1241
Rao RAK, Rehman F, Kashifuddin M (2012) Removal of Cr(VI) from electroplating wastewater using fruit peel of Leechi (Litchi chinensis). Desalin Water Treat 49:136–146
Rao RAK, Ikram S, Uddin MK (2015) Removal of Cr(VI) from aqueous solution on seeds of Artimisia absinthium (novel plant material). Desalin Water Treat 5412:3358–3371
Ruotolo LAM, Santos-Júnior DS, Gubulin JC (2006) Electrochemical treatment of effluents containing Cr(VI). Influence of pH and current on the kinetic. Water Res 40:1555–1560
Sachitanand R, Sattari M, Svensson JE, Froitzheim J (2013) Evaluation of the oxidation and Cr evaporation properties of selected FeCr alloys used as SOFC interconnects. Int J Hydro Energy 38:15328–15334
Simsek EB, Tuna AOA, Beker U (2015) A statistical approach for arsenic adsorption onto Turkey clinoptilolite. Environ Sci Pollut Res 22:3249–3256
Siva Kiran RR, Madhu GM, Satyanarayana SV, Kalpana P, Rangaiah GS (2017) Applications of Box–Behnken experimental design coupled with artificial neural networks for biosorption of low concentrations of cadmium using Spirulina (Arthrospira) spp. Resour Eff Technol 3:113–123
Suriga CL (2017) Catalytic oxidation of dye waste water by biomass charcoal loaded multiple rare earth composite material. IOP Conf Ser Mater Sci Eng 167:1–7
Uddin MK (2017) A review on the adsorption of heavy metals by clay minerals, with special focus on the past decade. Chem Eng J 308:438–462
Uddin MK, Bushra R (2017) Synthesis and characterization of composite cation-exchange material and its application in removing toxic pollutants. In: Anjum N, Gill S, Tuteja N (eds) enhancing cleanup of environmental pollutants. Springer, Cham
Vukić LM, Gvero PM, Maksimović MD (2008) Gravitational sedimentation—an efficient chromium removal method from the tanning industry wastewaters. Acta Periodica Technologica 39:1–212
Wei F, Wu B, Zhang J, Zhang W (2016) Modification of abandoned fine blue-coke: optimization study on removal of p-nitrophenol using response surface methodology. RSC Adv 6:13537–13547
Mullick A, Moulik S, Bhattacharjee S (2018) Removal of hexavalent chromium from aqueous solutions by low-cost rice husk-based activated carbon : kinetic and thermodynamic studies. Indian Chem Eng 60:58–71
Yang ZH, Wang B, Chai LY, Wang YY, Wang HY, Su CQ (2009) Removal of Cr(III) and Cr(VI) from aqueous solution by adsorption on sugarcane pulp residue. J Cent South Univ Technol 16:0101–0107
Yi Y, Lv J, Liu Y, Wu G (2017) Synthesis and application of modified Litchi peel for removal of hexavalent chromium from aqueous solutions. J Mol Liq 225:28–33
Acknowledgements
The corresponding author is thankful to Deanship of Scientific Research, Majmaah University, Al-Majmaah, for funding this research. This research work was conducted under research Project Number 37/61.
Author information
Authors and Affiliations
Corresponding author
Additional information
Publisher’s Note
Springer Nature remains neutral with regard to jurisdictional claims in published maps and institutional affiliations.
Rights and permissions
Open Access This article is distributed under the terms of the Creative Commons Attribution 4.0 International License (http://creativecommons.org/licenses/by/4.0/), which permits unrestricted use, distribution, and reproduction in any medium, provided you give appropriate credit to the original author(s) and the source, provide a link to the Creative Commons license, and indicate if changes were made.
About this article

Cite this article
Uddin, M.K., Salah, M.M. Statistical analysis of Litchi chinensis’s adsorption behavior toward Cr(VI). Appl Water Sci 8, 140 (2018). https://doi.org/10.1007/s13201-018-0784-9
Received:
Accepted:
Published:
DOI: https://doi.org/10.1007/s13201-018-0784-9