
Abstract
An attempt has been made to understand the hydrochemistry of Moradabad city, a major industrial town of western Uttar Pradesh. For this purpose a total of 188 samples for both the seasons (pre- and post-monsoon of 2012 and 2013) were collected and analyzed for major cations (Na+, K+, Ca2+ and Mg2+) and anions (Cl−, HCO3 −, SO4 −, NO3 − and F−) and 14 samples collected in 2013 were analyzed for trace elements. The groundwater is slightly acidic to alkaline in nature and moderately hard to very hard. Elevated concentration of most of the major ions and trace elements is observed in the area. On the basis of Piper Trilinear plot groundwater has been identified as Na–Cl–SO4 type in pre-monsoon and Na–HCO3 type in post-monsoon season. Base-exchange indices along with meteoric genesis indices demonstrate that groundwater in all the four seasons belong to alkali bicarbonate type and are of shallow meteoric water percolation type. The concentration of the trace elements like (Al, Fe, Se and As) is higher than the permissible limits. Correlation of SiO2 with Cl and TDS was done to assess the processes responsible for altering the groundwater chemistry. Water quality index maps show that the groundwater in the north eastern and central parts of the study area is unsuitable for drinking purpose. A comparison of spatial distribution of EC and Cl with those of WQI depicts a strong correlation. The study, thus, suggests the poor groundwater quality of Moradabad city. Urban sprawl, population explosion, industrial expansion heavily affected the water quality of the study area.
Introduction
Groundwater quality assessment is important as increasing urbanization, industrialization, population explosion putting tremendous pressure on groundwater resources and risk of contamination (Ackah et al. 2011; Sayyed and Wagh 2011; Tiwari 2011). The consumption of groundwater for various purposes such as drinking, domestic, agricultural or for industrial use is dependent on the chemical composition of groundwater, thus an understanding of the geochemical composition of groundwater is necessary for the sustainable development of water resources. The chemistry of groundwater system of a particular area is unique which may be altered chemically depending upon several factors such as soil–water interaction, dissolution of mineral species and anthropogenic impacts (Stallard and Edmond 1983; Faure 1998; Subba Rao 2001; Umar and Absar 2003).
The slow percolation of groundwater flowing through rocks results in dissolution of minerals and equilibrium can be reached between groundwater and the minerals. The dissolution of minerals in groundwater describes its chemical behavior. Precipitation and infiltration of water are the two important processes determining the chemistry of a groundwater system. The organic compounds present in the soil zone make water more acidic in nature and this causes the exchange of various elements between water and the surrounding rocks (Deutsch 1997).
The main factors that control groundwater chemistry include rock forming minerals and soils of the area, climate, and vegetation cover. These factors are also responsible for the spatial and temporal variations in groundwater chemistry (Rajmohan and Elango 2004). Groundwater contamination occurs when the contamination loaded on the ground surface exceed the detoxification capacity of soil, bypass the protective soil horizon and reach the groundwater table (Khan et al. 2015). Pollution once entered into the groundwater system remains concealed for many years, rendering its unsuitability for human consumption (Raju 2012). Groundwater problems and its quality are more severe in densely populated and highly industrialized areas. A substantial alteration in groundwater chemistry occurs due to contaminants arising from various agricultural activities such as excessive use of fertilizers, pesticides, insecticides (Kelly 1997; Stigter et al. 1998; Kraft et al. 1999). The rapid growth of urban centres deteriorates the groundwater quality at a faster pace due to improper disposal of industrial waste without prior treatment and irregular utilization of groundwater resources (Jameel and Sirajudeen 2006). The study conducted by Misra (2011) shows the impact of urbanization on hydrology of Ganga basin indicating a potential effect on environment, water resources and its quality, soil salinity and urban infrastructures.
Trace elements are also the persistent pollutants degrading water quality. Trace elements though very minute in concentration are a threat to the environment and also contaminate groundwater system by continuous leaching thus posing serious health risk to environment and humans as well. Aquifer material, quality of recharge water and the interaction between water and aquifer material are some of the natural factors on which the distribution of trace elements depend upon. Apart from these natural factors human activities also contribute in the distribution of trace elements which are responsible to alter the groundwater system (Helena et al. 2000).
A number of detailed studies on groundwater quality, heavy metals in groundwater, major ion chemistry and the processes controlling groundwater chemistry have been carried out in different parts of India (Umar and Absar 2003; Thilagavathi et al. 2012; Singh et al. 2012a, b; Senthilkumar and Elango 2013; Kumar et al. 2014; Rai and Saha 2015). Similar studies have also been made in the Ganga Plain (Umar et al. 2000, 2006, 2009; Raju et al. 2009; Saha 2009).
A study has been carried out by Lapworth et al. (2014) to investigate the response of groundwater resources to agricultural activity in Punjab state. The study reveals the declining trend in shallow groundwater levels in pre-monsoon season. Higher concentration of NO3 and Cl and median concentration of Pb, Cr, Cu, Ni and Zn in shallow groundwater is observed in comparison to deep groundwater. Further the study suggests that shallow aquifer is vulnerable to contamination from both agricultural and urban sources particularly for NO3 and heavy metals.
The hydrochemical analysis of groundwater samples both from shallow and deep aquifers carried out by Krishan et al. (2014) in Bist-Doab catchment, Punjab, reveals the higher concentration of various ions in shallow groundwater compared to deep groundwater and also suggest good quality of water in terms of trace elements (Cr, Mn, Fe). However, NO3 and few trace elements (B, Zn, Pb and Cu) at some sites indicate contamination in shallow aquifers. The concentration of uranium is high both in shallow as well as deep aquifers.
In another study, the impact of anthropogenic activities on groundwater quality in Punjab state has been discussed by Purushothaman et al. (2013) and Singh et al. (2012a, b). High concentration of NO3, SO4 and Cl were reported in the study suggesting the deterioration of groundwater quality by land use activities, synthetic fertilizers, and irrigation return flow.
The background given above has created the need to carry out present study in Moradabad city. Moradabad city is one of the most populous city of Uttar Pradesh and also one of the largest producing and exporting centre of brass-wares in India. The rapid development in recent decades has an adverse impact on the quality of groundwater. Keeping in view the frequent degradation of water quality, the present study has been done to decipher the chemical variations in groundwater by various natural and anthropogenic factors to assess the suitability of groundwater for drinking purpose. Conventional graphical representations and indices are used to classify the groundwater of the area into various groups. Water Quality Index maps have also been prepared.
Study area
The study area, Moradabad city lies between two rivers namely river Ramganga at its north eastern margin and Gagan at south eastern margin. It lies between the latitude 28°47′ to 28°53′N and 78°44′ to 78°49′E covering an area of about 88 km2 (Fig. 1).

Map showing sampling locations
Moradabad is a major industrial city and is famous for its huge export of brass handicrafts and is also called “Brass City”. Moradabad city in several years has undergone rapid industrial development. There were 82 registered units in the district in year 2000 and this figure has increased to 5487 in 11 years i.e. from 2001 to 2011 (DIC, Moradabad). There are about 600 export units and 5000 industries in Moradabad district.
The area falls in the sub tropical region and the climate is classified as tropical to sub tropical type. The climate is characterized by a hot summer and bracing cold winter associated with general dryness, except during the south west monsoon when humidity is high. The rainy season extends from end of June to September or part of October. About 86 % of rainfall takes place from June to September. During monsoon surplus water is available for deep percolation to groundwater. The average annual rainfall is 967 mm.
The study area forms a part of Central Ganga Plain and is underlain by alluvial deposits of Quaternary age. This alluvium is a pile of unconsolidated sediments made up of sequence of clay, silt, calcareous nodules, locally known as Kankar and different grades of sand and occurrence of gravel at depth is also occasionally reported. Calcareous nodules, indicative of sedimentation gaps, occur as thin beds and lenses. The Central Groundwater Board has carried out six exploratory drilling to decipher subsurface aquifer geometry, to determine the aquifer parameters and quality of subsurface water. The sediments down to 390 m can be broadly divided into two aquifer groups. The upper aquifer extending to a depth of 180 m is being exploited extensively by state and private tubewells. The second potential aquifer group below 180 m depth, still remains to be fully harnessed for optimum utilization. The cumulative thickness of screened granular zones in these aquifer groups varies from 36 to 112 m. The average yield varies from 1445 to 5220 lpm for drawdown ranging from 1.85 to 8.7 m (CGWB 2008).
Subsurface lithological data available from shallow boreholes to a maximum depth of 130 m bgl of the area indicate that top clay layer is persistent throughout the area and is underlain by more porous granular zone intervened by several clay lenses. Depth to water level varies from 3.2 to 13.7 m bgl and from 3.8 to 12.1 m bgl in pre- and post-monsoon season 2012, respectively. The general flow direction of groundwater is from north west to south east with some local diversions.
Landuse/land cover mapping of the area has been done to identify the changes in land cover patterns (Fig. 2a, b). For this purpose, toposheet of 1971 covering the study area and Google Earth imagery of 2013 were used. The area has been categorized into three main land use classes. A comparison of Fig. 2a, b reveal that the area covered by settlements has increased substantially during the period from 1971 to 2013. Area occupied by plantations in north eastern part has also increased. However, the reduction in the area occupied by waste land in the period between 1971 and 2013 has been observed. The increase in the settlements in the study area is due increase in industrialization and urbanization which has potential impact on hydrogeological regime of the area.

Land use/Land cover map prepared from a Toposheet (1971) and b Google Earth imagery (2013)
Methodology
A total of 188 groundwater samples, 47 for each season (pre- and post-monsoon seasons) of 2012 and 2013 were collected from hand pumps in well rinsed 1-L polyethylene bottles to evaluate the variation in chemical composition of groundwater. All the samples were collected after 3–5 min pumping of the well to remove the stagnant water in the well assembly. Electrical conductivity (EC), total dissolved solids (TDS) by Hach sensION+ EC5 Portable Conductivity Meter and pH were measured using Hach sensION portable pH meter. The groundwater samples were then analyzed for major ions: cations (Ca, Mg, Na and K) anions (Cl, SO4, HCO3 and NO3) following the standard methodologies (APHA 1992). Hardness and calcium were determined by titration method using EDTA; bicarbonate was determined by titration using HCl; chloride was determined using AgNO3 in titration method; sodium and potassium were measured by flame emission photometry, sulphate was analyzed by gravimetric method; nitrate was determined by colorimetric method using phenol disulphonic acid and fluoride were measured by the spectrophotometer using SPADNS [sodium 2-(parasulfophenylazo)-1,8-dihydroxy-3,6-naphthalene disulfonate)]. Silica was analyzed by blue molybdenum silicate method.
Samples collected for trace element analysis were filtered and acidified with HNO3. A set of trace elements like Al, Cr, Fe, Co, Ni, Cu, Zn, As, Se, Cd, and Pb were analysed at Geochemistry Laboratory, NGRI, Hyderabad, India using Inductively Coupled Plasma Mass Spectrometer (ICP-MS). Calibration of the instrument was performed using the certified reference material NIST 1640a (National Institute of Standards and Technology, USA), to minimize matrix and other associated interference effects. Another certified reference material for trace elements in water NIST 1643e (National Institute of Standards and Technology, USA) was analyzed as an unknown to check the precision and accuracy of the analysis. Blanks were analyzed along with the samples and corrections were carried out accordingly. The Relative standard deviation (RSD) was found to be better than 6 % in the majority of the cases, which indicates that the precision of the analysis is reasonably good (Satyanarayanan et al. 2007). Filtered sample was then introduced into the instrument conventional pneumatic nebulization, using a peristaltic pump with a solution uptake rate of about 1 ml/min (Balaram and Rao 2003).
Result and discussion
Temporal variation trends of major ions
Results of the water analysis for pre- and post-monsoon samples for the year 2012 and 2013 (Table 1a, b) have been used to identify the processes and mechanisms affecting the groundwater chemistry of the study area.
A summary of chemical trends of major ions over pre- and post-monsoon 2012 and 2013 seasons is presented in Table 2 and the order of dominance of major cations and anions is shown in Table 3. The significant characteristics of major ions are given below:
-
Groundwater of the study area is acidic to slightly alkaline in nature (6.1 to 8.2 in pre-monsoon 2012 and 2013) and 6.6 to 8 in post-monsoon 2012 and 2013.
-
The average EC values in the area range between 190 to 2950 µS/cm and 151 to 2025 µS/cm in pre- and post-monsoon, 2012, respectively. In pre- and post-monsoon 2013, EC values range between 106 to 952 µS/cm and 152 to 947 µS/cm, respectively.
-
TDS is an important parameter in water quality assessment which in the study area range from 122 to 1890 mg/l and 97 to 1296 mg/l in pre- and post-monsoon season of 2012. The spatial distribution maps of TDS are given in Fig. 3a, b, depicting two high TDS zones. One high TDS zone is in the central part of the area where TDS is >1000 mg/l, the other high TDS zone is in north western part with TDS ranging from 800 to 1200 mg/l. During post-monsoon season (November), only one sample has TDS >1000 mg/l.
Fig. 3 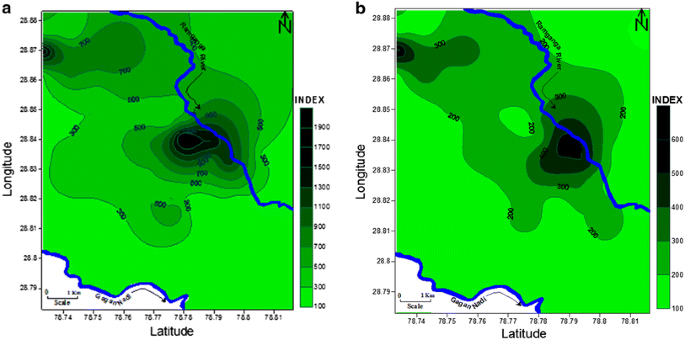
Spatial distribution of TDS in mg/l (a June 2012, b November 2012)
-
Hardness in the area ranges from 116 to 824 mg/l in pre-monsoon and 200 to 580 mg/l in post-monsoon 2012. In 2013 hardness varies from 132 to 780 and 148 to 800 mg/l in pre- and post-monsoon season, respectively. Thus, groundwater of the area is hard to very hard in nature.
-
Calcium ranges from 8 to 90 mg/l in pre-monsoon samples of 2012 and 2013 whereas in post-monsoon season it is 27 to 160 mg/l for the same years (Fig. 4a). Except few samples of pre- and post-monsoon, 2012 and 2013, all the samples have Ca concentration <75 mg/l.
Fig. 4 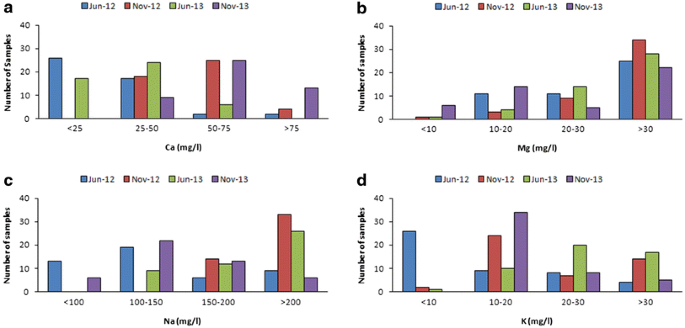
Temporal variations of cations
-
During the two consecutive pre- and post-monsoon seasons of 2012 and 2013, Mg concentration ranges from 5 to 162 mg/l and 2 to 131 mg/l, respectively. Figure 4b suggests that most of the samples have concentration beyond the limit of 30 mg/l (WHO 1984). So the area is categorized as Mg-enriched as compared to calcium.
-
In pre- and post-monsoon season, 2012, Na concentration ranges from 63 to 298 mg/l and 155 to 400 mg/l, respectively. In 2013 pre-monsoon, Na range from 120 to 435 mg/l and in post-monsoon it is 50 to 260 mg/l. Large variation in the concentration of Na is observed. The average values of Na tend to be highest in post-monsoon season, 2012 (Fig. 4c).
-
Potassium concentration range from 0 to 96 mg/l in pre-monsoon season of 2012 and 2013 and for the post-monsoon season of the same years it ranges from 8 to 90 mg/l. Almost similar concentration is found in both the years (Fig. 4d).
-
Average chloride concentration in pre-monsoon 2012 and 2013 range from 87 to 95 mg/l and for the post-monsoon season it is 99 to 118 mg/l (Fig. 5e). The highest concentration of 537 and 511 mg/l is recorded in sample no. 3 in pre- and post-monsoon season of 2013, respectively. This sample is collected from abandoned bone mill site.
Fig. 5 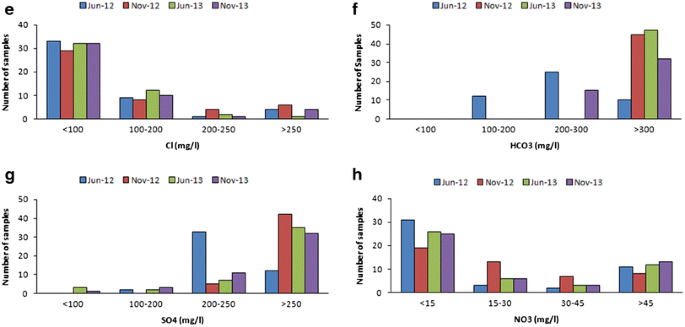
Temporal variations of anions
-
Average value for HCO3 for pre-monsoon 2012 is 248 mg/l. For the other three sets of samples the average values are 515, 438 and 344 mg/l (Fig. 5f). High bicarbonate concentration is observed in the post-monsoon season of 2012 and 2013.
-
Sulphate in the area range from 107 to 451 mg/l in pre-monsoon and 174 to 400 mg/l in post-monsoon, 2012. In 2013, the concentration of SO4 is 64 to 440 mg/l and 34 to 537 mg/l in pre- and post-monsoon season. The concentration of sulphate has increased in 2013 (Fig. 5g).
-
Nitrate is high at some locations in the study area in all the four seasons of 2012 and 2013 reaching to the highest value of 244 mg/l in pre-monsoon 2013 (Fig. 5h). The average value range from 23 to 33 mg/l.
-
Concentration of fluoride is within the range (<1.5 mg/l) except 3 samples in both the seasons of 2012 and 2013.


Chemical characteristics of groundwater that emerge from above discussion are as follows:
-
High concentration of sodium and potassium.
-
Relatively Mg-enriched.
-
Ca deficient.
-
Relatively high concentration of chloride during pre- and post-monsoon seasons of 2013.
-
High bicarbonate during post-monsoon of 2012 and 2013.
-
Increased sulphate concentration during 2013.
-
High nitrate in some samples in pre- and post-monsoon 2012 and 2013.
Hydrochemical facies
Piper’s Trilinear diagram
The Trilinear plot for the pre- and post-monsoon season (Fig. 6a, b) is explained using the facies classification of Back and Hanshaw (1965). Based on this plot, groundwater samples have been classified into four hydrochemical facies

Piper Trilinear Diagram (a June 2012, b November 2012)
-
Figure 6a shows that during pre-monsoon alkalis are abundant constituting 77 % of cations and 19 % samples exhibit no dominant character and rest 4 % are magnesium type.
-
81 % samples exhibiting no dominant character, 11 % samples fall in sulphate field while only 8 % samples are rich in bicarbonate type among anions.
In the post-monsoon period of 2012 (Fig. 6b), the relative abundance of cationic and anionic species is as follows:
-
Alkalis dominate over alkaline earths in all the samples during post-monsoon.
-
In anionic species during post-monsoon, bicarbonate dominate over chloride and sulphate in 64 % of the samples and 36 % samples do not show any dominant anionic signatures.
It is clear from the figures that the dominant facies during pre-monsoon season is Na+K–Cl+SO4 type followed by Ca+Mg–Cl+SO4 type and during post-monsoon season change in facies has been observed where 64 % samples are of Na+K–HCO3 type while the remaining are Na+K–Cl+SO4 type. The seasonal shifts in the facies during post-monsoon period may be due to the dissolution of gases in the atmosphere and in the unsaturated zone during precipitation and infiltration which imparts high concentration of bicarbonates during post-monsoon season (Shanyengana et al. 2004).
Base-exchange indices (r 1)
Base-exchange indices proposed by Matthess (1982) were used to classify the groundwater samples using the equation:
where, r 1 is the base-exchange index and Na, Cl and SO4 concentration in meq/l. If r 1 < 1, groundwater sources are of Na+–SO4 2− type and when r 1 > 1, it indicates groundwater sources are of Na+–HCO3 − type. So, on this basis plots have been prepared which indicate that groundwater in both the seasons of both years, i.e. pre- and post-monsoon season of 2012 and 2013 belong to Na+–HCO3 − type (Fig. 7a, b).

a, b Base exchange indices of water samples (2012 and 2013)
Meteoric genesis indices (r 2)
This index is also used to classify the groundwater sources using the following equation:
where, r 2 is the meteoric genesis index and K+, Na+, Cl− and SO4 2− concentration in meq/l. If r 2 < 1, the groundwater source is of deep meteoric percolation type whereas r 2 > 1 indicates groundwater source of shallow meteoric percolation type. Based on the meteoric genesis index, it has been observed that all the samples of 2012 and 2013 of both the seasons except one in pre- and one in post-monsoon of 2013, belong to the groundwater source of shallow meteoric water percolation type. From the indices calculated above (r 1 and r 2), it has been concluded that the groundwater samples belong to Na+–HCO3 − type and are shallow meteoric water percolation type (Fig. 8a, b).

a, b Meteoric genesis index of water samples (2012 and 2013)
Silica in groundwater
Silica released as a result of chemical breakdown of silicate minerals in rocks and sediments by chemical weathering is acquired by circulating groundwater and therefore the source of silica (SiO2) in groundwater is almost exclusively and unequivocally a result of water–rock interaction (Hem 1989). Concentration of SiO2 in groundwater varies from 1 to 30 mg/l, the median value being 17 mg/l (Davis 1964). Relatively high silica content in groundwater, therefore, implies more intense water–rock interaction, which, in turn, may be related to various aquifer-related parameters, such as permeability, residence time and lithology. Silica concentration in groundwater samples of study area range from 15 to 67 mg/l in pre-monsoon season, averaging 37.5 mg/l. During post-monsoon season, silica concentration ranges from 10 to 67 mg/l, averaging 38.7 mg/l.
Relationship of SiO2 with Cl
Cl acts as an inert element in all natural water–rock environments, i.e. once in solution, it stays there both at ambient and elevated temperatures (Ellis 1970). It is not adsorbed to any marked degree on mineral surfaces (Hem 1970) and usually does not enter common rock-forming minerals due to the large size of its ion. Keeping this in consideration, Cl values have been related to silica concentrations for both the time periods (Fig. 9a, b) to evaluate the role of anthropogenic and natural activities in ion acquisition.

SiO2 versus Cl plot (a June 2012, b November 2012)
In SiO2 versus Cl plot for pre-monsoon season (Fig. 9a), 3 groups were identified. Group I comprising 5 samples (3, 8, 9, 11, and 35) and group II consists of 5 samples (39, 42, 45, 46 and 47). These groups are defined by SiO2 values (38 mg/l for group I and <30 mg/l for group II) and high Cl values (up to 300 mg/l). This suggests that anthropogenic activities are responsible for such high values. Samples 1, 12, 14, 16, 17, 19, 20, 26 and 33 form a cluster defined by high SiO2 values of 55 to 67 mg/l and low Cl concentration (<100 mg/l). These may be termed as groundwater that has attained their Cl values through interaction with solid phase.
In SiO2–Cl plot for post-monsoon season (Fig. 9b), 2 groups were identified. Samples 6, 9, 12, 13, 14, 18, 26, 30, 36 and 46 form group I and is defined by SiO2 concentration (24–36 mg/l) and high Cl concentration (>300 mg/l). This group suggests that anthropogenic activities have played major role for such chloride values. While group II has low Cl concentration (<100 mg/l) and SiO2 values up to 50–67 mg/l. This suggests that rock water interaction is responsible for such SiO2 concentration.
Relationship of SiO2 with TDS
SiO2-TDS plot (Fig. 10a) of pre-monsoon season is described by 2 clusters. Cluster I comprising 11 samples. In this cluster SiO2 values range from 55 to 67 mg/l and TDS value range from 269 to 787 mg/l. This suggests that part of TDS in these samples is acquired through water rock interaction. In group II, for SiO2 values of 25 mg/l, TDS varies from 268 to >1200 mg/l. This group indicates that water rock interaction has minimum role in acquisition of TDS. Bulk of TDS in this group has been acquired by anthropogenic activities.

SiO2 versus TDS plot (a June 2012, b November 2012)
11 samples form a cluster in SiO2-TDS plot in post-monsoon season (Fig. 10b). In this group, SiO2 ranges from 50 to 65 mg/l and TDS varies from 118 to 355 mg/l. This suggests that TDS in these samples has been acquired through rock water interaction as was observed in pre-monsoon season. The second group also follow the same pattern as was in pre-monsoon season where for SiO2 values of 25 mg/l, TDS ranges from 97 to 1296 mg/l. This suggests the role of anthropogenic activities in acquiring such TDS values.
Trace element distribution in groundwater
Trace elements mobility and occurrence in groundwater are strongly influenced by adsorption on clay minerals, organic matter and other crystalline and amorphous substances that make up the porous media, thus their concentrations in groundwater is controlled by geochemical processes (Deutsch 1997). Occurrence of trace elements also depends upon groundwater pH and redox conditions for example acidic conditions (less than 7) is a significant factor in the occurrence of cationic metals (Al, Fe, Mn, and Ni) while with increase in pH elements such as Cu, Pb, and Zn, adsorb more strongly to aquifer materials (Ayotte et al. 2011).
The elemental anomaly in the groundwater regime once created through natural processes or by unintended or unethical human intervention, often goes unabated. The toxicity of an element depends on the dose, the chemical form, route of exposure, bio-availability, distribution in the body, and storage and excretion parameters. It is clear that metal enters the aquatic system from diverse sources, both point and non-point and can be readily transported from abiotic to biotic system (Khan 2011).
A total of 28 samples for both the (pre- and post-monsoon 2013) seasons were analyzed for eleven trace elements known for their toxic effects. These elements include Al, Cr. Fe, Co, Ni, Cu, Zn As, Se, Cd and Pb. Concentration of these trace elements for both the seasons in groundwater of study area is shown in Table 4a, b.
Aluminium is released to the environment by natural processes and from various anthropogenic sources such as mining and industrial uses. Long lasting intake of significant concentrations of aluminium can lead to serious health effects, such as: damage to central nervous system, dementia, loss of memory, listlessness, degenerative brain disease such as Alzheimer. However, there is controversy on the possible association of Alzheimer’s disease and aluminium (http://www.lenntech.com/periodic/elements/al.htm).
The maximum permissible limit of Aluminium (Al) is 0.2 mg/l (BIS 1991). Aluminium concentration in groundwater samples is in the range from 0.44 to 8.27 mg/l in pre-monsoon season while it is 0.29 to 22.5 mg/l in post-monsoon season. All the samples have higher values than permissible limits.
Chromium is found in two oxidation states: Cr(VI) and Cr(III), since hexavalent state of chromium is relatively mobile and is acutely toxic and carcinogenic as well. The maximum permissible limit of Chromium (Cr6+) in drinking water is usually less than 0.05 mg/l (BIS 1991). The concentration of chromium in the study area range from 0.048 to 0.072 mg/l during pre-monsoon while it is 0.036 to 0.071 mg/l during post-monsoon season. Eight samples in pre-monsoon and two in post-monsoon period exceeded the permissible limit. Chromium is an important industrial metal, used for electroplating, paints, dyes, paper industries etc. and has been released to the environment via leakage, poor storage, or improper disposal practices (Palmer and Wittbrodt 1991; Calder 1988).
Iron is a metallic element essential for the formation of haemoglobin in the red blood cells. Excess of iron in drinking water may lead to a disease called hemochromatosis while its deficiency causes anaemia. The recommended limit for iron as suggested by BIS (1991) and WHO (1993) is 0.3 mg/l. All samples in the study area in both the seasons exceed this limit. High concentration of iron may be due to interaction of iron bearing minerals, leaching of organic matter from the upper soil surface, rusting of pipes or some localized effects.
Nickel (Ni) concentrations in the study area range from 0.025 to 0.126 mg/l and 0.020 to 0.096 mg/l in pre-monsoon and post-monsoon season, respectively. Cobalt (Co) concentrations in the study area range from 0.001 to 0.003 mg/l in both the seasons. Thus, cobalt and nickel concentrations in the study area are within the permissible limits.
Copper is necessary for health, its low concentration is not good for health and in higher concentration it leads to copper poisoning. The concentration of copper in groundwater samples range from 0.023 to 0.926 mg/l and 0.024 to 0.139 mg/l in pre- and post-monsoon season, respectively. Permissible limit for copper suggested by WHO is 0.05 mg/l. Four samples in pre-monsoon and four samples in post-monsoon season exceed this limit. Copper can come in groundwater by both natural phenomenon or by human activities. Probable source of copper in the study area is brassware industries.
Zinc is an essential trace element necessary for all life forms. Zinc concentrations in the study area range from 0.0531 to 4.662 mg/l in pre-monsoon season and 0.415 to 5.228 mg/l in post-monsoon season. Highest desirable limit of zinc as recommended by WHO (1994) is 5 mg/l. According to this limit, all the samples in pre-monsoon season are well within the limits while only one sample in post-monsoon season is above this limit. The source of this ion is may be a result of brass industries running in the area.
Arsenic contamination in groundwater may be due to dumping of untreated discharge and hazardous waste materials from industries (Andreae et al. 1983). The permissible level of arsenic is 0.05 mg/l (BIS 1991). Arsenic concentration in the study area range from 0.026 to 0.089 mg/l in pre-monsoon and 0.024 to 0.098 mg/l in post-monsoon period. It is observed that four samples in pre-monsoon and four samples in post-monsoon are exceed this limit. As arsenic is added in small quantities to alpha-brass to make it dezincification resistant (Davis 2001), this might be the reason for the concentration of this element in groundwater of study area. Arsenic in drinking water can affect the human health and considered as one of the most significant environmental causes of cancer in the world (Smith et al. 1992).
Selenium is essential element at low levels, but at levels higher than permissible limits it can affect the health. In study area, selenium concentration range from 0.087 to 0.157 mg/l and 0.068 to 0.103 mg/l in pre- and post-monsoon season, respectively. All samples in pre-monsoon and post-monsoon season have higher concentration than the desirable limit of 0.01 mg/l as suggested by BIS (1991). Selenium is released through both natural processes and human activities. It is added to copper, lead, and steel alloys to improve their machinability and to replace lead in brasses for plumbing applications. Other sources of selenium includes municipal waste water, hazardous waste site, copper and lead refinery effluent.
Cadmium is a hazardous element and is considered as carcinogen; it can lead to kidney failure and also can harm the nervous system and immune system (Lenntech 2011). Maximum permissible limit for cadmium in groundwater is 0.01 mg/l. In study area, cadmium range from 0.002 to 0.070 mg/l and 0.001 to 0.008 mg/l in pre- and post-monsoon season. Three samples in pre-monsoon season are exceeding the permissible limit and none of the sample in post-monsoon season cross this limit. Cadmium in drinking water may occur as a result of the presence of it as an impurity in the zinc of galvanized pipes or cadmium-containing solders in fittings, water heaters, water coolers and taps. Cadmium may also come from domestic and industrial activities. Cadmium is used as coating to all ferrous materials, iron, brass and aluminium. These activities may be responsible for the elevated concentration of cadmium in groundwater.
Lead has no known beneficial effects on human health. By its nature it is considered as toxic element as it act as cumulative metabolic poison (Adepoju-Bello and Alabi 2005). The high concentration of lead in water could be attributed to industrial discharge and agricultural activities. Water may have lead from lead components like lead pipes, lead-based copper piping solders and brass fixtures. Lead solders and brass faucet fixtures have been identified as a significant source of lead contamination. Possible sources of lead contamination include diesel fuel consumed extensively in farm lands, discarded batteries, paint and leaded gasoline (Alam and Umar 2013). Lead concentration in pre-monsoon season range from 0.060 to 1.707 mg/l and in post-monsoon season it range from 0.051 to 0.247 mg/l. Nine samples in pre-monsoon season and eight samples in post-monsoon season have lead concentration higher than the permissible limit of 0.1 mg/l as suggested by BIS (1991).
Water Quality Index
WQI is defined as a rating that reflects the composite influence of different water quality parameters (Sahu and Sikdar 2008). It is an important tool for demarcating groundwater quality for drinking purposes (Tiwari and Mishra 1985; Singh 1992; Subba Rao 1997; Mishra and Patel 2001; Naik and Purohit 2001). It gives a clear picture about the usability of the water for different purposes. A water quality index denotes the integrated effect of the various parameters that are relevant and significant to a particular use.
For calculating water quality index 28 groundwater samples were taken for pre- and post-monsoon season. The standards for drinking purposes as recommended by WHO (1993) and BIS (1991) have been considered for the calculation of WQI. For computing WQI three steps are followed. In the first step, each of the 14 parameters (TDS, pH, TH, Cl, SO4, NO3, F, Ca, Mg, Fe, Cu, Pb, Cr, Cd) have been assigned a weight (w i ) according to its relative importance in the overall quality of water for drinking purposes.
The maximum weight of 5 has been assigned to the parameters like nitrate, lead, chromium and cadmium due to their major importance in water quality assessment. Total dissolved solids, pH, sulphate, fluoride and iron were assigned weight of 4 due to their comparatively less importance in water quality assessment. Other parameters like total hardness, calcium, magnesium, and copper were assigned weight of 2 depending on their less significant role in water quality determination (Vasanthavigar et al. 2010).
In the second step, the relative weight (W i ) is computed from the following equation:
where W i is the relative weight, w i the weight of each parameter, n is the number of parameters.
Calculated relative weight (W i) values of each parameter are given in Table 5. In the third step, a quality rating scale (q i ) for each parameter is assigned by dividing its concentration in each water sample by its respective standard according to the guidelines laid down in the BIS 10500 (1991) and the result is multiplied by 100:
where q i is the quality rating, C i the concentration of each chemical parameter in each water sample in milligrams per liter, S i is the Indian drinking water standard for each chemical parameter in milligrams per liter according to the guidelines of the BIS (1991).
For computing the WQI, the SI is first determined for each chemical parameter, which is then used to determine the WQI as per the following equation:
where SI i is the sub-index of ith parameter, q i the rating based on concentration of ith parameter, n is the number of parameters
On the basis of WQI, types of water were determined and are given in Table 6. The computed WQI is given in Tables 7 and 8 that ranges from 155 to 574 and 154 to 510 for pre- and post-monsoon seasons, respectively. Spatial distribution maps for WQI (Fig. 11a, b) were created for both the seasons. In pre-monsoon season, overall water quality varies from poor to water unsuitable for drinking. High values (>300) were observed in north-western part and the central part indicating poor groundwater quality. While a different scenario is observed in post-monsoon season in terms of spatial distribution, water quality is further degraded in eastern part of the study area. North-western part of the study area shows a substantial variation in terms of WQI over the seasons.

Spatial distribution of WQI (a June 2013, b November 2013)
Chloride and EC were taken as pollution indicators and their respective maps were correlated with WQI map (Fig. 12a, b). From these figures it can be inferred that the locations which have high chloride concentration, high EC values also have high WQI values. This substantiate the validity of WQI map.


Correlation between Chloride, EC and WQI (a June 2013, b November 2013)
Discussion
Moradabad city is a hub of many brassware industries. There are more than 500 small factories manufacturing brass, aluminium, steel and glass ware. These industries use brass (60 % Cu and 40 % Zn) and German silver (55 % Cu, 35 % Zn and 10 % Ni) for moulding purpose in making brassware items and other utensils. Cutting, grinding, scraping, polishing, melting of steel, are the main activities occurring in these industries. These industries produces a wide variety of effluents containing As, Cd, Co, Cr, Hg, Mn, Ni, Pb, Cu, Zn, Sn and Ti and are thus responsible for the higher concentration of trace elements in the area (Tripathi et al. 1990; Mahima et al. 2013). Burning of e-waste in the city along the bank of river Ramganga leads to the emission of various toxic metals in the environment (Pal et al. 2014). Coal combustion in various industries and high traffic also introduce trace elements in the groundwater system. These metals are leached down with the groundwater flow direction and thus increase the concentration of metals in the area. Presence of landfill in the south eastern part of the city is also responsible for the elevated concentrations of ions in the area. This is well supported by the WQI maps that the industrial locations as well as landfill site are characterized by high WQI range.
Conclusion
The impact of urbanization can be seen on the groundwater quality of the study area which is attributed to population growth, industrialization, and change in land use pattern. Groundwater is acidic to slightly alkaline nature. The order of abundance of major ions in pre-monsoon is Na > Mg > Ca > K; HCO3 > SO4 > Cl > NO3 > F and Na > Ca > Mg > K; HCO3 > SO4 > Cl > NO3 > F in post-monsoon season. Order of abundance for trace elements in pre-monsoon is Fe > Al > Zn > Cu > Pb > Se > Cr > Ni > As > Cd > Co and Fe > Zn > Pb > Se > Cu > Cr > As > Ni > Cd > Co in post-monsoon season. Groundwater facies identified from Piper Trilinear plot in pre-monsoon season is Na–Cl–SO4 type and Na–HCO3 in post-monsoon season. Nitrate, bicarbonate, chloride, sulphate and sodium represent the ions contributing from the anthropogenic activities e.g. leaching of nitrate from the sewerage lines, domestic waste etc. Trace elements (Al, Cr, Fe, Pb, Se, Cu, As, and Cd) are present in concentration above permissible limits in the groundwater of the study area. As far as sources of these elements are concerned, it is anticipated that urbanization and population growth, expansion of industries, could be the reason. The influence of anthropogenic and geogenic processes on groundwater samples is assessed by SiO2 with Cl and TDS plots which suggests that alteration in meteoric signature of groundwater quality is combined effect of anthropogenic and geogenic processes. Water quality index maps indicate poor groundwater quality. In general groundwater quality is a combined effect of variation in rainfall recharge, geochemical reaction, land use pattern. Various anthropogenic and geogenic processes are playing role in modifying the chemical characteristics of the groundwater of the study area.
References
Ackah M, Agyemang O, Anim AK, Osei J, Benthil NO, Kpattah L, Gyamfi ET, Hanson JEK (2011) Assessment of groundwater quality for drinking and irrigation: the case study of Teiman-Oyarifa Community, Ga East Municipality, Ghana. Proc Int Acad Ecol Environ Sci 1(3–4):186–194
Adepoju-Bello AA, Alabi OM (2005) Heavy metals: a review. Nig J Pharm 37:41–45
Alam F, Umar R (2013) Trace elements in groundwater of Hindon-Yamuna Interfluve Region, Baghpat District, Western Uttar Pradesh. J Geol Soc India 81:422–428
Andreae MO, Byrd TJ, Froelich ON (1983) Arsenic, antimony, germanium and tin in the Tejo estuary, Portugal: modelling of a polluted estuary. Environ Sci Tech 17:731–737
APHA (American Public Health Association) (1992) Standard methods for the examination of water and waste water, 16th edn. American Public Health Association, Washington, DC
Ayotte JD, Gronberg JM, Apodaca LE (2011) Trace elements and radon in groundwater across the United States: US Geological Survey Scientific Investigations Report 5059, p 115
Back W, Hanshaw B (1965) Chemical geohydrology, advances in hydroscience, vol 11. Academic Press, New York, USA, pp 49–109
Balaram V, Rao GT (2003) Rapid determination of REEs and other trace elements in geological samples by microwave acid digestion and ICP-MS. At Spectrosc 24(6):206–212
BIS (1991) Bureau of Indian Standards-Indian standard specifications for drinking water, I.S. 10500
Calder LM (1988) Chromium contamination of groundwater. In: Nriagu JO, Nieboer E (eds) Chromium in the natural and human environments, vol 20. John Wiley & Sons, New York, pp 215–230
CGWB (2008) District brochure of Moradabad District, UP
Davis NS (1964) Silica in streams and groundwater. Am J Sci 262:870–891
Davis JR (2001) Copper and copper alloys. ASM International, USA, p 390
Deutsch WJ (1997) Groundwater geochemistry; funadamentals and applications to contamination. Lewis Publishers, New York, p 221
Ellis AJ (1970) Quantitative interpretation of chemical characteristics of hydrothermal systems. Geothermics 2:516–527
Faure G (1998) Principles and applications of geochemistry, 2nd edn. Prentice-Hall, Englewood Cliffs
Helena B, Pardo B, Vega M, Barrado E, Fernandez JM, Fernandez L (2000) Temporal evolution of groundwater composition in an alluvial aquifer (Pisuerga River, Spain) by principal component analysis. Water Res 34(3):807–816
Hem JD (1970) Study and interpretation of the chemical characteristics of natural water. USGS Water Supply Paper 1473(2):363
Hem JD (1989) Study and interpretations of chemical characteristics of natural water. USGS Water Supply Paper 2254:263
Jameel A, Sirajudeen J (2006) Risk assessment of physico-chemical contaminates in groundwater of pettavaithalair, Tiruchirappalli, Tamilnadu, India. Environ Monit Assess 123:299–312
Kelly WR (1997) Heterogeneities in ground-water geochemistry in a sand aquifer beneath an irrigated field. J Hydrol 198:154–176
Khan TA (2011) Trace elements in the drinking water and their possible health effects in Aligarh City, India. J Water Resour Protect 3:522–530
Khan MMA, Umar R, Lateh H (2010) Study of trace elements in groundwater of Western Uttar Pradesh, India. Sci Res Essays 5(20):3175–3182
Khan A, Umar R, Khan HH (2015) Hydrochemical characterization of groundwater in Lower Kali Watershed, Western Uttar Pradesh. J Geol Soc India 86:195–210
Kraft GJ, Stites W, Mechenich DJ (1999) Impacts of irrigated vegetable agriculture on a humid north-central US sand plain aquifer. Groundwater 37:572–580
Krishan G, Lapworth DJ, Rao MS, Kumar CP, Smilovic M, Semwal P (2014) Natural (baseline) groundwater quality in the BistDoab catchment, Punjab, India: a pilot study comparing shallow and deep aquifers. Int J Earth Sci Eng 7:1626
Kumar PJS, Elango L, James EJ (2014) Assessment of hydrochemistry and groundwater quality in the coastal area of South Chennai, India. Arab J Geosci 7:2641–2653
Lapworth DJ, Gopal K, Rao MS, MacDonald AM (2014) Intensive groundwater exploitation in the Punjab an evaluation of resource and quality trends. Technical Report. NERC Open Research Archive, BGSUK
Lenntech (2011) Chemical properties, Health and environmental effects of Cadmium. http://www.lenntech.com/periodic/elements/cd.htm
Mahima PR, Singh D, Tripathi A, Singh GS (2013) Five year studies on suspended particulate matter and heavy metals trends in brass city of India. J Environ Sci Eng 55(3):267–274
Matthess G (1982) The properties of groundwater. Wiley, New York, p 498
Mishra PC, Patel RK (2001) Study of the pollution load in the drinking water of Rairangpur, a small tribal dominated town of North Orissa. Indian J Environ Ecoplan 5(2):293–298
Misra AK (2011) Impact of Urbanization on the hydrology of Ganga Basin (India). Water Resour Manag 25:705–719. doi:10.1007/s11269-010-9722-9
Naik S, Purohit KM (2001) Studies on water quality of river Brahmani in Sundargarh district, Orissa. Indian J Environ Ecoplan 5(2):397–402
Pal R, Kumar A, Gupta A, Mahima, Tripathi A (2014) Source identification and distribution of toxic trace metals in respirable dust (PM10) in Brasscity of India. Glob J Human-Soc Sci 14:5
Palmer CD, Wittbrodt PR (1991) Processes Affecting the Remediation of Chromium-Contaminated Sites. Environ Health Perspect 92:25–40
Purushothaman P, Rao MS, Rawat YS, Kumar CP, Gopal K, Parveen T (2013) Evaluation of hydrogeochemistry and water quality in BistDoab region, Punjab, India. Environ Earth Sci 72:693706. doi:10.1007/s1266501329929
Rai SC, Saha AK (2015) Impact of urban sprawl on groundwater quality: a case study of Faridabad city, National Capital Region of Delhi. Arab J Geosci 8:8039–8045
Rajmohan N, Elango L (2004) Identification and evolution of hydrogeochemical processes in the groundwater environment in an area of the Palar and Cheyyar River Basins, Southern India. Environ Geol 46:47–61
Raju NJ (2012) Evaluation of hydrogeochemical processing the Pleistocene aquifers of Middle Ganga Plain, Uttar Pradesh, India. Environ Earth Sci 65:1291–1308
Raju NJ, Ram P, Dey S (2009) Groundwater quality in the lower Varuna River Basin, Varanasi District, Uttar Pradesh. J Geol Soc India 73:178–192
Saha D (2009) Arsenic groundwater contamination in parts of middle Ganga plain, Bihar. Curr Sci 97(6):753–755
Sahu P, Sikdar PK (2008) Hydrochemical framework of the aquifer in and around East Kolkata wetlands, West Bengal, India. Environ Geol 55:823–835
Satyanarayanan M, Balaram V, Al Hussin AS, Al Jemaili MAR, Rao TG, Mathur R, Dasaram B, Ramesh SL (2007) Assessment of groundwater quality in a structurally deformed granitic terrain in Hyderabad India. Environ Monit Asst 131:117–127
Sayyed MG, Wagh GS (2011) An assessment of groundwater quality for agricultural use: a case study from solid waste disposal site SE of Pune, India. Proc Int Acad Ecol Environ Sci 1(3–4):195–201
Senthilkumar M, Elango L (2013) Geochemical processes controlling the groundwater quality in lower Palar river basin, Southern India. J Earth Syst Sci 122(2):419–432
Shanyengana MK, Seely MK, Sanderson RD (2004) Major-ion chemistry and groundwater salinization in ephemeral floodplains in some arid regions of Namibia. J Arid Environ 57:71–83
Singh DF (1992) Studies on the water quality index of some major rivers of Pune, Maharashtra. Proc Acad Environ Biol 1(1):61–66
Singh AK, Mondal GC, Singh TB, Singh S, Tewary BK, Sinha A (2012a) Hydrogeochemical processes and quality assessment of groundwater in Dumka and Jamtara districts, Jharkhand, India. Environ Earth Sci 67:21752191
Singh K, Hundal HS, Singh D (2012b) Geochemistry and assessment of hydrogeochemical processes in groundwater in the southern part of Bathinda district of Punjab, northwest India. Environ Earth Sci 64:18231833
Smith AH, Hopenhayn-Rich C, Bates MN, Goeden HM, Hertz-Picciotto I, Duggan HM, Wood R, Kosnett MJ, Smith MT (1992) Cancer risks from arsenic in drinking water. Environ Health Perspect 97:259–267
Stallard RE, Edmond JM (1983) Geochemistry of Amazon River: the influence of the geology and weathering environment on the dissolved load. J Geophys Res 88:9671–9688
Stigter TY, Van Ooijen SPJ, Post VEA, Appello CAJ, Carvalho Dill AMM (1998) A hydrogeological and hydrochemical explanation of the groundwater composition under irrigated land in a Mediterranean environment, Algarve, Portugal. J Hydrol 208:262–279
Subba Rao N (1997) Studies on water quality index in hard rock terrain of Guntur district, Andhra Pradesh, India; National Seminar on Hydrology of Precambrian Terrains and hard rock areas, pp 129–134
Subba Rao N (2001) Geochemistry of groundwater in parts of Guntur district, Andhra Pradesh, India. Environ Geol 41:552–562
Thilagavathi R, Chidambaram S, Prasanna MV, Thivya C, Singaraja C (2012) A study on groundwater geochemistry and water quality in layered aquifers system of Pondicherry region, southeast India. Appl Water Sci 2:253–269. doi:10.1007/s1320101200452
Tiwari RN (2011) Assessment of groundwater quality and pollution potential of Jawa Block Rewa District, Madhya Pradesh, India. Proc Int Acad Ecol Environ Sci 1(3–4):202–212
Tiwari TN, Mishra MA (1985) A preliminary assignment of water quality index of major Indian rivers. Indian J Environ Protect 5:276–279
Tripathi RM, Khandekar RN, Mishra UC (1990) Toxic trace metals in the atmosphere of Moradabad (India). Indian J Environ Health 32(2):140–147
Umar R, Absar A (2003) Chemical characteristics of groundwater in parts of the Gambhir River basin, Bharatpur District, Rajasthan, India. Environ Geol 44:535–544
Umar A, Umar R, Ahmad MS (2000) Hydrogeological and hydrochemical framework of regional aquifer system in Kali-Ganga sub-basin, India. Environ Geol 40(4–5):602–611
Umar R, Khan MMA, Absar A (2006) Groundwater hydrochemistry of a sugarcane cultivation belt in parts of Muzaffarnagar district, Uttar Pradesh, India. Environ Geol 49:999–1008
Umar R, Ahmed I, Alam F (2009) Hydrochemical characteristics and seasonal variations in groundwater quality of an alluvial aquifer in parts of Central Ganga Plain, Western Uttar Pradesh, India. Environ Geol 58:1295–1300
Vasanthavigar M, Srinivasamoorthy K, Vijayaragavan K, Rajiv Ganthi R, Chidambaram S, Anandhan P, Manivannan R, Vasudevan S (2010) Application of water quality index for groundwater quality assessment: Thirumanimuttar sub-basin, Tamilnadu, India. Environ Monit Assess 171:595–609
WHO (1984) Guidelines for drinking water quality, v.2. Health criteria and other supporting information. WHO Publishers, Geneva
WHO (World Health Organization) (1993) Guidelines for drinking-water quality; I recommendation. World Health Organization, Geneva
WHO World Health Organization (1994) Guidelines for drinking water quality, v.1. WHO, Geneva
Acknowledgments
The financial assistance received by the first author in the form of Senior Research Fellowship (SRF) from UGC, New Delhi is acknowledged. The authors are also thankful to Head, Geochemical Division, National Geophysical Research Institute, Hyderabad, India for providing facility to carry out the trace element analysis of the water samples in ICPMS lab at NGRI and the Chairman of the Department of Geology, AMU, Aligarh, for providing laboratory facilities.
Author information
Authors and Affiliations
Corresponding author
Rights and permissions
About this article

Cite this article
Saba, N.u., Umar, R. Hydrogeochemical assessment of Moradabad city, an important industrial town of Uttar Pradesh, India. Sustain. Water Resour. Manag. 2, 217–236 (2016). https://doi.org/10.1007/s40899-016-0053-8
Received:
Accepted:
Published:
Issue Date:
DOI: https://doi.org/10.1007/s40899-016-0053-8