
Abstract
The ternary alloy system Ag-Cu-Si was investigated in detail for the first time. The phase diagram was analysed by means of light optical microscopy, powder x-ray diffraction, differential thermal analysis (DTA) and scanning electron microscopy in combination with energy dispersive x-ray spectroscopy. The complete isothermal section at 650 °C was studied experimentally, and several additional samples were studied in order to obtain insight into phase equilibria with the high-temperature phases of the binary Cu-Si system. DTA studies in two vertical sections were used to determine ternary invariant phase reactions and to construct the ternary reaction scheme (Scheil diagram). A liquidus surface projection was constructed by combining these data with microstructure analysis of selected as-cast samples.
1 Introduction and Literature Review
Phase equilibria of the ternary system Ag-Cu-Si was not studied in detail up to now, although alloys containing these metals have been studied for their potential as filler materials in brazing applications. In the current paper we report on the first systematic experimental phase diagram study covering the entire ternary phase diagram. A brief discussion of the available literature is given below.
All limiting binary systems are well known and have been studied repeatedly. The Ag-Cu system has been evaluated by Subramanian and Perepetzko[1] who included all relevant literature up to the year 1989 in their assessment. Ag-Cu shows an eutectic reaction L = (Ag) + (Cu) with the eutectic point at 39.9 at.% Cu and 779.1 °C. The limiting compositions of the fcc solid solutions were assessed to be 14.1 at.% Cu for (Ag) and 95.1 at.% Cu for (Cu). The Ag-Si system is also of the simple eutectic type. According to the assessment of Olesinski et al.[2] the eutectic point is situated at 89 at.% Ag and 835 °C. The mutual solid solubilities of Si in Ag and Ag in Si, are assumed to be negligible for phase diagram applications.
The system Cu-Si is much more complex as it contains several intermediate compounds at different temperatures, and it has been investigated intensively in the last decades. A critical assessment including all literature up to 1982 was given by Olesinski and Abbaschian.[3] A more recent thermodynamic assessment of the system has been given by Yan and Chang.[4] New experimental investigations with focus on the Cu-rich part have been performed in 2011 by Sufryd et al.[5] The binary compounds are all situated in the Cu-rich part of the phase diagram, starting with Cu3Si, being the compound richest in silicon. This phase shows three different modifications: the high-temperature η-phase, an intermediate phase η′ and the low temperature phase η′′. The high temperature phase melts congruently at 859 °C. The transition temperatures between the phases differ considerably with composition: the transition from η to η′ takes place between 558 and 620 °C, the transition from η′ to η′′ varies between 467 and 570 °C, for the Cu-poor and Cu-rich side, respectively. According to the assessed phase diagram, the phases η and η′[6] show a rhombohedral structure (R-3m and R-3) whereas η′′ is orthorhombic[6] or tetragonal.[7] More recent transmission electron investigations by Wen and Spaepen indicate P-3m1 and R-3 as space groups for η and η′[8,9] and rapid quenching experiments performed by Mattern et at.[10] confirm the structure type for η.
The stability of the phase with the nominal composition Cu15Si4, designated as ε, was discussed controversially in literature. The assessment by Olesinski and Abbaschian[3] included the phase in the stable binary phase diagram, even though some previous authors found different results. In their study of the ternary Al-Cu-Si system, Riani et al.[11] later claimed that ε is stabilized by impurities and not present in the binary if very pure basic materials are used. This conclusion, however, was later withdrawn by the same authors in a recent study of the Cu-Si binary system by Sufryd et al.[5] The authors conclude that the formation of ε is only inhibited kinetically, but that the phase is stable in the binary Cu-Si system. The third intermetallic compound stable at low temperature is Cu5Si, designated as γ, shows the β-Mn type structure.
Three phases are reported to be stable at elevated temperature: κ, β and δ. The phase κ forms at 842 °C and decomposes eutectoidally at 552 °C. It crystallizes in the Mg-type structure. The β-phase forms peritectically from (Cu) and liquid at 852 °C and decomposes eutectoidally into δ and γ at 785 °C. Its structure is cubic W-type. According to the assessment of Olesinski and Abbaschian[3] the phase δ forms peritectically from β and liquid at 824 °C and decomposes at 710 °C eutectoidally into ε and γ. The more recent work by Sufryd et al.[5] however, indicates a congruent transformation from γ to δ and two eutectoid reactions at 735 °C. High-temperature x-ray diffraction experiments performed by Mukherjee et al. described this phase as tetragonal.[7] Splat cooling experiments of Mattern et al.[10] suggest the hexagonal symmetry, space group P63/mmc but this could not be confirmed by Ref 5. For a better understanding of the complex phase equilibria of the Cu-rich part of the system Cu-Si, the partial phase diagram given by[5] is redrawn in Fig. 1. Table 1 lists all invariant binary phase reactions relevant to this study. Crystallographic data for the relevant phases are presented in Table 2.
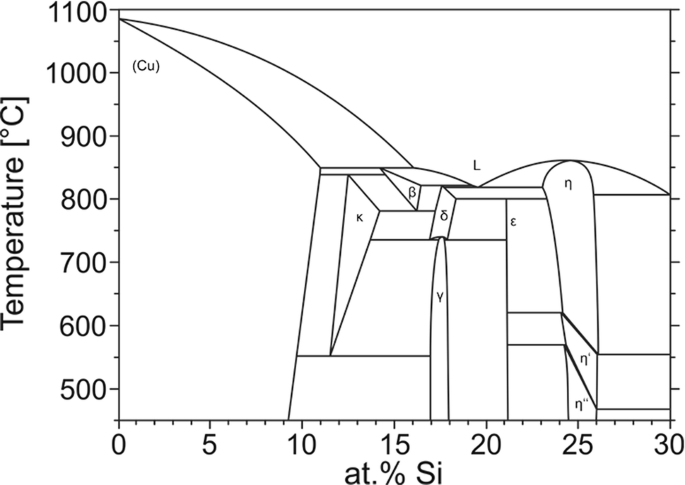
Cu-rich part of the Cu-Si phase diagram redrawn from Ref 5
Information on the ternary phase diagram Ag-Cu-Si is only sparse. Liu et al.[12] proposed two ternary eutectic points which were determined by DTA. The first eutectic point was found to exist at the composition Ag30Cu44.7Si25.3 corresponding to the reaction L = Ag + η + Si at 705 °C, the second eutectic point was found at Ag12.5Cu71.7Si16.8 and 740 °C. The proposed liquidus surface, however, does not correspond to the binary Cu-Si phase diagram. Luo et al.[13] studied the phase diagram between 0 and 10 wt.% Si by x-ray diffraction (XRD) and metallographic methods and concluded, that no ternary intermetallic compound exists in the system.
2 Experimental
Starting materials for sample preparation were Ag shot (Ögussa, 99.95%), Cu wire (Alfa Aesar, 99.95%) and Si lump (Alfa Aesar, 99.9999%). The Cu-wire was reduced in a hydrogen stream at 300 °C in order to remove surface oxides. Samples with a total mass of usually 1.5 g each were prepared to investigate the system Ag-Cu-Si.
The calculated amounts of the elements were weighed on a semi-micro balance with an accuracy of at least 0.5 mg. The proper amounts of the elements were then mixed and melted in an arc-furnace (Johanna Otto GmbH, MAM1) in inert argon atmosphere on a copper hearth. For better homogenisation the samples were turned over and re-melted up to three times. A zirconium getter was used in the arc chamber to capture traces of oxygen during the procedure. Most of the sample-pills were cut into two pieces, one of them to be used for investigation of the as-cast microstructure, the other one for further heat treatment. These parts were sealed in vacuum (p < 10−2 mbar) into quartz glass ampoules. The sealed samples were annealed in muffle furnaces at defined temperatures and afterwards quenched in cold water.
For further investigations, parts of the annealed samples were embedded in phenolic hot mounting resin. The surfaces of the embedded samples were then ground with different SiC abrasive papers and finally polished with corundum powder (0.3 µm). Initial metallographic analysis was carried out on a binocular reflected light microscope (Zeiss Axiotech 100) equipped with bright field, dark field, polarised light and differential interference contrast (DIC) mode. Quantitative analysis of phase compositions was done with a scanning electron microscope (Zeiss Supra 55 VP ESEM) in combination with energy dispersive x-ray spectroscopy (EDX). Pure Co was used for an energy calibration of the EDX detector signal and the pure elements (Ag, Cu, Si) were used as standard materials for quantitative composition measurements. An acceleration voltage of 20 kV was applied. The composition of each phase was measured on at least three different grains of the phase and average values were calculated. The standard uncertainty u was usually less than 0.5 at.%. This also corresponds to estimated error for this method under the given conditions. The composition of the quenched liquid and of the overall composition of unquenchable high-temperature phases was determined by area scans on selected areas.
Phase identification was done by powder x-ray diffraction (XRD) using a Bruker D8 diffractometer in Bragg-Brentano pseudo-focussing geometry using Cu-Kα radiation and a silicon strip detector (Lynxeye). The measurements were done in a θ/2θ arrangement, with a variable slit aperture (12 mm illumination) for 1 h. Analysis of the obtained powder patterns was done by Rietveld refinement with the software Topas3.[14]
To identify phase transformations and their temperature, differential thermal analysis (DTA) was performed on a Netzsch DTA 404F1 or Setaram Setsys Evolution. The Pt/Pt10%Rh thermocouples were calibrated at the melting points of pure Sn, Al, Au and Ni. Details on the used calibration function are given together with the measured DTA curves in the supporting materials. For each sample, two heating and cooling cycles in open alumina crucibles under a constant argon flow of 50 mL/min and a heating/cooling rate of 5 K/min were performed.
3 Results and Discussion
3.1 The Isothermal Section at 650 °C
The temperature of 650 °C was selected for the determination of the principal solid state equilibria, as it is well below the eutectic temperatures in the limiting binary systems (compare Table 1). At this temperature, the binary Cu-Si intermetallic phases η, ε, γ and κ are stable. A total number of approximately 30 samples was prepared and annealed at 650 °C for 14 days. These samples were organized in sections at 5, 10, 20 and 25 at.% Ag in order to have a sufficient basis for the analysis of the ternary phase reactions in these vertical sections doing DTA, see sections 3.2 and 3.3. The experimental results from XRD phase analysis and SEM/EDX of selected samples covering all relevant two-and three-phase equilibria are listed in Table 3. Generally, the XRD phase analysis is consistent with the results from SEM/EDX measurements. The error of the lattice parameters was estimated from the given internal error of the full profile refinements multiplied by 10 and is generally below 0.001 Å. The error of SEM/EDX measurements is given according to U = 2u and is generally below 1 at.%. This implies that approx. 95% of the measured values are within ± 1% of the result. Selected microstructures of the annealed samples are shown in Fig. 2 and the resulting isothermal section is shown graphically in Fig. 3.

BSE images of samples annealed at 650 °C. (a) Ag10Cu70Si20; (b) Ag25Cu60Si15; (c) Ag25Cu65Si10; (d) Ag5Cu85Si10

Isothermal section of Ag-Cu-Si at 650°. The red circles correspond to the nominal sample compositions of the samples listed in Table 3 (Color figure online)
Selected microstructures of the annealed samples are shown in Fig. 2 and the resulting isothermal section is shown graphically in Fig. 3.
It can be seen in Fig. 3, that the phase equilibria at 650 °C are dominated by the (Ag)-phase (solid solution of Cu in Ag) which occurs in all three-phase equilibria [(Ag)-Si-η], [(Ag)-η-ε], [(Ag)-ε-γ], [(Ag)-γ-κ] and [(Ag)-κ-(Cu)] of the isotherm. The finding of Luo et al.[13] regarding the absence of a ternary intermediate compound was confirmed. As expected from the binary data, Si dissolves neither Cu nor Ag in significant amounts. The solubility of Ag in the Cu(Si) solid solution and in the binary Cu-Si compounds is only minor reaching a maximum of approximately 2 at.% in the fcc solid solution (Cu). Since four stable binary phases η, ε, γ, κ and Cu(Si) occur in a rather narrow concentration range of 0.75 ≤ x(Cu) ≤ 0.90, their distinction by SEM can be difficult. In Fig. 2(a) a back scattered electron (BSE) micrograph image of the alloy Ag10Cu70Si20 is shown. Here it was possible to distinguish between η- and ε-phase since η, which is slightly richer in Si, appears a little darker. A similar situation was found for Ag25Cu60Si15 (ε- and γ-phase, Fig. 2b) and Ag25Cu65Si10 (γ- and κ-phase, Fig. 2c). Furthermore, there are two inconsistencies in the binary literature results and our findings in the ternary system. Firstly, according to Subramanian and Perepezko[1] the solid solubility of Cu in (Ag) at 650 °C has its maximum at approx. 8 at.%. In our ternary samples we found, however, up to 13.8 at.% Cu in the (Ag) phase. Furthermore, the measured compositions of the (Ag) phase vary unsystematically along the different phase fields. An explanation for this behaviour is the presence of very fine Cu precipitates within the (Ag) grains, see the high magnification BSE micrograph of alloy Ag5Cu85Si10 in Fig. 2(d). These precipitates are formed during annealing, as the Cu-content of the (Ag) grains during crystallization from the melt is significantly higher than the solubility limit at 650 °C. These precipitates make it impossible to determine accurately the concentration of Cu dissolved in Ag. Since (Ag) does not dissolve significant amounts of Si the binary limiting solubility was considered as the maximum also for the ternary systems. Accordingly all measured Cu concentrations in (Ag) above 8 at.% were ignored and the corresponding tie lines fixed at this value. The ends of such tie lines were drawn as dashed lines. Secondly, according to Sufryd et al.[5] the η-phase is stable between 74 and 76 at.% Cu at 650 °C, which is slightly different to the earlier phase diagram version by Olesinski and Abbaschian[3] where it is stable from 75 to 76 at.% Cu. Our experiments rather confirm the latter version and thus the homogeneity range of the η-phase was set to 75 to 76 at.% Cu.
3.2 Samples Annealed at Higher Temperatures
First results from DTA and the results from the analysis of as-cast samples showed, that the knowledge of phase equilibria at higher temperature is essential to understand the ternary phase reactions involving the liquid phase. The investigation of the situation at high temperatures is complicated by the following facts: (1) Two of the binary phases stable at 650 °C (ε, γ) are not in equilibrium with the liquid, but decompose by solid state reactions. (2) The two high temperature phases stable above 650 °C (β, δ) are not quenchable, so their phase identification by means of XRD is not possible. (3) Preliminary results from as-cast samples suggested that at least one of the high temperature phases may show a considerable solubility for Ag, or that a ternary high temperature phase exists.
Given these facts, it was decided to prepare additional samples annealed at elevated temperatures in order to clarify those high-temperature equilibria. Samples were annealed at 710, 740 and 760 °C to cover the relevant high-temperature phases as well as the liquid phase in the Cu-rich corner. Samples were investigated by a combination of SEM/EDX and powder XRD after annealing. The results of this characterization is summarized in Table 4 and selected microstructures are shown in Fig. 4.

BSE images of samples annealed at high temperature. (a) Ag10Cu70Si20 annealed at 740 °C; (b) magnified liquid range of a; (c) Ag10Cu72Si18 annealed at 740 °C; (d) Ag4Cu79Si17 annealed at 760 °C; (e) Ag10Cu70Si20 annealed at 710 °C; (f) Ag25Cu67Si8 annealed at 760 °C
The annealing temperature of 710 °C was selected to clarify if the high temperature phase δ is stabilized to lower temperature by the uptake of Ag. As the phase equilibria observed at 710 °C at three different compositions correspond exactly to those at 650 °C (compare Tables 3, and 4), this can be ruled out. No signs for the existence of the liquid phase was found at this temperature.
The annealing temperature of 740 °C corresponds to the second (Cu-rich) eutectic temperature in Ref 12 but is slightly below our own temperature for this reaction (742 °C, compare section 3.3.). The same three compositions as at 710 °C were selected for the investigations. As the annealing temperature is close to the eutectic melting temperature, the results are difficult to interpret and can only be fully understood by combining the observed microstructures with the results from DTA discussed in the next section. The sample with the composition Ag10Cu70Si20 (Fig. 4a and b) shows a clearly inhomogeneous microstructure: rounded grains of (Ag), ε and η having a diameter of 100 μm and more are surrounded by crystallized liquid with a fine microstructure, which, however, is not of typical eutectic character. The crystals of ε and η are in intimate contact and show finely dispersed small Ag particles while the large (Ag) crystals are separated and are not seen in Fig. 4. The liquid, which should only be present above 742 °C, was probably formed during slight temperature fluctuations in the muffle furnace used for annealing and later crystallized to form the same three phases. Apart from the problematic inhomogeneous character of the microstructure, the equilibrium phase composition of the sample at 740 °C is clearly fixed by the results of characterization as [(Ag) + ε + η]. No additional phase was found with XRD.
The sample with the composition Ag10Cu72Si18 annealed at 740 °C shows large rounded crystals of ε surrounded by a finely dispersed matrix of crystallized liquid composed of δ, (Ag) and some ε (Fig. 4c). It can be easily seen, that the crystallized liquid is not completely homogeneous suggesting again, that this area was melted and crystalized slowly several times during annealing as the annealing temperature is very close to the eutectic temperature proposed in this work. Consequently this area is denoted “L” in Fig. 4(c). Area scans of six different areas in the crystallized liquid yield an average composition of Ag10.9Cu71.2Si17.9. It should be stressed, that the XRD-results for this sample show the three phases ε, γ, and (Ag). According to the binary phase diagram γ is not stable at 740 °C as it transforms to δ in a congruent transformation around 736 °C. However, it is well known from the binary Cu-Si system that δ cannot be quenched. Based on the results of DTA experiments (next section) we propose that δ is the stable phase at 740 °C and we denote it as δ(γ) in Table 4 to make clear that γ was found in XRD.
The sample with the composition Ag10Cu75Si15 annealed at 740 °C shows grains of κ embedded in very fine matrix composed form (Ag) and δ(γ). The composition of these two phases cannot be measured by SEM/EDX but the phases have been identified from powder XRD. Again, it appears that major parts of the sample were melted and crystalized slowly several times during annealing.
Eight additional samples were annealed at 760 °C in order to characterize phase equilibria of various solid phases with the liquid. The results for five of these samples are shown in Table 4. The sample with the overall composition Ag25Cu67Si8 (Fig. 4f) shows the two phases (Ag) and (Cu) in equilibrium and no liquid present. Thus, this sample can be used to fix the tie-line between these two phases. The sample at Ag4Cu32Si14 is located in the three-phase field [(Ag) + (Cu) + κ]. All three phases were identified by XRD. The two composition sets for (Cu) and κ determined by EDX are very close, consistent with the binary Cu-Si system. Three more samples show the equilibria [(Ag) + κ + L], [(Ag] + L] and [δ + L]. In all cases, the quenched liquid forms a fine microstructure consisting of L + δ(γ) with the appearance of a (metastable) pseudobinary eutectic. The measured liquid compositions are all situated in a small composition area Ag12.1-13.8Cu70.1-73.1Si14.5-16.1. Of course, this is only a part of the extension of the liquid at 760°, as not all relevant solid-liquid equilibra have been realized in the investigated samples.
The information gained by investing the samples annealed between 710 and 760 °C can be summarized as follows:
Solid state equilibria at 710 °C correspond to those observed in the section at 650 °C. There is no evidence for the existence of a stable high temperature phase or the existence of a liquid at this temperature.
The temperature of 740 ° C is very close to the eutectic melting causing problems due to several crystallization and re-melting events during annealing (minor temperature fluctuations are unavoidable using conventional muffle furnaces). The proposed solid state equilibria listed in Table 4 are thus plausible but tentative. However, based on the EDX results, it can be ruled out that any of the Cu-Si phases shows significant Ag-solubility, or that a ternary phase exists at this temperature.
The ε phase was found in the presence with the liquid in two of the samples annealed at 740°. This is a significant difference from the binary Cu-Si system where ε decomposes in a solid state reaction. In fact, DTA results suggest that ε is involved in the ternary Cu-rich eutectic (see next section).
At 760 °C the liquid extends in a small area including the composition range Ag12.1-13.8Cu70.1-73.1Si14.5-16.1, which helps estimating the liquid composition in the respective part of the reaction scheme discussed in the following section.
We did not find evidence for the existence of β at 760 °C, so a major stabilization of this phase by Ag is also ruled out.
3.3 Vertical Sections, Reaction Scheme and Liquidus Projection
DTA measurements were performed on samples annealed at 650 °C in the vertical sections at 10 and 20 at.% Ag, respectively. Thermal effects obtained from the first and second heatings were evaluated and averaged to determine the reaction temperatures. In a few cases, however, the equilibrium was not re-established on cooling with 5 K/min in the DTA, and the thermal effects observed in the first and second cycle differed significantly. In these cases, only the first heating curve was evaluated. The liquidus arrests were evaluated from the heating- and cooling-curves. All observed reaction temperatures are tabulated in Table 5 together with their interpretation. The vertical sections at 10 and 20 at.% Ag are shown based on these DTA results are shown in Fig. 5 and 6.

Vertical section of Ag-Cu-Si at 10 at.% Ag. Triangles up (yellow): Liquidus on heating, triangles down (green): liquidus on cooling, squares (red): invariant reactions, circles (blue) other thermal effects (Color figure online)

Vertical section of Ag-Cu-Si at 20 at.% Ag. Triangles up (yellow): Liquidus on heating, triangles down (green): liquidus on cooling, squares (red): invariant reactions, circles (blue) other thermal effects (Color figure online)
The binary system Cu-Si presents a specific situation where most of the thermal reactions occur in a small composition- and temperature-range. Therefore, except for the ternary eutectic reaction E1 which was observed in many different samples, the interpretation of invariant reactions in not straightforward and reactions are usually only observed in one single sample. However, based on the combination of DTA results with the results discussed in sections 3.1 and 3.2, it was possible to develop a Reaction Scheme consistent with all observed experimental facts. This reaction scheme is shown in Fig. 7.

Reaction scheme for Ag-Cu-Si
As already proposed by Liu et al.[12] two ternary eutectic reactions are found in Ag-Cu-Si. The reaction E1 L = η + (Ag) + Si was confirmed and the reaction E2 (which was not studied in detail by Ref 12) was identified as L = (Ag) + δ + ε. In addition, the transition reactions U3, U4 and U6 were directly determined in this study. The reaction U4 is connected with E1 by a maximum in the three-phase field [L + (Ag) + η]. Another pronounced maximum was found in the three-phase field [L + (Ag) + (Cu)] which was found at a temperature of approximately 796 °C; i.e. almost 20 °C above the binary eutectic L = (Ag) + (Cu). The reaction U5 was not determined directly but may be extrapolated from the existing data. The reactions U7 and U8 involve the β-phase and were not determined directly in the current study, as they do not occur in the sections at 10 and 20 at.% Ag. They were added as hypothetical reactions to Fig. 7 in order to formally complete the reaction scheme. Two more ternary invariant reactions involving exclusively solid phases are proposed in the reaction scheme in Fig. 7. These reactions were observed in two different samples at temperatures between 729 and 733 °C and are connected to the transition of γ to δ. As the observed temperatures are below those of the binary transitions (734 and 735 °C), this part of the reaction scheme contains two solid-state transition reactions (U1, U2) connected with a minimum of the three-phase field [δ + (Ag) + γ].
All invariant reactions proposed in the current paper are listed together with the estimated compositions of the involved phases in Table 6. The compositions of the solid phases can be estimated easily as ternary solubilities are generally low. The composition of the liquid phase was estimated by combining the vertical sections with information obtained from primary crystallization studies of as cast samples. The results of these as cast studies are summarized in Table 7 and they are also shown as experimental data points in the liquidus surface projection given in Fig. 8. A selection of as-cast microstructures is given in Fig. 9. The as-cast sample with the composition Ag26Cu50Si24 is situated exactly on the eutectic composition E1. This is a significant difference from the eutectic composition of Ag30Cu44.7Si25.3 reported previously.[12] In fact, we also realized this composition with an as-cast sample and found primary crystals of Si there. The eutectic composition of E2 reported in Ref 12 is in good agreement with our own value.

Liquidus surface projection for Ag-Cu-Si. Yellow circles denote the nominal compositions of the as-cast samples listed in Table 7 (Color figure online)

Microstructures of selected as-cast samples. (a), Ag26Cu50Si24 (eutectic E1); (b) magnified microstructure E1; (c) Ag10Cu70Si20 (primary η); (d) Ag5Cu90Si5 (primary Cu); (e) Ag20Cu65Si15 (primary Ag); (f) Ag20Cu50Si30 (primary Si)
4 Conclusions
Although no ternary phase exists in the system Ag-Cu-Si, the ternary phase equilibria are complex and the experimental determination of the reaction scheme was demanding. This is mainly due to the complex limiting binary system Cu-Si, showing 6 binary phases coexisting in a relatively small composition- and temperature-range. In the current work we present the first consistent description of the ternary phase diagram based on experimental data from powder XRD, SEM/EDX and DTA. A complete isothermal section at 650 °C was determined and additional samples annealed at 710, 740 and 760 °C were used to clarify equilibria involving the high temperature phases in the limiting Cu-Si system. DTA results in two vertical sections at 10 and 20 at.% Ag were combined with the results from primary crystallization studies of as-cast samples to construct a reaction scheme and a liquidus surface projection. Two ternary eutectic reactions and eight ternary transition reactions are proposed in the reaction scheme. Not all of the proposed phase reactions were determined experimentally; in particular, the two reactions involving the β phase of Cu-Si are hypothetic. However, the presented data are for sure sufficient for a thermodynamic modelling of the Ag-Cu-Si phase diagram allowing extrapolating the missing reactions.
References
P.R. Subramanian and J.H. Perepezko, The Ag-Cu (Silver-Copper) System, J. Phase Equilib., 1993, 14, p 62-75
R.W. Olesinski, A.B. Gokhale, and G.J. Abbaschian, The Ag-Si (Silver-Silicon) System, Bull. Alloy Phase Diagrams, 1989, 10, p 635-640
R.W. Olesinski and G.J. Abbaschian, The Cu-Si (Copper-Silicon) System, Bull. Alloy Phase Diagr., 1986, 7, p 170-178
X.Y. Yan and Y.A. Chang, A Thermodynamic Analysis of the Cu-Si System, J. Alloys Compd., 2000, 308, p 221-229
K. Sufryd, N. Ponweiser, P. Riani, K.W. Richter, and G. Cacciamani, Experimental Investigation of the Cu-Si Phase Diagram at x(Cu) > 0.72, Intermetallics, 2011, 19, p 1479-1488
J.K. Solberg, Crystal-Structure of Eta-Cu3si Precipitates in Silicon, Acta Cryst. A, 1978, 34, p 684-698
K.P. Mukherje, J.P. Bandyopadhyaya, and K.P. Gupta, Phase Relationship and Crystal Structure of Intermediate Phases in Cu-Si System in Composition Range of 17 at Pct Si to 25 at Pct Si, Trans. Met. Soc. AIME, 1969, 245, p 2335
C.-Y. Wen and F. Spaepen, In Situ Electron Microscopy of the Phases of Cu3Si, Philos. Mag., 2007, 87, p 5581-5599
C.-Y. Wen and F. Spaepen, Filling the Voids in Silicon Single Crystals by Precipitation of Cu3Si, Philos. Mag., 2007, 87, p 5565-5579
N. Mattern, R. Seyrich, L. Wilde, C. Baehtz, M. Knapp, and J. Acker, Phase Formation of Rapidly Quenched Cu-Si Alloys, J. Alloys Compd., 2007, 429, p 211-215
P. Riani, K. Sufryd, and G. Cacciamani, About the Al-Cu-Si Isothermal Section at 500 °C and the Stability of the ε-Cu15Si4 Phase, Intermetallics, 2009, 17, p 154-164
Z.G. Liu, X.M. Luo, G.S. Guo, C.X. He, G.B. Li, and Q.Y. Zhang, The Liquidus of the Ternary Ag-Cu-Si Alloy System, Acta Metall. Sin. (Engl. Lett.), 1998, 11, p 325-328
X. Luo, Z. Liu, G. He, G. Guo, and D. Chen, Temperature Traverse Sections of Ag-Cu-Si System, Guijinshu, 2000, 21, p 7-9
Bruker AXS, TOPAS V4.2: General Profile and Structure Analysis Software for Powder Diffraction Data, Karlsruhe, Germany, 2009
P. Villars and L.D. Calvert, Pearson’s Handbook of Crystallographic Data, ASM, Materials Park, 1991
Acknowledgments
Open access funding provided by University of Vienna. The authors wish to thank Dr. Stephan Puchegger from the Department of Physics, University of Vienna, for his help with SEM measurements. We also acknowledge experimental contributions of the following graduate students: Kamal Allahyarli, Florian Bachmann, Christoph Bendl, Sebastian Geier, Jan Kotmel, Anto Puljic, Joseph Ring, Jasmin Schubert, Remzi Tuncar, Hanna Trzesniowski, Igor Zaidel and Ivan Zivadinov.
Author information
Authors and Affiliations
Corresponding author
Additional information
This article is dedicated to the memory of Herbert Ipser (1947-2019), professor emeritus and past chair of the Department of Inorganic Chemistry-Materials Chemistry of the University of Vienna.
Publisher's Note
Springer Nature remains neutral with regard to jurisdictional claims in published maps and institutional affiliations.
Electronic supplementary material
Below is the link to the electronic supplementary material.
11669_2020_781_MOESM1_ESM.pdf
Experimental DTA curves for all samples listed in Table 5 are given as supporting material (PDF 836 kb)
Rights and permissions
Open Access This article is licensed under a Creative Commons Attribution 4.0 International License, which permits use, sharing, adaptation, distribution and reproduction in any medium or format, as long as you give appropriate credit to the original author(s) and the source, provide a link to the Creative Commons licence, and indicate if changes were made. The images or other third party material in this article are included in the article's Creative Commons licence, unless indicated otherwise in a credit line to the material. If material is not included in the article's Creative Commons licence and your intended use is not permitted by statutory regulation or exceeds the permitted use, you will need to obtain permission directly from the copyright holder. To view a copy of this licence, visit http://creativecommons.org/licenses/by/4.0/.
About this article

Cite this article
Yang, H., Reisinger, G., Flandorfer, H. et al. Phase Equilibria in the System Ag-Cu-Si. J. Phase Equilib. Diffus. 41, 79–92 (2020). https://doi.org/10.1007/s11669-020-00781-w
Received:
Revised:
Published:
Issue Date:
DOI: https://doi.org/10.1007/s11669-020-00781-w