
Abstract
Closed forms of stabilizing sets are generally only available for linearized systems. An innovative numerical strategy to estimate stabilizing sets of PI or PID controllers tackling (uncertain) nonlinear systems is proposed. The stability of the closed-loop system is characterized by the sign of the largest Lyapunov exponent (LLE). In this framework, the bottleneck is the computational cost associated with the solution of the system, particularly including uncertainties. To overcome this issue, an adaptive surrogate algorithm, the Monte Carlo intersite Voronoi (MiVor) scheme, is adopted to pertinently explore the domain of the controller parameters and classify it into stable/unstable regions from a low number of nonlinear estimations. The result of the random analysis is a stochastic set providing probability information regarding the capabilities of PI or PID controllers to stabilize the nonlinear system and the risk of instabilities. The minimum of the LLE is proposed as tuning rule of the controller parameters. It is expected that using a tuning rule like this results in PID controllers producing the highest closed-loop convergence rate, thus being robust against model parametric uncertainties and capable of avoiding large fluctuating behavior. The capabilities of the innovative approach are demonstrated by estimating robust stabilizing sets for the blood glucose regulation problem in type 1 diabetes patients.
1 Introduction
The classical proportional-integral-derivative (PID) controller is the main player in engineering applications to automatically regulate most process variables [59]. However, it has been observed that only about one-third of the PID-based control loops work properly, one third have poorly tuned controllers, and the last third of the loops have controllers that are not working automatically but are bypassed by the users to operate them in manual mode [36]. These drawbacks are not due to the lack of tuning rules, as over 1700 PID controller tuning rules have been referenced in [53].
A first limitation is due to the difficulty of accurately modeling real systems. One possibility might be that the understanding of a given system to synthesize an accurate first-principle model is not always complete. Another possibility is that a complete model does exist, but its mathematical complexity makes it impractical or inconvenient to use in control applications [2]. Besides, controller design is usually based on linearization or heuristic simplification, which assumes that nonlinear systems can be accurately represented by a first- or second-order plus time delay linear models [5, 44, 45]. Finally, real working conditions are not precisely predictable, so designing a robust controller to the uncertain operating conditions is not an easy task, see, e.g., [3, 56] for a specific review on the topic. To limit modeling simplifications, the tuning problem can be reformulated into an explicit optimization problem where one or several closed-loop performance indices are minimized to design a goal-oriented optimal PID controller [65]. However, this versatile approach faces classical optimization challenges, e.g., the objective function might be nonconvex, nonlinear or with several local minima. Additionally, it usually aims at designing an unique optimal operating point, specifically designed for a chosen objective while disregarding the uncertain controller environment. Therefore, it might result in a lack of robustness of the obtained PID controllers against the system parametric uncertainty [68].
This challenge has recently been handled in, e.g., [57] by using stochastic programming techniques. The PID controller tuning problem is formulated as a stochastic problem where both model parameters and closed-loop system set points are modeled as random variables. Then, these random variables are sampled using a Monte Carlo algorithm, and many realizations of the closed-loop system dynamical evolution are evaluated in order to find the set of controller parameters minimizing a cost function describing the system’s performance. Such a framework allows to robustly optimize the dynamical performance of uncertain closed-loop systems. However, one limitation persists, namely the PID controller parameter space is not a priori classified into stable/unstable behaviors. Therefore, significant computational resources could be allocated to search solutions of the optimization problem into the unstable controller region, whereas non-stabilizing behavior could lead to catastrophic outputs [55]. It has been shown that even for linear cases, the stabilizing set can be composed of an unbounded set, a close bounded set, or even more than one closed bounded disconnected set within the parametric design space [19].
The estimation of the parametric subdomain leading to stable behavior has received considerable attention in the technical literature for the last two decades, but only considering linear systems where computationally tractable algorithms that estimate the complete set of stabilizing PID controllers have been developed. The reader is referred to [60] for a comparative overview of different approaches for the calculation of the set of all stabilizing PID controller parameters. Furthermore, see [19, 22, 61] for a more detailed description about the challenges of computing these PID stabilizing regions and the algorithmic implementation of some of the available methods.
Schematic representation of a closed-loop system
The Routh–Hurwitz criterion is the most popular criterion for the first- and second-order linear time invariant systems to find the PI/PID controller stabilizing set. But, a naive application of Routh–Hurwitz’s criterion will result in a description of the stabilizing set composed of highly nonlinear and intractable inequalities [18]. Uncertain linear systems, on the other hand, are commonly represented as so-called interval plants, and their stability is analyzed through their characteristic interval polynomial employing the Kharitonov theorem [8, 35]. However, this approximation is only valid for the first-order controllers such as PI controllers. The analysis of PID controllers requires more general results, such as the generalized Kharitonov theorem [15]. Nonetheless, this theorem is not applicable for nonlinear systems. To the best of the authors knowledge, no approach has been presented yet to compute the PID stabilizing set of nonlinear systems. This is the goal of the current work.
The strategy proposed in this work aims to efficiently compute the PID stabilizing set of nonlinear systems in a finite time frame, considering system uncertainties if required. It is built upon an adaptive randomized algorithm and the analysis of the stability using the largest Lyapunov exponent (LLE) to evaluate whether a nonlinear system is internally stable or not along some state trajectories [54]. Specifically, a positive LLE indicates that the closed-loop system presents unstable behavior, whereas a negative LLE indicates that the closed-loop system is stable [58]. Thus, the PID controller space can be explored and classified into stabilizing or non-stabilizing. Recent efforts have been made to speed up the computation of the LLE in nonlinear systems, e.g., methods based on non-logarithm computations [17] have been applied to the analysis of the regulation error of closed-loop systems [7] leading to 20–50 % of computational cost reduction in the LLE estimation. However, LLE calculation for every possible point within the parametric space would still be time-consuming and computational resource-heavy. Randomized algorithms have been proposed in the past as simple and efficient solution for computing controllable, reachable, and controllers’ terminal region sets of nonlinear systems, [13, 62]. A detailed review of applications has been exposed in [63]. The main challenge of adopting a randomized algorithm is due to the curse of dimensionality [28]. To overcome this limitation, the proposed numerical strategy relies on an adaptive surrogate model technique to speed this process up, the so-called Monte Carlo intersite Voronoi (MiVor) scheme [24]. This algorithm is dedicated to classification analysis based on regression metamodels supported by a machine learning technique known as ordinary kriging that is defined by Gaussian processes. (The reader is referred to [42] for an overview of ordinary kriging.) By using the MiVor algorithm, the domain of the PID controller parameters is proficiently explored allowing to identify the stabilizing region of closed-loop nonlinear systems at low cost. Furthermore, this approach is extended to incorporate system uncertainties due to mixed effects of initial and working conditions, resulting in a probabilistic PID controller stabilizing set with which it is possible to robustly select the PID controller parameters guaranteeing the closed-loop system’s internal stability.
The validity of the presented approach is shown for the blood glucose regulation in type 1 diabetes patients adopting the nonlinear model presented in [38]. For this application, computing robust stabilizing sets based on linear approaches can easily lead to controllers that either stabilize the closed-loop system in a long impractical (and physiologically dangerous) time window or produce poor closed-loop performance. Then, using the LLE as the controller’s tuning rule, controller performance limits are determined for PI and PID scenarios. Stabilizing sets are computed for nominal and uncertain closed-loop simulations, and their dynamical performance is evaluated adopting some performance indices. The proposed computational framework opens up possibilities for the design of PI and PID controllers, which will be explored in the present paper.
The remainder of this paper is organized as follows: The problem formulation of computing the PID stabilizing set for uncertain nonlinear systems is introduced in Sect. 2. The new numerical strategy based on LLE and the adaptive surrogate model MiVor is presented in Sect. 3, which is the core of the contribution. Two variants are proposed to tackle nominal or robust design of the controller. Section 4 illustrates the application of the proposed approach to compute PI and PID stabilizing sets to the blood glucose regulation problem in type 1 diabetes patients. Some final discussions and concluding remarks are provided in Sect. 5.
2 Guaranteeing the stability behavior of a nonlinear dynamic system
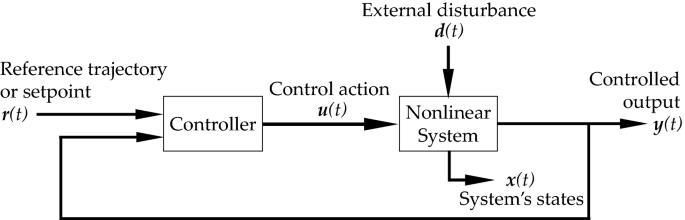
A representation of the feedback control system considered in this work is illustrated in Fig. 1. In general terms, the purpose of such a closed-loop configuration is to regulate the output \({\varvec{y}}(t) \in {\mathcal {Y}} \subseteq {\mathbb {R}}^{n_{y}}\) to asymptotically track the reference trajectory \({\varvec{r}}(t) \in {\mathcal {R}} \subseteq {\mathbb {R}}^{n_{r}}\), based on the variation of the control action \({\varvec{u}}(t) \in {\mathcal {U}} \subseteq {\mathbb {R}}^{n_{u}}\), while a class of exogenous disturbances \({\varvec{d}}(t) \in {\mathcal {D}} \subseteq {\mathbb {R}}^{n_{d}}\) is applied. \({\varvec{x}} \in {\mathcal {X}} \subseteq {\mathbb {R}}^{n_{x}}\) denotes the set of internal variables or states, which can be quantities of interest without being controlled by the user, hence \({\mathcal {Y}} \subseteq {\mathcal {X}}\). The (sub)sets \({\mathcal {X}}\), \({\mathcal {U}}\), \({\mathcal {Y}}\), and \({\mathcal {D}}\) are compact. Symbols \(n_{x}\), \(n_{u}\), \(n_{y}\), \(n_{d}\), and \(n_{p}\) denote the consistent space dimensions.
Nonlinear dynamical systems can be generally described by the following set of equations:
where \({\varvec{f}} : {\mathbb {R}}^{n_{x}} \times {\mathbb {R}}^{n_{u}} \times {\mathbb {R}}^{n_{d}} \times {\mathbb {R}}^{n_{p}} \rightarrow {\mathbb {R}}^{n_{x}}\) and \({\varvec{g}} : {\mathbb {R}}^{n_{x}} \times {\mathbb {R}}^{n_{u}} \times {\mathbb {R}}^{n_{d}} \times {\mathbb {R}}^{n_{p}} \rightarrow {\mathbb {R}}^{n_{y}}\) could be either linear or nonlinear locally Lipschitz-continuous differentiable functions. The system parameters \({\varvec{p}} \in {\mathcal {P}} \subseteq {\mathbb {R}}^{n_{p}}\) can be uncertain with \({\mathcal {P}}\) a compact (sub)set and \(n_{p}\) the parameters space dimension. It is important to remark that many control systems are defined such that they are affine in their control variables. Therefore, if necessary, a reformulation of Eq. (1) can be done under the additional assumption that \({\varvec{u}}\) is Lipschitz continuous such that the nonlinear control system is affine in the control function \({\varvec{u}}\) [34]. However, here no assumption of linearity in control variable is done, and the approach is exposed for general cases.
2.1 The robust output regulation problem
For the case of (uncertain) nonlinear systems, it is often assumed that the disturbances \({\varvec{d}}(t)\) and the references \({\varvec{r}}(t)\) have the following properties (e.g., see Khalil’s work [39]):
-
(1)
\({\varvec{d}}(t)\) and \({\varvec{r}}(t)\) and their derivatives up to the i-th derivative are bounded. The derivatives of these function at degree i denoted, respectively, by \({\varvec{d}}^{(i)}(t)\) and \({\varvec{r}}^{(i)}(t)\) are piecewise continuous.
-
(2)
\({\mathcal {D}}(t)\) and \({\mathcal {R}}(t)\) are defined as
$$\begin{aligned} {\mathcal {D}}(t) = \begin{bmatrix} {\varvec{d}}(t) \\ \vdots \\ {\varvec{d}}^{(i)}(t) \end{bmatrix}, \quad {\mathcal {R}}(t) = \begin{bmatrix} {\varvec{r}}(t) \\ \vdots \\ {\varvec{r}}^{(i)}(t) \end{bmatrix}, \end{aligned}$$(2) -
(3)
\(\lim _{t \rightarrow \infty } \left[ {\mathcal {D}}(t) - \bar{{\mathcal {D}}}(t) \right] = {\varvec{0}}\) and \(\lim _{t \rightarrow \infty } \left[ {\mathcal {R}}(t) - \bar{{\mathcal {R}}}(t) \right] = {\varvec{0}}\), where \(\bar{{\mathcal {D}}}\) and \(\bar{{\mathcal {R}}}\) are generated by the exosystem
$$\begin{aligned} \begin{aligned} \dot{{\varvec{w}}} = S({\varvec{\sigma }}) {\varvec{w}}, \\ \begin{bmatrix} \bar{{\mathcal {D}}} \\ \bar{{\mathcal {R}}} \end{bmatrix} = \varGamma ({\varvec{w}}). \end{aligned} \end{aligned}$$(3)Functions \(S(\cdot )\) and \(\varGamma (\cdot )\) are assumed to be smooth functions and \({\varvec{w}}\) belongs to a compact set \({\mathcal {W}}\). The exosystem depends on a vector \({\varvec{\sigma }} \in {\mathbb {R}}^{n_{\sigma }}\) of unknown parameters, with its values assumed to range over a known compact set \(\varSigma \).
The regulation error is defined by
The control input \({\varvec{u}}\) to the system described by Eq. (1) has to be provided by an error-feedback controller modeled by equations of the form
with the states \({\varvec{\xi }} \in \varXi \subseteq {\mathbb {R}}^{n_{\xi }}\) and where \(\varXi \) is a compact (sub)set of dimension \(n_{\xi }\). The functions \(\varLambda ({\varvec{\xi }}, {\varvec{e}})\) and \(\varTheta ({\varvec{\xi }}, {\varvec{e}})\) are smooth with \(\varLambda ({\varvec{0}}, {\varvec{0}}) = {\varvec{0}}\) and \(\varTheta ({\varvec{0}}, {\varvec{0}}) = {\varvec{0}}\).
Let the vector \({\varvec{\nu }}\) be given by
Then, the regulation problem consists of finding a controller of the form as detailed in Eq. (5) with parameters tuning the evolution of the control law defined in the set \({\mathcal {K}}_{\xi } \subseteq {\mathbb {R}}^{n_{{\mathcal {K}}_{\xi }}}\), such that:
-
(1)
the equilibrium \(({\varvec{x}},{\varvec{\xi }}) = {\varvec{0}}\) of the unforced closed-loop system
$$\begin{aligned} \begin{aligned} \dot{{\varvec{x}}}&= {\varvec{f}}({\varvec{x}},\varTheta ({\varvec{\xi }},{\varvec{e}}),{\varvec{\nu }},{\varvec{p}}), \\ {\varvec{\dot{{\varvec{\xi }}}}}&= \varLambda ({\varvec{\xi }},{\varvec{g}}({\varvec{x}},{\varvec{\nu }},{\varvec{p}})), \end{aligned} \end{aligned}$$(7)is asymptotically stable for every \({\varvec{p}}\);
-
(2)
the trajectory \(({\varvec{x}}(t),{\varvec{\xi }}(t))\) of the closed-loop system
$$\begin{aligned} \begin{aligned} \dot{{\varvec{\nu }}}&= S({\varvec{\sigma }}){\varvec{\nu }}, \\ \dot{{\varvec{x}}}&= {\varvec{f}}({\varvec{x}},\varTheta ({\varvec{\xi }},{\varvec{e}}),{\varvec{\nu }},{\varvec{p}}), \\ {\varvec{\dot{{\varvec{\xi }}}}}&= \varLambda ({\varvec{\xi }},{\varvec{g}}({\varvec{x}},{\varvec{\nu }},{\varvec{p}}) - {\varvec{r}}), \end{aligned} \end{aligned}$$(8)exists for all \(t \ge 0\), is bounded and satisfies
$$\begin{aligned} \lim _{t \rightarrow \infty } {\varvec{e}} = {\varvec{0}} \end{aligned}$$(9)for any \({\varvec{p}}\) and \(\varSigma \), independent of the initial conditions \(({\varvec{x}}(0),{\varvec{\xi }}(0),{\varvec{\nu }}(0))\).
Thus, \(\lim _{t \rightarrow \infty } {\varvec{\nu }} = {\varvec{0}}\) and \({\varvec{\nu }}(t)\) remains in a compact set. The steady-state behavior of the system is represented by the zero-error manifold given by \(({\varvec{x}},{\varvec{\xi }}) = {\varvec{0}}\). The system representation of Eq. (8) is known as the normal form of the system (1), and it defines the robust nonlinear output regulation problem where PI or PID controllers could be designed to achieve the control objective [23, 39, 40, 46].
Disturbance rejection and reference tracking must be achieved while preserving the internal stability of the closed-loop system. It is well known that for (uncertain) nonlinear systems this task can be successfully achieved in a robust sense by some types of integral controllers as proved in [40]. Particularly, the PID controller in its classical form is also able to achieve robust regulation for piecewise constant references while rejecting constant or vanishing perturbations, e.g., see [21]. More recently, this result was extended using a discontinuous PID controller able to track general time-varying references in finite time while rejecting general time-varying perturbations for uncertain single-input single-output nonlinear systems [46]. Nonetheless, this work is only concerned with the first case, i.e., the asymptotic tracking of a piecewise constant reference \({\varvec{r}}(t)\) and the rejection of constant or vanishing perturbations \({\varvec{d}}(t)\) for which the control objective can be achieved using PI or PID controllers.
2.2 PI/PID controllers
In this work, classical PI and PID controllers are adopted. Considering a PID controller, the value of the control action \({\varvec{u}}(t)\) is computed from the feedback error \({\varvec{e}}(t) = {\varvec{r}}(t) - {\varvec{y}}(t)\) as follows:
The control action is then defined by the sum of three terms. The first term, \(k_{p}\), named P-term is proportional to the error. The second term, \(k_{i}\), which is proportional to the integral of the error is usually referred to as the I-term. Finally, the last term, \(k_{d}\), defined by being proportional to the derivative of the error is called the D-term. From Eq. (10), control actions corresponding to P, PI, or PD controllers could be derived straightforwardly by just canceling out the non-including actions, e.g., setting \(k_{d} = 0\), for defining a PI controller.
The I-term of the PID controller guarantees that \({\varvec{y}}(t)\) will asymptotically track \({\varvec{r}}(t)\) as long as the closed-loop control system is stable. The addition of an integrator to the plant tends to make the systems less stable because the integrator is an inherently unstable device. Therefore, the problem of stabilizing the closed-loop control system becomes a critical issue, whereas the open-loop nonlinear system could be intrinsically stable [18]. Accordingly, the combination of the P- and I-terms is needed, if possible, to stabilize the closed-loop control system and to adjust the transient response of the system. Thus, the aim of this work is to efficiently solve the problem of stabilizing (uncertain) nonlinear systems by PI or PID controllers, more particularly to compute in a computational tractable way the entire set of PI or PID stabilizing controllers given a reasonable finite time to achieve the output regulation.
2.3 PI/PID stabilizing sets
Consider the case of a PID controller. The PID stabilizing set of the nonlinear system given by Eq. (1) consists in the set \(\varOmega _{\text {PID}}\) of parameters \({\varvec{k}} := \left[ k_{p}, k_{i}, k_{d} \right] \) such that for all initial values \( {\varvec{x}}(0)\) within the controller’s terminal region \(\varOmega ({\varvec{x}}) \subseteq {\mathcal {C}}_{t}\), any disturbance \({\varvec{d}}(t) \in {\mathcal {D}}\) can be attenuated by the system such that the state can recover an equilibrium point, while the output reaches the reference value, i.e.,
where \({\varvec{x}}^{*}\) is an equilibrium point of the system (1) and \(n_{r} = n_{y}\). The controller parameter space is denoted by \({\mathcal {K}} \subseteq {\mathbb {R}}^{3}\).
For nonlinear cases, the existence of the set \(\varOmega _{\text {PID}}\) for a class of the second-order nonlinear uncertain systems has recently been proven in [70]. This result has been extended to a general class of single-input single-output high-order affine-nonlinear uncertain systems in [71]. Nonetheless, the estimation of \(\varOmega _{\text {PID}}\) for closed-loop (uncertain) nonlinear systems remains challenging. One of the main limitations is the lack of tools to accurately determine its boundaries without simultaneously leading to a nonlinear-nonconvex optimization problem for most of the set-membership parameter problems [14]. However, instead of choosing a direct estimation of \(\varOmega _{\text {PID}}\), it is possible to use a Monte Carlo approach spanning the controller parameter space \({\mathcal {K}}\) to evaluate an indicator of the closed-loop system’s convergence rate for each sample, and then classify \({\mathcal {K}}\) into stable or unstable regions from these discrete simulations. It can be noticed that definition given by Eq. (11) also applies for the PI controller case if \(k_{d} = 0\).
It can be noticed that Eq. (11) requires that the stabilization of the closed-loop control system is guaranteed at infinity. However, this mathematical definition appears not be entirely compatible with real-life applications, where it is desired that the system stabilizes in a finite time and satisfies some transient response requirements, e.g., oscillations of reasonable amplitudes. From an engineering viewpoint, all these additional controller design specifications are included in the search for \(\varOmega _{\text {PID}}\). In this paper, we tackle the problem of the finite time stabilization of the controlled output by evaluating a priori whether the closed-loop system reaches its steady state in a user given time to the computation of the LLE. Moreover, because the computation of the controller’s stabilizing set is based on the LLE—informing the rate of convergence of the closed-loop system—this information can be further exploited and the PI/PID controller tuning parameters selected such that they coincide with the minimum LLE, an idea previously introduced in [7]. Thus, as an additional advantage of the data-driven solution, an optimal PI/PID controller is designed from the performance viewpoint similar to those typically designed to minimize, e.g., some indices performance as the integral of the absolute error or integral of the time-weighted absolute error indices.
2.4 Controllable set
The controllable set, which plays an important role in the analysis of nonlinear systems, is composed of all the states \({\varvec{x}} \in {\mathcal {X}}\) from which the system can be driven to the operating point \({\varvec{x}}^{*}\), assumed to be stable in the sense of Lyapunov, by applying a sequence of control actions \({\varvec{u}}(\bullet ) \in {\mathcal {U}}\) without any restrictions on the controller design method [28, 29, 66].
Given a set \(\varOmega _{\tau }\), such that \({\varvec{x}}^{*} \in \varOmega _{\tau }\), the controllable set \({\mathcal {C}}_{t}(\varOmega _{\tau })\) to \(\varOmega _{\tau }\) in a time \(t = \tau \) is the set of all states \({\varvec{x}}\) for which \({\varvec{x}}(0) \in {\mathcal {X}}\) and a sequence of control actions \({\varvec{u}}(\bullet ) \in {\mathcal {U}}\) exists such that if \({\varvec{x}}^{*}\) can be reached from \({\varvec{x}}\), then \({\varvec{x}}(\tau ) \in \varOmega _{\tau }\), as follows:
where \(\varphi \) is the transition function that represents the system evolution from the initial condition \({\varvec{x}}(0)\) to the final one \({\varvec{x}}(\tau ) = \varphi (\tau ;{\varvec{x}}(0),t)\). The controllable set satisfies the two crucial following properties:
-
(1)
\({\mathcal {C}}_{t}(\varOmega _{\tau })\) is an invariant set with respect to the set of the admissible control actions set \({\mathcal {U}}\).
-
(2)
\({\mathcal {C}}_{t}\) is the set of all initial conditions of system (1) in the admissible state-space from which it is possible to drive system (1) to the interior of \(\varOmega _{\tau }\) with a given sequence of control actions and a time \(t < \infty \).
\(\varOmega _{\tau }\) must not be a single state-space point but a small state-space region because the probability of driving the system to a single point is equal to zero. The size of \(\varOmega _{\tau }\) can be thought of as a controller accuracy constraint, i.e., if the size of \(\varOmega _{\tau }\) approaches the size of a point in the state-space, a very precise control strategy must be implemented to drive the system inside \(\varOmega _{\tau }\). On the contrary, if \(\varOmega _{\tau }\) represents a larger state-space region, a more flexible control strategy could be adopted.
3 Innovative numerical strategy to efficiently estimate robust stabilizing sets
The goal of this work is to propose a numerical approach for estimating the PI/PID stabilizing set of (uncertain) nonlinear systems at low computational cost. The approach is based on Monte Carlo sampling and equipped with adaptive surrogate model technique to explore the parametric space very efficiently and reduce the explicit nonlinear computations most proficiently. This strategy allows for computing the stabilizing set at reasonable cost even for challenging scenarios, as controllers in the presence of uncertainty in terms of initial conditions or external disturbance.
3.1 Stability information
The stabilizing set has been defined by Eq. (11). A practical tool to question the stability of a differential equation is Lyapunov exponents denoted by \(\lbrace \lambda _{i} \rbrace _{i \in 1, n_{x}}\) and defined as the averaged convergence rate of nearby orbits in state-space [54]. From the spectrum of these exponents, the local stability or instability of the system can be known. A negative \(\lambda _{i}\) reveals local stability in this direction, whereas a positive value indicates instability [58]. Analytical solutions of the Lyapunov exponents are only available for simple problems. For more complicated continuous problems, numerical techniques have been proposed to estimate the Lyapunov exponents by following the evolution of principal axes on a given time series as proposed in [9, 43, 58, 69]. These methods employed in multiple studies, e.g., [4, 37], are naturally reliant on the descriptiveness of the given time series setting. From a comparative study [16], it has been established that the Wolf algorithm proposed by [69] performs better for small data sets compared to the Rosenstein method [58]. Based on this premise, the Wolf algorithm is employed herein.
Given time series data and a meaningful time frame, this method offers a practical tool to check for the stability of a nonlinear system in finite time. As defined previously, the controller parameters denoted \({\varvec{k}}\) that yield stable behavior are looked for within \({\mathcal {K}} \subseteq {\mathbb {R}}^{3}\). Furthermore, let one element of \({\mathcal {C}}_{t}(\varOmega _{\tau })\) given by Eq. (12) be denoted by \({\varvec{c}}\). Time series data are assumed to be dependent on \({\varvec{c}}\), \({\varvec{p}}\), \({\varvec{k}}\), at a time interval \([0, \ t_{f}]\), the output time series is given by \({\varvec{\tilde{x}}}( {\varvec{c}}, {\varvec{p}}, {\varvec{k}} )\). In detail, \({\varvec{\tilde{x}}}\) can either refer to the exact or numerical estimate of the system’s model and has the same dimension as the system space state \(n_{x}\). Then, based on the Wolf algorithm [69], the largest Lyapunov exponent \(\hbox {LLE}( {\varvec{\tilde{x}}}( {\varvec{c}}, {\varvec{p}}, {\varvec{k}} )) = \max \limits _{i \in [1, n_{x}]} \lambda _{i}\) as the quantity of interest is numerically estimated at time \(t = t_{f}\). The PID stabilizing set can be numerically approximated through a discretized computation based on the evaluation of the LLE for a large set of \(n_\mathrm{ref}\) points uniformly distributed over the parametric domain \({\mathcal {K}}\). Thus, the stabilizing region is given by the \(n^{+}\) reference points which yield a stabilizing behavior, whereas the unstable region is the complementary parametric domain associated with the \(n^{-}\) points with non-stabilizing behavior, such that \(n = n^{+} + n^{-}\). It is well established that the larger the number of samples \(n_\mathrm{ref}\), the better the approximation of the PID stabilizing set. However, increasing the number of reference points can also drastically increase the required computational effort, particularly due to the curse of dimensionality.
3.2 Surrogate model generation
To reduce the computational cost due to the sampling approach, a kriging surrogate model is adopted based on an efficient adaptive sampling technique called Monte Carlo intersite Voronoi (MiVor) [24]. Used for the stability analysis of a friction-induced oscillator of Duffing’s type, it has shown to yield accurate results for complex binary classification problems [25]. MiVor relies on the interpolation of observations by the so-called ordinary kriging technique which is defined by Gaussian processes. In general, ordinary kriging surrogate models can be trained with existing training data \({\mathcal {D}}_\mathrm{train} = \lbrace ({\varvec{k}}^{i}, \hbox {LLE}^{i}) \in {\mathbb {R}}^{n_\mathrm{train}}\), \(i=1, \ldots , m_\mathrm{train} \rbrace \), with \(n_\mathrm{train}\) the space of the training data. However, since an evaluation of the function LLE is time-expensive, the number of data points \(m_\mathrm{train}\) in the training set shall be as small as possible while yielding acceptable prediction. For that purpose, adaptive sampling techniques allow to efficiently generate a small dataset [26].
Starting from an initial set of observation points \({\mathcal {D}}_\mathrm{ini} = \lbrace ({\varvec{k}}^{i}, \hbox {LLE}^{i}), i=1, \ldots , m \rbrace \), such that \(m \ll m_\mathrm{train}\), a surrogate model \({\widehat{\hbox {LLE}}}: {\mathbb {R}}^{n_\mathrm{train}} \rightarrow {\mathbb {R}}\) is generated that aims to fit the given data based on a best linear unbiased predictor. Adaptive sampling techniques generally rely on the evaluation of the current metamodel \({\widehat{\hbox {LLE}}}\) to design a new sample point \({\varvec{k}}^{m+1}\) that shall decrease the error of the updated metamodel with respect to the exact function at most. In this context, MiVor provides balanced contribution from random exploration of the parametric space and localized exploitation of regions with specific features. In details, as long as samples are only within one class of stabilizing or non-stabilizing behaviors, the new sample is defined randomly to scan the domain and get unpredictable new knowledge. As soon as the dataset includes samples with both behaviors, exploitation of the dataset is performed based on the analysis of a Voronoi tessellation built upon existing samples. Then, the new sample is attributed to zones which are assumed to be associated with crucial lack of knowledge, i.e., regions where lie uncertain boundaries between two classes (here: stable or unstable). The dataset is iteratively enlarged until a convergence criterion is fulfilled and an acceptable surrogate model is established. The general workflow of enriching the data sets to compute PID stabilizing sets of nonlinear systems using the MiVor algorithm is visualized in Fig. 2. Exhaustive details about the algorithm are given in [25].

Workflow for building a metamodel based on an adaptive design of experiments with the MiVor algorithm
3.3 Guarantee of robustness
In the literature, it is well known that PID controllers and in general linear feedback controllers, have a local validity, i.e., considering fixed controller parameters, the closed-loop system might work well only around nominal operating conditions, whereas its performance may deteriorate, deviating from its nominal value for instance, or even become unstable if large disturbances occur [1, 52]. It is noteworthy that evaluating the closed-loop capabilities to drive the system to the setpoint once a disturbance appears is equivalent to evaluating the capabilities to handle a variety of initial conditions. Similarly deterioration and instabilities are also observed for nonlinear systems submitted to parametric uncertainty. Thus, estimating to what extend the PID controller validity holds or evaluating if the closed-loop system response deteriorates symmetrically around the nominal operating point is interesting information for practical applications.
An extended numerical strategy to efficiently estimate the effect of the initial condition and parametric uncertainty on the system controlled-output is proposed to enhance the closed-loop system analysis. The controllable set \({\mathcal {C}}_{t}\) is sampled evenly \(m_{c}\) times using a fast Latin hypercube technique [67] to create the set \({\mathbb {C}} = \lbrace {\varvec{c}}^{1}, \ldots ,{\varvec{c}}^{i}, \ldots , {\varvec{ c}}^{m_{c}}\rbrace \). For each initial condition \({\varvec{c}}^{i}\), the uncertain parameters are sampled \(m_{p}\) times to obtain \({\mathbb {P}} = \lbrace {{\varvec{p}}^{1}, \ldots ,{\varvec{p}}^{j}, \ldots {\varvec{p}}^{m_{p}}} \rbrace \) using the same sampling technique. Then, for each \({\varvec{c}}^{i}\) and \({\varvec{p}}^{j}\) with \((i,j)\in [1,m_c]\times [1,m_p]\), a metamodel is built utilizing the MiVor adaptive algorithm [24].
For each metamodel, the set \({\mathbb {K}}\) is initialized with \(m_{k_\mathrm{ini}}\) samples uniformly distributed over the parametric domain using the Latin hypercube algorithm. The adaptive sampling process is stopped as soon as the dataset contains \(m_{k}\) samples, when it is assumed that the metamodel has reached an acceptable accuracy.
Therefore, during the process, \(m_{c} \times m_{p}\) metamodels are generated, with each surrogate model based on \(m_{k}\) time-series data sets. Our interest is on the stabilizing behavior of the system over the controller parametric domain, so considering a uniform distribution over both the initial conditions and uncertain parametric conditions, a probabilistic metamodel is obtained. It can be noticed that based on the same strategy, different distributions could be considered for uncertain initial conditions and parameters. Such probabilistic knowledge can be exploited using all usual probabilistic tools. For instance, the probability of instability can be evaluated. Thus, parameters associated with zero probability of instability preserve the closed-loop system’s internal stability independently of the initial conditions and parameters within their definition spaces. Then, decision-making can be done based on the information of probable unstable responses for some cases. Besides, the averaged metamodel, which gives the mean LLE value over the complete range \({\mathcal {K}}\), can be estimated as follows:
The knowledge of \(\overline{{\widehat{\hbox {LLE}}}}\) allows to evaluate the mean behavior of the controller over the whole controller design parametric space \({\mathcal {K}}\), i.e., averaging the stability behavior including the epistemic uncertainty due to the lack of knowledge on initial conditions and some other possible uncertain running conditions. Similarly standard deviation or other probabilistic tools could be employed as soon as usual Monte Carlo convergence requirements are numerically satisfied. The strategy workflow is summarized in Fig. 3. It is based on two iterative loops. The external loop takes the effect of the closed-loop initial conditions over the PI stabilizing set into account, whereas the inner loop iterates on the model parametric samples. Thus, an independent metamodel is adaptively built for each possible pair of initial conditions and model parameters so that mixed effects on the stabilizing set can be described. Finally, all the metamodel samples are analyzed together to get a probabilistic analysis of the PI/PID stabilizing region on the controller parameter domain. As a result, the subset of PI/PID controllers assuring a robust stabilization of the nonlinear closed-loop system is identified.

Workflow for building a metamodel to obtain robust control parameters given uncertain initial state and parameters
It can be noticed that estimating the stabilizing set requires a priori knowledge about the controllable set \({\mathcal {C}}_{t}\), i.e., the set of initial conditions from which it is possible to control the open-loop system to the desired set-point in a given time t. The algorithm to estimate the controllable set is given in “Appendix C.”
4 Case study: blood glucose regulation in type 1 diabetes
The number of people with diabetes had risen from 108 million in 1980 to 422 million in 2014 [64]. Thus, the global prevalence of diabetes among adults over 18 years of age has risen from \(4.7 \%\) in 1980 to \(8.5 \%\) in 2014. The patient of type 1 diabetes is totally dependent on an external source of insulin to be infused at an appropriate rate to maintain blood glucose level within the narrow physiological range of 60–120 mg/dl.
4.1 Nonlinear dynamical model of type 1 diabetes
Many physiological models have been proposed to describe glucose and/or insulin dynamics in type 1 diabetes [6, 41]. Among them, the model adopted in this study is an extended version of the Bergman’s minimal model [10] denoted as Ext-BMM [38]. Even though it is rather simple, that model is well known, able to capture main features of the blood glucose and insulin dynamics for some known physiological facts and has been validated by a number of clinical studies, e.g., in [11]. Thus, it has been frequently adopted to study the blood glucose regulation problem [41], for instance in [50, 51] for control-related works.
It is essentially a compartmental model consisting of plasma glucose compartment, remote insulin compartment, and plasma insulin compartment. The meal disturbance dynamics are also considered as an extended state of the system. System dynamics can be written in its deviation form as follows:
where unknowns G, X, I, and \(U_{G}\) refer to plasma glucose, remote insulin, plasma insulin concentrations, and meal disturbance dynamics, respectively. Moreover, \(G_{ss}\), \(X_{ss}\), \(I_{ss}\), and \(U_{G_{ss}}\) are the values of the state variables at the equilibrium point or steady-state given in Table 1. The control input denoted u is the exogenous insulin infusion per volume required to regulate the blood glucose concentration, so \(u(t) = U_{I}(t)/V_{I}\) with \(U_{I}(t)\) the exogenous insulin infusion and \(V_{I}\) the insulin distribution volume, which is a patient-dependent characteristic. The meal disturbance activation input to reproduce meal ingestion and the exercise net effect are represented by two step functions of finite duration denoted \(\delta U_{G}\) and \(\delta I\), respectively.
The model depends on seven parameters \(p_1\), \(p_2\), \(p_3\), n, \(p_5\), \(V_{I}\), and \(G_{b}\), which are defined and quantified in Table 2 [6]. It can be highlighted that here \(V_{I}\) and \(G_{b}\) are considered as deterministic values, whereas \(p_1\), \(p_2\), n, and \(p_5\) can potentially be uncertain and only nominal values \(p_{i}^{*}\) and \(n^{*}\) are given in Table 2. Indeed, discrepancies of physiological parameters have been observed between individuals as inter-patient variability [12, 30]. But also, a given individual could present day-to-day variation as intra-patient variability [20, 48]. Therefore, parameters \(p_{1}\), \(p_{2}\), \(p_{5}\) and n are modeled as uniform random numbers on a domain with \( \pm 20\%\) variation from the nominal values following [49].
To provide simple and clear visualization, results based on the innovative strategy are first shown for a nominal PI controller. All results for \(k_p\) are given in \(10^{-1} \, \text {mU}\,\text {mg}^{-1}\,\text {min}^{-1}\), for \(k_i\) in \(10^{-1} \,\text {mU}\,\text {mg}^{-1}\,\text {min}^{-2}\) and for \( k_d\) in \(10^{-1}\,\text {mU}\,\text {mg}^{-1}\).
4.2 Meal disturbance and exercise simulation setup
For a given set of PI/PID controller parameter values, the blood glucose concentration will be studied during a time slot of 20 hours, from 4 am to 12 am. During that period, four meal disturbance inputs (meal intake) are considered as detailed in Table 3 and illustrated in Fig. 4. Additionally, moderate-intensity exercise is considered from 11 am to 12 am. The effect of this single exercise bout on plasma insulin concentration is characterized as a direct disturbance on the insulin dynamics through a step change with a magnitude of \(1.5 \, \text {mU}\,\text {l} ^{-1}\,\text {min}^{-1}\) applied to \(\delta I\) [27].

Meal disturbance simulation setup. Four meal disturbance inputs (meal intake) are considered: breakfast at 8 AM, lunch at 1 PM, a snack at 4 PM, and the dinner at 7 PM. These meal intakes approximate a common daily routine of an average person
4.3 Nominal stabilizing set by the MiVor algorithm
Estimating stabilizing sets based on linearization could lead to a lack of capacity to regulate the blood glucose concentration within the required range and a risk of huge oscillations, as exposed in “Appendix A.” To overcome these drawbacks, the MiVor strategy based on the nonlinear model of the system is used here for nominal PI and PID controllers. In order to present the results in a general way, PI and PID controller parameters as well as the characteristic time of the stabilizing regions will be normalized. For instance, normalized controller’s proportional gain, \({\overline{k}}_{p} \in [0, 1]\), can be obtained as follows: \({\overline{k}}_{p} = (k_{p} - k_{p_{\min }})/(k_{p_{\max }} - k_{p_{\min }})\) where \(k_{p}\) is the value of the proportional gain in the original range, \(k_{p_{\min }}\) and \(k_{p_{\max }}\) are the minimum and maximum values \(k_{p}\) can take, respectively. Same procedure applies for \(k_{i}\) and \(k_{d}\) to obtain \({\overline{k}}_{i} \in [0, 1]\) and \({\overline{k}}_{d} \in [0, 1]\). The normalized stabilizing time of the controllers stabilizing region, denoted as \({\overline{T}}\), is defined as the characteristic time of the stabilizing regions divided by the system’s open-loop setting time, defined as the time elapsed from the application of a step input to the time at which the open-loop system output has entered and remains within an error band of \(1\%\) of the new steady state. For the system described by Eq. (14), this time turned out to be \(t = 5000\) min.

Stability analysis based on the nominal nonlinear model for the PI controller (NomNL) at \({\overline{T}} = 1\) (black dashed line) compared to the linearized models for nominal NomL-PI controller (blue dotted line): a \({\widehat{\hbox {LLE}}}\) values b surrogate classification into stable (gray) and non-stable (red) regions. The red dots denote the location of minimal \({\widehat{\hbox {LLE}}}\) value. (Color figure online)

PI stabilizing set at different times: \({\widehat{\hbox {LLE}}}\) at a \({\overline{T}} = 1\), b \({\overline{T}} = 0.3\), c \({\overline{T}} = 0.2\), d boundaries between stable and non-stable regions for different values of \({\overline{T}}\). Red and gray regions represent the unstable and stable regions, respectively, for the case \({\overline{T}}=1\). Red symbols and the blue dot denote the location of minimal \({\widehat{\hbox {LLE}}}\) values. (Color figure online)
4.3.1 PI controller case
First, a PI controller for the nominal case of the nonlinear system given by the set of equations (14) is analyzed. The parametric domains for \(k_{p^\mathrm{PI}}\) and \(k_{i^\mathrm{PI}}\) are [0, 0.1] and \([0, 6 \times 10^{-6}]\), respectively, while \(k_{d^\mathrm{PI}}\) is set to 0. The main control objective is to drive the blood glucose level back to its nominal value (80 mg/dl) within 240 min after a meal disturbance appears.
A convergence analysis of the MiVor results with respect to straightforward Monte Carlo reference solution is presented in “Appendix B.” Only metamodels considered as converged are exposed herein. They are generated from an initial dataset of 10 sample points and 120 additional points designed with the adaptive MiVor scheme. In “Appendix B,” it is shown that, thanks to the MiVor algorithm, sample points for couples (\({\overline{k}}_{p^\mathrm{PI}}\), \({\overline{k}}_{i^\mathrm{PI}}\)) within the parameters domain for the evaluation of the Ext. BBM system performance is automatically located around the stabilizing region (i.e., the area of interest). Furthermore, only 150 sample points located via MiVor lead practically a \(100\%\) accuracy in the stability region classification, with respect to an uniform (and non-adaptive) evaluation of 20,000 points in the parameters domain.
Stability analysis at \({\overline{T}} = 1\). In Fig. 5a the \({\widehat{\hbox {LLE}}}\) metamodel at \({\overline{T}} = 1\) is depicted with the black dashed line representing the boundary between positive and negative values. It is noteworthy that the smallest LLE value is not located in the middle of the stabilizing region but slightly shifted to the bottom left-hand side corner, as indicated by the red dot. This differs from the result based on the linearization approach exposed in “Appendix A.” In fact, using a linear-based approach led to a PI controller parameters set that is located outside the nominal stabilizing region adopting the nonlinear approximation. The implication of this result is that the so-called nominal linear PI controller (NomL-PI) produces an oscillatory response of the nonlinear closed-loop system (see Fig. 13 in “Appendix A”).
In Fig. 5b, from the \({\widehat{\hbox {LLE}}}\) information, the normalized parametric space \(\overline{{\mathcal {K}}}\) is classified into the regions producing a stable closed-loop system response represented as a gray subdomain, and the unstable behavior colored in red. Again, in comparison with linearized results (see “Appendix A”), it can be observed that the nonlinear stabilizing region is much smaller than the PI stabilizing region considering the nominal linear model (NomL-PI controller).
Stability analysis for different stabilizing times. Contrary to linearization approaches, the analysis of stability based on the LLE may depend on the time frame in which the system internal stability is observed. Consequently, varying the time of interest could affect the estimation of the PI stabilizing region. PI stabilizing regions obtained for times \({\overline{T}} = \lbrace 1, 0.3, 0.2, 0.1 \rbrace \) are shown in Fig. 6. It can be noticed that the PI stabilizing region shrinks when the time of interest is smaller. Thus, the stabilizing region is the smallest set when \({\overline{T}} = 0.2\). The localization of the minimum LLE value also changes as the analysis time varies, even though, for all the simulated cases this minimum LLE value is located near to the bottom left-hand side corner of the PI controller domain. The normalized parameters corresponding to minimum LLE value for each case are detailed in Table 4.

PI stabilizing set at \({\overline{T}} = 0.1\): a \({\widehat{\hbox {LLE}}}\), b comparison of the location of minimal \({\widehat{\hbox {LLE}}}\) value at \({\overline{T}} = 0.1\) (blue point) with respect to the locations at \({\overline{T}} = \lbrace 1, 0.3, 0.2 \rbrace \) (red symbols). Zoom of Fig. 6d. (Color figure online)

PID stabilizing sets at a \({\overline{T}} = 0.048\) and b \({\overline{T}} = 0.1\). Black dots denote the location of \(\min ({\widehat{\hbox {LLE}}})\). (Color figure online)
From Fig. 6d, it can be noticed that at \({\overline{T}} = 0.2\), the size of the PI stabilizing region has significantly shrunk compared to the set at \({\overline{T}} = 1\). It can be established that below \({\overline{T}} = 0.1\) the stabilizing region almost vanishes as shown in Fig. 7a. The PI controller parameters are reported in Table 4 and illustrated as blue dots in Fig. 7. A zoom on the boundaries of the stabilizing domains is presented in Fig. 7b. The stabilizing set obtained at \({\overline{T}} = 0.1\) is not contained by the other stable regions, highlighting the dependency of the analysis on the time at which system’s internal stability is studied. As \({\widehat{\hbox {LLE}}}\) is positive for almost the whole parametric domain, as illustrated in Fig. 7a, adopting a PI controller for the nonlinear problem of interest appears insufficient as it is not possible to stabilize the closed-loop control system at times lower than \({\overline{T}} = 0.1\) (i.e., 8.3 h). In fact, this time interval is too long for the blood glucose regulation problem, which includes perturbations around every 4 h due to meal intake or physical activity within the daily routine. Therefore, these results open the door for adopting better a PID controller including the derivative gain \(k_{d}\) in order to enhance the closed-loop control system performance.

Robust stabilizing regions for PI controller considering initial condition and model uncertainty: \({\widehat{\hbox {LLE}}}_{ij}\) at a \({\overline{T}} = 0.2\) and c \({\overline{T}} = 0.3\), probability of belonging to stabilizing class at b \({\overline{T}} = 0.2\) and d \({\overline{T}} = 0.3\). The dashed black line delimits the stable (gray) and unstable (red) regions, with unstable region defined as the domain for which \(\overline{{\widehat{\hbox {LLE}}}} > 0\). Red dots denote the location of the minimal value of \(\overline{{\widehat{\hbox {LLE}}}}\). (Color figure online)

Robust stabilizing regions for PID controller considering initial condition and model uncertainty: \({\widehat{\hbox {LLE}}}_{ij}\) at a \({\overline{T}} = 0.048\) and c \({\overline{T}} = 0.1\), probability of belonging to stabilizing class at a \({\overline{T}} = 0.048\) and c \({\overline{T}} = 0.1\). Black dots denote the location of the minimal value of \(\overline{{\widehat{\hbox {LLE}}}}\). (Color figure online)
4.3.2 PID controller case
The stabilizing set for the PID controller with nominal values of the model parameters is estimated with the surrogate model based on 30 initial sample points equally distributed over the normalized parametric domain and additional 170 points obtained with the adaptive MiVor scheme. The parametric domain is defined as: \(k_{p^\mathrm{PID}} \in [0, 1]\), \(k_{i^\mathrm{PID}} \in [0, 6 \times 10^{-2}]\), and \(k_{d^\mathrm{PID}} \in [0, 10]\). The PID stabilizing sets considering \({\overline{T}} = 0.1\) and \({\overline{T}} = 0.048\) (\(t = 240\) min) are represented in Fig. 8a, b, respectively. \({\widehat{\hbox {LLE}}}\) values inside the stable region are depicted, whereas positive values are not depicted for sake of clear visualization. It can be noticed that only a slight difference in size and shape between both PID stabilizing sets is obtained. However, \({\widehat{\hbox {LLE}}}\) profiles significantly differ within the stabilizing set leading to a large difference in the localization of the minimal \({\widehat{\hbox {LLE}}}\) values, optimal normalized parameters are detailed in Table 5 for both cases. Besides, it can be seen that in the case of the PID stabilizing region at \({\overline{T}} = 0.1\), the amplitude of the negative \({\widehat{\hbox {LLE}}}\) values is higher, whereas at \({\overline{T}} = 0.048\) there are more PID controller parameters near to the instability due to the proximity of the \({\widehat{\hbox {LLE}}}\) values to zero. As expected, for both cases, a larger \({\overline{k}}_{d^\mathrm{PID}}\) results in a larger size of the stabilizing set projected onto the plane \({\overline{k}}_{p^\mathrm{PID}} - {\overline{k}}_{i^\mathrm{PID}}\), as observed by other authors for linear applications [31, 32].
4.4 Robust stabilizing set by the MiVor algorithm
In this section, the extended method to compute the PI/PID stabilizing region of nonlinear systems including the effect of uncertain initial conditions and model parameter \({\varvec{p}}\) is investigated for the similar nonlinear model defined by Eq. (14). The controllable set is estimated considering \({\overline{T}} = 0.1\) as reference time. For sake of compactness, only results considering mixed effects of initial conditions and model parameters are exposed herein. However, similar strategy can be developed for investigating only one of these effects.
4.4.1 PI controller case
In the previous section, it was concluded that a PI controller is not enough to regulate the blood glucose level to its nominal value in a practical time interval. For sure, this result is not expected to change when considering the effect of the initial conditions and model parameters uncertainty. However, for comparison purposes, probabilistic stabilizing regions are computed for a PI controller to investigate how they are affected by uncertainties in terms of size and shape at \({\overline{T}} = \lbrace 0.3, 0.2 \rbrace \). The controller parameter space is defined as \(k_{p^\mathrm{Rob-PI}} \in [0, 0.03]\) and \(k_{i^\mathrm{Rob-PI}} \in [0, 9 \times 10^{-5}]\).
The mean metamodels estimated over 300 metamodels are shown in Fig. 9a, c for \({\overline{T}} = 0.2\) and \({\overline{T}} = 0.3\), respectively, where the boundary between positive and negative LLE values is delimited by the transition from the light to the dark red color (positive values). The boundary of the LLE reference solution at \({\overline{T}} = 0.3\) accounting for the nominal model parameters is plotted (dashed line) for comparison purposes. The minimal values of \({\widehat{\hbox {LLE}}}\), considered as the controller tuning criterion, are visualized as red dots. It can be noticed that the position of the two minimal values is practically coincident. In Fig. 9b, d the probability of belonging to stabilizing class for \({\overline{T}} = 0.2\) and \({\overline{T}} = 0.3\) is presented, and the probability maps are very similar for both cases.
As a side note, a similar analysis considering uncertainties can be done based on a linearization approach. The results exposed in “Appendix A” show that a robust linear-based approach provides significantly smaller stabilizing sets than the nominal linear case, buy anyway highly different from the robust stabilizing set obtained considering the nonlinear approximation adopted in this work. Then, overestimating the PI controller stabilizing regions could produce a practical stabilizing time for the uncertain nonlinear system.

Closed-loop control system response for the robust PID controllers applied to the nonlinear Ext-BMM considering model parameters uncertainty
4.4.2 PID controller case
Considering similarly uncertain initial conditions and model parameters, the probabilistic stabilizing regions are evaluated over the parametric domain \(k_{p^\mathrm{Rob-PID}} \in [0, 1]\), \(k_{i^\mathrm{Rob-PID}} \in [0, 6 \times 10^{-2}]\), and \(k_{d^\mathrm{Rob-PID}} \in [0, 10]\). Average metamodels \(\overline{{\widehat{\hbox {LLE}}}}\) evaluated at \({\overline{T}} = 0.048\) and \({\overline{T}} = 0.1\) over 300 generated metamodels are shown in Fig. 10a, c, respectively. The probability of belonging to stabilizing regions is given in Fig. 10b, d. It can be noticed that, as expected, the PID stabilizing regions differ from the nominal case, which is given in Fig. 8 both in terms of size and shape. Including uncertainties, the stabilizing region has reduced its size. The locations of minimal values of the average metamodel \(\overline{{\widehat{\hbox {LLE}}}}\) are visualized by black dots as detailed in Table 6. Their positions do not significantly differ for the two time intervals, but they do from the ones without considering uncertainties (cf., the nominal in Table 5). The time \({\overline{T}} = 0.048\) (Fig. 10a, b) is associated with a very small stabilizing region, thus being the minimal time for which it is possible to robustly stabilize the closed-loop nonlinear system when adopting a PID controller.
The output of the closed-loop dynamical system for the robust PID controller is investigated for the meal disturbance and exercise bout defined in Sect. 4.2. The parameters \(p_1\), \(p_2\), \(p_3\) and n are modeled as random with uniform distributions on a domain with \(20\%\) variation from their nominal values. 1000 samples are used to represent them. It can be seen in Fig. 11 that the controller performs very well (Fig. 11d–h), and it is able to stabilize the blood glucose level within the next 2 h after a disturbance appears independently of the value of the random parameters. Besides, it can be noticed that optimizing the controller parameter, using the LLE estimations for \({\overline{T}} = 0.1\) (Fig. 11a–d) or \({\overline{T}} = 0.048\) (\(t=240\) min) (Fig. 11e–h), provides proficient and similar controllers in both cases.
As a conclusion, it can be said that, using the MiVor algorithm, it is possible to effectively classify the controller space, even under uncertainties, which are highly critical for the glucose control as for many control applications.
5 Conclusions
A computational framework based on a machine learning algorithm has been proposed in this paper to estimate the PID stabilizing set of closed-loop (uncertain) nonlinear dynamical system. It was shown that using linear approximation could easily lead to unstable responses of the closed-loop system. Therefore, the computation of the stabilizing set should be based on the original nonlinear model, thus guaranteeing a proper evaluation of the internal stability properties. To make the computation of the PI or PID stabilizing viable, the largest Lyapunov exponent (LLE) has been chosen as the system’s internal stability indicator and the MiVor algorithm was adopted to base the estimation on very few sample points. The capabilities of the approach have been demonstrated by computing the PI and PID stabilizing sets for the blood glucose regulation problem in type 1 diabetes patients. Finally, the minimum LLE has been used as a tuning rule for the PI and PID controllers leading to efficient closed-loop systems even under uncertainties. The proposed approach has been thoroughly investigated with an extensive numerical study for its application in blood glucose control. It appears flexible and proficient for nonlinear control systems under uncertainty. Hence, it might also be applicable to other applications with moderate numerical efforts. However, since the framework relies on heuristic methods, its performances need to be carefully checked when utilized for new systems.
Availability of data and material
The data that support the findings of this study can be reproduced by the MiVor code available online in github.com/FuhgJan/AdaptiveMIVor. However, if required, it is also available from the corresponding author under reasonable request.
References
Allgöwer, F., Ogunnaike, B.: Dual-mode adaptive control of nonlinear processes. Comput. Chem. Eng. 21, S155–S160 (1997)
Anderson, J., McAvoy, T., Hao, O.: Use of hybrid models in wastewater systems. Ind. Eng. Chem. Res. 39(6), 1694–1704 (2000)
Apkarian, P., Noll, D.: The h\(\infty \) control problem is solved. Aerospace Lab 1–11 (2017). https://doi.org/10.12762/2017.AL13-01. https://hal.archives-ouvertes.fr/hal-01653161/file/DTIS17051.1511517545.pdf
Awrejcewicz, J., Krysko, A., Erofeev, N., Dobriyan, V., Barulina, M., Krysko, V.: Quantifying chaos by various computational methods. Part 1: simple systems. Entropy 20(3), 175 (2018)
Bajarangbali, R., Majhi, S., Pandey, S.: Identification of FOPDT and SOPDT process dynamics using closed loop test. ISA Trans. 53(4), 1223–1231 (2014)
Balakrishnan, N., Rangaiah, G., Samavedham, L.: Review and analysis of blood glucose (BG) models for type 1 diabetic patients. Ind. Eng. Chem. Res. 50(21), 12041–12066 (2011). https://doi.org/10.1021/ie2004779
Balcerzak, M., Dabrowski, A., Pikunov, D.: Tuning the control system of a nonlinear inverted pendulum by means of the new method of Lyapunov exponents estimation. In: AIP Conference Proceedings, vol. 1922, p. 100016. AIP Publishing LLC (2018)
Barmish, B., Hollot, C., Kraus, F., Tempo, R.: Extreme point results for robust stabilization of interval plants with first-order compensators. IEEE Trans. Autom. Control 37(6), 707–714 (1992). https://doi.org/10.23919/ACC.1990.4791182
Benettin, G., Galgani, L., Giorgilli, A., Strelcyn, J.: Lyapunov characteristic exponents for smooth dynamical systems and for Hamiltonian systems; a method for computing all of them. Part 1: Theory. Meccanica 15(1), 9–20 (1980)
Bergman, R., Ider, Y., Bowden, C., Cobelli, C.: Quantitative estimation of insulin sensitivity. Am. J. Physiol. Endocrinol. Metab. 236(6), E667 (1979). https://doi.org/10.1152/ajpendo.1979.236.6.E667
Bergman, R.N.: Toward physiological understanding of glucose tolerance: minimal-model approach. Diabetes 38(12), 1512–1527 (1989). https://doi.org/10.2337/diab.38.12.1512
Bianchi, F.D., Moscoso-Vásquez, M., Colmegna, P., Sánchez-Pena, R.S.: Invalidation and low-order model set for artificial pancreas robust control design. J. Process Control 76, 133–140 (2019). https://doi.org/10.1016/j.jprocont.2019.02.004
Calafiore, G., Dabbene, F., Tempo, R.: Randomized algorithms in robust control. In: 42nd IEEE International Conference on Decision and Control (IEEE Cat. No.03CH37475), vol. 2, pp. 1908–1913 (2003). https://doi.org/10.1109/CDC.2003.1272894
Chachuat, B., Houska, B., Paulen, R., Peri’c, N., Rajyaguru, J., Villanueva, M.: Set-theoretic approaches in analysis, estimation and control of nonlinear systems. IFAC-PapersOnLine 48(8), 981–995. 9th IFAC Symposium on Advanced Control of Chemical Processes ADCHEM 2015 (2015)
Chapellat, H., Bhattacharyya, S.P.: A generalization of Kharitonov’s theorem; robust stability of interval plants. IEEE Trans. Autom. Control 34(3), 306–311 (1989). https://doi.org/10.1109/9.16420
Cignetti, F., Decker, L., Stergiou, N.: Sensitivity of the Wolf’s and Rosenstein’s algorithms to evaluate local dynamic stability from small gait data sets. Ann. Biomed. Eng. 40(5), 1122–1130 (2012)
Dabrowski, A., Balcerzak, M., Pikunov, D., Stefanski, A.: Improving efficiency of the largest Lyapunov exponent’s estimation by its determination from the vector field properties. Nonlinear Dyn. 1–12 (2020)
Datta, A., Ho, M., Bhattacharyya, S.: Overview of Control Systems, pp. 1–14. Springer, London (2000). https://doi.org/10.1007/978-1-4471-3651-4_1
Datta, A., Ho, M., Bhattacharyya, S.: Structure and Synthesis of PID Controllers. Springer, Berlin (2000). https://doi.org/10.1007/978-1-4471-3651-4
De Pereda, D., Romero-Vivo, S., Ricarte, B., Bondia, J.: On the prediction of glucose concentration under intra-patient variability in type 1 diabetes: a monotone systems approach. Comput. Methods Progr. Biomed. 108(3), 993–1001 (2012). https://doi.org/10.1016/j.cmpb.2012.05.012
Desoer, C., Lin, C.A.: Tracking and disturbance rejection of MIMO nonlinear systems with PI controller. IEEE Trans. Autom. Control 30(9), 861–867 (1985)
Díaz-Rodríguez, I., Han, S., Bhattacharyya, S.: Stabilizing Sets for Linear Time-Invariant Continuous-Time Plants, pp. 37–78. Springer, Cham (2019). https://doi.org/10.1007/978-3-030-18228-1_2
Forte, F., Marconi, L., Teel, A.R.: Robust nonlinear regulation: continuous-time internal models and hybrid identifiers. IEEE Trans. Autom. Control 62(7), 3136–3151 (2016)
Fuhg, J.N., Fau, A.: A classification-pursuing adaptive approach for Gaussian process regression on unlabeled data. Mechanical Systems and Signal Processing 162, 107976 (2022). https://doi.org/10.1016/j.ymssp.2021.107976
Fuhg, J.N., Fau, A.: Surrogate model approach for investigating the stability of a friction-induced oscillator of Duffing’s type. Nonlinear Dyn. 98(3), 1709–1729 (2019)
Fuhg, J.N., Fau, A., Nackenhorst, U.: State-of-the-art and comparative review of adaptive sampling methods for kriging. Arch. Comput. Methods Eng. 1–59 (2020)
Garcia-Tirado, J., Corbett, J.P., Boiroux, D., Jørgensen, J.B., Breton, M.D.: Closed-loop control with unannounced exercise for adults with type 1 diabetes using the ensemble model predictive control. J. Process Control 80, 202–210 (2019). https://doi.org/10.1016/j.jprocont.2019.05.017
Gómez, L., Botero, H., Alvarez, H., di Sciascio, F.: State controllability analysis for irreversible systems using set theory. Revista Iberoamericana de Automática e Informática Industrial RIAI 12(2), 145–153 (2015). https://doi.org/10.1016/j.riai.2015.02.002
Gómez-Pérez, C., Gómez, L., Alvarez, H.: Reference trajectory design using state controllability for batch processes. Ind. Eng. Chem. Res. 54(15), 3893–3903 (2015). https://doi.org/10.1021/ie504809x
Goodwin, G.C., Seron, M.M., Medioli, A.M., Smith, T., King, B.R., Smart, C.E.: A systematic stochastic design strategy achieving an optimal tradeoff between peak BGL and probability of hypoglycaemic events for individuals having type 1 diabetes mellitus. Biomed. Signal Process. Control 57, 101813 (2020). https://doi.org/10.1016/j.bspc.2019.101813
Han, S., Bhattacharyya, S.P.: PID controller synthesis using a \(\sigma \)-Hurwitz stability criterion. IEEE Control Syst. Lett. 2(3), 525–530 (2018). https://doi.org/10.1109/LCSYS.2018.2842784
Han, S., Keel, L., Bhattacharyya, S.: PID controller design with an H\(\infty \) criterion. IFAC-PapersOnLine 51(4), 400–405 (2018). 3rd IFAC Conference on Advances in Proportional-Integral-Derivative Control PID 2018
Ho, M., Datta, A., Bhattacharyya, S.: Robust and non-fragile PID controller design. Int. J. Robust Nonlinear Control 11(7), 681–708 (2001). https://doi.org/10.1002/rnc.618
Houska, B., Chachuat, B.: Branch-and-lift algorithm for deterministic global optimization in nonlinear optimal control. J. Optim. Theory Appl. 162(1), 208–248 (2014)
Huang, Y.J., Wang, Y.J.: Robust PID tuning strategy for uncertain plants based on the Kharitonov theorem. ISA Trans. 39(4), 419–431 (2000). https://doi.org/10.1016/S0019-0578(00)00026-4
Hägglund, T.: The one-third rule for PI controller tuning. Comput. Chem. Eng. 127, 25–30 (2019). https://doi.org/10.1016/j.compchemeng.2019.03.027
Iasemidis, L., Sackellares, J., Zaveri, H., Williams, W.: Phase space topography and the Lyapunov exponent of electrocorticograms in partial seizures. Brain Topogr. 2(3), 187–201 (1990)
Kaveh, P., Shtessel, Y.B.: Blood glucose regulation in diabetics using sliding mode control techniques. In: 2006 Proceeding of the Thirty-Eighth Southeastern Symposium on System Theory, pp. 171–175. https://doi.org/10.1109/SSST.2006.1619068 (2006)
Khalil, H.K.: On the design of robust servomechanisms for minimum phase nonlinear systems. Int. J. Robust Nonlinear Control IFAC Affiliated J. 10(5), 339–361 (2000)
Khalil, H.K.: Universal integral controllers for minimum-phase nonlinear systems. IEEE Trans. Autom. Control 45(3), 490–494 (2000)
Khodaei, M.J., Candelino, N., Mehrvarz, A., Jalili, N.: Physiological closed-loop control (PCLC) systems: review of a modern frontier in automation. IEEE Access 8, 23965–24005 (2020). https://doi.org/10.1109/ACCESS.2020.2968440
Kleijnen, J.: Kriging metamodeling in simulation: a review. Eur. J. Oper. Res. 192(3), 707–716 (2009)
Liu, H., Dai, Z., Li, W., Gong, X., Yu, Z.: Noise robust estimates of the largest Lyapunov exponent. Phys. Lett. A 341(1–4), 119–127 (2005)
Liu, T., Wang, Q.G., Huang, H.P.: A tutorial review on process identification from step or relay feedback test. J. Process Control 23(10), 1597–1623 (2013)
Luyben, W.L.: Derivation of transfer functions for highly nonlinear distillation columns. Ind. Eng. Chem. Res. 26(12), 2490–2495 (1987)
Moreno, J.A.: Asymptotic tracking and disturbance rejection of time-varying signals with a discontinuous PID controller. J. Process Control 87, 79–90 (2020)
Morilla, F., Vázquez, F., Hernández, R.: PID control design with guaranteed stability. IFAC Proc. 39(6), 13–18 (2006). 7th IFAC Symposium on Advances in Control Education
Moscoso-Vásquez, M., Colmegna, P., Rosales, N., Garelli, F., Sanchez-Pena, R.: Control-oriented model with intra-patient variations for an artificial pancreas. IEEE J. Biomed. Health Inf. (2020). https://doi.org/10.1109/JBHI.2020.2969389
Nath, A., Deb, D., Dey, R.: Robust observer-based adaptive control of blood glucose in diabetic patients. Int. J. Control (2020). https://doi.org/10.1080/00207179.2020.1750705
Nath, A., Deb, D., Dey, R., Das, S.: Blood glucose regulation in type 1 diabetic patients: an adaptive parametric compensation control-based approach. IET Syst. Biol. 12(5), 219–225 (2018). https://doi.org/10.1049/iet-syb.2017.0093
Nath, A., Dey, R., Aguilar-Avelar, C.: Observer based nonlinear control design for glucose regulation in type 1 diabetic patients: an LMI approach. Biomed. Signal Process. Control 47, 7–15 (2019). https://doi.org/10.1016/j.bspc.2018.07.020
Nuella, I., Cheng, C., Chiu, M.: Adaptive PID controller design for nonlinear systems. Ind. Eng. Chem. Res. 48(10), 4877–4883 (2009)
O’Dwyer, A.: Handbook of PI and PID Controller Tuning Rules, 2nd edn. Imperial College Press, London (2006). https://doi.org/10.1142/p424
Oseledec, V.: A multiplicative ergodic theorem. Lyapunov characteristic number for dynamical systems. Trans. Mosc. Math. Soc. 19, 197–231 (1968)
Pedret, C., Vilanova, R., Moreno, R., Serra, I.: A refinement procedure for PID controller tuning. Comput. Chem. Eng. 26(6), 903–908 (2002). https://doi.org/10.1016/S0098-1354(02)00011-X
Petersen, I.R., Tempo, R.: Robust control of uncertain systems: classical results and recent developments. Automatica 50(5), 1315–1335 (2014). https://doi.org/10.1016/j.automatica.2014.02.042
Renteria, J., Cao, Y., Dowling, A., Zavala, V.: Optimal PID controller tuning using stochastic programming techniques. AIChE J. 64(8), 2997–3010 (2018). https://doi.org/10.1002/aic.16030
Rosenstein, M., Collins, J., De Luca, C.: A practical method for calculating largest Lyapunov exponents from small data sets. Physica D Nonlinear Phenomena 65(1–2), 117–134 (1993)
Samad, T.: A survey on industry impact and challenges thereof. IEEE Control Syst. Mag. 37(1), 17–18 (2017). https://doi.org/10.1109/MCS.2016.2621438
Schrödel, F., Manickavasagam, S., Abel, D.: A comparative overview of different approaches for calculating the set of all stabilizing PID controller parameters. IFAC-PapersOnLine 48(14), 43–49 (2015). https://doi.org/10.1016/j.ifacol.2015.09.431. http://www.sciencedirect.com/science/article/pii/S2405896315015505. 8th IFAC Symposium on Robust Control Design ROCOND 2015
Silva, G., Datta, A., Bhattacharyya, S.: PID Controllers for Time-Delay Systems. Springer, Berlin (2007). https://doi.org/10.1007/b138796
Tempo, R., Calafiore, G., Dabbene, F.: Randomized Algorithms for Analysis and Control of Uncertain Systems, chap. Randomized Algorithms in Systems and Control, pp. 107–115. Springer, London (2005). https://doi.org/10.1007/1-84628-052-4_8
Tempo, R., Calafiore, G., Dabbene, F.: Applications of Randomized Algorithms, pp. 283–327. Springer, London (2013)
The Emerging Risk Factors Collaboration: Diabetes mellitus, fasting blood glucose concentration, and risk of vascular disease: a collaborative meta-analysis of 102 prospective studies. The Lancet 375(9733), 2215–2222 (2010). https://doi.org/10.1016/S0140-6736(10)60484-9.http://www.sciencedirect.com/science/article/pii/S0140673610604849
Urrea-Quintero, J., Hernández-Riveros, J., Muñoz-Galeano, N.: Optimum PI/PID controllers tuning via an evolutionary algorithm. In: Shamsuzzoha, M. (ed.) PID Control for Industrial Processes, chap. 3. IntechOpen, Rijeka (2018). https://doi.org/10.5772/intechopen.74297
Urrea-Quintero, J.H., Hernández, H., Ochoa, S.: Towards a controllability analysis of multiscale systems: application of the set-theoretic approach to a semi-batch emulsion polymerization process. Comput. Chem. Eng. (2020). https://doi.org/10.1016/j.compchemeng.2020.106833
Viana, F., Venter, G., Balabanov, V.: An algorithm for fast optimal Latin hypercube design of experiments. Int. J. Numer. Methods Eng. 82(2), 135–156 (2010)
Vilanova, R., Alfaro, V.M., Arrieta, O.: Robustness in PID control. In: PID Control in the Third Millennium. Springer, pp. 113–145 (2012)
Wolf, A.: Quantifying chaos with Lyapunov exponents. Chaos 16, 285–317 (1986)
Zhang, J., Guo, L.: Theory and design of PID controller for nonlinear uncertain systems. IEEE Control Syst. Lett. 3(3), 643–648 (2019)
Zhao, C., Guo, L.: Extended PID control of nonlinear uncertain systems (2019). arXiv:1901.00973
Acknowledgements
First author acknowledges the financial support from the Institute of Continuum Mechanics (IKM), Leibniz University Hannover, provided during his visit as guest researcher in 2020 particularly to Prof. Dr.-Ing. habil., Dr. h.c. mult., Dr.-Ing. E. h Peter Wriggers for the kind welcome. J. N. Fuhg acknowledges the support from the Deutsche Forschungsgemeinschaft under Germany’s Excellence Strategy within the Cluster of Excellence PhoenixD (EXC 2122, Project ID 390833453). M. Marino acknowledges that this work has been funded partially by the Masterplan SMART BIOTECS (Ministry of Science and Culture of Lower Saxony, Germany) and partially by the Program for Young Researchers (Anno 2017 “Rita Levi Montalcini,” Ministry of Education, University and Research, Italy). A. Fau acknowledges that the achievement of this research activity has been possible thanks to the support of the French-German University through the French-German doctoral college “Sophisticated Numerical and Testing Approaches (CDFA/DFDK 04-19)”.
Funding
Open Access funding enabled and organized by Projekt DEAL.
Author information
Authors and Affiliations
Corresponding author
Ethics declarations
Conflict of interest
The authors declare that they have no conflict of interest.
Code availability
Codes to reproduce all the results presented in this manuscript will be available online upon acceptance for publication.
Additional information
Publisher's Note
Springer Nature remains neutral with regard to jurisdictional claims in published maps and institutional affiliations.
Appendices
Appendix A: controller design based on linearization approach
Controller stabilizing regions for nonlinear applications are commonly estimated based on the linearization of the governing system equations around a stable equilibrium point. Thus, in this appendix, Kharitonov’s theorem [8, 35] is adopted to compute the PI controller stabilizing set when applied to the blood glucose concentration regulation problem in patients with type 1 diabetes, considering the model given by Eq. (14) with the exogenous insulin infusion per volume u as control input.
The nonlinear model is linearized in an equilibrium point denoted \({\varvec{x}}_{ss} = \lbrace G_{ss}, X_{ss}, I_{ss}, U_{G_{ss}} \rbrace \), which is the trivial solution corresponding to zero input values. The equilibrium state is detailed in Table 1, where \(G_{b}\) and \(I_{b}\) are patient-specific constants given in Table 2.
The linear relation is transformed from time to frequency domain using Laplace transformation. The transformations of G(t) and u(t) are denoted \(\tilde{G}(s)\) and \(\tilde{U}(s)\), respectively, and they depend on the frequency s. Based on the Kharitonov theorem, the set of the stabilizing PI controllers is estimated from the expression of the transfer function P defined as follows:
The Kharitonov theorem addresses the stability problem of interval polynomials [15]. Thus, it can be considered as a generalization of the Routh–Hurwitz stability test, which tackles polynomials with fixed coefficients, to study the stability of polynomials with uncertain coefficients. The resulting normalized nominal PI stabilizing set over the values \({\overline{k}}_{p^\mathrm{PI}}\) and \({\overline{k}}_{i^\mathrm{PI}}\) is visualized in Fig. 12.

PI stabilizing sets based on linearization around an equilibrium point
Considering an uncertainty up to 20 \(\%\) in the transfer function coefficients, a robust set of PI controllers capable of facing the random challenge is estimated. It can be observed that considering the system uncertainty, the size of the PI stabilizing region is largely reduced as previously observed in [32, 33, 47].
Controller parameters are designed following the non-fragile tuning criterion, i.e., avoiding PI controller values close to instability in the \({\overline{k}}_{p^\mathrm{PI}}\)-\({\overline{k}}_{i^\mathrm{PI}}\) plane [33]. Then, parametric values are selected at the center of the largest circle inscribed inside the stabilizing region. For the nominal case referred to as the nominal-linear PI controller (NomL-PI), the controller parameters are \(k_{p}^{\text {NomL-PI}} = 0.041\) and \(k_{i}^{\text {NomL-PI}} = 2.280 \times 10^{-4}\), represented by the red square. For the robust design called the robust-linear PI controller (RobL-PI), the PI controller parameters represented by the red dot, following the same non-fragile criterion, are \(k_{p} ^{\text {RobL-PI}}= 0.022\) and \(k_{i}^{\text {RobL-PI}} = 1.170 \times 10^{-4}\).
These stabilizing parameters have thus been designed from a linearization of the nonlinear system. A simulation is performed to verify whether controllers perform indeed satisfactorily considering the nonlinear Ext-BMM model as given in Eq. (14).
The closed-loop variability response is investigated adopting the simulation setup for the meal disturbance and exercise bout specified in Sect. 4.2 assuming the four model parameters \(p_1\), \(p_2\), \(p_3\) and \(p_5\) are random numbers with uniform distribution between 0.8 and 1.2 times their nominal values.
Results obtained from 1000 samples are displayed in Fig. 13a–d for the NomL-PI controller and in Fig. 13e–h for the RobL-PI controller.

Responses of the closed-loop control system for NomL-PI and RobL-PI controllers

MiVor convergence study for the PI stabilizing region at \({\overline{T}} = 0.2\). a Sample positions of the metamodel over the parametric space, b convergence of the two error metrics over the number of samples

MiVor convergence for the PI controller at \({\overline{T}} = 0.15\). a Positions of the 150 metamodel samples over the parametric space, b convergence of the two error metrics over the number of samples
The control input, which is the exogenous insulin infusion per volume required to regulate the blood glucose concentration, is shown in Fig. 13a, e for the NomL-PI and RobL-PI controllers, respectively. It can be seen that the robust controller provides a control input with much less fluctuation even for important variations of the model parameters. Similar observations can be done for the remote insulin X and the plasma insulin concentration I in Fig. 13b, f and c, g. The main interest is on the control output, and the plasma glucose G is illustrated in Fig. 13d, h. It can be seen that the control output shows large oscillations and neither NomL-PI nor RobL-PI controllers are able to maintain the blood glucose within the hypo-/hyperglycemia limits considering the nonlinear model for the applied disturbances. Additionally, the closed-loop system considering the nonlinear model seems to never reach the steady state before the appearance of next disturbances. Thus, a PI controller able to robustly preserve the stability of the linearized closed-loop system is not enough to fulfill the blood glucose regulation control objective.
Appendix B: MiVor algorithm convergence test
In this appendix, the convergence behavior of the MiVor technique for the nominal nonlinear PI controller stabilizing case is exposed. The convergence of the surrogate model is checked in comparison with a reference solution obtained from \(n_\mathrm{ref} = 20{,}000\) points uniformly distributed over the parametric domain. These points are split between the number of reference points in the stabilizing region denoted \(n_\mathrm{ref}^{+}\) and the number of reference points which yield an unstable result denoted \(n_\mathrm{ref} ^{-}\) such that \(n_\mathrm{ref} = n_\mathrm{ref}^{+} + n_\mathrm{ref}^{-}\). The accuracy of the metamodel is estimated through the point-wise metrics \(a_{p}^{-}\) and \(a_{p}^{+}\), which describe the number of points in percent of \(n_\mathrm{ref}^{-}\) and \(n_\mathrm{ref}^{+}\), respectively, which are accurately classified by the metamodel.
From an initial set of 10 sample points uniformly distributed over the parametric domain, 140 points are added to the dataset using the adaptive MiVor scheme. Due to the randomness of the adaptive scheme, the metrics are averaged over 10 independent runs of the scheme. Sample positions and metamodel visualizations are randomly picked among the set of results.
The surrogate approach is validated for the nominal controller at \({\overline{T}} = 0.2\) as shown in Fig. 14. The reference classification between non-stabilizing region in red and stabilizing domain in gray for the reference solution is depicted as well as MiVor sample points in Fig. 14a. A majority of them are found around the stabilizing region. The averaged convergence of the metrics is shown in Fig. 14b. It can be seen that after around 70 samples both indicators reach a value of around \(99\%\) correctly classified points. However, the stabilizing region of that example is rather large as shown in Fig. 14a, and the next study looks at a case with a small stabilizing domain in order to investigate the robustness of the algorithm for a more challenging application.
Performances of the metamodel for the nominal controller at \({\overline{T}} = 0.15\) are shown in Fig. 15. The stabilizing and non-stabilizing regions obtained for the reference solution are highlighted in gray and red, respectively, over the parametric domain in Fig. 15a. It is visible that the stabilizing region is smaller in this case. MiVor sample points are depicted in Fig. 15a. The averaged convergence results of the error metrics are shown in Fig. 15b. It can be observed that due to the small size of the stabilizing domain, initial dataset comprises none sample within the stabilizing region, so the \(a_{p}^{-}\) value is initially zero, whereas \(a_{p}^{+}\) is at \(100\%\). After around 40 observations, a first sample with stabilizing behavior is found and \(a_{p}^{+}\) starts increasing. After around 70 samples the metric value is stabilized at around \(97\%\) accurately predicted reference points. It can be recognized that the adaptive algorithm samples particularly around the stable region, creating a metamodel with high local accuracy in that domain.
Thus, the chosen MiVor algorithm appears robust even for challenging scenario. For considered cases, 150 samples are enough to reach the MiVor algorithm convergence. Thus, all the MiVor results presented in this paper are performed taking 150 samples within the two-dimensional parametric space. For three-dimensional application, 150 samples are included in the dataset.
Appendix C: Controllable set computation
The controllable set can be approximated accurately with both a bounded error and a risk failure quantification using the randomized algorithm introduced by [28], as summarized in Box 1. The same algorithm was adopted by [29] for the controllability analysis and reference trajectories design of some semi-batch reactors.
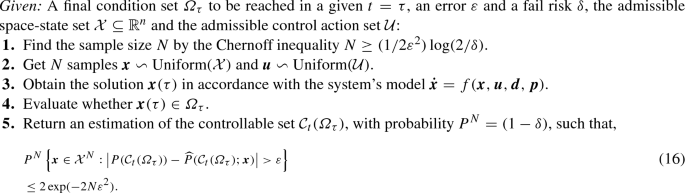
Box 1: Controllable set computation using a randomized algorithm.
Rights and permissions
Open Access This article is licensed under a Creative Commons Attribution 4.0 International License, which permits use, sharing, adaptation, distribution and reproduction in any medium or format, as long as you give appropriate credit to the original author(s) and the source, provide a link to the Creative Commons licence, and indicate if changes were made. The images or other third party material in this article are included in the article’s Creative Commons licence, unless indicated otherwise in a credit line to the material. If material is not included in the article’s Creative Commons licence and your intended use is not permitted by statutory regulation or exceeds the permitted use, you will need to obtain permission directly from the copyright holder. To view a copy of this licence, visit http://creativecommons.org/licenses/by/4.0/.
About this article

Cite this article
Urrea-Quintero, JH., Fuhg, J.N., Marino, M. et al. PI/PID controller stabilizing sets of uncertain nonlinear systems: an efficient surrogate model-based approach. Nonlinear Dyn 105, 277–299 (2021). https://doi.org/10.1007/s11071-021-06431-1
Received:
Accepted:
Published:
Issue Date:
DOI: https://doi.org/10.1007/s11071-021-06431-1