
Abstract
The in-plane shear behaviour of a new seismic retrofit concept which combines two standalone retrofit measures for in-plane and out-of-plane strengthening of masonry walls was investigated. The in-plane reinforcement consists of a single-sided carbon fabric-reinforced cementitious matrix (FRCM) overlay, while the out-of-plane reinforcement consists of deep mounted carbon fibre reinforced polymer strips embedded in a viscous-elastic epoxy. An experimental program was undertaken in which clay brick masonry wallettes were subjected to the diagonal compression test to assess the effectiveness of the strengthening system on the in-plane behaviour. The obtained results showed that the single-sided carbon FRCM overlay increased the shear capacity with 80%, compared to the unstrengthened control specimens. Moreover, by testing two different FRCM overlay thicknesses it was found that a thicker matrix layer does not increase the shear capacity of wallettes. However, wallettes provided with a thicker FRCM overlay did show a higher level of ductility. Furthermore, the obtained experimental results showed that the presence of only the aforementioned out-of-plane reinforcement does not affect the in-plane strength of masonry wallettes loaded under shear, and even prevented the disintegration after reaching the failure load compared to the unstrengthened control specimens. Finally, an existing analytical model as well as the Eurocode 8 design provisions were compared to the found failure mechanisms and failure loads. The analytical model developed showed good correspondence with the experimental values for both the failure mechanism and failure load, with an experimental/model ratio \(\left( \varphi \right)\) of 0.98, while Eurocode 8 proved to lead to conservative values.
1 Background
In Groningen, an area in the Northeast of the Netherlands, earthquakes occur because of gas production from the Groningen field. Decades of gas production led to the depletion of the pressure of hydrocarbon gas within the reservoir pore space, causing the reservoir to compact. In turn, this compaction increases the mechanical loads acting on pre-existing geological faults within and close to the reservoir. Some small fraction of these faults become unstable and are therefore prone to slip. Abrupt slip on such a fault results in an earthquake that radiates seismic energy (Bourne and Oates 2017). Although the magnitude of these induced earthquakes on Richter’s scale is relatively low (< 3.5), they have a big impact on the buildings in the region due the soft surface soils in the area and the shallow depth (3 km beneath earth’s surface) at which they occur (Van Thienen-Visser and Breunese 2015). As the majority of the buildings in Groningen are composed of cavity walls with single whyte load bearing walls of unstrengthened clay brick masonry, and are designed to only resist wind loads, it is essential to improve the earthquake resistance of the existing buildings in the area to prevent collapse, with likely casualties. A broad range of strengthening techniques for enhancing the capacity of Unstrengthened Masonry (URM) walls are available nowadays. Traditional strengthening methods such as reinforced concrete jacketing and steel frames, however, add considerable mass to the structure, are labor intensive, and generally alter the esthetics of a building (Triantafillou 1998). These disadvantages led to the idea of using Fibre Reinforced Polymers (FRP) composites for strengthening of masonry. Typically, these materials are made of Carbon (CFRP), Glass (GFRP), Basalt (BFRP) or Aramid (AFRP) fibres bonded together by an epoxy-resin. The main advantages of FRP include high strength, high stiffness, low weight and immunity to corrosion (Ianniruberto and Rinaldi 2001). Initially, FRP was used in the form of Externally Bonded (EB) sheets for both in-plane and out-of-plane strengthening of masonry. In this method firstly the surface of the substrate is prepared by removing contamination and weak surface layers, after which a FRP sheet is adhesively bonded to the substrate by means of an organic resin. This strengthening system has proven to be highly effective in enhancing both the shear capacity, the flexural capacity and the ductility of masonry walls. The main disadvantages of this method were however found to be vulnerability to environmental influences, vulnerability to fire, high cost of epoxies, lack of vapor permeability, inability to install the system on damp substrate and inability to install the system at low temperatures (Papanicolaou et al. 2008; Petersen 2009; Banijamali et al. 2015).
All these drawbacks can be mainly attributed to the organic resins used to bind the FRP to the substrate, and therefore a logical solution was the replacement of the organic binder by an inorganic binder (e.g. cement-based mortar). Moreover, continuous fibre sheets were replaced by textiles (FRP meshes) in order to achieve mechanical interlock between the textile and the cement-based mortar, since these inorganic binders lack the ability to penetrate and wet individual fibres (Papanicolaou et al. 2008). The resulting strengthening system of cement-based mortar matrix reinforced by continuous dry-fibre fabric is known under different appellations, one being fabric-reinforced cementitious matrix (FRCM) (Nanni 2012). Arboleda et al. (2014) studied the durability characteristics of the carbon FRCM composite system. Environmental stresses such as frost and chemical attack were addressed with exposure environments such as freeze/thaw cycles, high temperature water vapor and immersion in seawater. The authors concluded that no significant loss of residual tensile strength and bond strength were observed under the aforementioned conditions.
Previous experimental studies on FRCM reinforced masonry have highlighted a significant improvement for in-plane shear capacity. Mantegazza et al. (2006) performed diagonal compression tests on 11 single whyte clay brick masonry wallettes, both unstrengthened and strengthened. Based on the tests the author stated that the masonry portion involved in the load resisting mechanism is larger in FRCM strengthened specimens than that involved in unstrengthened specimens. In contrary to the unstrengthened specimens, multiple cracks were visible on these specimens. The specimens provided with a double layer of FRCM showed debonding failure. The authors found that the strengthening system modified the failure mechanism and increased both the in-plane strength and stiffness of a wallette. The increase in strength was found to be greatest for the double-sided FRCM specimens. Babaeidarabad, De Caso and Nanni (2013) carried out an experimental campaign aimed at assessing the effectiveness of carbon FRCM for the strengthening of clay brick masonry and evaluating the validity of an existing analytical model. Test results showed that the increase in ultimate in-plane strength is proportional to the amount of FRCM and ranged between 2.4 and 4.7 times that of the unstrengthened specimens. Moreover, the authors reported that substrate toe-crushing failure occurred for wallettes with a calibrated reinforcement ratio higher than 4%, and therefore increments of FRCM beyond this value are ineffective according to the researchers. Additionally, test results revealed that the FRCM strengthening method also effectively increases both the stiffness and ductility of wallettes. The increase in ductility was found to be higher for the specimens provided with 1-ply than for 4-ply FRCM to both sides. From these test results the authors inferred that the ductility of 4-ply strengthened masonry wallettes were limited by toe-crushing failure prior to FRCM failure. Thus, the failure modes of FRCM strengthened panels is directly influenced by the strengthening scheme. Ismail (2012) investigated the in-plane behaviour of double wythe clay masonry wallettes strengthened with different types of FRCM systems. The shear strength of single-sided retrofitted wallettes ranged from 113 to 148% compared with the strength of the unstrengthened wallettes, whereas the shear strength of test wallettes with a double-sided FRCM retrofit ranged from 446 to 481%. The author attributed the lower increase in shear strength for the single-sided retrofitted specimens to the unrestrained boundary conditions of the diagonal compression tests, as these specimens showed out-of-plane bending behaviour. Therefore, the researcher proclaimed that these values must be regarded as conservative. The author reported that in reality walls have more restrained boundary conditions and super imposed vertical loads and therefore larger shear strength increments can be achieved.
For the out-of-plane strengthening of masonry walls the FRCM system requires application to both faces of a wall. In case of strengthening of load bearing leafs of cavity walls, this would require the removal of the façade of a building for the installation of the FRCM layer on the cavity side of the wall, as well as temporary rehousing of the occupants in order to install the FRCM layer from within the building. This would therefore be a very costly operation. The cost effective retrofitting can be enhanced by implementing the near surface mounted (NSM) out-of-plane reinforcement technique, where FRP strips or rods are inserted into grooves cut in the surface of a wall. The NSM technique proved to be a feasible strengthening method. Compared to the EB technique this method leads to a significantly higher axial strain at debonding and a reduced construction time (Seracino et al. 2007; Petersen et al. 2009). However, since the FRP strips or rods are placed right underneath the walls’ surface, double-sided application is required for strengthening for both out-of-plane loading directions, and therefore leading to the same drawbacks as mentioned for the FRCM system. The deep mounted technique was accordingly developed where deeper grooves are cut in the masonry, after which FRP strips are installed in the center of the wall. The FRP strips therefore offer additional out-of-plane flexural strength to the wall for both out-of-plane loading directions whilst only installing the reinforcement from one side of the wall, leading to cost-effective retrofitting (Türkmen et al. 2016; Türkmen et al. 2017). This system uses a viscous-elastic epoxy instead of a conventional stiff epoxy for the installation of the FRP strips, since previous out-of-plane bending tests on strengthened masonry panels by Türkmen et al. (2016) showed that by using a viscous-elastic epoxy (Young’s modulus < 50 N/mm2) instead a conventional stiff adhesive (Young’s modulus ~ 10,000 N/mm2), a significant increase in terms of ductility and maximum withstandable load is reached and critical crack development is prevented. Similar findings were previously reported by Kwiecień (2012) and Derkowski et al. (2013). Additionally, the improved stress distributions over the bonded length due to the application of a flexible adhesive (Türkmen et al. 2018) made the deep mounting of the CFRP strips possible. The use of a conventional stiff adhesive for deep mounting results in premature splitting failure in the masonry as observed by Dizhur et al. (2014) during their direct pull-test experimental campaign.
A schematic overview of the proposed combined reinforcement concept is shown in Fig. 1. Previously static-cyclic in-plane shear tests were performed on full-scaled masonry specimens strengthened with this combined reinforcement system (Türkmen et al. 2018). Within the full-scale wall experimental program rocking and sliding failure were observed, but no shear failure was observed in the surfaces for any of the specimens. It was therefore considered essential to perform additional tests to determine the in-plane shear capacity of walls strengthened with this combined system. The diagonal compression test was selected for this purpose. While the influence of FRCM reinforcement on the in-plane behaviour of masonry wallettes has been a popular subject of research for the past years, the influence of the aforementioned combination of retrofit measures on the in-plane shear capacity of masonry has not been investigated before. Moreover, this experimental program aims to investigate the possible degrading effect of the proposed out-of-plane strengthening system on the in-plane shear strength of masonry panels. Finally, the experimental results will be compared to the outcomes of existing analytical models and design codes, to check the validity of these models for this combined retrofit system.

Reinforcement concept for a house with cavity walls, where the FRCM reinforcement and deep mounted CFRP strips are installed from either the inside (temporary rehousing occupants) or the outside (removal of the façade) on the load bearing walls to secure cost-effective retrofitting
2 Experimental program
2.1 Materials and characterization
The clay bricks used in this research had dimensions of 205(± 4) × 95(± 2) × 50(± 2) mm3\(\left( {l_{b} \times w_{b} \times h_{b} } \right).\) Several mechanical characteristics of the used clay bricks were determined with an experimental program conform the corresponding standards. The bricks had a mean compressive strength of 31.7 N/mm2 (n = 12; COV = 7.4%), where n and COV are the amount of tested specimens and the Coefficient of Variation respectively. The compressive strength of the clay bricks were determined following the EN 772-1 (2015) standard using gypsum capping and half bricks. The mean splitting tensile strength (determined conform ASTM C1006-07 2007) and flexural tensile strength (obtained following ASTM C67-03 2003) of the bricks were found to be 3.34 N/mm2 (n = 12; COV = 8.7%) and 5.89 N/mm2 (n = 9; COV = 7.4%). The mean flexural tensile strength of the mortar specimens was found to be 3.6 N/mm2 (n = 8, COV = 16.5%), and the mean compressive strength of the mortar was 10.6 N/mm2 (n = 16; COV = 20.7%). Both the flexural tensile strength and the compressive strength of the mortar specimens were determined according to EN 1015-11 (2007a). Compression tests were performed on three masonry specimens, consisting of 6 brick high masonry prisms, under displacement control with a loading speed of 0.20 mm/min. The average compressive strength \(\left( {f_{m} } \right)\) of the specimens was 14.8 N/mm2 (COV = 6.1%). The Young’s modulus was determined as a secant modulus at 35% of the compressive strength in accordance with EN 1052-1 (1998). The average modulus of elasticity of the masonry prims was found to be 3100 N/mm2 (COV = 2.5%).
In order to determine the mechanical properties of the masonry under shear in accordance with EN 1052-3 (2007b), a total of 9 triplet shear tests was performed at three different normal stress levels: 0.2, 0.6 and 1.0 N/mm2. For each specimen the relation between the applied normal stress and the shear strength has been established. The ratio between the compressive stress and the shear strength of the masonry was obtained using a linear regression. The parameters for the Coulomb’s friction criterion follow from Eq. (1):
with \(f_{v,0}\), \(\mu_{ma}\) and \(\sigma_{n}\) being the initial shear strength, friction coefficient and axial load respectively. The residual shear strength \(\left( {f_{{v,0,{\text{res}}}} } \right)\) and residual coefficient of friction \(\left( {\mu_{ma,res} } \right)\) were determined by applying the same linear regression analysis when a plateau was reached in the post-peak phase. The mechanical properties of the materials used for building the specimens for this study are summarized in Table 1.
The obtained values regarding the mechanical properties of the masonry under shear were compared with the results of the study carried out by Jafari et al. (2017) on the material properties characterization of Dutch URM, and the values proposed in the Dutch Practical Guideline for the seismic assessment of local buildings in Groningen, NPR 9998 (2018). From the comparison it was concluded that the shear properties of masonry used in this study showed an acceptable agreement with shear properties as obtained by Jafari et al. (2017) and proposed in NPR 9998 (2018).
The reinforced mortar used for the mortar matrix was a polymer modified mortar based on organic binders, polymer fibres and selected aggregates, with a maximum grain size of 1.8 mm. The polymer fibres are shown in Fig. 2a. The additional reactive components, which were mixed into the reinforcement mortar, bonded with the amorphous silica on the carbon FRP mesh. This ensured an improved adhesion between the mesh and the cementitious matrix. For the preparation of the reinforced mortar, a plastic bonding agent was used in order to improve the adhesion of the cementitious matrix to the clay brick substrate. This was done by mixing 110 grams of the plastic bonding agent per 10 kg of prepared mortar. The reinforced mortar was prepared following the manufacturer’s instructions by adding 2.6L of water to a bag of 25 kg dry mortar. Both the flexural tensile strength and the compressive strength of the reinforced mortar specimens were determined according to EN 1015-11 (2007a). The average flexural tensile strength of the reinforced mortar specimens was found to be 7.58 N/mm2 (n = 9; COV = 11.7%). The mean compressive strength of the reinforced mortar was 62.6 N/mm2 (n = 12; COV = 1.6%). The weight density was 2138 kg/m3 (n = 6; COV = 1.7%).

Photo of the materials used for reinforcement: a close-up of the dry reinforced mortar, showing the polymer fibres b carbon FRP mesh with the amorphous silica intended for improved adhesion; c CFRP strip
The bidirectional carbon FRP mesh, with a fibre weight density of 1.79 g/cm3 and about 3 mm width per thread, had a square aperture dimension of approximately 50 × 50 mm2. The theoretical cross section of the C-fibre for design was 44 mm2. The Young’s modulus, tensile strength and elongation at rupture of the mesh as provided by the supplier are > 240 kN/mm2, > 4300 N/mm2 and 1.75% respectively for the carbon FRP mesh. The prefabricated (pultruded) CFRP strips were 20 mm in width and 1.4 mm in thickness and have a fibre volume content of > 68%. The Young’s modulus, tensile strength and elongation at rupture of the CFRP strip were found to be 215 kN/mm2, 2876 N/mm2 and 1.59% respectively.
The material properties for the two-component viscous-elastic adhesive were obtained following ISO 527-1 (2012) using three specimens at a loading rate of 10 mm/min. The Young’s modulus was determined as the secant modulus between 0.5% and 5% of the tensile strength, and was found to be 16.0 N/mm2 (COV = 1.7%). The tensile strength and elongation at rupture were determined as 4.3 N/mm2 (COV = 0.9%) and 72.1% (COV = 3.5%)
Tensile tests were performed using a clevis-type gripping mechanism following the American guideline AC434.13 (2013) with a metal tab contact length of 150 mm as recommended by Donnini and Corinaldesi (2017). The uncracked FRCM slab had a tensile strength \(\left( {\sigma_{m} } \right)\) of 4.31 N/mm2 (n = 9; COV = 14.9%), a corresponding strain \(\left({\epsilon_{m}} \right)\) of 0.016% (n = 8; COV = 13.5%) and a Young’s modulus of 27,680 N/mm2 (n = 8; COV = 6.9%). The stresses for the uncracked case were calculated with respect to the cross section area of the reinforced mortar. For the cracked FRCM slab, the stresses were calculated with respect to the cross section area of the CFRP mesh. The ultimate stress in the mesh, \(\sigma_{ult}\), was found to be of 1628 N/mm2 (n = 9; COV = 10.2%), with a corresponding ultimate strain \(\left( {\varepsilon_{ult} } \right)\) of 1.91% (n = 6; COV = 14.9%). The Young’s modulus of the cracked specimen, calculated as the slope of the segment of the stress–strain diagram between 0.90 \(\sigma_{ult}\) and 0.60 \(\sigma_{ult}\) (following AC434.13 2013), was 70,920 N/mm2 (n = 6; COV = 15.3%). The main failure mode observed was slippage of the CFRP mesh within the mortar matrix. The mechanical properties of the materials used for reinforcing the specimens for this study are summarized in Table 2.
2.2 Building the test specimens
The specimens for the diagonal compression tests were built in the testing laboratory of QuakeShield in Grijpskerk, the Netherlands. A total of 13 half brick clay masonry wallettes \(\left( {n_{test} } \right)\) were built by an experienced mason. All specimens had a square geometry of about 700 × 700 mm2\(\left( {h_{w} \times l_{w} } \right)\), a nominal thickness of 95 mm \(\left( {t_{w} } \right)\) and a nominal mortar thickness of 12 mm. The panels had reduced dimensions compared to the prescriptions of the ASTM E 519-02 (2010) standard (1200 × 1200 mm2) due to the geometrical limitations of the test setup. The masonry specimens were constructed against a vertical sideboard to ensure minimum horizontal deviation. Because of this construction method, the mortar layer thickness of the sideboard side seemed thicker due to the mortar flowing out in the gap between the masonry specimen and the sideboard. The masonry specimens were left to cure for at least 28 days in the unheated laboratory (8–18 °C) before retrofitting.
2.3 Reinforcing the masonry specimens
Figure 3 presents photographs of the installment of the reinforcement system in a practical application. The reinforcement process however is uniform. A schematic overview of the different specimens in this study is provided in Fig. 4. Details and geometrical properties of the specimens are provided in Fig. 5 and Table 3. Four of the 13 specimens were left untreated (URM). After the walls were sufficiently cured the retrofitting process of the other specimens started by milling vertical grooves of 65 mm deep \(\left( {d_{f} } \right)\) and 10 mm wide \(\left( {b_{f} } \right)\) at the center of the wallettes (Fig. 3a). The dust in the groove was removed with compressed air. The CFRP strips with a cross-section of 20 × 1.4 mm2\(\left( {b_{p} \times t_{p} } \right)\) were cleaned with acetone after cutting the strips into the specified length. A layer of primer was then applied to the groove (Fig. 3b) to obtain an improved bond of the applied adhesive to the masonry. After partially filling the groove with the flexible adhesive (Fig. 3c), the CFRP strip was inserted into the groove using a positioning fork (Fig. 3d). Excess adhesive till a depth of 30 mm \(\left( {d_{ff} } \right)\) in the grooves was removed by using a scraper. After the placement of the strips, the adhesive was left to cure for one day.

Photos showing the different stages of the reinforcement process, taken at a retrofitted building by QuakeShield: milling the grooves (a), cleaning the grooves with acetone (b), injecting flexible adhesive in the groove (c), pushing the CFRP strip into position with a positioning fork (d), if only CFRP strips need to be installed, filling the remaining part of the groove with mortar (e), if an FRCM layer needs to be added, installing the first layer of reinforced mortar (f), pressing the CFRP mesh into the mortar (g), application of the second layer of mortar matrix (h)

Schematic overview of the URM, STRIP, COMB10 and COMB20 specimens

Detail of the reinforced specimens
The remaining unfilled parts of the grooves were with filled mortar (same mortar used for the FRCM layer). This was done with the purpose of partially restoring the compressive and shear capacity in the groove in order to prevent possible vertical shear failure. The masonry surface was wetted prior to the mortar application to prevent shrinkage. On three specimens no FRCM layer was installed (STRIP). A photo of a STRIP specimen is provided in Fig. 6. For the remaining specimens (COMB10 and COMB20), a thin layer of mortar was subsequently applied to the masonry surface by hand. The CFRP mesh was then applied on the mortar matrix surface and was pressed into the matrix. After placing the CFRP mesh in the mortar a new thin layer of mortar was applied to embed the CFRP mesh, resulting in a nominal FRCM layer thickness \(\left( {t_{FRCM} } \right)\) of 10 mm and 20 mm for the COMB10 and COMB20 specimens respectively. Due to the added FRCM layer, the mass of the COMB10 and COMB20 specimens increased with approximately 10.5 kg (21.4 kg/m2) and 21.0 kg (42.8 kg/m2) respectively. To ensure the compression load being applied only on the masonry, the FRCM thickness was reduced close to panel boundaries. The specimens were left to cure for an additional 28 days. Figure 7 shows a photo of a COMB specimen.

Photo of a STRIP specimen with a CFRP strip (marked) embedded in a flexible adhesive

Photo of a COMB specimen with a CFRP strip (marked) embedded in a flexible adhesive and FRCM reinforcement layer with CFRP mesh (marked)
When only the CFRP mesh, CFRP strip or the FRCM layer is considered, the specimens had a reinforcement ratio of \(\rho_{r,mesh} = 0.046\%\), \(\rho_{r,CFRP\,strip} = 0.042\%\) and \(\rho_{r,FRCM} = 10.5\%\) (per 10 mm layer thickness) based on the cross sectional areas. It should be noted that in practice, the reinforcement ratio of the CFRP strip is variable, as the CFRP strips can be positioned closer or further apart from each other depending on the design lateral load.
2.4 Test setup and procedure
To investigate the behaviour of the retrofit system under in-plane loading, the diagonal compression test was chosen. The diagonal compression test, as described in ASTM E 519-02 (2010), is regarded as a simple procedure to determine the shear strength of masonry elements. The principle of the test is depicted in Fig. 8a. The diagonal compression test was introduced to simulate a pure shear stress state, in accordance with the situation depicted in Fig. 8b. Under these conditions the Mohr’s circle of the stress states are reduced (Fig. 8c), leading to the corresponding value of average shear stress following Eq. (2):
where \(P\) and \(A_{n}\) are respectively the compressive force applied to the specimen and the cross sectional area (parallel to the bed joint) of the specimen. The principal tensile stress (σI) is hence equal to the shear stress. Using Eq. (2) and the ultimate force \(P_{max}\) leads to the shear strength as provided in Eq. (3), where \(f_{v}\) and \(P_{max}\) are respectively the shear strength and the compressive failure load of the specimen:

Illustrations showing: principle of test (a), pure shear stress state (b) and Mohr circle (c)
The diagonal compression tests were performed at the Structures Laboratory of Eindhoven University of Technology. The tests were performed on a Schenk-Trebel servo hydraulic compression machine with a maximum capacity of 2.5 MN. The test setup consisted of a data acquisition system and a monitoring system consisting of four Linear Variable Displacement Transducers (LVDT’s) with a measuring range of + 2 to − 2 mm and an accuracy of ± 1/500 mm. A vertically orientated LVDT in the middle of both sides of the specimens measured the vertical deformation, while two horizontally positioned LVDT’s (one on each side of the specimen) monitored the horizontal deformations. A schematic overview and photo of the setup are provided in Figs. 9 and 10 respectively. A steel v-shaped loading shoe at the top and bottom side of the specimens was used to apply the compressive load to the specimens. The steel shoe consisted of two 20 mm thick steel plates with two 50 mm thick steel blocks in between (attached with M16 bolts). The steel blocks were perpendicular to each other and had a length of 100 mm, as illustrated in Fig. 11. The steel shoes were provided with 10 mm thick softboard to prevent local stress concentrations near the supports. Figure 12 shows a photo of the loading shoe. It should be noted that due to the reduced dimensions of the test specimens with respect to the ASTM E 519-02 (2010) standard, the confining effect produced by the v-shaped steel shoes could become more prominent and, consequently, result in a greater loading capacity of the tested specimens.

Illustration of the test setup

Photo of the test setup

Illustration of the loading shoe

Photo of the loading shoe
Each test was performed under displacement control by using the displacement measurement system of the testing machine. A displacement rate of 0.08 mm/min was used until a compressive force of 12 kN was reached (corresponding to the force needed to close the spacing of the ball hinge of the compression machine) after which the displacement rate was lowered to 0.04 mm/min for the remainder of the test. The tests were stopped when the compressive force dropped to zero or when significant damage occurred. During the tests the cracks were marked on the specimens and photographs were taken of the crack propagation.
3 Test results and discussion
The test results are summarized in Table 4. The failure load \(P_{max}\) and shear strength will be discussed first. Failure modes, shear strains \(\left( \gamma \right)\), shear strengths \(\left( {f_{v} } \right)\), shear moduli \(\left( G \right)\) and pseudo-ductility factors \(\left( \mu \right)\) will be covered in the following sections.
The URM specimens had an average shear strength of 0.75 N/mm2, while the average shear strength of the masonry specimens reinforced with solely a DM CFRP strip was 0.77 N/mm2. From these results it can be concluded that despite the deep grooves, the shear strength of a masonry element is not affected by the out-of-plane reinforcement system. The average shear strength of COMB10 specimens was 1.24 N/mm2, which is 1.7 times the unstrengthened specimens’ shear strength. For the COMB20 the shear strength was 1.36 N/mm2, resulting in a shear strength amplification factor of 1.8 compared to the URM specimens.
Table 4 also presents the spread of the of the strength values. A relatively high scatter in results was obtained for the unstrengthened specimens and the specimens reinforced with only a DM CFRP strip, compared to the FRCM reinforced specimens. This is however expectable considering the general behaviour of the URM, and the brittle failure that occurred during these tests. For the COMB20 specimens a considerably lower scatter in results was found. Due to the significant lower FRCM layer thickness of specimen COMB10-1 compared to COMB10-2 and COMB10-3, the shear strength was also considerably lower. This indicates that the matrix mortar layer thickness has an influence on the strength. However, no strong correlation was found between the FRCM layer thickness and the failure load \(\left( {R_{linear}^{2} = 0.4} \right)\).
3.1 Failure modes
Depending on physical and mechanical properties of a wall, four possible failure modes have been identified for URM (Li et al. 2005; Silva et al. 2008; Petersen 2009; Babaeidarabad et al. 2013; Babaeidarabad et al. 2014) and described by Li et al. (2005) and (Babaeidarabad et al. 2014):
Shear sliding\(\left( {V_{ss} } \right)\) failure takes place along a single bed joint caused by bond failure between clay brick and mortar.(Figure 13a).
Fig. 13 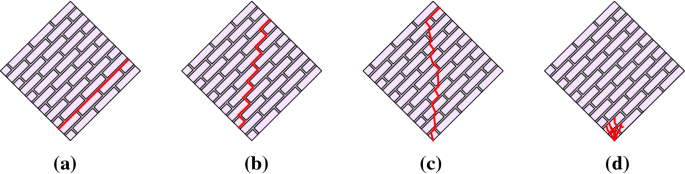
Possible failure modes: Shear sliding (a), shear friction (b), diagonal tension (c) and crushing (d)
Shear friction\(\left( {V_{sf} } \right)\) failure is controlled by the loss of bond between the mortar and masonry units in the stepped-stair format. (Figure 13b).
Diagonal tension\(\left( {V_{dt} } \right)\) failure occurs when the principal tension stress produced by the combination of shear and compressive forces reaches the tensile strength of the wall. (Figure 13c).
Crushing\(\left( {V_{c} } \right)\) when the maximum stress on the edges of block exceeds the compressive strength of the masonry, compression failure can occur. (Figure 13d).

During the diagonal compression tests several types of failure mechanisms were observed. The crack patterns of the tested specimens are illustrated in Fig. 14. Photos of some specimens after testing are provided in Fig. 15.

Crack patterns and propagation of the specimens (as-built side for COMB10 and COMB20)

Photos after testing of URM-2 (a), STRIP-3 (b), COMB20-1 as-built side (c) and COMB20-1 reinforced side (d)
The failure behaviour of the unstrengthened specimens was brittle. Failure of these specimens was sudden and no considerable crack development was observed prior to failure. All URM specimens except URM-4, failed by the formation of one large crack parallel to the loading direction. The crack occurred sudden and immediately propagated over the height of the specimen, leading to brittle failure. The crack mainly followed a stair-stepped pattern, where cracking predominantly occurred at the interface between the units and the mortar (i.e. shear friction failure). Unlike the other control specimens, specimen URM-4 failed by shear sliding at the bed joint located at the second layer from the bottom of the specimen.
Specimens provided with only a DM CFRP strip showed mainly the same failure behaviour as the unstrengthened control specimens. Specimen STRIP-1 failed by shear sliding while the other two specimens, STRIP-2 and STRIP-3, showed stair-stepped diagonal cracking (shear friction failure). The STRIP specimens did not disintegrate like the unstrengthened specimens after reaching the failure load. This is attributed to the CFRP strip, holding the specimen together after failure. Specimens provided with both a DM CFRP strip and a single-sided FRCM overlay (COMB10 and COMB20) showed completely different failure behaviour. Contrary to the control specimens, these specimens behaved more ductile. When the failure load was reached a large diagonal tension crack was formed within these specimens on the as-built side, covering the complete vertical diagonal of the panels. Unlike the control specimens the strengthened specimens still possessed a considerable amount of capacity after reaching the failure load. During the course of the tests multiple cracks developed on the as-built surface of these specimens. Eventually hairline cracks were observed at the strengthened side (typical cracking displayed in Fig. 15d). Specimen COMB20-1 showed some additional masonry crushing near the bottom support at the final test stage.
Where the COMB10-1 and COMB10-2 specimens had two diagonal cracks parallel to the vertical diagonal on the as-built side, specimen COMB10-3 (with a nominal FRCM layer thickness of only 6.8 mm) showed two diagonal cracks at the bottom half and one diagonal crack at the top half of the specimen. In contrary to the COMB10 specimens, the COMB20 specimens showed three to four diagonal cracks over a wider area. A possible explanation for this discrepancy in crack pattern may lie in the difference in thickness of the upper mortar layer of the FRCM overlay. Grande et al. (2018) conducted a parametric analysis on the interaction between the CFRP reinforcement and the mortar matrix at the level of the interface under shear bond test conditions. The researchers served that an increase of the thickness of the upper mortar layer (within certain boundaries) and thereby an increase in axial stiffness, led to an increase of the force sustained by the reinforcement. It was found that the maximum force of a coupon with an upper mortar layer of a certain thickness was 1.4 times higher than the maximum force in absence of an upper mortar layer. This effect was reported to be strictly correlated to the increase of the length of the transfer zone (effective bond length) due to the increase of the axial stiffness of the upper mortar layer (Grande et al. 2018). The thicker upper mortar layer leading to an increased utilization of the carbon FRP mesh is in line with the experimental observations of this study of more cracks occurring at a wider area with an increased FRCM layer thickness.
Next to the mentioned failure modes, out-of-plane bending deformation on all the COMB10 and COMB20 specimens were observed towards the end of the conducted experiments. This observation is shown in Fig. 16 for the COMB20-3 specimen, where the dashed lines represent the specimen at initial condition and the solid lines illustrate the specimen at the end of the experiment. The out-of-plane bending was confirmed by the difference in cracks between the reinforced side and the as-built side of the specimens. Small cracks on the strengthened side and large cracks on the as-built side are associated with out-of-plane bending deformation (Prota et al. 2006; Parisi et al. 2019) for one side strengthened specimens subjected to diagonal compression tests. The cracks on the as-built side, as shown in Fig. 17 for COMB10-2, closed partly as the load was removed.

The out-of-plane deformation of the COMB20-3 specimen at the end of the test (solid line) with respect to the initial condition (dashed line)

Photos showing the opening of cracks towards the end of the test of the COMB10-2 specimen on the as-built side
3.2 Shear stress–strain diagram
The vertical shortening and horizontal elongation were computed from the mean displacement readings on both sides divided by the gauge length (g), using Eqs. (4) and (5) respectively.
The shear stress versus strain diagrams following from the experiments are shown in Fig. 18. Specimen URM-4 is not presented in Fig. 18 due to measurement errors. Additionally, measurements after a 20% drop in the post-peak phase are also not shown. The averaged shear stress versus strain diagram for the different configurations is shown in Fig. 19.

Shear stress versus strain diagrams

Averaged shear stress–strain diagram of the URM, STRIP, COMB10 and COMB20 specimens
Comparing the URM and STRIP specimens, no significant differences are noticeable. Both specimen types showed linear behaviour up to the point of sudden failure. In contradiction to the absence of residual strength for the URM specimen, the STRIP specimens had a mean residual strength of 11.2 kN, as shown in Fig. 20. The residual strength was determined as the mean value between the point with the first positive slope after the peak (marked with “o” in Fig. 20) and the end of the diagonal compression experiment (marked with “x” in Fig. 20).

Force-time diagram of the STRIP specimens, showing the residual strength
For specimens COMB10 and COMB20, both the strains of the FRCM-side and the as-built side of the specimen are presented separately with an additional subscript “r” and “u” respectively (for example: εh,u is the axial strain in the horizontal direction of the as-built side of the specimen). The strain is defined as the mean of the strains measured on both sides of the specimens following Eq. (6):
For the specimens reinforced with a FRCM layer, the strains along the as-built side were significantly different from the opposite side where FRCM was installed. On the FRCM-side, lower deformation values were measured in both the horizontal and vertical direction. This was in line with the expectations considering the significant difference in modulus of elasticity between the mortar matrix and the masonry. For the COMB specimens it was noticed that the mean horizontal strain was higher than the mean vertical strain during the post-peak phase. This was primarily caused by the diagonal tension cracks on the as-built side of the specimens. Noticeable was the difference in strain on the as-built side of the COMB-specimens. Despite the higher mean initial stiffness (caused by the FRCM thickness), the mean strains in particular the horizontal direction was significantly higher for the COMB20 specimens when compared with the COMB10 specimens. Looking at the crack patterns that were presented in Fig. 14, the difference in horizontal strain can be explained with the amount of cracks that were formed, more cracks leading to higher deformation values.
3.3 Shear modulus
The shear strain is defined in Eq. (7):
The slope of the elastic portion of the τ–γ diagram is denoted as the shear modulus of rigidity, (Ge,) according to ASTM E 519-02 (2010), following Eq. (8):
where \(\tau_{e} = 0.7\tau_{max}\) was assumed to be the cracking shear strength and γe was the corresponding cracking shear strain identified on the experimental τ–γ diagram. The cracking shear strain and shear modulus are provided in columns 10 and 11 respectively in Table 4. Comparing the URM and STRIP specimens, considering only the cases where the predominant failure mechanism was shear friction, it can be observed that the STRIP specimens result in a 25.3% lower shear modulus. This indicates that the deep grooves resulted in a reduction in shear modulus. For the specimens where both shear sliding and shear friction occurred (URM-4 and STRIP-1), the shear modulus was found to be approximately the same, but higher than the mean value of the corresponding specimen group. This error was likely caused by the failure plane concentrating outside the horizontal and/or vertical diagonals, where the deformation measurements were made. No significant difference in shear moduli was found between the COMB10 and COMB20 specimens, indicating that the thickness of the FRCM had limited influence on the shear modulus. A possible explanation could be the formation of shrinkage cracks during the curing stage of the FRCM layer, and that therefore the enhancement in stiffness and strength is primarily based on the presence of the CFRP mesh. Compared with the URM specimens, the application of a single sided FRCM layer resulted in an increase of approximately 40% of the shear modulus. It was noticeable that the mean shear modulus of COMB20 specimens was more scattered (COV 15.6%) compared to the COMB10 specimens (COV 3.68%). The shear stress-shear strain diagrams are presented in Fig. 21. Specimen COMB10-1 is not included due to the faulty attachment of two LVDT’s, leading to missing data near the failure load. For the remaining specimens, the LVDT sensors malfunctioned due to the crack development in the post-peak phase. Because of this, the shear strain relation of specimens COMB10-2, COMB10-3 and COMB20-1 have been linear extrapolated to obtain the ultimate shear strain \(\gamma_{u}\) (associated with a maximum 20% strength drop on the post-peak softening branch).

Shear stress versus shear strain diagrams
3.4 Pseudo-ductility
The wallette’s pseudo-ductility μ (see Column 12 in Table 4), is calculated using Eq. (9), where \(\gamma_{u} = \gamma_{e}\) for specimens without post peak strength.
In general, a higher pseudo-ductility ratio leads to an increased ability of strengthened masonry walls to redistribute stresses, a higher global deformation capacity and an improved energy dissipation (Babaeidarabad et al. 2014). The pseudo-ductility factors obtained were in the range 8.5–9.3 and 15.4–15.6 for the COMB10 and COMB20 specimens respectively. The out-of-plane deformations could result in optimistic factors for the pseudo-ductility.
4 Evaluation unstrengthened masonry
The in-plane shear capacity of unstrengthened walls were determined using two approaches: the analytical model developed by Li et al. (2005) and the design provisions according to Eurocode 8-3 (2005a, b).
4.1 Analytical model
For the walls subjected to a diagonal compressive force, all of the clamping force on the wallette is provided by the vertical component of the diagonal compression force (Li et al. 2005), as shown in Fig. 22. The relationship between the v-component \(\left( {P_{v} } \right)\) and the u-component \(\left( {P_{u} } \right)\) of force \(P\) is provided by Eq. (10), with \(\theta\) being the angle between the bed joint direction (u-axis) and the main diagonal of the wallette (y-axis).

Forces acting on wallette during a diagonal compression test
As the angle between the horizontal and the main diagonal of the wallette was kept constant at 45° during the experimental campaign, Eq. (10) can be reduced to Eq. (11):
An unstrengthened masonry wall fails when the value of the applied shear force reaches the minimum shear capacity, Vm, computed in accordance with Eq. (12):
- (a)
Shear sliding\(\left( {V_{ss} } \right)\) Recognizing that shear strength results from the combination of bond strength and friction resistance between mortar joint and blocks (Li et al. 2005), the shear strength is typically modelled with the Mohr–Coulomb relationship provided in Eq. (13).
$$f_{v} = f_{v,0} + \mu_{ma} \sigma_{n}$$(13)where \(f_{v,0}\) is the shear bond strength and \(\mu_{ma}\) is the average coefficient of friction. The cohesive strength obtained with the triplet experiments was 0.38 N/mm2. An average value for cohesive strength τ0 of 3% of the masonry gross area compressive strength \(\left( {f'_{m} } \right)\) is suggested in various researches (Li et al. 2005; Silva et al. 2008; Petersen 2009; Babaeidarabad et al. 2014), resulting in 0.44 N/mm2 for the masonry used in this study. For the coefficient of friction μ0, a typical range from 0.3 to 1.2 is assumed (Li et al. 2005), with an average of 0.75. This corresponds well with the value obtained via the triplet experiments.
The shear capacity due to shear sliding failure is derived from Eq. (14):
Substituting equation Eq. (11) into Eq. (14), the horizontal force to resist shear sliding failure along a bed joint can be rewritten as:
- (b)
Shear friction\(\left( {V_{sf} } \right)\) Crisafulli et al. (1995) revised the theory of Mann and Muller (1982) and presented a more realistic distribution of normal and shear stresses acting on a block (Li et al. 2005). The reduced shear strength \(f_{sf}\) is determined using a modification of Eq. (13), resulting in:
$$f_{sf} = f_{v,0}^{*} + \mu_{ma}^{*} \sigma_{n}$$(16)where \(f_{v,0}^{*}\) and \(\mu_{ma}^{*}\) are the reduced shear bond strength and the reduced coefficient of friction respectively, which are the confirmed determinative factors for the friction failure instead of the actual coefficients \(f_{v0}\) and \(\mu_{ma}\) (Mann and Muller (1982). The shear capacity due to shear sliding failure is derived from Eq. (17):
$$V_{ss} = \left( {f_{v,0}^{*} + \mu_{ma}^{*} \sigma_{n} } \right)A_{n}$$(17)
Substituting Eq. (11) into Eq. (17), the horizontal force to resist shear friction failure can be rewritten as:
- (c)
Diagonal tension\(\left( {V_{dt} } \right)\) The required force to induce diagonal tensile crack of the brick is determined using Eq. (19). The tensile strength of the clay brick masonry \(\left( {f_{tb}^{'} } \right)\) is determined by Silva et al. (2008) using Eq. (20):
$$V_{dt} = \frac{{f_{tb}^{{\prime }} }}{2.3}\sqrt {1 + \frac{{\sigma_{n} }}{{f_{tb}^{{\prime }} }}} A_{n}$$(19)$$f_{tb}^{{\prime }} = \frac{2}{3}\sqrt {f_{m}^{{\prime }} }$$(20)
Substituting Eq. (11) into Eq. (20), the expression of \(V_{dt}\) for the discussed condition and present failure mode can be rewritten as:
- (d)
Crushing\(\left( {V_{c} } \right)\) The shear strength to initiate crushing is evaluated as
$$V_{C} = \left( {f_{m} - \sigma_{n} } \right)\frac{{2l_{b} }}{{3h_{b} }}A_{c}$$(22)with \(A_{c}\) being interface loading area between the steel shoe and the wallette, parallel to the bed joint. Substituting Eq. (11) into Eq. (22), the horizontal force to initiate crushing can be obtained:
$$V_{C} = \frac{{2l_{b} }}{{3h_{b} + 2l_{b} }}f_{m} A_{c}$$(23)
Equations (14), (17), (19), and (22) completely represent the failure envelope for the shear strength of masonry. Using the relevant parameters provided in Table 5, the failure envelope for the unstrengthened masonry used in this experimental research was determined as shown in Fig. 23. The failure envelope presented here is a function of the compressive stress applied to the wallette, ranging from zero to the compressive strength of the masonry.

Failure envelope of the unstrengthened masonry determined with the analytical model
4.2 Design provisions Eurocode 8
According to Eurocode 8-3 (2005b), the shear force capacity of an unstrengthened masonry wall controlled by shear under an axial load \(N\) is determined with Eq. (24):
where \(D^{{\prime }}\) is the depth of the compressed area of the wall and \(f_{v}\) is the masonry shear strength accounting for the presence of vertical load. In this study, the depth of the compressed area in the bed joints is assumed to be equal to the length of the specimen. The masonry shear strength is determined according to Eq. (25):
where \(f_{v,0}\) is the initial shear strength in the absence of vertical load and \(f_{b}\) the normalized mean compressive strength of the masonry unit, obtained from either in situ tests or additional sources of information, and divided by the confidence factor (= 1 for KL3). In primary seismic walls, both these material strengths are further divided by the partial factor \(\left( {\gamma_{M} } \right)\) for masonry in accordance with Eurocode 8-1 (2005a). Characteristic initial shear strength of masonry \(\left( {f_{v,0} } \right)\) is provided as 0.3 N/mm2 for clay masonry with M10-M20 mortar strength class in Eurocode 6 (2006).
Substituting Eq. (11) in Eq. (24), the horizontal force to resist shear friction failure following Eurocode 8-3 (2005b) can be rewritten as:
The upper limit \(0.065f_{m}\) takes care of the possibility that failure in shear tension will occur in the compression area subjected to a combination of a significant normal compressive stress and a shear stress. When failure due to shear tension will occur, cracks will run through the units. The shear force capacity for this failure mechanism is provided in Eq. (27):
In contrast with the ASCE/SEI 41-13 (2014), Eurocode 8 does not differentiate the rocking mechanism from the toe-crushing mechanism. In Eurocode 8, the shear force capacity of an unstrengthened masonry wall as controlled by flexure under an axial load \(N\) is obtained via Eq. (28):
where \(f_{mas}\) is the compressive strength of the masonry divided by the confidence factor (= 1 for KL3). Regarding the normal stress distribution, the Eurocode 8-3 (2005a, b) refers to a stress block distribution by adopting a reduction coefficient of the compressive strength (0.87 = 1/1.15). The mechanical scheme to obtain Eq. (28) is provided in Fig. 24a.

Mechanical scheme of Eurocode 8 to determine the shear force capacity during flexural failure (a) and the modification for this study (b)
Since during the diagonal compression experiments the axial load was not introduced at the center of the wallette, as illustrated in Fig. 24b, a modification of Eq. (28) also has been considered. First, the depth of the compressed area was determined using Eq. (29):
The moment with respect to the bottom right corner in Fig. 24b equals:
with \(\delta\) being the distance between the corner of the specimen and the location where the concentrated force V is assumed to be introduced. Substituting Eq. (29) into Eq. (30), the modified shear force capacity for flexural failure becomes:
With the compressive depth during the experiments being limited to 100 mm due to the dimension of the steel shoe, combining Eq. (29) with Eq. (11) results in the shear strength needed to initiate crushing:
Equations (24), (27) and (28) completely represent the failure envelope for the shear strength of masonry following the Eurocode 8-3 (2005a, b). Similar to Eq. (12), a wall fails when the value of the applied shear force reaches the minimum shear capacity:
The failure envelope including the modified shear force rocking/toe crushing is obtained with Eq. (34):
Using the relevant parameters provided in Table 6, the failure envelope for the unstrengthened masonry used in this experimental research was determined as shown in Fig. 25. The failure envelope of the modified shear for rocking/toe crushing is also shown. It should be noted that for comparison reasons the partial factor for masonry is not taken into account.

Failure envelope of the unstrengthened masonry determined with the standard Eurocode 8 design provisions (Vm) and a modified version (Vm′)
Comparing Figs. 23 and 25, it can be observed that despite leaving out the partial factors for masonry, the Eurocode 8-3 (2005a, b) approach to determine the failure envelope of unstrengthened masonry is conservative when compared to the failure envelope obtained from the analytical model. This is primarily caused by the different approaches to determine the shear strength at diagonal tension failure, where the difference builds up to 292% with respect to the Eurocode 8-3 (2005a, b) approach.
4.3 Comparison experimental results
The strengths obtained with the analytical model and Eurocode 8-3 (2005a, b) are compared with the mean experimental shear strength of the URM specimens. The mean experimental shear strength is determined by using Eq. (10). The results are summarized in Table 7.
The analytical model showed good correspondence with the experimental values for both the failure mechanism and the failure load, with an experimental/model ratio \(\left( \varphi \right)\) of 0.98. Despite leaving out the partial factor for masonry, the Eurocode 8-3 (2005a, b) approach resulted in lower values \(\left( {\varphi = 1.43} \right)\). Including the partial factor for masonry, the Eurocode approach results in even more conservative values \(\left( {\varphi = 2.14} \right)\).
4.4 Limitation presented models
It should be noted that the presented models assume a uniform axial stress and shear stress through the cross section of the specimen (u-axis in Fig. 22). This assumption does not reflect the reality as there will be a non-uniform distribution of stresses. The experiment for an unstrengthened specimen has been recreated with a Finite Element (FE) model. The masonry panel was modelled as a homogenous material with the dimensions 700 (length) × 700 (height) × 95 (thickness) mm3. Linear elastic material behaviour was assumed, with a young’s modulus of 3200 N/mm2 and Poisson’s ratio of 0.27. Linear hexahedral finite elements with reduced integration (Abaqus C3D8R) were used to generate the mesh of the masonry panel, with a global seed size of 20 mm. With this model, displayed in Fig. 26, the interface between the specimen and the bottom loading shoe, was fixed for displacement in the y-direction (marked with orange triangles in Fig. 26). The load was introduced as a uniform stress of 4.73 N/mm2 (marked with purple arrows in Fig. 26), covering the entire interface between the specimen and the upper loading shoe, resulting in a total force of 67 kN (mean experimental failure load of URM) in the negative y direction.

FE model geometry of the URM specimen
The distribution of the axial stresses over the vertical diagonal of the wall (y-axis in Fig. 26) and horizontal diagonal (x-axis in Fig. 26) of the wallette is shown in Fig. 27a. Here a considerable variation in the axial compressive stress can be observed. The maximum compressive stress at (x,y) = (0,0) is 122% higher than the mean value for compressive stress over the horizontal diagonal (y = 0). Rotating the x–y coordinate system to the u-v coordinate system, as presented in Fig. 22, the shear stress and axial stress as used by the analytical model can be obtained. The distribution of the compressive stress and shear stress over cross section of the wallette at mid-height (v = 0.5hw) is shown in Fig. 27b. In contrast to the compressive stress which is roughly constant over the discussed cross-section (COV = 14.1%), the shear stresses show strong variation (COV = 46.2%). The highest shear stress occurs at the center of the specimen (u = 350 mm) and differs 49.4% from the mean shear stress value. The analytical model as proposed by Li et al.(2005) does not take this variation in shear stress into account. Whereas the Eurocode 8 also does not take this non-uniform stress distribution into account. The NZSEE, NTC and ASCE introduce a corrective factor (named b, β or (1 + αv)) to account for the shear stress distribution at the center of the panel and relate the peak value to the mean one (Cattari et al. 2015).

Results of the linear-elastic FE simulation on the distribution of: axial stresses σI and σII over the vertical and horizontal diagonal respectively (a) and compressive stress σn and shear stress τ over cross section of wallette at mid-height (b)
5 Evaluation FRCM reinforced masonry
In order for the FRCM reinforcement system to be applied on a large scale for the in-plane strengthening of masonry walls, simple practitioner oriented design models are essential. However, due to the novelty of this technique and the wide variety of FRCM materials on the market, design provisions are generally not provided by international building codes (Ceroni and Salzano 2018). Previous theoretical studies have led to various analytical formulations for determining the shear strength of FRCM reinforced masonry (Babaeidarabad et al. 2014; Gattesco and Boem 2015; Cascardi et al. 2016; Triantafillou 2016). Cascardi et al. (2016) presented an advanced analytical model based on artificial neural network (ANN). For the construction of the model a number of 75 samples were selected from previous diagonal compression tests found in scientific literature, varying in both material and geometry. By comparing the proposed model the authors showed that the proposed model is competitive with the consolidated analytical formulations. Because of the reduced specimen dimensions and the non-standard single-sided reinforcement configuration used in the current study, the model proposed by Cascardi et al. (2016) was not considered.
At the end of 2013 the first design guide for FRCM reinforcement (ACI 549-13 2013) was published. This guideline provides structural engineers with easily applicable design models for determining the shear resistance of FRCM reinforced masonry walls. Past studies have shown that the ACI design models show reasonable agreement with experimental data and can be considered as conservative (Babaeidarabad et al. 2014; Almeida et al. 2015). The European building codes (Eurocode), which in general differs significantly from the American design philosophy, do not provide any design models for the shear strength of FRCM reinforced masonry. Kolyvas et al. (2012) and Triantafillou (2016), however provided similar practitioner oriented design models in Eurocode framework.
In this research both the approach according to ACI 549-13 (2013) and Triantafillou (2016) to determine the FRCM contribution on the shear strength of masonry were considered. Concerning the nominal shear strength \(V_{RM}\) of FRCM reinforced masonry, both approaches pose that this is the result of the summation of the shear strength of the masonry and of the FRCM-overlay, in accordance with Eq. (35). It should be noted that the FRCM contribution is considered only after masonry cracking (Li et al. 2005; Silva et al. 2008; Petersen 2009; ACI 549-13 2013; Babaeidarabad et al. 2014).
The design shear strength of FRCM reinforced masonry according to Triantafillou (2016) is determined using Eqs. (36–38), as provided in Table 8. Triantafillou defines the maximum design stress \(\left( {f_{td} } \right)\) allowed to the CFRP net as the lowest value between the design characteristic strength of the mesh \(\left( {f_{tk} } \right)\) divided by the material factor \(\left( {\gamma_{t} } \right)\), and the stress corresponding to the design tensile strain \(\varepsilon_{fv}\) where debonding is assumed to be initiated, as shown in Eq. (36). The contribution of the FRCM \(\left( {V_{Rd,t} } \right)\) is determined using Eq. (37), where \(A_{f}\) is the area of mesh per unit width (mm2/mm) and n is the number of mesh layers. It should be noted that a reduction factor of 0.9 is present. The design shear strength of FRCM reinforced masonry, including a partial factor for shear \(\left( {\gamma_{Rd} } \right)\) of 1.2 and the design shear strength of the unstrengthened masonry \(\left( {V_{Rd,m} } \right)\), is limited by a maximum value \(\left( {V_{Rd,max,c} } \right).\) This limitation corresponds to compression failure of the struts in the truss, as shown in Eq. (38)
The design shear resistance of masonry walls strengthened with FRCM according to ACI 549-13 (2013) is obtained by using Eqs. (39–41). The ACI 549-13 (2013) directly uses the design tensile strain \(\varepsilon_{fv}\) to determine the maximum design stress, as shown in Eq. (39). The contribution of the FRCM is determined using Eq. (40), where in contrast to Triantafillou (2016) no reduction factor is used. The design shear strength of FRCM reinforced masonry \(\left( {V_{Rd,RM} } \right)\), including a strength reduction factor for shear \(\left( {\Phi _{v} } \right)\) of 0.75, is limited to 50% of the un-strengthened wall’s shear capacity to limit the total force transferred to the substrate of the masonry per unit width (Babaeidarabad et al. 2014), as shown in Eq. (41).
With the parameters presented in Table 9, the shear strength of the masonry reinforced with a FRCM-overlay can be determined. The results are provided in Table 10. The contribution of the FRCM for the shear capacity \(V_{Rd,t}\) was determined as 20.0 kN and 29.6 kN using the approach proposed by Triantafillou (2016) and ACI 549-13 (2013) respectively. The mean shear contribution of the FRCM reinforcement, as estimated by the experiments and analytical model, was 38.7 kN \(\left( {V_{FRCM} } \right)\). The approach proposed by Triantafillou (2016), with an experimental/model ratio \(\left( \varphi \right)\) of 1.9, resulted in more conservative results when compared to the ACI 549-13 (2013) \(\left( {\varphi = 1.3} \right)\).
When taking the partial factor for shear \(\left( {\gamma_{Rd} } \right)\), the strength reduction factor for shear \(\left( {\Phi _{v} } \right)\), and limiting the shear capacity of the strengthened wall to 50% of the un-strengthened wall shear capacity into account, the shear resistance \(\left( {V_{{Rd,RM^{{\prime }} }} } \right)\) of masonry walls strengthened with FRCM as determined with the two approaches is approximately the same (using the masonry shear strength as determined with the analytical model). This is mainly due to the design shear strength being limited to 50% of the un-strengthened wall shear capacity according to ACI 549-13 (2013). The experimental/design value ratio’s \(\left( \rho \right)\) for the approaches following Triantafillou (2016) and ACI 549-13 (2013) were 2.14 and 2.25 respectively. When for the masonry contribution the design value as obtained using Eurocode 8 is used, the experimental/design value ratios \(\left( \rho \right)\) reduce to 3.5 and 4.9 for the approaches following Triantafillou (2016) and ACI 549-13 (2013) respectively. It can be observed that the presented design provisions, both for the masonry part and the FRCM contribution, are conservative.
6 Conclusions and recommendations
An experimental program was undertaken to assess the effectiveness of a combined retrofit method to improve the in-plane behaviour of clay brick URM walls. The diagonal compression test was used for the evaluation of the in-plane shear behavior of these retrofitted wallettes. From the experiments the following conclusions can be drawn:
- 1.
The out-of-plane reinforcement, which consisted of deep mounted CFRP strips embedded with a flexible adhesive in a deep groove (partly filled with mortar), did not affect the strength of masonry elements loaded under in-plane shear. It was however found that the deep grooves resulted in a 25.3% lower shear modulus compared to the unstrengthened control specimens. Moreover the experiments showed that in contrast to the unstrengthened specimens, the specimens with solely the out-of-plane reinforcement did not disintegrate after reaching the failure load. This can be attributed to the DM CFRP strip holding the specimens together.
- 2.
The single-sided carbon FRCM overlay increased the shear capacity with 1.7 and 1.8 times that of the unstrengthened control specimens with a 10 mm and 20 mm FRCM layer thickness respectively. The application of a single sided FRCM layer resulted in an increase of approximately 40% of the shear modulus compared to the unstrengthened control specimens.
- 3.
No strong correlation was found between the thickness of the mortar matrix of the FRCM layer and the failure load. Additionally, FRCM layer thickness was found to have limited influence on the shear modulus. A possible explanation could be the formation of shrinkage cracks during the curing stage of the FRCM layer, and that therefore the enhancement in stiffness and strength is primarily based on the presence of the CFRP mesh.
- 4.
The FRCM layer thickness did have an influence on the number of diagonal cracks that were observed on the as-built side of the combined DM CFRP and FRCM reinforced specimens. With a 20 mm FRCM layer thickness, one to two additional diagonal tensile cracks occurred over a wider area when compared to the specimens provided with a 10 mm FRCM layer. A possible explanation for this discrepancy in crack pattern is the difference in thickness of the upper mortar layer of the FRCM overlay. A thicker upper mortar layer leads to an improved utilization of the carbon FRP mesh.
- 5.
Stiffness differences between the as-built side and the FRCM strengthened side led out-of-plane bending during the final stages of the diagonal compression experiments. With more restrained boundary conditions and superimposed vertical loads, as is the case in practice, larger shear strength increments could be achieved (Ismail 2012).
- 6.
The pseudo-ductility factors obtained were in the range 8.5–9.3 and 15.4–15.6 for the reinforced specimens with a 10 mm and 20 mm FRCM layer thickness respectively. Comparison of these values with the pseudo-ductility of URM showed that a one sided FRCM overlay leads to a significant increase in ductility.
- 7.
For the evaluation of unstrengthened masonry, the analytical model developed by Li et al. (2005) showed good correspondence with the experimental values for both the failure mechanism and the failure load, with an experimental/model ratio \(\left( \varphi \right)\) of 0.98. Despite leaving out the partial factor for masonry, the Eurocode 8-3 (2005a, b) approach resulted in a lower ratio \(\left( {\varphi = 1.43} \right)\). Including the partial factor for masonry, the Eurocode approach results in even more conservative values \(\left( {\varphi = 2.14} \right)\). An important limitation of both approaches is that the non-uniform shear stress distribution at the center of the panel is not taken into account.
- 8.
For the FRCM contribution on the in-plane shear capacity, the approach proposed by Triantafillou (2016) (experimental/model ratio \(\left( \varphi \right)\) of 1.94) resulted in more conservative results when compared to the ACI 549-13 (2013) \(\left( {\varphi = 1.31} \right)\).
- 9.
The obtained design values for the shear strength of FRCM reinforced masonry were conservative, especially when for the masonry contribution the design value as obtained using Eurocode 8-3 (2005a, b) was used (experimental/design value ratio \(\left( \rho \right)\) range 3.47–4.89).
As for the recommendations, firstly, even though the emerging line of experimental results seems quite consistent, the results could be confirmed by a larger experimental campaign as the number of specimens tested in this study was limited. Secondly, as stated in the introduction, no shear damage was observed within the applied load range on the previously conducted static-cyclic in-plane shear tests on full-scaled masonry specimens strengthened with the combined reinforcement system (Türkmen et al. 2018). With these cantilever shear walls there are regions of: (a) nearly pure tension stress; (b) nearly pure compression stress; (c) combined tension and shear stresses; and (d) combined compression and shear stresses. The diagonal compression test as conducted in the current study is applicable only to the latter case, the compression-shear region. Thus, the mechanical characteristics and effectiveness of the repair techniques will not be fully revealed by diagonal compression testing alone. Just like the additional experimental program for the combined compression and shear stresses covered in the current study, testing other normal-shear stress combinations are recommended to fully understand the response of reinforced masonry shear walls.
Abbreviations
- \(A_{c}\) :
-
Interface loading area between the steel shoe and the wallette (\({\text{mm}}^{2}\))
- \(A_{f}\) :
-
Area of mesh per unit width (\({\text{mm}}^{2} /{\text{mm}}\))
- \(A_{n}\) :
-
Cross sectional area of the specimen, parallel to the bed joint (\({\text{mm}}^{2}\))
- \(b_{f} , b_{p}\) :
-
Width groove; width CFRP strip (\({\text{mm}}\))
- \(d_{f} , d_{ff}\) :
-
Depth groove; Depth mortar (\({\text{mm}}\))
- \(D'\) :
-
Depth of the compressed area (\({\text{mm}}\))
- \(E,E_{f}\) :
-
Modulus of elasticity, tensile modulus of elasticity of the CFRP mesh (\({\text{N}}/{\text{mm}}^{2}\))
- \(f_{c}\) :
-
Compressive strength (\({\text{N}}/{\text{mm}}^{2}\))
- \(f_{m} , f_{b} , f_{mas}\) :
-
Compressive strength masonry; mean: normalized mean; mean/confidence factor (\({\text{N}}/{\text{mm}}^{2}\))
- \(f_{sf}\) :
-
Reduced shear strength (\({\text{N}}/{\text{mm}}^{2}\))
- \(f_{st}\) :
-
Splitting tensile strength of the clay brick (\({\text{N}}/{\text{mm}}^{2}\))
- \(f_{t}\) :
-
Tensile strength (\({\text{N}}/{\text{mm}}^{2}\))
- \(f_{td} ,f_{tk}\) :
-
Design stress allowed to the CFRP mesh: maximum; characteristic (\({\text{N}}/{\text{mm}}^{2}\))
- \(f_{tb}^{\prime }\) :
-
Tensile strength masonry (\({\text{N}}/{\text{mm}}^{2}\))
- \(f_{v} , f_{v,0} , f_{v,0}^{*}\) :
-
Shear strength; Initial shear strength; reduced initial shear strength (\({\text{N}}/{\text{mm}}^{2}\))
- \({\text{g}}\) :
-
Gauge length (\({\text{mm}}\))
- \(G_{e}\) :
-
Shear modulus of rigidity (\({\text{kN}}/{\text{mm}}^{2}\))
- \(h_{b} , h_{w}\) :
-
Height brick; height wallette (\({\text{mm}}\))
- \(l_{b} , l_{w}\) :
-
Length brick; length wallette (\({\text{mm}}\))
- \(n\) :
-
Number of mesh layers (–)
- \(n_{test}\) :
-
Number of test specimens (–)
- \(N\) :
-
Axial load (\({\text{kN}}\))
- \(P\) :
-
Compressive force applied to the specimen (\({\text{kN}}\))
- \(P_{max}\) :
-
Maximum value of the compressive force applied to the specimen (\({\text{kN}}\))
- \(t_{FRCM}\) :
-
Thickness FRCM layer (\({\text{mm}}\))
- \(t_{w} , t_{p}\) :
-
Thickness specimen (as-built); Thickness CFRP strip (\({\text{mm}}\))
- \(V_{c}\) :
-
Shear force capacity for crushing failure (\({\text{kN}}\))
- \(V_{COMB}\) :
-
Mean shear strength of the COMB specimens as obtained with the experiments (\({\text{kN}}\))
- \(V_{dt} , V_{dt,EC}\) :
-
Shear force capacity for diagonal tension failure: analytical; EC8 (\({\text{kN}}\))
- \(V_{fl,EC} ,V_{fl,EC'}\) :
-
Shear force capacity for flexural/toe crushing failure (EC8): original; modified (\({\text{kN}}\))
- \(V_{FRCM}\) :
-
Estimation of the mean shear contribution of the FRCM reinforcement (\({\text{kN}}\))
- \(V_{m}\) :
-
Shear strength for unstrengthened masonry (\({\text{kN}}\))
- \(V_{m,EC} , V_{m,EC'}\) :
-
Minimum shear capacity, following EC8: original; modified (\({\text{kN}}\))
- \(V_{Rd,m} , V_{Rd,m,EC}\) :
-
Design shear resistance of unstrengthened masonry: analytical model; EC8 (\({\text{kN}}\))
- \(V_{Rd,RM} , V_{Rd,RM'}\) :
-
Design shear resistance of FRCM reinforced masonry: no reduction factors; with reduction factors (\({\text{kN}}\))
- \(V_{Rd,max,c}\) :
-
Maximum design shear resistance corresponding to compression failure (\({\text{kN}}\))
- \(V_{Rd,t}\) :
-
Design shear resistance contribution of the FRCM overlay (\({\text{kN}}\))
- \(V_{RM}\) :
-
Nominal shear strength of FRCM reinforced masonry (\({\text{kN}}\))
- \(V_{sf} , V_{sf,EC}\) :
-
Shear force capacity for shear friction failure: analytical; EC8 (\({\text{kN}}\))
- \(V_{ss}\) :
-
Shear force capacity for shear sliding failure (\({\text{kN}}\))
- \(V_{t}\) :
-
Nominal shear strength contribution of FRCM overlay (\({\text{kN}}\))
- \(w_{b}\) :
-
Width brick (\({\text{mm}}\))
- \(\gamma_{e} , \gamma_{max} , \gamma_{u}\) :
-
Shear strain: elastic; at peak stress; ultimate (‰)
- \(\gamma_{M} , \gamma_{t} ,\gamma_{Rd}\) :
-
Partial factor; material factor; partial factor for shear (–)
- \(\delta\) :
-
Distance between edge of specimen and concentrated force V (\({\text{mm}}\))
- \(\Delta H, \Delta V\) :
-
Horizontal elongation; Vertical shortening (\({\text{mm}}\))
- \(\varepsilon_{h} , \varepsilon_{u} , \varepsilon_{r} , \varepsilon_{v}\) :
-
Horizontal strain, strain at as-built side; strain at reinforced side; vertical strain (‰)
- \(\varepsilon_{m} , \varepsilon_{ult}\) :
-
Cracking strain of the reinforced mortar; ultimate strain of the CFRP mesh
- \(\varepsilon_{fv}\) :
-
Design value of the tensile strain of the CFRP mesh (ACI 549-13) (‰)
- \(\theta\) :
-
Angle between the bed joint direction and the main diagonal of the wallette
- \(\mu\) :
-
Pseudo-ductility ratio (–)
- \(\mu_{ma} , \mu_{ma}^{*}\) :
-
Friction coefficient; reduced friction coefficient (–)
- \(\rho ,\rho_{r}\) :
-
Density; reinforcement ratio (–)
- \(\sigma_{m} , \sigma_{n} , \sigma_{ult}\) :
-
Cracking stress of the reinforced mortar; axial stress; ultimate stress of the mesh (\({\text{N}}/{\text{mm}}^{2}\))
- \(\tau , \tau_{e} , \tau_{u}\) :
-
Shear stress: average; at crack initiation; at ultimate shear strain (\({\text{N}}/{\text{mm}}^{2}\))
- \(\varphi\) :
-
Experimental/model ratio (–)
- \(\varPhi_{v}\) :
-
Strength reduction factor for shear (–)
References
AC434-13 (2013) Acceptance criteria for masonry and concrete strengthening using fiber reinforced cementitious matrix (FRCM) composite systems. ICC Evaluation Service, Whittier, CA
Almeida JA, Pereira EB, Barros JA (2015) Assessment of overlay masonry strengthening system under in-plane monotonic and cyclic loading using the diagonal tensile test. Constr Build Mater 94:851–865. https://doi.org/10.1016/j.conbuildmat.2015.07.040
American Concrete Institute (ACI) (2013) Committee 549. Design and construction guide of externally bonded FRCM systems for concrete and masonry repair and strengthening
Arboleda D, Babaeidarabad S, Hays C, Nanni A (2014) Durability of fabric reinforced cementitious matrix (FRCM) composites. In Proceedings 7th international conference on FRP composites in civil engineering, CICE
ASCE, SEI 41–13 (2014) Seismic evaluation and retrofit of existing buildings. American Society of Civil Engineers, Reston, VA. ISBN 978-0-7844-7791-5
ASTM (2007) C1006-07: standard test method for splitting tensile strength of masonry units, 2007. ASTM International, West Conshohocken, PA
ASTM (2010) E519/E519M-10: Standard test method for diagonal tension (shear) in masonry assemblages. ASTM International, West Conshohocken, PA
Babaeidarabad S, De Caso F, Nanni A (2013) URM walls strengthened with mesh-reinforced cementitious matrix composite subjected to diagonal compression. J Compos Constr. https://doi.org/10.1061/(ASCE)CC.1943-5614.0000441
Babaeidarabad S, Arboleda D, Loreto G, Nanni A (2014) Shear strengthening of un-reinforced concrete masonry walls with mesh-reinforced-cementitious-matrix. Constr Build Mater 65:243–253. https://doi.org/10.1016/j.conbuildmat.2014.04.116
Banijamali SM, Esfahani MR, Nosratollahi S, Sohrabi MR, Mousavi SR (2015) Reviewing the FRP strengthening systems. Am J Civ Eng 3(2–2):38–43
Bourne S, Oates S (2017) Development of statistical geomechanical models for forecasting seismicity induced by gas production from the Groningen field. Neth J Geosci 96(5):S175–S182. https://doi.org/10.1017/njg.2017.35
Cascardi A, Micelli F, Aiello MA (2016) Analytical model based on artificial neural network for masonry shear walls strengthened with FRM systems. Compos B Eng 95:252–263. https://doi.org/10.1016/j.compositesb.2016.03.066
Cattari S, Lagomarsino S, Bazzurro A, Porta F, Pampanin S (2015) Critical review of analytical models for the in-plane and out-of-plane assessment of URM buildings. In: Proceedings of new dimensions in earthquake resilience–2015 NZSEE technical conference and AGM, Rotorua, New Zealand, pp 10–12
Ceroni F, Salzano P (2018) Design provisions for FRCM systems bonded to concrete and masonry elements. Compos B Eng 143:230–242. https://doi.org/10.1016/j.compositesb.2018.01.033
Crisafulli FJ, Carr AJ, Park R (1995) Shear strength of unreinforced masonry panels. Proc Pac Conf Earthq Eng 3:77–86
Derkowski W, Kwiecień A, Zając B (2013) CFRP strengthening of bent RC elements using stiff and flexible adhesives. Tech Trans 1-B/2013:37–52
Dizhur D, Griffith MC, Ingham JM (2014) Pullout strength of NSM CFRP strips bonded to vintage clay brick masonry. Eng Struct 69:25–36. https://doi.org/10.1016/j.engstruct.2014.02.006
Donnini J, Corinaldesi V (2017) Mechanical characterization of different FRCM systems for structural reinforcement. Constr Build Mater 145:565–575. https://doi.org/10.1016/j.conbuildmat.2017.04.051
European Committee for Standardization (1998) NEN-EN 1052-1:1998: methods of test for masonry—part 1: determination of compressive strength. European Committee for Standardization, Brussels, Belgium
European Committee for Standardization (2005a) Eurocode 8: Design of structures for earthquake resistance—part 1: general rules, seismic actions and rules for buildings. European Committee for Standardization, Brussels, Belgium
European Committee for Standardization (2005b) Eurocode 8: design of structures for earthquake resistance—part 3: assessment and retrofitting of buildings. European Committee for Standardization, Brussels, Belgium
European Committee for Standardization (2006) Eurocode 6: design of masonry structures—part 1-1: general rules for reinforced and unreinforced masonry structures. European Committee for Standardization, Brussels, Belgium
European Committee for Standardization (2007a) EN 1015-11:1999/A1:2007: Methods of test for mortar for masonry—part 11: determination of flexural and compressive strength of hardened mortar. European Committee for Standardization, Brussels, Belgium
European Committee for Standardization (2007b) EN 1052-3:2002/A1:2007: methods of test for masonry—part 3: determination of initial shear strength. European Committee for Standardization, Brussels, Belgium
European Committee for Standardization (2015) EN 772-1:2011 + A1:2015: methods of test for masonry units—part 1: determination of compressive strength. European Committee for Standardization, Brussels, Belgium
Gattesco N, Boem I (2015) Experimental and analytical study to evaluate the effectiveness of an in-plane reinforcement for masonry walls using GFRP meshes. Constr Build Mater 88:94–104. https://doi.org/10.1016/j.conbuildmat.2015.04.014
Grande E, Imbimbo M, Sacco E (2018) Numerical investigation on the bond behavior of FRCM strengthening systems. Compos B Eng 145:240–251. https://doi.org/10.1016/j.compositesb.2018.03.010
Ianniruberto U, Rinaldi Z (2001) Influence of FRP reinforcement on the local ductility of R.C elements. In: Proceedings of the international conference on FRP composites in civil engineering Hong Kong Institution of Engineers, Hong Kong Institution of Steel Construction (No. volume 1)
Ismail N (2012) Selected strengthening techniques for the seismic retrofit of unreinforced masonry buildings (Doctoral dissertation). Retrieved from https://researchspace.auckland.ac.nz/bitstream/handle/2292/19106/whole.pdf?sequence=2. Accessed 2 Oct 2018
ISO (2012) 527-1. Plastics. Determination of tensile properties. Part, 1
Jafari S, Rots JG, Esposito R, Messali F (2017) Characterizing the material properties of dutch unreinforced masonry. Proc Eng 193:250–257. https://doi.org/10.1016/j.proeng.2017.06.211
Kolyvas C, Bal İE, Bernakos A, Triantafillou T (2012) Design examples of a textile mortar system for strengthening of historical masonry structures. In: 10th International Congress on Advances in Civil Engineering, 17–19 October 2012 Middle East Technical University, Ankara, Turkey
Kwiecień A (2012) Stiff and flexible adhesives bonding CFRP to masonry substrates—investigated in pull-off test and single-lap test. Arch Civ Mech Eng 12(2):228–239. https://doi.org/10.1016/j.acme.2012.03.015
Li T, Galati N, Tumialan JG, Nanni A (2005) Analysis of unreinforced masonry concrete walls strengthened with glass fiber-reinforced polymer bars. ACI Struct J 102(4):569–577
Mann W, Muller H (1982) Failure of shear-stressed masonry. An enlarged theory, tests and application to shear walls. In: Proceedings of British Ceramic Society, no 30, p 223
Mantegazza G, Gatti A, Barbieri A (2006) Retrofitting concrete and masonry building: FRCM (fiber reinforced cementitious matrix) a new emerging technology, XII Konferencja Naukowo-Techniczna Problemy Remontowe W Budownictwie Ogólnym i Obiektach Zabytkowych REMO, 6–8, 2006
Nanni A (2012) A new tool for concrete and masonry repair. Concr Int 34(4):1–7
NEN (2018) NPR 9998:2018: Beoordeling van de constructieve veiligheid van een gebouw bij nieuwbouw, verbouw en afkeuren – Grondslagen voor aardbevingsbelastingen: geïnduceerde aardbevingen. Nederlands Normalisatie-instituut, Delft
Papanicolaou CG, Triantafillou TC, Papathanasiou M, Karlos K (2008) Textile reinforced mortar (TRM) versus FRP as strengthening material of URM walls: out-of-plane cyclic loading. Mater Struct 41(1):143–157. https://doi.org/10.1617/s11527-007-9226-0
Parisi F, Menna C, Prota A (2019) Mesh-reinforced cementitious matrix (FRCM) composites: mechanical behavior and application to masonry walls. In: Jawaid M, Thariq M, Saba N (eds) Failure analysis in biocomposites, fibre-reinforced composites and hybrid composites. Woodhead Publishing, pp 199–227. https://doi.org/10.1016/B978-0-08-102293-1.00010-3
Petersen RB (2009) In-plane shear behaviour of unreinforced masonry panels strengthened with fibre reinforced polymer strips (Doctoral dissertation). http://ogma.newcastle.edu.au:8080/vital/access/services/Download/uon:5837/ATTACHMENT02. Accessed 3 Oct 2018
Petersen RB, Masia MJ, Seracino R (2009) Bond behaviour of near-surface mounted FRP strips bonded to modern clay brick masonry prisms: influence of strip orientation and compression perpendicular to the strip. J Compos Constr 13(3):169–178. https://doi.org/10.1061/(asce)cc.1943-5614.0000002
Prota A, Marcari G, Fabbrocino G, Manfredi G, Aldea C (2006) Experimental in-plane behavior of tuff masonry strengthened with cementitious matrix–grid composites. J Compos Constr 10(3):223–233. https://doi.org/10.1061/(ASCE)1090-0268(2006)10:3(223)
Seracino R, Jones NM, Ali MS, Page MW, Oehlers DJ (2007) Bond strength of near-surface mounted FRP strip-to-concrete joints. J Compos Constr 11(4):401–409. https://doi.org/10.1061/(asce)1090-0268(2007)11:4(401)
Silva PF, Yu P, Nanni A (2008) Monte Carlo simulation of shear capacity of URM walls retrofitted by polyurea reinforced GFRP grid. J Compos Constr 12(4):405–415. https://doi.org/10.1061/(asce)1090-0268(2008)12:4(405)
Triantafillou TC (1998) Strengthening of masonry structures using epoxy-bonded FRP laminates. J Compos Constr 2(2):96–104
Triantafillou TC (2016) In: Triantafillou T (ed) Textile fibre composites in civil engineering., pp 375–388. https://doi.org/10.1016/B978-1-78242-446-8.00017-3
Türkmen ÖS, Vermeltfoort AT, Martens DRW (2016) Seismic retrofit system for single leaf masonry buildings in Groningen. In: Proceedings of 16th international brick and block masonry conference, 26–30 June 2016, Padova, Italy, pp 1–8
Türkmen ÖS, Wijte SNM, Vermeltfoort AT, Martens DRW (2017) Experiments to determine the out-of-plane behavior of CFRP and ductile adhesive reinforced clay brick masonry walls. In: Proceedings 13th Canadian masonry symposium
Türkmen ÖS, De Vries BT, Wijte SNM, Vermeltfoort AT (2018). Static-cyclic in-plane tests on clay brick masonry retrofitted with a single sided fabric-reinforced cementitious matrix layer, deep mounted CFRP strips and flexible anchor connection. In: Paper presented at 10th international masonry conference, Milan, Italy
Türkmen ÖS, Wijte SNM, Ingham JM, Vermeltfoort AT (2018) Bond slip behaviour of deep mounted carbon fibre reinforced polymer strops confined with a ductile adhesive in clay brick masonry. In: Masia M, Alternam D, Totoev Y, Page A (eds) Proceedings of 10th Australasian masonry conference: masonry today and tomorrow, blz. 672–686
Van Thienen-Visser K, Breunese JN (2015) Induced seismicity of the Groningen gas field: History and recent developments. Lead Edge 34(6):664–671. https://doi.org/10.1190/tle34060664.1
West ASTM (2003) ASTM C67-03a, standard test methods for sampling and testing brick and structural clay tile. ASTM International, Conshohocken, PA
Acknowledgements
The authors wish to gratefully acknowledge the support by QuakeShield, a joint venture between Royal Oosterhof Holman and SealteQ Group. Special thanks to our beloved and retiring colleague A.T. Vermeltfoort, who provided insight and expertise that greatly assisted the research. Wishing you a long and joyous retirement.
Author information
Authors and Affiliations
Corresponding author
Additional information
Publisher's Note
Springer Nature remains neutral with regard to jurisdictional claims in published maps and institutional affiliations.
Rights and permissions
Open Access This article is distributed under the terms of the Creative Commons Attribution 4.0 International License (http://creativecommons.org/licenses/by/4.0/), which permits unrestricted use, distribution, and reproduction in any medium, provided you give appropriate credit to the original author(s) and the source, provide a link to the Creative Commons license, and indicate if changes were made.
About this article

Cite this article
Türkmen, Ö.S., De Vries, B.T., Wijte, S.N.M. et al. In-plane behaviour of clay brick masonry wallettes retrofitted with single-sided fabric-reinforced cementitious matrix and deep mounted carbon fibre strips. Bull Earthquake Eng 18, 725–765 (2020). https://doi.org/10.1007/s10518-019-00596-2
Received:
Accepted:
Published:
Issue Date:
DOI: https://doi.org/10.1007/s10518-019-00596-2