
Highlights
-
Surface energy and surface Pourbaix diagram reveal that ZrO2 (\(\overline{1 }11\)) is the most thermodynamically stable facet and is preferentially occupied by HO* at the equilibrium potential of oxygen evolution reaction (OER).
-
Microkinetic modeling analyzed the OER activity of 40 single-metal doped ZrO2 and identified 16 metals exhibit improved catalytic activity, with Rh and Fe dopants showing the remarkable improvement.
-
Thermodynamic free energy diagrams, density of states analysis, and ab initio molecular dynamics simulations further confirm that Fe–ZrO2 and Rh–ZrO2 are highly promising catalysts for OER, showcasing low ΔG for the rate-determining step, high conductivity, and exceptional stability.

Abstract
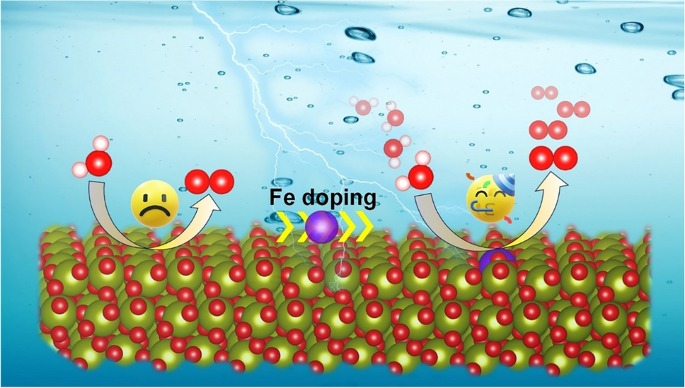
The design of cost-effective electrocatalysts is an open challenging for oxygen evolution reaction (OER) due to the “stable-or-active” dilemma. Zirconium dioxide (ZrO2), a versatile and low-cost material that can be stable under OER operating conditions, exhibits inherently poor OER activity from experimental observations. Herein, we doped a series of metal elements to regulate the ZrO2 catalytic activity in OER via spin-polarized density functional theory calculations with van der Waals interactions. Microkinetic modeling as a function of the OER activity descriptor (GO*-GHO*) displays that 16 metal dopants enable to enhance OER activities over a thermodynamically stable ZrO2 surface, among which Fe and Rh (in the form of single-atom dopant) reach the volcano peak (i.e. the optimal activity of OER under the potential of interest), indicating excellent OER performance. Free energy diagram calculations, density of states, and ab initio molecular dynamics simulations further showed that Fe and Rh are the effective dopants for ZrO2, leading to low OER overpotential, high conductivity, and good stability. Considering cost-effectiveness, single-atom Fe doped ZrO2 emerged as the most promising catalyst for OER. This finding offers a valuable perspective and reference for experimental researchers to design cost-effective catalysts for the industrial-scale OER production.
1 Introduction
Proton exchange membrane water electrolysis offers an attractive means to store and convert renewable energy into sustainable hydrogen [1,2,3]. Water electrolysis comprises two half-reactions: oxygen evolution reaction (OER) and hydrogen evolution reaction (HER). Extensive studies have displayed that OER on the anode suffers from sluggish kinetics and poor stability resulting in a significant efficiency loss, thereby becoming the main obstacle for the practical implementation of electrochemical water splitting [4,5,6,7,8,9,10,11]. Therefore, it is vital to rationally search and design OER electrocatalysts with high activity and durability. Moreover, maintaining a delicate equilibrium between stability and activity poses a significant challenge for various electrocatalysts under OER operating conditions.
Zirconium dioxide (ZrO2), a highly sustainable material, has excellent thermal stability, making it highly desirable in various applications. For instance, nano-ZrO2 displayed remarkable aromatic selectivity and stability during a 120-h test [12]. ZrO2 also boasts exceptional hydrothermal stability during the CO2 methanation process under high temperatures and pressures [13]. Notwithstanding this, the OER activity of ZrO2 was known to be notably low [14,15,16]. Doping, a frequently utilized and remarkably efficient modulation strategy, can enhance the electrical conductivity and catalytic performance of materials [17,18,19,20,21]. For example, Mishra et al. demonstrated that optimal cobalt doping (5%) in CuO improved OER activity significantly with a low overpotential of 120 mV and a small charge transfer resistance of 2.58 Ω [22]. Additionally, Fu and co-workers demonstrated that Ce dopant induced electron redistribution of CoO to stabilize Co–O bonds and displayed an optimal binding strength with OER intermediates, manifesting favorable activity with an overpotential of 261 mV [23]. Therefore, it is possible to leverage the inherent stability of ZrO2 to conduct single-atom doping research, aiming to ensure its stability while enhancing its activity.
Herein, we analyzed the electronic structure and OER performance of ZrO2 by doping a series of metals with flexible valence states, based on spin-polarized density functional theory calculations with van der Waals corrections (DFT-D3). First, we identified the thermodynamically stable ZrO2 surface, the (\(\overline{1 }11\)) surface, based on surface energy calculations with benchmarking with experimental literature. Subsequently, we analyzed the surface state of the identified stable ZrO2 surface via surface Pourbaix diagram calculations and found that the ZrO2 surface tends to be occupied by HO* under solution conditions at OER equilibrium potential. Finally, via a stratified catalyst design and screening strategy with various potential dopants for ZrO2 (Fig. 1a), we identified Fe as a promising dopant element by considering the effects of potential radiation, abundance, stability, activity, and cost-effectiveness. This work provides experimentalists with potentially superior catalysts worthy of future validation.

a Proposed strategy for screening metals capable of enhancing the OER activity of ZrO2 via doping. b Calculated surface energies of the three low-index slabs of monoclinic ZrO2. More details can be found in Fig. S1
2 Computational Details
The Vienna ab initio simulation package (VASP) was used to perform all spin-polarized DFT calculations [24, 25]. The generalized gradient approximation (GGA) in the form of revised Perdew–Burke–Ernzerhof (RPBE) [26] was employed to describe the exchange–correlation potentials. The Hubbard U parameter, representing the strong correlation repulsion energy between electrons with opposite spins, was added to the Fe (U = 4 eV) [27, 28], Co (U = 3 eV) [29, 30], Ni (U = 6.6 eV) [31], and Mn (U = 4 eV) [27, 32] 3d electrons. The electron–ion interaction was described with the projector-augmented wave method [33]. A plane-wave basis set of 480 eV was adopted. ZrO2 generally exists in three polymorphs [34,35,36]: monoclinic at room temperature, tetragonal at 1480–2650 K, and cubic at > 2650 K. Because the high thermodynamic stability is compulsory for conventional electrocatalysis under room temperature, herein, we further discuss the ZrO2 in a monoclinic form. Initial magnetic moments of 5, 0.6, 5, and 5 are set for the magnetic materials Fe, Co, Ni, and Mn, respectively. The zero-damping DFT-D3 method of Grimme was used to correct the van der Waals interactions [37]. The convergence criterion was set to be lower than 0.02 eV Å−1 for the force and 10–6 eV per atom for energy. A 2 × 2 × 1 Monkhorst–Pack was used for k-point sampling to describe the supercell [38]. A vacuum layer of 18 Å was set in the z-direction to avoid the interaction between periodic images. We employed ab initio molecular dynamics (AIMD) simulations in a canonical NVT ensemble to assess the thermodynamic stability of structures. The whole simulation lasted for 10 ps with a time step of 2 fs at 300 K. Furthermore, crystal orbital Hamilton population (COHP) was also calculated to analyze the local chemical bond properties in periodic systems. COHP is obtained via multiplying the Hamiltonian matrix by the corresponding DOS matrix. Combining it with the powerful LOBSTER tool [39], capable of handling plane-wave basis sets, allows for the visualization of COHP diagrams and analysis of bond strength.
The changes in Gibbs free energies for each elementary step were calculated using the following equation [40]:
where \(\Delta E\), \(\Delta {\text{ZPE}}\), \(\Delta S\), and \({C}_{p}\) are the changes in the electronic energy directly obtained from DFT, zero-point energy, entropy, and heat capacity, respectively. T is the temperature (298.15 K). The entropies of molecules in the gas phase were acquired from the NIST database. \(\Delta {G}_{pH}\) is the free energy contribution due to the variations in H concentration, expressed by the Nernst equation as \(\Delta {G}_{pH}=2.303{k}_{B}T{\text{pH}}\). In this work, we set pH to zero. \({\Delta G}_{U }=-neU\), where n was the electron transfer number and U was the applied potential.
Under the acidic condition, the thermodynamic potential for the oxidation of H2O to produce O2 involving 4 electron transfers is described as:
The thermodynamic overpotential (η) is the important indicator to judge the catalytic activities of a catalyst, which can be obtained by using the following equation:
where \({\Delta G}_{max}\) is the maximum free energy change among the four elementary steps, and 1.23 V is the equilibrium potential. A lower \(\eta \) implies higher catalytic activity, and the \(\eta \) of an ideal catalyst is zero.
The surface energy is the energy required to break intermolecular chemical bonds when creating a new surface, expressed by the formula [41, 42]:
where \({E}_{slab-unrelax}\) and \({E}_{slab-relax}\) is the total energy of the unrelaxed and relaxed slab, respectively. \({E}_{bulk}\) is the bulk energy per atom, N is the number of atoms in the slab, and A is the surface area. The kinetic volcano model was derived based on the potential-dependent kinetic information as a function of current density and adsorption free energies of HO* and O*, with the details and parameters shown in Ref. [43].
The surface Pourbaix diagram was built based on the computational hydrogen electrode (CHE) method [40], which offers thermodynamic insights into the water activation-induced surface coverage of an electrocatalyst under operating conditions [44,45,46], expressed as follows:
where m and n are the number of oxygen and hydrogen atoms of the adsorbate, respectively. The differences in free energy were calculated using:
Here, \({U}_{SHE}\) refers to the potential relative to the standard hydrogen electrode (SHE), and \({k}_{B}\) is the Boltzmann constant (8.617343 × 10⁻⁵ eV K−1). The surface Pourbaix diagrams were modeled with the CatMath online platform through cloud computing [47].
3 Results and Discussion
3.1 Surface Energy and Surface Pourbaix Analysis
The most stable phase of ZrO2 at low temperature is monoclinic [36] taking the P21/c space group, and the optimized lattice parameters (a = 5.15 Å, b = 5.26 Å, c = 5.30 Å) closely match the experimental values [48]. To determine the most stable exposed facet, we conducted surface energy calculations on three representative low-index planes, namely (\(\overline{1 }11\)), (111), and (101), all of which are intricate models featuring O-terminated, Zr-terminated, and Zr and O co-terminated interfaces. Figure S1 provides a visual representation of all possible surface structures maintaining a stoichiometric ratio consistent with the bulk, along with their corresponding surface energy values. A lower surface energy indicates a higher propensity for the formation of chemical bonds, thus suggesting a thermodynamic preference for crystal growth along that specific plane. The minimum surface energy values for (\(\overline{1 }11\)), (111), and (101) planes are 0.725, 0.930, and 1.142 J m−2, respectively (Fig. 1b). This implies that ZrO2 (\(\overline{1 }11\)) is the most thermodynamically stable exposed facet, aligning consistently with earlier theoretical prediction and experimental observation [49, 50]. This finding identifies an important substrate model, ZrO2 (\(\overline{1 }11\)), which is a prerequisite for OER activity analysis.
As Fig. 2a illustrated, O-terminated ZrO2 configuration holds many various adsorption sites. H*, O*, or HO* species generated through water activation are possible to pre-covered on the surface of catalysts under OER operating conditions, which renders the oxide system may deviate from its pristine stoichiometric form [43] and exerts substantial influences on reaction overpotential. Surface Pourbaix analysis can provide a valuable approximation of the real state under OER conditions [44,45,46]; thus, we calculated the surface Pourbaix diagram (Fig. 2b). The results illustrate that the surface of ZrO2 will be initially occupied by HO* at USHE > 1.13 V vs. reversible hydrogen electrode (RHE), which is lower than the equilibrium potential of OER (1.23 V vs. RHE); that means, under working conditions, the surface is no longer in its pristine state but instead adopts a restructured configuration enriched with HO*. However, given that HO* also serves as the initial adsorption intermediate of OER, we can directly use the original model to analyze the OER activity. Surface Pourbaix diagram provides a detailed analysis of the surface occupation states to help us obtain a theoretical substrate model that is closer to the experiment. To assess the viability of doping various metals onto the ZrO2 surface, we calculated the doping formation energy (Fig. 2c). The most stable doping configurations for each metal are shown in Figs. S2 and S3. Generally, the doping formation energy is calculated to assess the thermodynamic stability of catalysts, wherein the negative value indicates the high stability and vice versa. As Fig. 2c shows, Cu, Ag, Au, and Hg dopants exhibit positive formation energies, which means these dopants are difficult to replace Zr and fix on the ZrO2 stably. Conversely, the remaining metal dopants display negative formation energies, indicating they are thermodynamical feasibility to substitute Zr and form stable catalysts. All feasible metal elements for doping are listed in Fig. 2d, which are subsequently investigated for the OER analysis. Specifically, metals are arranged in the order of the periodic table of elements except Al. The yellow, pink, blue, green, and purple backgrounds correspond to elements from the third, fourth, fifth, sixth periods, and rare earth elements, respectively. This order can identify elements in empty positions, which are subsequently disregarded.

a Optimized configuration of ZrO2 with top and side views. The purple and red spheres represent Zr and O, respectively. b Calculated surface Pourbaix diagram of the ZrO2 surface. c Formation energy values of different single-metal atoms doped ZrO2. d The feasible metals for doping on the surface of ZrO2.
3.2 OER Activity Screening Based on the Volcano Activity Model
The GO*-GHO* is generally regarded as a crucial descriptor for evaluating OER activity since it quantifies the capacity of surface oxygen atoms to make and break bonds with hydrogen and oxygen atoms, which is prone to be the most thermodynamically challenging reaction steps for OER [2, 43, 51]. To achieve more accurate predictions, we employed the microkinetic modeling as the function of GO*-GHO* and potential at various currents [43, 52]. The current curves were obtained by numerically solving the rate of HOO formation considering the O \(\to \) HOO transition state. Figure 3a illustrates the kinetic OER activity relating potential to GO*-GHO* at a current density of 5 \(\mu \) A cm−2, featuring the characteristic volcano-shape. On the left side of the peak, decreased GO*-GHO* values correspond to lower OER kinetic activity. Similarly, catalysts exhibit the decaying OER performance along the right arm of the volcano curve. Catalysts close to volcanic peaks, such as Co, Mn, Rh, Fe, and Pt, demonstrate good catalytic activity. Especially, Rh sitting at the volcano peak, with an optimal GO*-GHO* value, requires relatively low overpotentials to achieve high reaction rates in acidic solutions, demonstrating the highest OER activity. In addition, we plot potential as a function of GO*-GHO* at 1 mA cm−2 (Fig. S4) and 1 A cm−2 (Fig. S5), and the results display that the activity order may change as the current increases, but the qualitative order remains constant; that is, a good catalyst is always good at different currents. Figure 3b displays a linear scaling relation between the adsorption energy of O* (EO*) and HO* (EHO*), with the identified slope and intercept close to those of higher-index (where h2 + k2 + l2 > 1) metal oxide surfaces [52]. Figure 3c further demonstrates that the adsorption energy of HOO* (EHOO*) and EHO* exists a good linear correlation and a constant difference between EHOO* and EHO* on effectively doped catalysts, which implies GHOO* – GHO* = (GO* – GHO*) + (GHOO* – GO*) = constant, i.e., GHOO* – GHO* = (GO* – GHO*) + [constant(GO* – GHO*)]. Therefore, GO* – GHO* serves as a distinctive descriptor elucidating the OER activity, further reinforcing the rationale behind the selection of Fig. 3a. Furthermore, EHO* and \({\varepsilon }_{d}\)-up/\({\varepsilon }_{d}\)-down demonstrate a robust linear correlation, as depicted in Fig. 3d. Such correlation offers valuable insights into finding optimal HO binding energies by manipulating the \({\varepsilon }_{d}\) value. Generally, the optimal OER catalyst has surface hydroxide deprotonation free energy value of 1.5 to 1.7 eV [43, 53,54,55]. In our work, taking 1.5 eV as the standard fits well with the dynamic trend (Fig. 3a), we use (GO* − GHO* = 1.5 eV) as the descriptor to further embody catalytic behavior. A smaller absolute value of (GO* − GHO* = 1.5 eV), represented by a darker color, suggests better OER performance (Fig. 3e). Figure 3e selects all metals closing to the volcanic peak exhibits improved OER performance compared to the pristine ZrO2, in which Rh has the best catalytic activity with values closest to zero. Theoretical overpotential (η), a fundamental thermodynamic parameter, has emerged as a crucial metric for evaluating and predicting the OER performance of catalysts. Thus, we plot η as a function of GO* − GHO*, which has a volcano relationship (Fig. S6). Rh standing on the peak of the volcano map exhibits the highest OER activity with minimum η, followed by Fe, Pt, etc. This thermodynamic volcano diagram trend is roughly consistent with the dynamic volcano diagram (Fig. 3a), and the gap may be attributed to the omission of transition states in thermodynamics. To acquire a more profound comprehension of the impact of doping on the electronic properties of the catalyst, we calculate the density of states (DOS) of ZrO2 (Fig. S7a). Near the Fermi level, the valence band is predominantly contributed by O orbitals, while the conduction band is primarily composed of Zr orbitals. A wide forbidden region exists between the top of the valence band and the bottom of the conduction band with a bandgap of 2.6 eV, further observed by the band structure diagram (Fig. S7c). Also, the precise HSE functional displayed that ZrO2 is a semiconductor material with a wide bandgap of 4.45 eV (Fig. S7b). Figures S8 and S9 show the DOS of metal doped ZrO2. The bandgap values exhibit a progressively decreasing trend in the following order: Ir (2.54 eV), Ru (2.49 eV), Sn (2.28 eV), Ti (1.82 eV), and Cr (1.71 eV). In, Sm, Pr, Fe, Nd, Ni, Pd, Ga, Co, Pt, Mn, and Rh metals, on the other hand, induce a direct transformation of the catalyst from a semiconductor to a semi-metallic property characterized by a band gap of 0 eV, effectively promoting the electron transfer and thereby improving the conductivity of the ZrO2. In short, the microkinetic volcano diagrams screen out some promising catalysts, the linear relationship obtains the abnormal adsorption points and the correlation between different adsorbates, and DOS uncover enhanced conductivity of catalysts through doping.

a Kinetic OER activity volcano model as a function of GO*-GHO* at 5 \(\mu \) A cm−2 (black line). b Scaling relation between EO* and EHO* on feasible metals doped ZrO2. The linear scaling relations of EHO* vs. c EHOO* and d \({\varepsilon }_{d}\) on elevated metal doped ZrO2. e A heatmap represents the magnitude of values as a color. Values (unit eV) were obtained by GO*-GHO* = 1.5, and darker colors correspond to lower values implying higher activity.
3.3 Free Energy Analysis
Gibbs free energy diagrams were established to visualize the OER intermediate formations of four doped metals closest to the volcanic peak and with stable intermediates. Figure 4a exhibits the free energy diagram of OER on ZrO2. The first step, the formation of HO*, is thermodynamically feasible. Then, HO* dissociates into H+ and O*, which is thermodynamically challenging with a higher onset potential of 2.15 V. The next proton-electron transfer steps of HOO* formation and the generation of O2 in the last step are energetically supported. Therefore, HO* deprotonation to generate O* on ZrO2 is the most challenging step, which is the potential determining steps (PDS), requiring a η of 0.92 V to make all steps thermodynamically downhill (watermelon red line). Similarly, HO*\(\to \) O* is the PDS of Ti–ZrO2 with a η of 0.63 V, Pt–ZrO2 with a η of 0.54 V, Fe–ZrO2 with a η of 0.36 V and Rh–ZrO2 with a η of 0.26 V (Fig. 4b–e), which aligns closely with the microkinetic volcano diagram trend (Fig. 3a). The specific adsorption energies of O* and HO* are calculated in Fig. 4f. The order of adsorption strength for O* is Rh–ZrO2 > Pt–ZrO2 > ZrO2 > Fe–ZrO2 > Ti–ZrO2, and that of HO* is Pt–ZrO2 > Rh–ZrO2 > ZrO2 > Fe–ZrO2 > Ti–ZrO2, which is further explained by the charge density difference map (Fig. S10 and inset in Fig. 4). In short, the free energy diagram reveals that Fe–ZrO2 and Rh–ZrO2 are highly active catalysts with only slightly higher \(\Delta \)G.

Gibbs Free energy diagram of OER on a ZrO2, b Ti–ZrO2, c Pt–ZrO2, d Fe–ZrO2, and e Rh–ZrO2. f Adsorption energy values of O* (pink line) and HO* (blue line) on five varied substrates. The inset is the charge density difference of HO*, and the isosurface value was set to 0.001 e Å−3
For the comparison of different adsorbate species, we relied on thermodynamic analysis, while the dynamic factor was lacking. Therefore, we performed AIMD simulations on Rh–ZrO2 with different species based on its optimal catalytic activity (Fig. S11a–c). The results show that they are thermodynamically stable. In addition, we also evaluated the thermal stability of ZrO2, Fe–ZrO2, and Rh–ZrO2 (Fig. S11d–f). The results demonstrate that these systems maintain their structural integrity, in which energy and temperature oscillate around equilibrium within thermal perturbations. Thus, they remain thermodynamically stable and catalytic activity for extended duration.
3.4 Interatomic Bond Strength Analysis
COHP can provide insights into the strength and nature of chemical bonds between atoms. Integrated COHP (ICOHP) is a quantitative method for measuring chemical bond strength, and a more negative ICOHP value indicates a stronger bond strength between atoms. As Fig. 5 exhibited, we calculate the COHP and ICOHP of metal-O (O* and HO*) bond to deeply understand the bonding mechanism. The sequence of bonding strength with O* is Rh (− 3.28 eV) > Zr (− 2.07 eV) > Fe (− 1.91 eV) (Fig. 5a–c), and with O in HO* is Rh (− 1.83 eV) > Zr (− 1.66 eV) > Fe (− 1.58 eV) (Fig. 5d–f). The ICOHP values explain the adsorption energy trend well. The strong bonding interaction between Rh and O* and HO* results in a lower energy requirement for stabilizing the OER intermediates, which is the key reason of its optimal catalytic performance. Bader charge and D band center (\({\varepsilon }_{d}\)) are also further quantified (Fig. S12). Compared with Fe dopant, Rh loses more charge to O* and HO* (Fig. S12a) and has a smaller negative \({\varepsilon }_{d}\) value (Fig. S12b, c), indicating underlying reasons for the strong adsorption capacity of Rh.

Crystal orbital Hamilton population (COHP) analysis of the interactions between a Rh–O in O*, b Zr–O in O*, c Fe–O in O*, d Rh–O in HO*, f Zr–O in HO*, and e Fe–O in HO*
Based on comprehensive analysis, both Rh–ZrO2 and Fe–ZrO2 are potential candidates for enhancing OER efficiency. The Rh doping exhibits a lower overpotential, but its shortage limits industrial application. In contrast, Fe, a cost-effective and readily available metal, has not only been successfully doped into ZrO2 in experiments [56,57,58] but also regraded as an ideal dopant for enhancing OER activity [59, 60]. Therefore, Fe holds great promise as a modulating agent for industrial-scale OER application.
4 Conclusion
In summary, we have analyzed the effects of 40 different single-metal doping to regulate the OER activity of ZrO2 using a stratified screening process based on spin-polarized DFT-D3, surface Pourbaix analysis, microkinetic modeling, cost-effectiveness analysis, and bonding analysis. We identified 16 metals exhibit improved catalytic activity, with Rh and Fe dopants showing the remarkable improvement. These doped metals reduce the band gap of ZrO2, thereby significantly increasing conductivity. In addition, the thermodynamic free energy diagram shows that the theoretical overpotential of Ti, Pt, Fe, and Rh metals are 0.63, 0.54, 0.36, and 0.26 V, respectively, which aligns well with the kinetic volcano model. Compared with Fe dopant, the smaller negative \({\varepsilon }_{d}\) value facilitates Rh dopant to stabilize the OER intermediates well and thus exhibits higher catalytic activity, but its high cost and shortage limit industrial-scale application. Therefore, the cost-effectiveness Fe-ZrO2 catalyst holds more promise and practicality. This finding provides valuable insights into the design and development of stable, low-cost, and high-performance OER catalysts for commercial-scale water splitting.
References
J. Li, Oxygen evolution reaction in energy conversion and storage: design strategies under and beyond the energy scaling relationship. Nano-Micro Lett. 14, 112 (2022). https://doi.org/10.1007/s40820-022-00857-x
Z.W. Seh, J. Kibsgaard, C.F. Dickens, I. Chorkendorff, J.K. Nørskov et al., Combining theory and experiment in electrocatalysis: insights into materials design. Science 355, eaad4998 (2017). https://doi.org/10.1126/science.aad4998
L. Mei, X. Gao, Z. Gao, Q. Zhang, X. Yu et al., Size-selective synthesis of platinum nanoparticles on transition-metal dichalcogenides for the hydrogen evolution reaction. Chem. Commun. 57, 2879–2882 (2021). https://doi.org/10.1039/d0cc08091h
M.G. Walter, E.L. Warren, J.R. McKone, S.W. Boettcher, Q. Mi et al., Solar water splitting cells. Chem. Rev. 110, 6446–6473 (2010). https://doi.org/10.1021/cr1002326
B. Guo, Y. Ding, H. Huo, X. Wen, X. Ren et al., Recent advances of transition metal basic salts for electrocatalytic oxygen evolution reaction and overall water electrolysis. Nano-Micro Lett. 15, 57 (2023). https://doi.org/10.1007/s40820-023-01038-0
J. Li, J. Li, J. Ren, H. Hong, D. Liu et al., Electric-field-treated Ni/Co3O4 film as high-performance bifunctional electrocatalysts for efficient overall water splitting. Nano-Micro Lett. 14, 148 (2022). https://doi.org/10.1007/s40820-022-00889-3
P. Wang, Y. Luo, G. Zhang, Z. Chen, H. Ranganathan et al., Interface engineering of NixSy@MnOxHy nanorods to efficiently enhance overall-water-splitting activity and stability. Nano-Micro Lett. 14, 120 (2022). https://doi.org/10.1007/s40820-022-00860-2
T.R. Cook, D.K. Dogutan, S.Y. Reece, Y. Surendranath, T.S. Teets et al., Solar energy supply and storage for the legacy and nonlegacy worlds. Chem. Rev. 110, 6474–6502 (2010). https://doi.org/10.1021/cr100246c
I.C. Man, H.-Y. Su, F. Calle-Vallejo, H.A. Hansen, J.I. Martínez et al., Universality in oxygen evolution electrocatalysis on oxide surfaces. ChemCatChem 3, 1159–1165 (2011). https://doi.org/10.1002/cctc.201000397
E. Antolini, Iridium as catalyst and cocatalyst for oxygen evolution/reduction in acidic polymer electrolyte membrane electrolyzers and fuel cells. ACS Catal. 4, 1426–1440 (2014). https://doi.org/10.1021/cs4011875
M.D. Symes, L. Cronin, Decoupling hydrogen and oxygen evolution during electrolytic water splitting using an electron-coupled-proton buffer. Nat. Chem. 5, 403–409 (2013). https://doi.org/10.1038/nchem.1621
J. Liu, Y. He, L. Yan, C. Ma, C. Zhang et al., Nano-ZrO2 as hydrogenation phase in bi-functional catalyst for syngas aromatization. Fuel 263, 116803 (2020). https://doi.org/10.1016/j.fuel.2019.116803
T. Yamaguchi, Application of ZrO2 as a catalyst and a catalyst support. Catal. Today 20, 199–217 (1994). https://doi.org/10.1016/0920-5861(94)80003-0
F.F. Alharbi, M.U. Nisa, H.M.A. Hassan, S. Manzoor, Z. Ahmad et al., Novel lanthanum sulfide–decorated zirconia nanohybrid for enhanced electrochemical oxygen evolution reaction. J. Solid State Electrochem. 26, 2171–2182 (2022). https://doi.org/10.1007/s10008-022-05220-z
S.B. Jaffri, K.S. Ahmad, I. Abrahams, C.J. Kousseff, C.B. Nielsen et al., Rare earth (Sm/Eu/Tm) doped ZrO2 driven electro-catalysis, energy storage, and scaffolding in high-performance perovskite solar cells. Int. J. Hydrog. Energy 48, 29119–29141 (2023). https://doi.org/10.1016/j.ijhydene.2023.04.085
M. Sadaqat, S. Manzoor, S. Aman, L. Nisar, M. Najam-Ul-Haq et al., Defective nickel zirconium oxide mesoporous bifunctional electrocatalyst for oxygen evolution reaction and overall water splitting. Fuel 333, 126538 (2023). https://doi.org/10.1016/j.fuel.2022.126538
Y. Zhang, J. Liu, Z. Wei, Q. Liu, C. Wang et al., Electrochemical CO2 reduction over nitrogen-doped SnO2 crystal surfaces. J. Energy Chem. 33, 22–30 (2019). https://doi.org/10.1016/j.jechem.2018.08.017
R.Q. Huang, W.P. Liao, M.X. Yan, S. Liu, Y.M. Li et al., P doped Ru-Pt alloy catalyst toward high performance alkaline hydrogen evolution reaction. J. Electrochem. 29, 2203081 (2023). https://jelectrochem.xmu.edu.cn/journal/vol29/iss5/3
J. Lin, Y. Yan, C. Li, X. Si, H. Wang et al., Bifunctional electrocatalysts based on Mo-doped NiCoP nanosheet arrays for overall water splitting. Nano-Micro Lett. 11, 55 (2019). https://doi.org/10.1007/s40820-019-0289-6
Y. Zhang, W. Zhang, Y. Feng, J. Ma, Promoted CO2 electroreduction over indium-doped SnP3: a computational study. J. Energy Chem. 48, 1–6 (2020). https://doi.org/10.1016/j.jechem.2019.12.025
Z. X. Wan, C. H. Wang, X. W. Kang, Self-supported Ru-Cu3P catalyst towards alkaline hydrogen evolution. J. Electrochem. 28, 2214005 (2022). https://jelectrochem.xmu.edu.cn/journal/vol28/iss10/6
A.K. Mishra, D. Pradhan, Hierarchical urchin-like cobalt-doped CuO for enhanced electrocatalytic oxygen evolution reaction. ACS Appl. Energy Mater. 4, 9412–9419 (2021). https://doi.org/10.1021/acsaem.1c01632
M. Li, X. Wang, K. Liu, H. Sun, D. Sun et al., Reinforcing Co-O covalency via Ce(4f)─O(2p)─Co(3d) gradient orbital coupling for high-efficiency oxygen evolution. Adv. Mater. 35, 2302462 (2023). https://doi.org/10.1002/adma.202302462
G. Kresse, J. Furthmüller, Efficiency of ab-initio total energy calculations for metals and semiconductors using a plane-wave basis set. Comput. Mater. Sci. 6, 15–50 (1996). https://doi.org/10.1016/0927-0256(96)00008-0
G. Kresse, J. Furthmüller, Efficient iterative schemes forab initiototal-energy calculations using a plane-wave basis set. Phys. Rev. B 54, 11169–11186 (1996). https://doi.org/10.1103/physrevb.54.11169
B. Hammer, L.B. Hansen, J.K. Nørskov, Improved adsorption energetics within density-functional theory using revised Perdew-Burke-Ernzerhof functionals. Phys. Rev. B 59, 7413–7421 (1999). https://doi.org/10.1103/physrevb.59.7413
L. Wang, T. Maxisch, G. Ceder, Oxidation energies of transition metal oxides within the GGA+U framework. Phys. Rev. B 73, 195107 (2006). https://doi.org/10.1103/physrevb.73.195107
D. Mutter, D.F. Urban, C. Elsässer, Determination of formation energies and phase diagrams of transition metal oxides with DFT+U. Materials 13, 4303 (2020). https://doi.org/10.3390/ma13194303
K. Jiang, S. Zhou, Z. Wang, Textured electronic states of the triangular-lattice Hubbard model and NaxCoO2. Phys. Rev. B 90, 165135 (2014). https://doi.org/10.1103/physrevb.90.165135
A. Cadi-Essadek, A. Roldan, D. Santos-Carballal, P.E. Ngoepe, M. Claeys et al., DFT+U study of the electronic, magnetic and mechanical properties of Co, CoO, and Co3O4. S. Afr. J. Chem. 74, 8–16 (2021). https://doi.org/10.17159/0379-4350/2021/v74a3
X. Shi, S.L. Bernasek, A. Selloni, Formation, electronic structure, and defects of Ni substituted spinel cobalt oxide: a DFT+U study. J. Phys. Chem. C 120, 14892–14898 (2016). https://doi.org/10.1021/acs.jpcc.6b03096
A. Jain, G. Hautier, S.P. Ong, C.J. Moore, C.C. Fischer et al., Formation enthalpies by mixing GGA and GGA+U calculations. Phys. Rev. B 84, 045115 (2011). https://doi.org/10.1103/physrevb.84.045115
G. Kresse, D. Joubert, From ultrasoft pseudopotentials to the projector augmented-wave method. Phys. Rev. B 59, 1758–1775 (1999). https://doi.org/10.1103/physrevb.59.1758
E.H. Kisi, C.J. Howard, Crystal structures of zirconia phases and their inter-relation. Key Eng. Mater. 153–154, 1–36 (1998). https://doi.org/10.4028/www.scientific.net/kem.153-154.1
V.G. Keramidas, W.B. White, Raman scattering study of the crystallization and phase transformations of ZrO2. J. Am. Ceram. Soc. 57, 22–24 (1974). https://doi.org/10.1111/j.1151-2916.1974.tb11355.x
D.K. Smith, W. Newkirk, The crystal structure of baddeleyite (monoclinic ZrO2) and its relation to the polymorphism of ZrO2. Acta Crystallogr. 18, 983–991 (1965). https://doi.org/10.1107/s0365110x65002402
S. Grimme, J. Antony, S. Ehrlich, H. Krieg, A consistent and accurate ab initio parametrization of density functional dispersion correction (DFT-D) for the 94 elements H-Pu. J. Chem. Phys. 132, 154104 (2010). https://doi.org/10.1063/1.3382344
H.J. Monkhorst, J.D. Pack, Special points for brillouin-zone integrations. Phys. Rev. B 13, 5188 (1976). https://doi.org/10.1103/PhysRevB.13.5188
S. Maintz, V.L. Deringer, A.L. Tchougréeff, R. Dronskowski, LOBSTER: a tool to extract chemical bonding from plane-wave based DFT. J. Comput. Chem. 37, 1030–1035 (2016). https://doi.org/10.1002/jcc.24300
J.K. Nørskov, J. Rossmeisl, A. Logadottir, L. Lindqvist, J.R. Kitchin et al., Origin of the overpotential for oxygen reduction at a fuel-cell cathode. J. Phys. Chem. B 108, 17886–17892 (2004). https://doi.org/10.1021/jp047349j
M. Huang, C. Sun, X. Zhang, P. Wang, S. Xu et al., The surface structure, stability, and catalytic performances toward O2 reduction of CoP and FeCoP2. Dalton Trans. 51, 10420–10431 (2022). https://doi.org/10.1039/d2dt01408d
Q. Li, M. Rellán-Piñeiro, N. Almora-Barrios, M. Garcia-Ratés, I.N. Remediakis et al., Shape control in concave metal nanoparticles by etching. Nanoscale 9, 13089–13094 (2017). https://doi.org/10.1039/c7nr03889e
C.F. Dickens, C. Kirk, J.K. Nørskov, Insights into the electrochemical oxygen evolution reaction with ab initio calculations and microkinetic modeling: beyond the limiting potential volcano. J. Phys. Chem. C 123, 18960–18977 (2019). https://doi.org/10.1021/acs.jpcc.9b03830
H. Liu, X. Jia, A. Cao, L. Wei, C. D’agostino et al., The surface states of transition metal X-ides under electrocatalytic conditions. J. Chem. Phys. 158, 6 (2023). https://doi.org/10.1063/5.0147123
W. Yang, Z. Jia, B. Zhou, L. Wei, Z. Gao et al., Surface states of dual-atom catalysts should be considered for analysis of electrocatalytic activity. Commun. Chem. 6, 6 (2023). https://doi.org/10.1038/s42004-022-00810-4
W. Yang, Z. Jia, L. Chen, B. Zhou, D. Zhang et al., Effects of intermetal distance on the electrochemistry-induced surface coverage of M-N-C dual-atom catalysts. Chem. Commun. 59, 10761–10764 (2023). https://doi.org/10.1039/d3cc03208f
H. Liu, H. Zheng, Z. Jia, B. Zhou, Y. Liu et al., The CatMath: an online predictive platform for thermal + electrocatalysis. Front. Chem. Sci. Engin. 17, 2156–2160 (2023). https://doi.org/10.1007/s11705-023-2371-3
G.-M. Rignanese, Dielectric properties of crystalline and amorphous transition metal oxides and silicates as potential high-κ candidates: the contribution of density-functional theory. J. Phys. Condens. Matter 17, R357–R379 (2005). https://doi.org/10.1088/0953-8984/17/7/r03
A. Christensen, E.A. Carter, First-principles study of the surfaces of zirconia. Phys. Rev. B 58, 8050–8064 (1998). https://doi.org/10.1103/physrevb.58.8050
C. Morterra, G. Cerrato, L. Ferroni, L. Montanaro, Surface characterization of yttria-stabilized tetragonal ZrO2 Part 1. Structural, morphological, and surface hydration features. Mater. Chem. Phys. 37, 243–257 (1994). https://doi.org/10.1016/0254-0584(94)90160-0
L.G.V. Briquet, M. Sarwar, J. Mugo, G. Jones, F. Calle-Vallejo, A new type of scaling relations to assess the accuracy of computational predictions of catalytic activities applied to the oxygen evolution reaction. ChemCatChem 9, 1261–1268 (2017). https://doi.org/10.1002/cctc.201601662
H. Li, S. Kelly, D. Guevarra, Z. Wang, Y. Wang et al., Analysis of the limitations in the oxygen reduction activity of transition metal oxide surfaces. Nat. Catal. 4, 463–468 (2021). https://doi.org/10.1038/s41929-021-00618-w
J. Rossmeisl, Z.-W. Qu, H. Zhu, G.-J. Kroes, J.K. Nørskov, Electrolysis of water on oxide surfaces. J. Electroanal. Chem. 607, 83–89 (2007). https://doi.org/10.1016/j.jelechem.2006.11.008
K.S. Exner, J. Anton, T. Jacob, H. Over, Ligand effects and their impact on electrocatalytic processes exemplified with the oxygen evolution reaction (OER) on RuO2(110). ChemElectroChem 2, 707–713 (2015). https://doi.org/10.1002/celc.201402430
B. Zhang, X. Zheng, O. Voznyy, R. Comin, M. Bajdich et al., Homogeneously dispersed multimetal oxygen-evolving catalysts. Science 352, 333–337 (2016). https://doi.org/10.1126/science.aaf1525
W. Ahmed, J. Iqbal, S.O. Aisida, A. Badshah, I. Ahmad et al., Structural, magnetic and dielectric characteristics of optically tuned Fe doped ZrO2 nanoparticles with visible light driven photocatalytic activity. Mater. Chem. Phys. 251, 122999 (2020). https://doi.org/10.1016/j.matchemphys.2020.122999
A.O. de Souza, F.F. Ivashita, V. Biondo, A. Paesano Jr., D.H. Mosca, Structural and magnetic properties of iron doped ZrO2. J. Alloys Compd. 680, 701–710 (2016). https://doi.org/10.1016/j.jallcom.2016.04.170
P. Sakthisharmila, N. Sivakumar, J. Mathupriya, Synthesis, characterization of Mn, Fe doped ZrO2 composites and its applications on photocatalytic and solar catalytic studies. Mater. Today Proc. 47, 2159–2167 (2021). https://doi.org/10.1016/j.matpr.2021.05.461
X. Zhang, C. Sun, S. Xu, M. Huang, Y. Wen et al., DFT-assisted rational design of CoMxP/CC (M = Fe, Mn, and Ni) as efficient electrocatalyst for wide pH range hydrogen evolution and oxygen evolution. Nano Res. 15, 8897–8907 (2022). https://doi.org/10.1007/s12274-022-4771-y
Y. Li, H. Zhang, M. Jiang, Q. Zhang, P. He, X. Sun, 3d self-supported Fe-doped Ni2P nanosheet arrays as bifunctional catalysts for overall water splitting. Adv. Funct. Mater. 27, 17025132017 (2017). https://doi.org/10.1002/adfm.201702513
Acknowledgements
Z.Y. Zeng thanks the funding support from the Research Grants Council of the Hong Kong Special Administrative Region, China [Project No. CityU11308923] and the Basic Research Project from Shenzhen Science and Technology Innovation Committee in Shenzhen, China (No. JCYJ20210324134012034), and the Applied Research Grant of City University of Hong Kong (project No. of 9667247) and Chow Sang Sang Group Research Fund of City University of Hong Kong (project No. 9229123). Z.Y. Zeng also thanks the funding supported by the Seed Collaborative Research Fund Scheme of State Key Laboratory of Marine Pollution which receives regular research funding from Innovation and Technology Commission (ITC) of the Hong Kong SAR Government. However, any opinions, findings, conclusions or recommendations expressed in this publication do not reflect the views of the Hong Kong SAR Government or the ITC. H. Li and T. Wang thank the JSPS KAKENHI (No. JP23K13703 and JP23KF0102). We acknowledge the high-level science and technology talents project of Lvliang City (No. 2022RC07) and foundation of Shanxi supercomputing center of China (No. 11sxsc202301). H. Li acknowledges the Center for Computational Materials Science, Institute for Materials Research, Tohoku University for the use of MASAMUNE-IMR (202312-SCKXX-0203) and the Institute for Solid State Physics (ISSP) at the University of Tokyo for the use of their supercomputers.
Author information
Authors and Affiliations
Corresponding authors
Ethics declarations
Conflict of interest
The authors declare that they have no conflict of interest and no competing financial interests or personal relationships that could have appeared to influence the work reported in this paper.
Supplementary Information
Below is the link to the electronic supplementary material.
Rights and permissions
Open Access This article is licensed under a Creative Commons Attribution 4.0 International License, which permits use, sharing, adaptation, distribution and reproduction in any medium or format, as long as you give appropriate credit to the original author(s) and the source, provide a link to the Creative Commons licence, and indicate if changes were made. The images or other third party material in this article are included in the article's Creative Commons licence, unless indicated otherwise in a credit line to the material. If material is not included in the article's Creative Commons licence and your intended use is not permitted by statutory regulation or exceeds the permitted use, you will need to obtain permission directly from the copyright holder. To view a copy of this licence, visit http://creativecommons.org/licenses/by/4.0/.
About this article

Cite this article
Zhang, Y., Wang, T., Mei, L. et al. Rational Design of Cost-Effective Metal-Doped ZrO2 for Oxygen Evolution Reaction. Nano-Micro Lett. 16, 180 (2024). https://doi.org/10.1007/s40820-024-01403-7
Received:
Accepted:
Published:
DOI: https://doi.org/10.1007/s40820-024-01403-7