
Abstract
This study introduces a novel population-based metaheuristic algorithm called secretary bird optimization algorithm (SBOA), inspired by the survival behavior of secretary birds in their natural environment. Survival for secretary birds involves continuous hunting for prey and evading pursuit from predators. This information is crucial for proposing a new metaheuristic algorithm that utilizes the survival abilities of secretary birds to address real-world optimization problems. The algorithm's exploration phase simulates secretary birds hunting snakes, while the exploitation phase models their escape from predators. During this phase, secretary birds observe the environment and choose the most suitable way to reach a secure refuge. These two phases are iteratively repeated, subject to termination criteria, to find the optimal solution to the optimization problem. To validate the performance of SBOA, experiments were conducted to assess convergence speed, convergence behavior, and other relevant aspects. Furthermore, we compared SBOA with 15 advanced algorithms using the CEC-2017 and CEC-2022 benchmark suites. All test results consistently demonstrated the outstanding performance of SBOA in terms of solution quality, convergence speed, and stability. Lastly, SBOA was employed to tackle 12 constrained engineering design problems and perform three-dimensional path planning for Unmanned Aerial Vehicles. The results demonstrate that, compared to contrasted optimizers, the proposed SBOA can find better solutions at a faster pace, showcasing its significant potential in addressing real-world optimization problems.
1 Introduction
With the continuous development of society and technology, optimization problems have become increasingly complex and challenging in various domains. The nature of these problems encompasses a wide range of areas, including manufacturing, resource allocation, path planning, financial portfolio optimization, and others. They involve multiple decision variables, numerous constraints, and diverse objective functions. In the face of real-world constraints such as resource scarcity, cost control, and efficiency requirements, finding optimal solutions has become an urgent imperative (Zhou et al. 2011).
Traditional mathematical optimization methods, while performing well in certain cases, often exhibit limitations when dealing with complex, high-dimensional, nonlinear, and multimodal problems. Issues such as local optima, slow convergence rates, difficulty in parameter tuning, high-dimensional problems, and computational costs have been persistent challenges for researchers and practitioners in the field of optimization (Faramarzi et al. 2020b). Therefore, people are seeking new methods and technologies to address these challenges. In this context, metaheuristic algorithms have emerged. They belong to a category of intelligent search algorithms inspired by natural phenomena and mechanisms, designed to find solutions to optimization problems through stochastic methods. Unlike traditional mathematical optimization methods, metaheuristic algorithms are better suited for complex, multimodal, high-dimensional, and nonlinear optimization problems. These algorithms, by simulating processes like evolution, swarm intelligence, and simulated annealing found in nature, exhibit robustness and global search capabilities, and as a result, they have gained widespread popularity in various practical applications.
Despite the significant progress that metaheuristic algorithms have made in various fields, they also face some challenges and issues, including susceptibility to getting stuck in local optima, slow convergence rates, insufficient robustness, and high computational costs (Agrawal et al. 2021). Despite the significant progress that metaheuristic algorithms have made in various fields, they also face some challenges and issues, including susceptibility to getting stuck in local optima, slow convergence rates, insufficient robustness, and high computational costs (Wolpert and Macready 1997) explicitly stated that the significant performance of an algorithm in solving a specific set of optimization problems does not guarantee that it will perform equally well in other optimization problems. Therefore, not all algorithms excel at in all optimization applications. The NFL theorem drives researchers to design innovative algorithms that can more effectively solve optimization problems by providing better solutions. In certain scenarios, algorithmic convergence to local optima may occur due to an imbalance between development and exploration. To address this issue, various approaches have been proposed. Nama et al. introduced a novel integrated algorithm, denoted as e-mPSOBSA (Nama et al. 2023), based on the Backtracking Search Algorithm (BSA) and Particle Swarm Optimization (PSO). This integration aims to mitigate the imbalance between development and exploration. Nama et al. proposed an improved version of the Backtracking Search Algorithm, named gQR-BSA (Nama et al. 2022b), to address challenges arising from the imbalance between exploitation and exploration. He presented a bio-inspired multi-population self-adaptive Backtracking Search Algorithm, referred to as ImBSA (Nama and Saha 2022), as a solution to the development-exploration imbalance. Nama presented an enhanced symbiotic organism search algorithm, mISOS (Nama 2021), to overcome challenges associated with development-exploration imbalance. Chakraborty introduced an enhanced version of the Symbiotic Organism Search algorithm, namely nwSOS (Chakraborty et al. 2022a), designed for solving optimization problems in higher dimensions. Saha combined the exploration capability of SQI with the development potential of SOS, proposing the hybrid symbiotic organism search (HSOS) algorithm (Saha et al. 2021) and a new parameter setting-based modified differential evolution for function optimization (Nama and Saha 2020). This combination enhances the algorithm's robustness and overall performance.
Engineering optimization problems have consistently posed significant challenges within the field of engineering. These problems involve achieving specific objectives, typically involve cost minimization, efficiency maximization, or performance optimization, under limited resources. The challenges in engineering optimization arise from their diversity and complexity. Problems can be either discrete or continuous, involve multiple decision variables, are subject to various constraints, and may incorporate elements of randomness and uncertainty. Consequently, selecting appropriate optimization algorithms is crucial for solving these problems. In recent decades, researchers have developed various types of optimization algorithms, including traditional mathematical programming methods, heuristic algorithms, and evolutionary algorithms, among others. However, these algorithms still exhibit certain limitations when addressing such optimization problems. For example, when dealing with more complex problems, they tend to have slow convergence rates, limited search precision, and are prone to becoming trapped in local optima.
To overcome these challenges, this paper introduces a new optimization algorithm—the secretary bird optimization algorithm (SBOA). Our motivation is to address the shortcomings of existing algorithms in tackling complex engineering optimization problems. Specifically, our focus lies in improving the convergence speed of optimization algorithms, enhancing optimization precision, and effectively avoiding local optima. By introducing the secretary bird optimization algorithm, we aim to provide a more efficient and reliable solution for the engineering domain, fostering new breakthroughs in the research and practical application of optimization problems. The primary contributions of this study are as follows:
-
Introduced a novel population-based metaheuristic algorithm named secretary bird optimization algorithm (SBOA), which is designed to simulate the survival capabilities of secretary birds in their natural environment.
-
SBOA is inspired by the hunting and evading abilities of secretary birds in dealing with predators, where survival adaptability is divided into two phases: exploration and exploitation.
-
The exploration phase of the algorithm simulates the behavior of secretary birds capturing snakes, while the exploitation phase simulates their behavior of evading predators.
-
Mathematical modeling is employed to describe and analyze each stage of SBOA.
-
Evaluate the effectiveness and robustness of SBOA by solving 42 benchmark functions, including unimodal, multimodal, hybrid, and composition functions defined in CEC 2017, and CEC 2022.
-
The performance of SBOA in solving practical optimization problems is tested on twelve engineering optimization design problems and three-dimensional path planning for unmanned aerial vehicles (UAVs).
The structure of this paper is arranged as follows: the literature review is presented in Sect. 2. Section 3 introduces the proposed SBOA and models it. Section 4 presents a simulation analysis of the convergence behavior, the exploration and exploitation balance ratio and search agent distribution of SBOA when dealing with optimization problems. Section 5 uses twelve engineering optimization problems to verify the efficiency of SBOA in solving practical engineering optimization problems and addresses a path planning scenario for an unmanned aerial vehicles (UAVs). Section 6 provides the conclusion and outlines several directions for future research.
2 Literature review
Metaheuristic algorithms, as a branch of bio-inspired methods, have been widely employed to solve problems in various domains. These algorithms can be classified into several categories based on their underlying principles, including evolutionary algorithms (EA), physics-inspired algorithms (PhA), human behavior-based algorithms, and swarm intelligence (SI) algorithms (Abualigah et al. 2021). EA draws inspiration from natural evolutionary processes, with genetic algorithms (GA) (Holland 1992) and differential evolution (DE) (Storn and Price 1997) as two of its most representative members. These algorithms are rooted in Darwin's theory of evolution. On the other hand, PhA are often inspired by physical phenomena. A notable example is the simulated annealing algorithm (SA) (Kirkpatrick et al. 1983), which simulates the annealing process of solids. It uses this physical analogy to find optimal solutions. Human behavior-based algorithms are based on the principles of human social learning. A typical example is the social evolution and learning optimization algorithm (SELOA) (Kumar et al. 2018). SI algorithms are inspired by the collective behavior of biological populations in nature. Particle swarm optimization (PSO) (Kennedy and Eberhart 1995) is one such algorithm that mimics the foraging behavior of birds. In PSO, particles represent birds searching for food (the objective function) in the forest (search space). During each iteration, particle movement is influenced by both individual and group-level information. Ultimately, particles converge toward the best solution in their vicinity.
The laws of physics play a crucial role in the PhA algorithm, providing essential guidance for optimizing problem solutions. For instance, the simulated annealing algorithm (SA) (Kirkpatrick et al. 1983) draws inspiration from the physical phenomenon of metal melting and its cooling and solidification process. The homonuclear molecular orbital (HMO) optimization (HMO) (Mahdavi-Meymand and Zounemat-Kermani 2022) is proposed based on the Bohr atomic model and the electron arrangement behavior around the atomic nucleus in the context of the homonuclear molecular structure. Additionally, the special relativity search (SRS) (Goodarzimehr et al. 2022) is introduced by applying concepts from electromagnetism and the theory of special relativity. The gravity search algorithm (GSA) (Rashedi et al. 2009) is based on Newton's universal law of gravitation. The subtraction-average-based optimizer (SABO) (Trojovský and Dehghani 2023) is inspired by mathematical concepts such as the mean, differences in search agent positions, and differences in the values of the objective function. The big bang-big crunch algorithm (BB-BC) (Erol and Eksin 2006) is based on Newton's universal law of gravitation. The big bang-big crunch algorithm (BB-BC) (Mirjalili et al. 2016), water cycle algorithm (WCA)(Eskandar et al. 2012), nuclear reaction optimization (NRO) (Wei et al. 2019), nuclear reaction optimization (NRO) (Kaveh and Khayatazad 2012). Sinh Cosh optimizer (SCHO) (Bai et al. 2023) is inspired by the mathematical characteristics of the hyperbolic sine (Sinh) and hyperbolic cosine (Cosh) functions. The great wall construction algorithm (GWCA) (Guan et al. 2023) is inspired by the competitive and elimination mechanisms among workers during the construction of the Great Wall. The exponential distribution optimizer (EDO) (Abdel-Basset et al. 2023a) is based on the mathematical model of exponential probability distribution. Snowmelt optimizer (SAO) (Deng and Liu 2023) inspired by the sublimation and melting behavior of snow in the natural world. The optical microscope algorithm (OMA) (Cheng and Sholeh 2023) is inspired by the magnification capability of optical microscopes when observing target objects. It involves a preliminary observation with the naked eye and is further inspired by the simulated magnification process using objective and eyepiece lenses, and rime optimizer (RIME) (Su et al. 2023) inspired by the mechanism of ice growth in haze, also draw insights from various physical phenomena.
The MH algorithm, which is based on human behavior, aims to solve optimization problems by simulating some natural behaviors of humans. For instance, the teaching and learning-based optimization algorithm (TBLA) (Rao et al. 2011) The MH algorithm, which is based on human behavior, aims to solve optimization problems by simulating some natural behaviors of humans. For instance, the teaching and learning-based optimization algorithm (TBLA) (Kumar et al. 2018), which is developed by simulating the social learning behaviors of humans in societal settings, particularly in family organizations. A proposed an improved approach to Teaching–Learning-Based Optimization, referred to as Hybrid Teaching–Learning-Based Optimization (Nama et al. 2020).The human evolutionary optimization algorithm (HEOA) (Lian and Hui 2024) draws inspiration from human evolution. HEOA divides the global search process into two distinct stages: human exploration and human development. Logical chaotic mapping is used for initialization. During the human exploration stage, an initial global search is conducted. This is followed by the human development stage, where the population is categorized into leaders, explorers, followers, and failures, each employing different search strategies. The partial reinforcement optimizer (PRO) (Taheri et al. 2024) is proposed based on the partial reinforcement extinction (PRE) theory. According to this theory, learners intermittently reinforce or strengthen specific behaviors during the learning and training process. In the context of optimization, PRO incorporates intermittent reinforcement or strengthening of certain behaviors based on the PRE theory. The soccer league competition algorithm (SLC) (Moosavian and Roodsari 2014) is inspired by the competitive interactions among soccer teams and players in soccer leagues. The student psychology-based optimization algorithm (SPBO) (Das et al. 2020) is inspired by the psychological motivation of students who endeavor to exert extra effort to enhance their exam performance, with the goal of becoming the top student in the class. The dynamic hunting leadership optimization (DHL) (Ahmadi et al. 2023) is proposed based on the notion that effective leadership during the hunting process can significantly improve efficiency. This optimization algorithm is motivated by the idea that proficient leadership in the hunting context can yield superior outcomes. Lastly, the gold rush optimization algorithm (GRO) (Zolf 2023) is inspired by the competitive interactions among soccer teams and players in soccer leagues.
The simulation of the biological evolution concept and the principle of natural selection has provided significant guidance for the development of evolutionary-based algorithms. In this regard, genetic algorithms (GA) (Holland 1992), and differential evolution (DE) (Storn and Price 1997) are widely recognized as the most popular evolutionary algorithms. When designing GAs and DEs, the concepts of natural selection and reproductive processes are employed, including stochastic operators such as selection, crossover, and mutation. Furthermore, there are other evolutionary-inspired approaches, such as genetic programming (GP) (Angeline 1994), cultural algorithms (CA) (Reynolds 1994), and evolution strategies (ES) (Asselmeyer et al. 1997). These methods have garnered widespread attention and have been applied in various applications, including but not limited to facial recognition (Liu and IEEE 2014), feature selection (Chen et al. 2021), image segmentation (Chakraborty et al. 2022b), network anomaly detection (Choura et al. 2021), data clustering (Manjarres et al. 2013), scheduling problems (Attiya et al. 2022), and many other engineering applications and issues.
In the field of biology, the simulation of collective behaviors of animals, aquatic life, birds, and other organisms has long been a source of inspiration for the development of swarm intelligence algorithms. For example, the ant colony optimization (ACO) algorithm (Dorigo et al. 2006) was inspired by the intelligent behavior of ants in finding the shortest path to their nest and food sources. The particle swarm optimization (PSO) algorithm (Kennedy and Eberhart 1995) was inspired by the collective behaviors and movement patterns of birds or fish in their natural environments while searching for food. The grey wolf optimizer (GWO) (Mirjalili et al. 2014) is based on the social hierarchy and hunting behaviors observed in wolf packs. The nutcracker optimizer (NOA) (Abdel-Basset et al. 2023b) is proposed based on the behavior of nutcrackers, specifically inspired by Clark’s nutcracker, which locates seeds and subsequently stores them in appropriate caches. The algorithm also considers the use of various objects or markers as reference points and involves searching for hidden caches marked from different angles. The sea-horse optimizer (SHO) (Zhao et al. 2023) draws inspiration from the natural behaviors of seahorses, encompassing their movements, predatory actions, and reproductive processes. The SHO algorithm incorporates principles observed in seahorse behavior for optimization purposes. The African vulture optimization algorithm (AVOA) (Abdollahzadeh et al. 2021a) draws inspiration from the foraging and navigation behaviors of African vultures. The fox optimization algorithm (FOX) (Mohammed and Rashid 2023) models the hunting behavior of foxes in the wild when pursuing prey. The Chameleon swarm algorithm (CSA) (Braik 2021) simulates the dynamic behaviors of chameleons as they search for food in trees, deserts, and swamps. The Golden Jackal optimization algorithm (GJO) (Chopra and Mohsin Ansari 2022) is inspired by the cooperative hunting behavior of golden jackals. The Chimpanzee optimization algorithm (ChOA) (Khishe and Mosavi 2020) is based on the hunting behavior of chimpanzee groups. Finally, the whale optimization algorithm (WOA) (Mirjalili and Lewis 2016) takes inspiration from the behavior of whales when hunting for prey by encircling them. Additionally, there are several other nature-inspired optimization algorithms in the field, each drawing inspiration from the foraging and collective behaviors of various animal species. These algorithms include the marine predator algorithm (MPA) (Faramarzi et al. 2020a), which is inspired by the hunting behavior of marine predators; the rat swarm optimization algorithm (RSO) (Dhiman et al. 2021), inspired by the population behavior of rats when chasing and attacking prey; The artificial rabbits optimization (ARO) algorithm (Wang et al. 2022), introduced by Wang et al. in 2022, draws inspiration from the survival strategies of rabbits in nature. This includes their foraging behavior, which involves detouring and randomly hiding. The detour-foraging strategy specifically entails rabbits eating grass near the nests of other rabbits, compelling them to consume vegetation around different burrows. And a novel bio-inspired algorithm, the shrike mocking optimizer (SMO) (Zamani et al. 2022), is introduced, drawing inspiration from the astonishing noise-making behavior of shrikes. On the other hand, the spider wasp optimizer (SWO) (Abdel-Basset et al. 2023c) takes inspiration from the hunting, nesting, and mating behaviors of female spider wasps in the natural world. The SWO algorithm incorporates principles observed in the activities of female spider wasps for optimization purposes. White shark optimizer (WSO) (Braik et al. 2022), which takes inspiration from the exceptional auditory and olfactory abilities of great white sharks during navigation and hunting; the tunicate swarm algorithm (TSA) (Kaur et al. 2020), inspired by jet propulsion and clustering behavior in tunicates; the honey badger algorithm (HBA) (Hashim et al. 2022), which simulates the digging and honey-searching dynamic behaviors of honey badgers; the dung beetle optimization algorithm (DBO) (Xue and Shen 2022), inspired by the rolling, dancing, foraging, stealing, and reproductive behaviors of dung beetles; and the salp swarm algorithm (SSA) (Mirjalili et al. 2017), inspired by the collective behavior of salps in the ocean. The fennec fox optimization (FFO) (Zervoudakis and Tsafarakis 2022), inspired by the survival strategies of fennec foxes in desert environments. The quantum-based avian navigation algorithm (QANA) (Zamani et al. 2021) is proposed, inspired by the extraordinary precision navigation behavior of migratory birds along long-distance aerial routes; the Northern Goshawk Optimization (NGO) (Dehghani et al. 2021), which draws inspiration from the hunting process of northern goshawks; the pathfinder algorithm (PFA) (Yapici and Cetinkaya 2019), inspired by animal group collective actions when searching for optimal food areas or prey; the snake optimizer (SO) (Hashim and Hussien 2022), which models unique snake mating behaviors. The crested porcupine optimizer (CPO) (Abdel-Basset et al. 2024), introduced by Abdel-Basset et al. (2024), is inspired by the four defense behaviors of the crested porcupine, encompassing visual, auditory, olfactory, and physical attack mechanisms. The CPO algorithm incorporates these defensive strategies observed in crested porcupines for optimization purposes. On the other hand, the Genghis Khan Shark Optimizer (GKSO) (Hu et al. 2023) is proposed based on the hunting, movement, foraging (from exploration to exploitation), and self-protection mechanisms observed in the Genghis Khan shark. This optimizer draws inspiration from the diverse behaviors exhibited by Genghis Khan sharks, integrating them into optimization algorithms. Slime Mould Algorithm (SMA) (Li et al. 2020), inspired by slime mold foraging and diffusion behaviors and Chakraborty combined Second-order Quadratic Approximation with Slime Mould Algorithm (SMA), presenting the hybrid algorithm HSMA (Chakraborty et al. 2023) to enhance the algorithm's exploitation capabilities for achieving global optimality. Nama introduced a novel quasi-reflective slime mould algorithm (QRSMA) (Nama 2022). The evolutionary crow search algorithm (ECSA) (Zamani and Nadimi-Shahraki 2024) is introduced by Zamani to optimize the hyperparameters of artificial neural networks for diagnosing chronic diseases. ECSA successfully addresses issues such as reduced population diversity and slow convergence speed commonly encountered in the Crow Search Algorithm. Sahoo proposed an improved Moth Flame Optimization algorithm (Sahoo et al. 2023) based on a dynamic inverse learning strategy. Combining binary opposition algorithm (BOA) with moth flame optimization (MFO), a new hybrid algorithm h-MFOBOA (Nama et al. 2022a) was introduced. Fatahi proposes an improved binary quantum avian navigation algorithm (IBQANA) (Fatahi et al. 2023) in the context of fuzzy set system (FSS) for medical data preprocessing. This aims to address suboptimal solutions generated by the binary version of heuristic algorithms. Chakraborty introduced an enhancement to the Butterfly Optimization Algorithm, named mLBOA (Chakraborty et al. 2022b), utilizing Lagrange interpolation formula and embedding Levy flight search strategy; Sharma proposed an improved Lagrange interpolation method for global optimization of butterfly optimization algorithm (Sharma et al. 2022); Hoda Zamani proposes a conscious crow search algorithm (CCSA) (Zamani et al. 2019) based on neighborhood awareness to address global optimization and engineering design problems. CCSA successfully tackles issues related to the unbalanced search strategy and premature convergence often encountered in the Crow Search Algorithm. the gorilla troop optimization algorithm (GTO) (Abdollahzadeh et al. 2021b), based on the social behaviors of gorillas groups; and the Walrus Optimization Algorithm (WOA) (Trojovský and Dehghani 2022), inspired by walrus behaviors in feeding, migration, escaping, and confronting predators. Regardless of the differences between these metaheuristic algorithms, they share a common characteristic of dividing the search process into two phases: exploration and exploitation. “Exploration” represents the algorithm’s ability to comprehensively search the entire search space to locate promising areas, while “Exploitation” guides the algorithm to perform precise searches within local spaces, gradually converging toward better solutions (Wu et al. 2019). Therefore, in the design of optimization algorithms, a careful balance between “exploration” and “exploitation” must be achieved to demonstrate superior performance in seeking suitable solutions (Liu et al. 2013). The proposed Secretary Bird Optimization algorithm effectively balances exploration and exploitation in two phases, making it highly promising for solving engineering optimization problems. Table 1 below lists some popular optimization algorithms and analyzes the advantages and disadvantages of different algorithms when applied to engineering optimization problems.
Based on the literature, the hunting strategies of Secretary Birds and their behavior when evading predators are considered intelligent activities, offering a fresh perspective on problem-solving and optimization. These insights can potentially form the basis for the design of optimization algorithms. Therefore, in this research, inspired by the Secretary Bird's hunting strategy and predator evasion behavior, a promising optimization algorithm is proposed for solving engineering optimization problems.
3 Secretary bird optimization algorithm
In this section, the proposed secretary bird optimization algorithm (SBOA) is described and the behavior of the secretary bird is modeled mathematically.
3.1 Secretary bird optimization algorithm inspiration and behavior
The Secretary Bird (Scientific name: Sagittarius serpentarius) is a striking African raptor known for its distinctive appearance and unique behaviors. It is widely distributed in grasslands, savannas, and open riverine areas south of the Sahara Desert in Africa. Secretary birds typically inhabit tropical open grasslands, savannas with sparse trees, and open areas with tall grass, and they can also be found in semi-desert regions or wooded areas with open clearings. The plumage of secretary birds is characterized by grey-brown feathers on their backs and wings, while their chests are pure white, and their bellies are deep black (De Swardt 2011; Hofmeyr et al. 2014), as shown in Fig. 1.

Secretary bird
The Secretary Bird is renowned for its unique hunting style, characterized by its long and sturdy legs and talons that enable it to run and hunt on the ground (Portugal et al. 2016). It typically traverses grasslands by walking or trotting, mimicking the posture of a “secretary at work” by bowing its head and attentively scanning the ground to locate prey hidden in the grass. Secretary birds primarily feed on insects, reptiles, small mammals, and other prey. Once they spot prey, they swiftly charge towards it and capture it with their sharp talons. They then strike the prey against the ground, ultimately killing it and consuming it (Portugal et al. 2016).
The remarkable aspect of Secretary Birds lies in their ability to combat snakes, making them a formidable adversary to these reptiles. When hunting snakes, the Secretary Bird displays exceptional intelligence. It takes full advantage of its height by looking down on the slithering snakes on the ground, using its sharp eyes to closely monitor their every move. Drawing from years of experience in combat with snakes, the Secretary Bird can effortlessly predict the snake’s next move, maintaining control of the situation. It gracefully hovers around the snake, leaping, and provoking it. It behaves like an agile martial arts master, while the snake, trapped within its circle, struggles in fear. The relentless teasing exhausts the snake, leaving it weakened. At this point, the Secretary Bird avoids the snake’s frontal attacks by jumping behind it to deliver a lethal blow. It uses its sharp talons to grasp the snake’s vital points, delivering a fatal strike. Dealing with larger snakes can be challenging for the Secretary Bird, as large snakes possess formidable constriction and crushing power. In such cases, the Secretary Bird may lift the snake off the ground, either by carrying it in its beak or gripping it with its talons. It then soars into the sky before releasing the snake, allowing it to fall to the hard ground, resulting in a predictable outcome (Feduccia and Voorhies 1989; De Swardt 2011).
Furthermore, the intelligence of the Secretary Bird is evident in its strategies for evading predators, which encompass two distinct approaches. The first strategy involves the bird's ability to camouflage itself when it detects a nearby threat. If suitable camouflage surroundings are available, the Secretary Bird will blend into its environment to evade potential threats. The second strategy comes into play when the bird realizes that the surrounding environment is not conducive to camouflage. In such cases, it will opt for flight or rapid walking as a means to swiftly escape from the predator (Hofmeyr et al. 2014). The correspondence between the Secretary Bird's behavior and the secretary bird optimization algorithm (SBOA) is illustrated in Fig. 2. In this context, the preparatory hunting behavior of the secretary bird corresponds to the initialization stage of secretary bird optimization algorithm (SBOA). The subsequent stages of the secretary bird's hunting process align with the three exploration stages of SBOA. The two strategies employed by the secretary bird to evade predators correspond to \({C}_{1}\) and\({C}_{2}\), the two strategies in the exploitation stage of SBOA.

Secretary bird hunting and escape strategies correspond to SBOA
3.2 Mathematical modeling of the secretary bird optimization algorithm
In this subsection, the mathematical model of the natural behavior of secretary birds to hunt snakes and avoid natural enemies is proposed to be presented to SBOA.
3.2.1 Initial preparation phase
The secretary bird optimization algorithm (SBOA) method belongs to the category of population-based metaheuristic approaches, where each Secretary Bird is considered a member of the algorithm’s population. The position of each Secretary Bird in the search space determines the values of decision variables. Consequently, in the SBOA method, the positions of the Secretary Birds represent candidate solutions to the problem at hand. In the initial implementation of the SBOA, Eq. (1) is employed for the random initialization of the Secretary Birds' positions in the search space.
where \({X}_{i}\) denotes the position of the \({i}^{th}\) secretary bird \({lb}_{j}\) and \({ub}_{j}\) are the lower and upper bounds, respectively, and \(r\) denotes a random number between 0 and 1.
In the secretary bird optimization algorithm (SBOA), it is a population-based approach where optimization starts from a population of candidate solutions, as shown in Eq. (2). These candidate solutions \(X\) are randomly generated within the upper bound \((ub)\) and lower bound \((lb)\) constraints for the given problem. The best solution obtained thus far is approximately treated as the optimal solution in each iteration.
\(X\) said secretary bird group, \({X}_{i}\) said the \({i}^{th}\) secretary bird, \({X}_{{\text{i}},{\text{j}}}\) said the \({i}^{th}\) secretary bird \({j}^{th}\) question the value of a variable, said \(N\) group members (the secretary) number, and \(Dim\) said problem of variable dimension.
Each secretary bird represents a candidate solution to optimize the problem. Therefore, the objective function can be evaluated based on the values proposed by each secretary bird for the problem variables. The resulting objective function values are then compiled into a vector using Eq. (3).
Here, \(F\) represents the vector of objective function values, and \({F}_{{\text{i}}}\) represents the objective function value obtained by the \({i}^{th}\) secretary bird. By comparing the obtained objective function values, the quality of the corresponding candidate solutions is effectively analyzed, determining the best candidate solution for a given problem. In minimization problems, the secretary bird with the lowest objective function value is the best candidate solution, whereas in maximization problems, the secretary bird with the highest objective function value is the best candidate solution. Since the positions of the secretary birds and the values of the objective function are updated in each iteration, it is necessary to determine the best candidate solution in each iteration as well.
Two distinct natural behaviors of the secretary bird have been utilized for updating the SBOA members. These two types of behaviors encompass:
-
(a)
The secretary bird’s hunting strategy;
-
(b)
The secretary bird's escape strategy.
Thus, in each iteration, each member of the secretary bird colony is updated in two different stages.
3.2.2 Hunting strategy of secretary bird (exploration phase)
The hunting behavior of secretary birds when feeding on snakes is typically divided into three stages: searching for prey, consuming prey, and attacking prey. The hunting behavior of the secretary bird is shown in Fig. 3.

The hunting behavior of secretary birds
Based on the biological statistics of the secretary bird's hunting phases and the time durations for each phase, we have divided the entire hunting process into three equal time intervals, namely\(t<\frac{1}{3}T\), \(\frac{1}{3}T<t<\frac{2}{3}T\) and \(\frac{2}{3}T<t<T\), corresponding to the three phases of the secretary bird's predation: searching for prey, consuming prey, and attacking prey. Therefore, the modeling of each phase in SBOA is as follows:
Stage 1 (Searching for Prey): The hunting process of secretary birds typically begins with the search for potential prey, especially snakes. Secretary birds have incredibly sharp vision, allowing them to quickly spot snakes hidden in the tall grass of the savannah. They use their long legs to slowly sweep the ground while paying attention to their surroundings, searching for signs of snakes (Feduccia and Voorhies 1989). Their long legs and necks enable them to maintain a relatively safe distance to avoid snake attacks. This situation arises in the initial iterations of optimization, where exploration is crucial. Therefore, this stage employs a differential evolution strategy. Differential evolution uses differences between individuals to generate new solutions, enhancing algorithm diversity and global search capabilities. By introducing differential mutation operations, diversity can help avoid getting trapped in local optima. Individuals can explore different regions of the solution space, increasing the chances of finding the global optimum. Therefore, updating the secretary bird's position in the Searching for Prey stage can be mathematically modeled using Eqs. (4) and (5).
where, \(t\) represents the current iteration number, \(T\) represents the maximum iteration number, \({X}_{i}^{new,P1}\) represents the new state of the \({i }^{th}\) secretary bird in the first stage, and \({x}_{random\_1}\) and \({x}_{random\_2}\) are the random candidate solutions in the first stage iteration. \({R}_{1}\) represents a randomly generated array of dimension \(1\times Dim\) from the interval \([\mathrm{0,1}]\), where Dim is the dimensionality of the solution space. \(x_{i,j}^{{new\,P1}}\) represents its value of the \({j }^{th}\) dimension, and \({F}_{i}^{new,P1}\) represents its fitness value of the objective function.
Stage 2 (Consuming Prey): After a secretary bird discovers a snake, it engages in a distinctive method of hunting. Unlike other raptors that immediately dive in for combat, the secretary bird employs its agile footwork and maneuvers around the snake. The secretary bird stands its ground, observing every move of the snake from a high vantage point. It uses its keen judgment of the snake's actions to hover, jump, and provoke the snake gradually, thereby wearing down its opponent's stamina (Hofmeyr et al. 2014). In this stage, we introduce Brownian motion (RB) to simulate the random movement of the secretary bird. Brownian motion can be mathematically modeled using Eq. (6). This "peripheral combat" strategy gives the secretary bird a significant physical advantage. Its long legs make it difficult for the snake to entangle its body, and the bird's talons and leg surfaces are covered with thick keratin scales, like a layer of thick armor, making it impervious to the fangs of venomous snakes. During this stage, the secretary bird may frequently pause to lock onto the snake's location with its sharp eyesight. Here, we use the concept of “\({x}_{best}\)” (individual historical best position) and Brownian motion. By using “\({x}_{best}\),” individuals can perform local searches towards the best positions they have previously found, better exploring the surrounding solution space. Additionally, this approach not only helps individuals avoid premature converging to local optima but also accelerates the algorithm’s convergence to the best positions in the solution space. This is because individuals can search based on both global information and their own historical best positions, increasing the chances of finding the global optimum. The introduction of the randomness of Brownian motion enables individuals to explore the solution space more effectively and provides opportunities to avoid being trapped in local optima, leading to better results when addressing complex problems. Therefore, updating the secretary bird's position in the Consuming Prey stage can be mathematically modeled using Eqs. (7) and (8).
where \(randn(1,Dim)\) represents a randomly generated array of dimension \(1\times Dim\) from a standard normal distribution (mean 0, standard deviation 1), and \({x}_{best}\) represents the current best value.
Stage 3 (Attacking Prey): When the snake is exhausted, the secretary bird perceives the opportune moment and swiftly take action, using its powerful leg muscles to launch an attack. This stage typically involves the secretary bird’s leg-kicking technique, where it rapidly raises its leg and delivers accurate kicks using its sharp talons, often targeting the snake's head. The purpose of these kicks is to quickly incapacitate or kill the snake, thereby avoiding being bitten in return. The sharp talons strike at the snake's vital points, leading to its demise. Sometimes, when the snake is too large to be immediately killed, the secretary bird may carry the snake into the sky and release it, causing it to fall to the hard ground and meet its end. In the random search process, we introduce \(Levy\) flight strategy to enhance the optimizer’s global search capabilities, reduce the risk of SBOA getting stuck in local solutions, and improve the algorithm’s convergence accuracy. \(Levy\) flight is a random movement pattern characterized by short, continuous steps and occasional long jumps in a short amount of time. It is used to simulate the flight ability of the secretary bird, enhancing its exploration of the search space. Large steps help the algorithm explore the global range of the search space, bringing individuals closer to the best position more quickly, while small steps contribute to improving optimization accuracy. To make SBOA more dynamic, adaptive, and flexible during the optimization process—achieving a better balance between exploration and exploitation, avoiding premature convergence, accelerating convergence, and enhancing algorithm performance—we introduce a nonlinear perturbation factor represented as \((1-\frac{t}{T})^(2\times \frac{t}{T})\). Therefore, updating the secretary bird’s position in the Attacking Prey stage can be mathematically modeled using Eqs. (9) and (10).
To enhance the optimization accuracy of the algorithm, we use the weighted \(Levy\) flight, denoted as ' \({\text{RL}}\) '.
Here, \(Levy\left(Dim\right)\) represents the \(Levy\) flight distribution function. It is calculated as follows:
Here, \(s\) is a fixed constant of 0.01 and \(\eta\) is a fixed constant of 1.5. \(u\) and \(v\) are random numbers in the interval [0, 1]. The formula for σ is as follows:
Here, \(\Gamma\) denotes the gamma function and \(\eta\) has a value of 1.5.
3.2.3 Escape strategy of secretary bird (exploitation stage)
The natural enemies of secretary birds are large predators such as eagles, hawks, foxes, and jackals, which may attack them or steal their food. When encountering these threats, secretary birds typically employ various evasion strategies to protect themselves or their food. These strategies can be broadly categorized into two main types. The first strategy involves flight or rapid running. Secretary birds are known for their exceptionally long legs, enabling them to run at remarkable speeds. They can cover distances of 20 to 30 km in a single day, earning them the nickname “marching eagles”. Additionally, secretary birds are skilled flyers and can swiftly take flight to escape danger, seeking safer locations (Feduccia and Voorhies 1989). The second strategy is camouflage. Secretary birds may use the colors or structures in their environment to blend in, making it harder for predators to detect them. Their evasion behaviors when confronted with threats are illustrated in Fig. 4. In the design of the SBOA, it is assumed that one of the following two conditions occurs with equal probability:
-
i.
\({C}_{1}\): Camouflage by environment;
-
ii.
\({C}_{2}\): Fly or run away.

The escape behavior of the secretary bird
In the first strategy, when secretary birds detect the proximity of a predator, they initially search for a suitable camouflage environment. If no suitable and safe camouflage environment is found nearby, they will opt for flight or rapid running to escape. In this context, we introduce a dynamic perturbation factor, denoted as \({(1-\frac{t}{T})}^{2}\). This dynamic perturbation factor helps the algorithm strike a balance between exploration (searching for new solutions) and exploitation (using known solutions). By adjusting these factors, it is possible to increase the level of exploration or enhance exploitation at different stages. In summary, both evasion strategies employed by secretary birds can be mathematically modeled using Eq. (14), and this updated condition can be expressed using Eq. (15).
Here, \(r=0.5\), \({R}_{2}\) represents the random generation of an array of dimension \((1\times Dim)\) from the normal distribution, \({x}_{random}\) represents the random candidate solution of the current iteration, and K represents the random selection of integer 1 or 2, which can be calculated by Eq. (16).
Here, \(rand\left(\mathrm{1,1}\right)\) means randomly generating a random number between (0,1).
In summary, the flowchart of SBOA is shown in Fig. 5, and the pseudocode is shown in Algorithm 1.
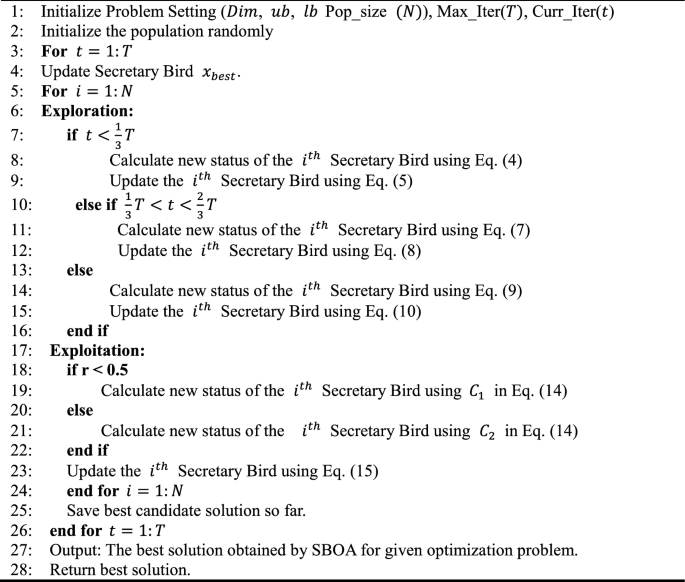
Pseudo code of SBOA

Flowchart of SBOA
3.3 Algorithm complexity analysis
Different algorithms take varying amounts of time to optimize the same problems and assessing the computational complexity of an algorithm is an essential way to evaluate its execution time. In this paper, we utilize Big O notation (Tallini et al. 2016) to analyze the time complexity of SBOA. Let \(N\) represent the population size of secretary birds, \(Dim\) denote the dimensionality, and \(T\) is the maximum number of iterations. Following the rules of operation for the time complexity symbol \(O\), the time complexity for randomly initializing the population is \(O(N)\). During the solution update process, the computational complexity is \(O(T \times N) + O(T \times N \times Dim)\), which encompasses both finding the best positions and updating the positions of all solutions. Therefore, the total computational complexity of the proposed SBOA can be expressed as \(O(N \times (T \times Dim + 1))\).
4 Analysis of experimental results
In this section, to assess the effectiveness of the proposed algorithm SBOA in optimization and providing optimal solutions, we conducted a series of experiments. First, we designed experiments to evaluate the convergence as well as exploration vs. exploitation capabilities of the algorithm. Secondly, we compared this algorithm with 14 other algorithms in the context of CEC-2017 and CEC-2022 to validate its performance. Finally, we subjected it to a rank-sum test to determine whether there were significant performance differences between the SBOA algorithm and the other algorithms. The algorithms are executed using a consistent system configuration, implemented on a desktop computer featuring an 13th Intel(R) Core (TM) i5-13400 (16 CPUs), ~ 2.5 GHz processor and 16 GB RAM. These experiments were conducted utilizing the MATLAB 2022b platform.
4.1 Qualitative analysis
In this section, the CEC-2017 test set is used to validate the SBOA in terms of exploration and exploitation balance and convergence behavior in 30 dimensions. The CEC-2017 test set functions are shown in Table 3.
4.1.1 Exploration and exploitation
Among metaheuristic algorithms, exploration and exploitation are considered two crucial factors. Exploration involves searching for new solutions in the solution space, aiming to discover better solutions in unknown regions. Exploitation, on the other hand, focuses on known solution spaces and conducts searches within the local neighborhoods of solutions to find potentially superior solutions. A well-balanced combination of exploration and exploitation not only helps the algorithm converge quickly to optimal solutions, enhancing search efficiency, but also allows for flexibility in addressing diverse optimization problems and complexities, showcasing exceptional adaptability and robustness (Morales-Castaneda et al. 2020). A high-quality algorithm should strike a good balance between these two factors. Therefore, we use Eqs. (17) and (18) to calculate the percentages of exploration and exploitation, respectively, allowing us to assess the algorithm’s balance between these two factors. \(Div(t)\) is a measure of dimension diversity calculated by Eq. (19). Here, \({x}_{id}\) represents the position of the \({i}^{th}\) represents the position of the \({d}^{th}\) dimension, and \({Div}_{max}\) denotes the maximum diversity throughout the entire iteration process.
Figure 6 intuitively illustrates the balance between exploration and exploitation in SBOA using the 30-dimensional CEC-2017 test functions. From the graph, it is evident that the intersection point of the exploration and exploitation ratio in the SBOA algorithm primarily occurs during the mid-iterations of the problem search process. In the initial stages, there is a comprehensive exploration of the global search space, gradually transitioning into the phase of local exploitation. It’s worth noting that the SBOA algorithm maintains a relatively high exploitation ratio in the later iterations across all functions, contributing to enhanced problem convergence speed and search precision. The SBOA algorithm maintains a dynamic equilibrium between exploration and exploitation throughout the iteration process. Therefore, SBOA exhibits outstanding advantages in avoiding local optima and premature convergence.

Balance between exploration and exploitation
4.1.2 Convergence behavior analysis
To validate the convergence characteristics of SBOA, we designed experiments to provide a detailed analysis of its convergence behavior. As shown in Fig. 7, the first column provides an intuitive representation of the two-dimensional search space of the test function, vividly showcasing the complex nature of the objective function. The second column offers a detailed view of the search trajectories of the agents. It is evident that majority of agents closely converge around the optimal solution and are distributed across the entire search space, demonstrating SBOA’s superior ability to avoid falling into local optima. The third column illustrates the changes in the average fitness values of the search agents. Initially, this value is relatively high, highlighting that intelligent agents are extensively exploring the search space. It then rapidly decreases, emphasizing that most search agents possess the inherent potential to find the optimal solution. The fourth column displays the search trajectories of individual agents, transitioning from initial fluctuations to stability, revealing a smooth shift from global exploration to local exploitation, facilitating the acquisition of the global optimum. The last column shows the convergence curves of SBOA. For unimodal functions, the curve continuously descends, indicating that with an increasing number of iterations, the algorithm gradually approaches the optimal solution. For multimodal functions, the curve exhibits a stepwise descent, signifying that SBOA can consistently escape local optima and eventually reach the global optimum.

The convergence behavior of SBOA
4.1.3 Search agent distribution analysis
To thoroughly analyze the optimization performance of SBOA, we conducted iterative experiments on the search history of algorithm search proxies. Figure 8 illustrates the historical distribution of search proxies and targets at different iteration counts when SBOA tackled partial functions of CEC2005. The red points represent the targets, while the black points represent the search proxies.

Search agent distribution with different iterations
From the graph, it can be observed that at iteration 1, most search proxies are distant from the target, with only a few scattered around it. In comparison, by iteration 100, search proxies are closer to the target, but some also cluster in other directions, indicating a convergence towards local optimal solutions and suggesting that SBOA temporarily falls into local optima, as seen in F1, F7, and F10. By iteration 300, certain functions (such as F1 and F9) break out of local optima, and search proxies start converging towards the global optimal solution. Compared to iteration 300, at iterations 400 and 500, search proxies are even closer to the target and clustered together. Moreover, more search proxies are distributed around the target, indicating that SBOA successfully escapes local optima and progresses towards the global optimal solution.
These results demonstrate that, although SBOA may temporarily fall into local optima in certain situations, with an increase in the number of iterations, it is capable of breaking out of local optima and gradually approaching and converging on the global optimal solution.
4.2 Quantitative analysis
4.2.1 Competing algorithms and parameter settings
In this section, to validate the effectiveness of SBOA, we conducted comparisons with 15 advanced algorithms on the CEC-2017 and CEC-2022 test functions. The compared algorithms fall into three categories: (1) High-performance algorithms: The winning algorithms of the CEC2017 competition, LSHADE_cnEpSin (Awad et al. 2017), and LSHADE_SPACMA (Mohamed et al. 2017), as well as the outstanding variant of the differential evolution algorithm, MadDE (Biswas et al. 2021). (2) Highly-Cited Algorithms: DE (Storn and Price 1997), Grey wolf optimizer (GWO) (Mirjalili et al. 2014), Whale optimization algorithm (WOA) (Mirjalili and Lewis 2016), CPSOGSA (Rather and Bala 2021) and African vultures optimization algorithm (AVOA) (Abdollahzadeh et al. 2021a); (3) advanced algorithms: snake optimizer (SO) (Hashim and Hussien 2022), Artificial gorilla troops optimizer (GTO) (Abdollahzadeh et al. 2021b), crayfish optimization algorithm (COA) (Jia et al. 2023), Rime optimization algorithm (RIME) (Su et al. 2023), Golden jackal optimization (GJO) (Chopra and Mohsin Ansari 2022), dung beetle optimizer (DBO) (Xue and Shen 2022) and nutcracker optimization algorithm (NOA) (Abdel-Basset et al. 2023b). The parameter settings for the compared algorithms are detailed in Table 2. We set the maximum number of iterations and population size for all algorithms to 500 and 30, respectively. Each algorithm is independently run 30 times, and the experimental results will be presented in the following text. The best results for each test function and its corresponding dimension are highlighted in bold.
4.2.2 CEC-2017 experimental results
In this section, for a more comprehensive assessment of SBOA’s performance, we conducted a comparative validation using the CEC-2017 test functions. As shown in Table 3, the CEC-2017 test functions are categorized into four types: unimodal functions, multimodal functions, hybrid functions, and composite functions. Unimodal functions have only one global optimum and no local optima, making them suitable for evaluating algorithm development performance. Multimodal test functions contain multiple local optima and are primarily used to assess the algorithm's ability to find the global optimum and escape from local optima. Hybrid functions and composite functions are employed to gauge the algorithm's capability in handling complex, continuous problems.
During the validation using the CEC2017 test suite, we conducted tests in dimensions of 30, 50, and 100. The results for different dimensions are presented in Tables 4, 56. The three symbols in the last row of the table (W|T|L) indicate the number of wins, draws and losses that SBOA has received compared to its competitors. Convergence curves for some of the functions can be observed in Figs. 9, 10, 11 and Box plots are shown in Figs. 13, 14, 15.

CEC-2017 test function convergence curve (Dim = 30)

CEC-2017 test function convergence curve (Dim = 50)

CEC-2017 test function convergence curve (Dim = 100)
Figure 12 displays the ranking of different algorithms across various dimensions. To better illustrate this, we employed radar charts to depict the ranking of different algorithms on the test set. From the figure, it is evident that the SBOA algorithm consistently maintains a leading position in dimensions of 30, 50, and 100. For 30-dimensional tests, SBOA achieved the best average ranking for 22 functions, the second-best for 3 functions, and the third-best for 4 functions. As the dimensionality increases, SBOA continues to deliver strong optimization results. In the 50-dimensional tests, SBOA maintains the best average ranking for 20 functions, the second-best for 6 functions, and the third-best for 1 functions. In the 100-dimensional tests, SBOA achieved the best average results for 20 test functions, the second-best for 5 functions. Notably, SBOA did not have the worst ranking in any of the three dimensions. Although it didn’t perform as ideally in functions F1, F2, F3, F6, F7 and F18 in the 100-dimensional tests, SBOA still delivered strong results, significantly outperforming most other algorithms in those cases.

CEC-2017 test function ranking statistics
From convergence plots in different dimensions, we observe that algorithms such as SO, GTO, DBO, and WOA often encounter local optima in the later stages of iteration and struggle to escape from them. In contrast, SBOA maintains strong exploration capabilities even in the later stages of iteration. Although, during certain periods in the subsequent iterations, functions F5, F8, F10, F12, F16, F20, and F22 briefly experience local optima, with an increase in the number of iterations, SBOA demonstrates the ability to break free from these local optima and continues to explore more deeply, ultimately achieving higher convergence accuracy. This suggests that the introduced differential evolution strategy, Brownian motion strategy, and Levy flight strategy are effective. These strategies not only help the algorithm escape local optima but also enhance the algorithm's convergence speed and accuracy.
Figures 13, 14, 15 present the results of 16 algorithms on three dimensions of the CEC2017 test set in the form of box plots. It is evident from the figures that the majority of SBOA box plots are the narrowest, indicating that SBOA exhibits higher robustness compared to other algorithms. Furthermore, the boxes are positioned near the optimal function values, suggesting that SBOA achieves higher precision in solving problems compared to other algorithms.

Boxplot of SBOA and competitor algorithms in optimization of the CEC-2017 test suite (Dim = 30)

Boxplot of SBOA and competitor algorithms in optimization of the CEC-2017 test suite (Dim = 50)

Boxplot of SBOA and competitor algorithms in optimization of the CEC-2017 test suite (Dim = 100)
4.2.3 CEC-2022 experimental results
To assess the scalability of SBOA, in this section, we compare it with the 15 benchmark algorithms using the CEC-2022 test functions in both 10 and 20 dimensions. Similar to the CEC-2017 test functions, the CEC-2022 test functions consist of unimodal functions, multimodal functions, hybrid functions, and composite functions (Luo et al. 2022). The specific details can be found in Table 7.
The test results for SBOA and the 15 other algorithms on the CEC-2022 test suite are presented in Tables 8 and 9, and the convergence curves can be seen in Figs. 16 and 17. And Box plots are shown in Figs. 19 and 20.The results indicate that SBOA outperforms the other algorithms in 6 out of the functions in the 10-dimensional and 20-dimensional CEC-2022 test set. To clearly illustrate the comparative ranking of SBOA against other algorithms, a stacked ranking chart is presented in Fig. 18. Rankings are divided into five categories: average best ranking, average second-best ranking, average third-best ranking, average worst ranking, and other rankings. From the chart, it is evident that SBOA does not have the worst ranking in any of the test functions, demonstrating its strong scalability and effectiveness. When considering the overall ranking, SBOA ranks the highest among the 15 algorithms and significantly outperforms the others. Figure 17 displays the convergence curves of SBOA and the 15 benchmark algorithms. From the figure, we can observe that SBOA exhibits higher convergence speed and accuracy compared to the other algorithms. The results indicate that our proposed SBOA demonstrates faster convergence speed and higher convergence accuracy compared to the other 15 algorithms. As depicted in Figs. 19 and 20, SBOA exhibits superior robustness relative to the other 15 algorithms.

CEC-2022 test function convergence curve (Dim = 10)

CEC-2022 test function convergence curve (Dim = 20)

CEC-2022 test function ranking statistics

Boxplot of SBOA and competitor algorithms in optimization of the CEC-2022 test suite (Dim = 10)

Boxplot of SBOA and competitor algorithms in optimization of the CEC-2022 test suite (Dim = 20)
4.3 Statistical test
In this section, we analyze the experimental results using Wilcoxon test and Friedman test to statistically analyze the differences between SBOA and other comparison algorithms.
4.3.1 Wilcoxon rank sum test
To comprehensively demonstrate the superiority of the proposed algorithm, in this section, we will use the Wilcoxon rank-sum test to assess whether the results of each run of SBOA significantly differ from other algorithms at a significance level of \({\text{P}} = 5\%\) (Dao 2022). The null hypothesis, denoted as H0, states that there is no significant difference between the two algorithms. If \({\text{P}} < 5\%\), we reject the null hypothesis, indicating a significant difference between the two algorithms. If \({\text{P}} > 5\%\), we accept the null hypothesis, suggesting that there is no significant difference, meaning the algorithms perform similarly. The “\(NaN\)” value indicates that the performance between the two is similar and cannot be compared. Tables 10, 11, 12 respectively present the test results of SBOA and the comparison algorithms in CEC-2017 for dimensions 30, 50, and 100. The results for CEC-2022 can be found in Tables 13, 14. To highlight the comparison results, values exceeding 0.05 will be bolded.
The absence of “NaN” values in CEC-2017 and the minimal presence of “NaN” values in CEC-2022 test functions suggest that SBOA’s optimization results are generally dissimilar to those of the other algorithms. Furthermore, as seen in the tables, it can be observed that DE does not have prominently highlighted data in the CEC-2017 results, and other comparative algorithms have few data points highlighted in bold, particularly in the 100-dimensional data for 2017 test functions. Thus, SBOA shows significant differences from DE and other compared metaheuristic algorithms.
In conclusion, based on the analysis results presented in Sects. 4.1 and 4.2, it is evident that SBOA exhibits the best overall performance among various metaheuristic algorithms. This underscores the effectiveness of the strategies employed in SBOA, such as the differential evolution strategy, Levy flight strategy, dynamic perturbation factor, and other associated components. These findings highlight the competitive advantage of SBOA in solving optimization problems across a range of dimensions and test functions.
4.3.2 Friedmann’s test
By employing the non-parametric Friedman average rank test to rank the experimental results of the SBOA algorithm and other algorithms on the CEC-2017 and CEC-2022 test sets, we obtained the rankings presented in Table 15. Clearly, SBOA consistently ranks first, indicating that our proposed optimizer outperforms the other benchmark algorithms on the considered test sets.
5 Application of SBOA
5.1 SBOA is used for real-world engineering optimization problems
After conducting the experiments and analysis in the fourth section, we have confirmed that SBOA exhibits superior optimization performance in testing functions. However, the primary objective of metaheuristic algorithms is to address real-world problems. Therefore, in this section, we will further validate the effectiveness and applicability of SBOA through its application to practical problems. To assess the practical applicability and scalability of the proposed algorithm, we applied it to twelve typical real engineering problems (Kumar et al. 2020a; b). These problems encompass: three-bar truss design (TBTD), pressure vessel design (PVD), tension/compression spring design (TCPD (case 1)), welded beam design (WBD), weight minimization of speed reducer design (WMSRD), rolling element bearing design (REBD), gear train design (GTD), hydrostatic thrust bearing design (HSTBD), single cone pulley design (SCPD), gas transmission compressor design (GTCD), planetary gear train design (PGTD) and four-stage gear box design (F-sGBD). Furthermore, to demonstrate the superiority of SBOA, we compared its results with the optimization results obtained from fifteen state-of-the-art algorithms mentioned earlier in this study.
5.1.1 Three-bar truss design (TBTD)
The Three-Bar Truss Design problem originates from the field of civil engineering. Its objective is to minimize the overall structure weight by controlling two parameter variables. The structure is depicted in Fig. 21, and its mathematical model is described by Eq. (20).
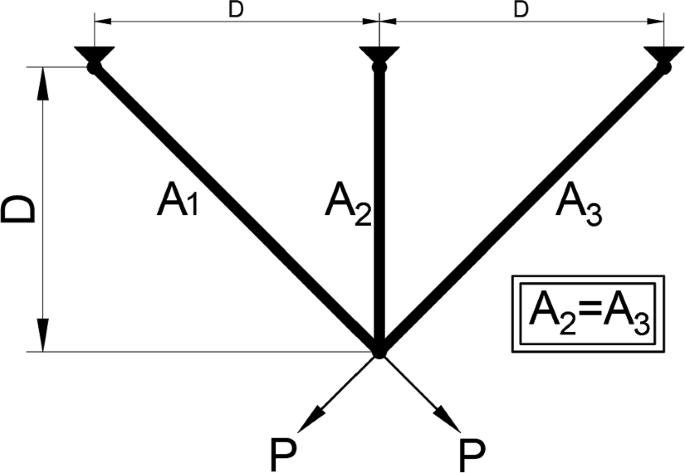
Three-bar truss design structure
Table shows the optimization results of SBOA and 11 other different contrasts for the three-bar truss design problem. As seen in the table, SBOA, LSHADE_cnEpSin, LSHADE_SPACMA, MadDE and GTO simultaneously achieve an optimal cost of 2.64E + 02 and produce different solutions (Table 16).
5.1.2 Pressure vessel design (PVD)
The Pressure Vessel Design problem features a structure as shown in Fig. 22. The design objective is to minimize costs while meeting usage requirements. Four optimization parameters include the vessel thickness\(( {T}_{s})\), head thickness\(( {T}_{h})\), inner radius\((R)\), and head length\((L)\). Equation (21) provides its mathematical model.
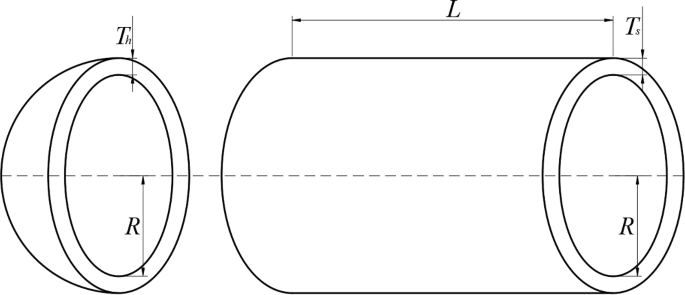
Pressure vessel design structure
From the results in Table 17, it is evident that SBOA, LSHADE_cnEpSin, MadDE and NOA outperforms all other competitors, achieving a minimum cost of 5.89E + 03.
5.1.3 Tension/compression spring design (TCPD (case 1))
This design problem aims to minimize the weight of tension/compression springs by optimizing three critical parameters: wire diameter\((d)\), coil diameter\((D)\), and the number of coils\((N)\). The structure of this engineering problem is illustrated in Fig. 23, with the mathematical model is presented in Eq. (22).
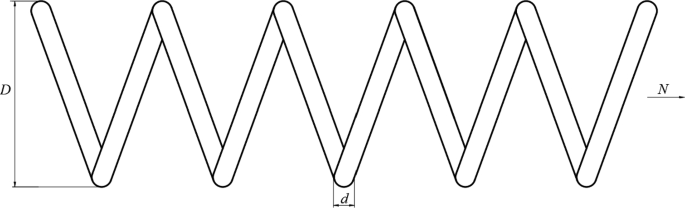
Tension/compression spring design structure
Table presents the optimization results of SBOA compared to fourteen different competing algorithms for the tension/compression spring design problem. It is evident from the table that SBOA outperforms the other algorithms, achieving the optimal value of 1.27E – 02 (Table 18).
5.1.4 Welded beam design (WBD)
Welded beam design represents a typical nonlinear programming problem, aiming to minimize the manufacturing cost of a welded beam by controlling parameters such as beam thickness\((h)\), length\((l)\), height\((t)\), width\((b)\), and weld size. The structure of the optimization problem is depicted in Fig. 24, and its mathematical model is described by Eq. (23).

Welding beam design structure
The optimization results for the Welded Beam Design problem are presented in Table 19. As per the test results, SBOA achieves the lowest economic cost after optimization.
5.1.5 Weight minimization of speed reducer design (WMSRD)
This problem originates from the gearbox of a small aircraft engine, aiming to find the minimum gearbox weight subject to certain constraints. The weight minimization design of the gearbox involves seven variables, which include: gear width (\({x}_{1}\)), number of teeth (\({x}_{2}\)), number of teeth on the pinion (\({x}_{3}\)), length between bearings for the first shaft (\({x}_{4}\)), length between bearings for the second shaft (\({x}_{5}\)), diameter of the first shaft (\({x}_{6}\)), and diameter of the second shaft (\({x}_{7}\)). The mathematical model for this problem is represented by Eq. (24).
The experimental results, as shown in Table 20, we can observe that SBOA achieves the best optimization results, obtaining an optimal result of 2.99E + 03.
5.1.6 Rolling element bearing design (REBD)
The design of rolling bearings presents complex nonlinear challenges. The bearing’s capacity to support loads is constrained by ten parameters, encompassing five design variables: pitch circle diameter \(({D}_{m})\), ball diameter \(({D}_{b})\), curvature coefficients of the outer and inner races (\({f}_{o}\) and \({f}_{i}\)), and the total number of balls \((Z)\). The remaining five design parameters, including \(e\), \(\epsilon\), \(\zeta\), \({KD}_{max}\), and \({KD}_{min}\), are used solely in the constraint conditions. The structure of the optimization problem for rolling bearings is illustrated in Fig. 25. The mathematical model for this problem can be represented by Eq. (25).
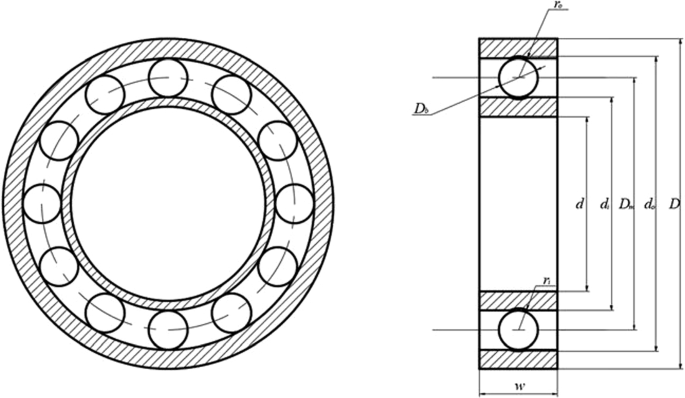
Rolling bearing design structure
Table displays the optimization results for the rolling bearing design problem using different comparative algorithms. It is evident that SBOA, LSHADE_cnEpSin, LSHADE_SPACMA, SO and DBO simultaneously achieve optimal results, yielding the best lowest of 1.70E + 04 while generating different solutions (Table 21).
5.1.7 Gear train design (GTD)
The gear train design problem is a practical issue in the field of mechanical engineering. The objective is to minimize the ratio of output to input angular velocity of the gear train by designing relevant gear parameters. Figure 26 illustrates the structure of the optimization problem, and Eq. (26) describes the mathematical model for the optimization problem.
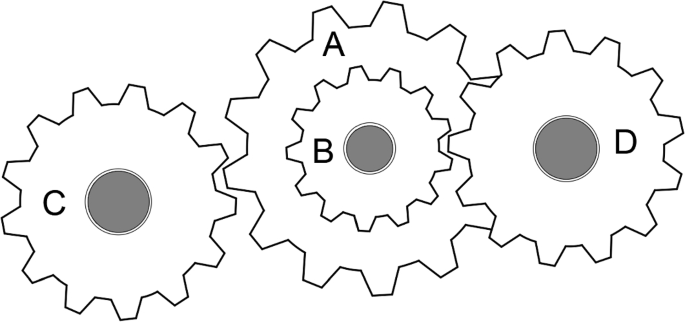
Gear train design structure
From Table 22, it is evident that the parameters optimized by SBOA, AVOA, WOA, GTO and NOA result in the minimum cost for gear train design, achieving a cost of 0.00E + 00.
5.1.8 Hydrostatic thrust bearing design (HSTBD)
The main objective of this design problem is to optimize bearing power loss using four design variables. These design variables are oil viscosity \((\mu )\), bearing radius \((R)\), flow rate \(({R}_{0}\)), and groove radius \((Q)\). This problem includes seven nonlinear constraints related to inlet oil pressure, load capacity, oil film thickness, and inlet oil pressure. The mathematical model for this problem is represented by Eq. (27).
From Table 23, it is evident that the parameters optimized by SBOA result in the minimum cost for the hydrostatic thrust bearing design.
5.1.9 Single cone pulley design (SCPD)
The primary objective of the walking conical pulley design is to minimize the weight of the four-stage conical pulley by optimizing five variables. The first four parameters represent the diameter of each stage of the pulley, and the last variable represents the pulley's width. The mathematical model for this problem is described by Eq. (28).
From Table 24, it is evident that the parameters optimized by SBOA result in the lowest cost for the walking conical pulley design, amounting to 8.18E + 00.
5.1.10 Gas transmission compressor design (GTCD)
The mathematical model for the gas transmission compressor design problem is represented by Eq. (29).
Table shows that SBOA, LSHADE_cnEpSin and NOA all simultaneously achieve the best result, which is 2.96E + 06, while producing different solutions (Table 25).
5.1.11 Planetary gear train design (PGTD)
The primary objective of this problem is to minimize the error in the gear ratio by optimizing the parameters. To achieve this, the total number of gears in the automatic planetary transmission system is calculated. It involves six variables, and the mathematical model is represented by Eq. (30):
Table displays the optimization results for the Planetary Gear Train design. The results indicate that SBOA ultimately achieves the minimum error, with an optimal value of 5.23E – 01 (Table 26).
5.1.12 Four-stage gear box design (F-sGBD)
The Four-stage Gear Box problem is relatively complex compared to other engineering problems, involving 22 variables for optimization. These variables include the positions of gears, positions of small gears, blank thickness, and the number of teeth, among others. The problem comprises 86 nonlinear design constraints related to pitch, kinematics, contact ratio, gear strength, gear assembly, and gear dimensions. The objective is to minimize the weight of the gearbox. The mathematical model is represented by Eq. (31).
From Table 27, it is evident that the optimization performance of SBOA is significantly superior to that of other algorithms. Moreover, it achieves an optimal result of 5.01E + 01.
In Sects. 5.1.1–5.1.12, we conducted a comparative validation of the secretary bird optimization algorithm (SBOA) against fourteen other advanced algorithms across twelve real engineering problems. To highlight the comparative performance, we used radar charts to illustrate the ranking of each algorithm in different engineering problems, as shown in Fig. 27. Smaller areas in the algorithm regions indicate better performance across the twelve engineering problems. From the graph, it is evident that SBOA achieved the optimal solution in each engineering problem, clearly indicating not only its outstanding performance but also its high level of stability in solving real-world problems. The experiments in this section provide substantial evidence of the broad applicability and scalability of the SBOA method, establishing a solid foundation for its use in practical engineering applications.

Comparison chart of the ranking of engineering problems
5.2 3D Trajectory planning for UAVs
Unmanned aerial vehicles (UAVs) play a vital role in various civil and military applications, and their importance and convenience are widely recognized. As a core task of the autonomous control system for UAVs, path planning and design aim to solve a complex constrained optimization problem: finding a reliable and safe path from a starting point to a goal point under certain constraints. In recent years, with the widespread application of UAVs, research on the path planning problem has garnered considerable attention. Therefore, we employ SBOA to address the UAV path planning problem and verify the algorithm’s effectiveness. A specific mathematical model for this problem is outlined as follows.
5.2.1 SBOA is used to UAV 3D path planning modeling
In mountainous environments, the flight trajectory of unmanned aerial vehicles (UAVs) is primarily influenced by factors such as high mountain peaks, adverse weather conditions, and restricted airspace areas. Typically, UAVs navigate around these regions for safety reasons during their flights. This paper focuses on the trajectory planning problem for UAVs in mountainous terrain, taking into consideration factors like high mountain peaks, weather threats, and no-fly zones, and establishes a trajectory planning model. Figure 28 illustrates the simulation environment model. The mathematical model for the ground and obstacle representation can be expressed by Eq. (32).

Mountain Environment Simulation
During the flight of unmanned aerial vehicles (UAV), certain trajectory constraints need to be satisfied. These constraints primarily include trajectory length, maximum turning angle, and flight altitude, among others.
(1) Trajectory Length: In general, the flight of unmanned aerial vehicles (UAV) aims to minimize time and reduce costs while ensuring safety. Therefore, the path length in path planning is crucial. The mathematical model is described by Eq. (33).
The equation where \(({x}_{i},{y}_{i},{z}_{i})\) represents the \({i}^{th}\) waypoint along the planned path of the unmanned aerial vehicle.
Flight Altitude: The flight altitude of the unmanned aerial vehicle significantly affects the control system and safety. The mathematical model for this constraint is shown in Eq. (34).
Maximum Turning Angle: The turning angle of the unmanned aerial vehicle must be within a specified maximum turning angle. The constraint for the maximum turning angle can be expressed as:
where, \({\mathrm{\varphi }}_{i}\) is the turning angle when moving from \({(x}_{i+1}-{x}_{i},{y}_{i+1}-{y}_{i},{z}_{i+1}{-z}_{i})\), and φ represents the maximum turning angle.
To evaluate the planned trajectory, it is common to consider multiple factors, including the maneuverability of the UAV, trajectory length, altitude above ground, and the magnitude of threats from various sources. Based on a comprehensive analysis of the impact of these factors, the trajectory cost function is calculated using the formula shown in Eq. (36) to assess the trajectory.
where, \(L\) and \(H\) are the length and altitude above ground of the trajectory, respectively; \(S\) is the smoothing cost of the planned path; \({\omega }_{1}\), \({\omega }_{2}\) and \({\omega }_{3}\) are weight coefficients satisfying \({\omega }_{1}+{\omega }_{2}+{\omega }_{3}=1\). By adjusting these weight coefficients, the influence of each factor on the trajectory can be modulated.
5.2.2 Example of 3D path planning for UAV
To validate the effectiveness of the proposed spatial-branch optimization algorithm (SBOA) in three-dimensional trajectory planning for unmanned aerial vehicles (UAVs), this study conducted a verification in a simulation environment. The UAV’s maximum flight altitude (\({H}_{max})\) was set to 50 m, with a flight speed of 20 m/s and a maximum turn angle \((\varphi )\) of 60°. The spatial region for UAV flight in the environment was defined as a three-dimensional space with dimensions of 200 m in length, 200 m in width, and 100 m in height. The UAV’s starting point was set at coordinates (0, 0, 20), and the destination point was set at (200, 200, 30). While utilizing the SBOA proposed in this study for environmental trajectory planning, a comparative analysis was performed with 15 other algorithms. The population size for all methods was set to 50, with a maximum iteration count of 500. To eliminate randomness in computational results, each algorithm was independently run 30 times under the same environmental configuration.
The statistical results are presented in Table 28, where “Best” represents the optimal path length, “Ave” indicates the average path length, “Worst” represents the worst path length, “Std” denotes the standard deviation, and “Rank” signifies the ranking based on the average path length. Figure 29 illustrates the search iteration curve for obtaining the optimal fitness value, while Fig. 30 provides 3D and 2D schematic diagrams for the optimal range obtained by the 16 different methods.

Optimal fitness search iteration curve

Flight tracks optimized by algorithms
From Table 28, it can be observed that, in terms of both the optimal fitness value and the average fitness value, the SBOA method proposed in this paper yields the smallest fitness value, while CPSOGSA produces the largest. Additionally, the average fitness value of SBOA is even smaller than the optimal fitness values of the other 15 methods, indicating higher computational precision for SBOA. In terms of standard deviation, SBOA has the smallest value, suggesting stronger computational stability compared to the other 15 methods.
The search iteration curve in Fig. 29 also supports the conclusions drawn from Table 28. Specifically, compared to methods such as GTO, CPSOGSA, LSHADE_cnEpSin, and others, SBOA exhibits a faster convergence rate and higher convergence accuracy. As evident in Fig. 29, the trajectories planned by the 16 methods effectively avoid threat areas, demonstrating the feasibility of the generated trajectories. In Fig. 30b, the trajectory obtained by SBOA is the shortest and relatively smoother, while DBO’s trajectory is the worst, requiring ascent to a certain height and navigating a certain distance to avoid threat areas. The results indicate that SBOA can effectively enhance the efficiency of trajectory planning, demonstrating a certain advantage.
6 Summary and outlook
This article introduces a new bio-inspired optimization algorithm named the secretary bird optimization algorithm (SBOA), which aims to simulate the behavior of secretary birds in nature. The hunting strategy of secretary birds in capturing snakes and their mechanisms for evading predators have been incorporated as fundamental inspirations in the design of SBOA. The implementation of SBOA is divided into two phases: a simulated exploration phase based on the hunting strategy and a simulated exploitation phase based on the evasion strategy, both of which are mathematically modeled. To validate the effectiveness of SBOA, we conducted a comparative analysis of exploration versus exploitation and convergence behavior. The analysis results demonstrate that SBOA exhibits outstanding performance in balancing exploration and exploitation, convergence speed, and convergence accuracy.
To evaluate the performance of SBOA, experiments were conducted using the CEC-2017 and CEC-2022 benchmark functions. The results demonstrate that, both in different dimensions of CEC-2017 and on CEC-2022 test functions, SBOA consistently ranks first in terms of average values and function average rankings. Notably, even in high-dimensional problems of CEC-2017, SBOA maintains its strong problem-solving capabilities, obtaining the best results in 20 out of 30 test functions. Furthermore, to assess the algorithm's ability to solve real-world problems, it was applied to twelve classical engineering practical problems and a three-dimensional path planning problem for Unmanned Aerial Vehicles (UAVs). In comparison to other benchmark algorithms, SBOA consistently obtained the best results. This indicates that SBOA maintains strong optimization capabilities when dealing with constrained engineering problems and practical optimization problems and outperforms other algorithms in these scenarios, providing optimal optimization results. In summary, the proposed SBOA demonstrates excellent performance in both unconstrained and constrained problems, showcasing its robustness and wide applicability.
In future research, there are many aspects that require continuous innovation. We intend to optimize SBOA from the following perspectives:
-
1.
Algorithm Fusion and Collaborative Optimization: Integrating SBOA with other metaheuristic algorithms to collaboratively optimize them, leveraging the strengths of each algorithm, and further enhancing the accuracy and robustness of problem-solving.
-
2.
Adaptive and Self-Learning Algorithms: Enhancing SBOA's adaptability and self-learning capabilities by incorporating techniques such as machine learning and deep learning. This allows SBOA to adapt to changes in different problem scenarios and environments. It enables SBOA to learn from data and adjust its parameters and strategies autonomously, thus improving its solving effectiveness and adaptability.
-
3.
Multi-Objective and Constraint Optimization: As real-world problems become increasingly complex, multi-objective and constraint optimization problems are gaining importance. In future research, we will place greater emphasis on enhancing SBOA's capability to address multi-objective problems, providing more comprehensive solutions for optimization challenges.
-
4.
Expanding Application Domains: The initial design of metaheuristic algorithms was intended to address real-life problems. Therefore, we will further expand the application domains of SBOA to make it applicable in a wider range of fields. This includes document classification and data mining, circuit fault diagnosis, wireless sensor networks, and 3D reconstruction, among others.
Data availability
All data generated or analyzed in this study are included in this paper.
References
Abdel-Basset M, El-Shahat D, Jameel M, Abouhawwash M (2023a) Exponential distribution optimizer (EDO): a novel math-inspired algorithm for global optimization and engineering problems. Artif Intell Rev 56:9329–9400. https://doi.org/10.1007/s10462-023-10403-9
Abdel-Basset M, Mohamed R, Abouhawwash M (2024) Crested porcupine optimizer: a new nature-inspired metaheuristic. Knowl-Based Syst 284:111257. https://doi.org/10.1016/j.knosys.2023.111257
Abdel-Basset M, Mohamed R, Jameel M, Abouhawwash M (2023b) Nutcracker optimizer: a novel nature-inspired metaheuristic algorithm for global optimization and engineering design problems. Knowl-Based Syst 262:110248. https://doi.org/10.1016/j.knosys.2022.110248
Abdel-Basset M, Mohamed R, Jameel M, Abouhawwash M (2023c) Spider wasp optimizer: a novel meta-heuristic optimization algorithm. Artif Intell Rev 56:11675–11738. https://doi.org/10.1007/s10462-023-10446-y
Abdollahzadeh B, Gharehchopogh FS, Mirjalili S (2021a) African vultures optimization algorithm: a new nature-inspired metaheuristic algorithm for global optimization problems. Comput Ind Eng. https://doi.org/10.1016/j.cie.2021.107408
Abdollahzadeh B, Gharehchopogh FS, Mirjalili S (2021b) Artificial gorilla troops optimizer: a new nature-inspired metaheuristic algorithm for global optimization problems. Int J Intell Syst 36:5887–5958. https://doi.org/10.1002/int.22535
Abualigah L, Yousri D, Abd Elaziz M, Ewees AA, Al-qaness MAA, Gandomi AH (2021) Aquila optimizer: a novel meta-heuristic optimization algorithm. Comput Ind Eng. https://doi.org/10.1016/j.cie.2021.107250
Agrawal P, Abutarboush HF, Ganesh T, Mohamed AW (2021) Metaheuristic algorithms on feature selection: a survey of one decade of research (2009–2019). IEEE ACCESS 9:26766–26791. https://doi.org/10.1109/ACCESS.2021.3056407
Ahmadi B, Giraldo JS, Hoogsteen G (2023) Dynamic Hunting Leadership optimization: algorithm and applications. J Comput Sci 69:102010. https://doi.org/10.1016/j.jocs.2023.102010
Angeline PJ (1994) Genetic programming: on the programming of computers by means of natural selection. In: Koza JR (ed) A bradford book. MIT Press, Cambridge
Asselmeyer T, Ebeling W, Rosé H (1997) Evolutionary strategies of optimization. Phys Rev E 56:1171
Attiya I, Abd Elaziz M, Abualigah L, Nguyen TN, Abd El-Latif AA (2022) An improved hybrid swarm intelligence for scheduling IoT application tasks in the cloud. IEEE Trans Ind Inf 18:6264–6272. https://doi.org/10.1109/TII.2022.3148288
Awad NH, Ali MZ, Suganthan PN (2017) Ensemble sinusoidal differential covariance matrix adaptation with Euclidean neighborhood for solving CEC2017 benchmark problems. In: 2017 IEEE congress on evolutionary computation (CEC), pp 372–379
Bai J, Li Y, Zheng M, Khatir S, Benaissa B, Abualigah L, Abdel Wahab M (2023) A Sinh Cosh optimizer. Knowl-Based Syst 282:111081. https://doi.org/10.1016/j.knosys.2023.111081
Biswas S, Saha D, De S, Cobb AD, Das S, Jalaian BA (2021) Improving differential evolution through bayesian hyperparameter optimization. In: 2021 IEEE congress on evolutionary computation (CEC), pp 832–840
Braik M, Hammouri A, Atwan J, Al-Betar MA, Awadallah MA (2022) White shark optimizer: a novel bio-inspired meta-heuristic algorithm for global optimization problems. Knowl-Based Syst 243:108457. https://doi.org/10.1016/j.knosys.2022.108457
Braik MS (2021) Chameleon swarm algorithm: a bio-inspired optimizer for solving engineering design problems. Exp Syst Appl. https://doi.org/10.1016/j.eswa.2021.114685
Chakraborty P, Nama S, Saha AK (2023) A hybrid slime mould algorithm for global optimization. Multimed Tool Appl 82:22441–22467. https://doi.org/10.1007/s11042-022-14077-3
Chakraborty S, Nama S, Saha AK (2022a) An improved symbiotic organisms search algorithm for higher dimensional optimization problems. Knowl-Based Syst 236:107779. https://doi.org/10.1016/j.knosys.2021.107779
Chakraborty S, Nama S, Saha AK, Mirjalili S (2022b) A modified moth-flame optimization algorithm for image segmentation. In: Mirjalili S (ed) Handbook of moth-flame optimization algorithm: variants, hybrids, improvements, and applications. CRC Press, Boca Raton, pp 111–128
Chen B, Chen H, Li M (2021) Improvement and optimization of feature selection algorithm in swarm intelligence algorithm based on complexity. Complexity. https://doi.org/10.1155/2021/9985185
Cheng MY, Sholeh MN (2023) Optical microscope algorithm: a new metaheuristic inspired by microscope magnification for solving engineering optimization problems. Knowl-Based Syst 279:110939. https://doi.org/10.1016/j.knosys.2023.110939
Chopra N, Mohsin Ansari M (2022) Golden jackal optimization: a novel nature-inspired optimizer for engineering applications. Expert Syst Appl 198:116924. https://doi.org/10.1016/j.eswa.2022.116924
Choura A, Hellara H, Baklouti M, Kanoun O, IEEE (2021) Comparative study of different salp swarm algorithm improvements for feature selection applications. In: 14th international workshop on impedance spectroscopy (IWIS). Chemnitz, Germany, pp 146–149
Dao PB (2022) On Wilcoxon rank sum test for condition monitoring and fault detection of wind turbines. Appl Energy 318:119209
Das B, Mukherjee V, Das D (2020) Student psychology based optimization algorithm: a new population based optimization algorithm for solving optimization problems. Adv Eng Softw 146:102804. https://doi.org/10.1016/j.advengsoft.2020.102804
De Swardt DH (2011) Late-summer breeding record for Secretarybirds Sagittarius serpentarius in the free state. Gabar 22:31–33
Dehghani M, Hubalovsky S, Trojovsky P (2021) Northern goshawk optimization: a new swarm-based algorithm for solving optimization problems. IEEE Access 9:162059–162080. https://doi.org/10.1109/access.2021.3133286
Deng L, Liu S (2023) Snow ablation optimizer: a novel metaheuristic technique for numerical optimization and engineering design. Expert Syst Appl 225:120069
Dhiman G, Garg M, Nagar A, Kumar V, Dehghani M (2021) A novel algorithm for global optimization: rat swarm optimizer. J Ambient Intell Humaniz Comput 12:8457–8482. https://doi.org/10.1007/s12652-020-02580-0
Dorigo M, Birattari M, Stützle T (2006) Ant colony optimization. Comput Intell Mag 1:28–39. https://doi.org/10.1109/MCI.2006.329691
Erol OK, Eksin I (2006) A new optimization method: big bang–big crunch. Adv Eng Softw 37:106–111
Eskandar H, Sadollah A, Bahreininejad A, Hamdi M (2012) Water cycle algorithm—a novel metaheuristic optimization method for solving constrained engineering optimization problems. Comput Struct 110:151–166. https://doi.org/10.1016/j.compstruc.2012.07.010
Faramarzi A, Heidarinejad M, Mirjalili S, Gandomi AH (2020a) Marine predators algorithm: a nature-inspired metaheuristic. Exp Syst Appl. https://doi.org/10.1016/j.eswa.2020.113377
Faramarzi A, Heidarinejad M, Stephens B, Mirjalili S (2020b) Equilibrium optimizer: a novel optimization algorithm. Knowl-Based Syst. https://doi.org/10.1016/j.knosys.2019.105190
Fatahi A, Nadimi-Shahraki MH, Zamani H (2023) An improved binary quantum-based avian navigation optimizer algorithm to select effective feature subset from medical data: a COVID-19 case study. J Bionic Eng. https://doi.org/10.1007/s42235-023-00433-y
Feduccia A, Voorhies MR (1989) Miocene hawk converges on secretarybird. Ibis 131:349–354
Goodarzimehr V, Shojaee S, Hamzehei-Javaran S, Talatahari S (2022) Special relativity search: a novel metaheuristic method based on special relativity physics. Knowl-Based Syst 257:109484. https://doi.org/10.1016/j.knosys.2022.109484
Guan Z, Ren C, Niu J, Wang P, Shang Y (2023) Great wall construction algorithm: a novel meta-heuristic algorithm for engineer problems. Expert Syst Appl 233:120905. https://doi.org/10.1016/j.eswa.2023.120905
Hashim FA, Houssein EH, Hussain K, Mabrouk MS, Al-Atabany W (2022) Honey badger algorithm: new metaheuristic algorithm for solving optimization problems. Math Comput Simul 192:84–110. https://doi.org/10.1016/j.matcom.2021.08.013
Hashim FA, Hussien AG (2022) Snake optimizer: a novel meta-heuristic optimization algorithm. Knowl-Based Syst. https://doi.org/10.1016/j.knosys.2022.108320
Hofmeyr SD, Symes CT, Underhill LG (2014) Secretarybird Sagittarius serpentarius population trends and ecology: insights from South African citizen science data. PLoS ONE 9:e96772
Holland JH (1992) Genetic algorithms. Sci Am 267:66–73
Hu G, Guo Y, Wei G, Abualigah L (2023) Genghis Khan shark optimizer: a novel nature-inspired algorithm for engineering optimization. Adv Eng Inform 58:102210. https://doi.org/10.1016/j.aei.2023.102210
Jia H, Rao H, Wen C, Mirjalili S (2023) Crayfish optimization algorithm. Artif Intell Rev 56:1919–1979. https://doi.org/10.1007/s10462-023-10567-4
Kaur S, Awasthi LK, Sangal AL, Dhiman G (2020) Tunicate swarm algorithm: a new bio-inspired based metaheuristic paradigm for global optimization. Eng Appl Artif Intell 90:103541. https://doi.org/10.1016/j.engappai.2020.103541
Kaveh A, Khayatazad M (2012) A new meta-heuristic method: ray optimization. Comput Struct 112:283–294. https://doi.org/10.1016/j.compstruc.2012.09.003
Kennedy J, Eberhart R (1995) Particle swarm optimization. In: Proceedings of ICNN'95—international conference on neural networks, pp 1942–1948
Khishe M, Mosavi MR (2020) Chimp optimization algorithm. Exp Syst Appl. https://doi.org/10.1016/j.eswa.2020.113338
Kirkpatrick S, Gelatt CD, Vecchi MP (1983) Optimization by simulated annealing. Science 220:671–680. https://doi.org/10.1126/science.220.4598.671
Kumar A, Wu G, Ali MZ, Mallipeddi R, Suganthan PN, Das S (2020a) Guidelines for real-world single-objective constrained optimisation competition. Tech Rep 2020:1–7
Kumar A, Wu G, Ali MZ, Mallipeddi R, Suganthan PN, Das S (2020b) A test-suite of non-convex constrained optimization problems from the real-world and some baseline results. Swarm Evol Comput 56:100693
Kumar M, Kulkarni AJ, Satapathy SC (2018) Socio evolution & learning optimization algorithm: a socio-inspired optimization methodology. Future Gener Comput Syst Int J Sci 81:252–272. https://doi.org/10.1016/j.future.2017.10.052
Li S, Chen H, Wang M, Heidari AA, Mirjalili S (2020) Slime mould algorithm: a new method for stochastic optimization. Future Gener Comput Syst Int J Sci 111:300–323. https://doi.org/10.1016/j.future.2020.03.055
Lian J, Hui G (2024) Human evolutionary optimization algorithm. Exp Syst Appl 241:122638. https://doi.org/10.1016/j.eswa.2023.122638
Liu C, IEEE (2014) The development trend of evaluating face-recognition technology. In: International conference on mechatronics and control (ICMC), Jinzhou, pp 1540–1544
Liu SH, Mernik M, Hrncic D, Crepinsek M (2013) A parameter control method of evolutionary algorithms using exploration and exploitation measures with a practical application for fitting Sovova’s mass transfer model. Appl Soft Comput 13:3792–3805. https://doi.org/10.1016/j.asoc.2013.05.010
Luo W, Lin X, Li C, Yang S, Shi Y (2022) Benchmark functions for CEC 2022 competition on seeking multiple optima in dynamic environments. Preprint at https://arxiv.org/abs/2201.00523
Mahdavi-Meymand A, Zounemat-Kermani M (2022) Homonuclear molecules optimization (HMO) meta-heuristic algorithm. Knowl-Based Syst 258:110032. https://doi.org/10.1016/j.knosys.2022.110032
Manjarres D, Landa-Torres I, Gil-Lopez S, Del Ser J, Bilbao MN, Salcedo-Sanz S, Geem ZW (2013) A survey on applications of the harmony search algorithm. Eng Appl Artif Intell 26:1818–1831
Mirjalili S, Gandomi AH, Mirjalili SZ, Saremi S, Faris H, Mirjalili SM (2017) Salp swarm algorithm: a bio-inspired optimizer for engineering design problems. Adv Eng Softw 114:163–191. https://doi.org/10.1016/j.advengsoft.2017.07.002
Mirjalili S, Lewis A (2016) The whale optimization algorithm. Adv Eng Softw 95:51–67. https://doi.org/10.1016/j.advengsoft.2016.01.008
Mirjalili S, Mirjalili SM, Hatamlou A (2016) Multi-verse optimizer: a nature-inspired algorithm for global optimization. Neural Comput Appl 27:495–513. https://doi.org/10.1007/s00521-015-1870-7
Mirjalili S, Mirjalili SM, Lewis A (2014) Grey wolf optimizer. Adv Eng Softw 69:46–61. https://doi.org/10.1016/j.advengsoft.2013.12.007
Mohamed AW, Hadi AA, Fattouh AM, Jambi KM (2017) LSHADE with semi-parameter adaptation hybrid with CMA-ES for solving CEC 2017 benchmark problems. In: 2017 IEEE congress on evolutionary computation (CEC), pp 145–152.
Mohammed H, Rashid T (2023) FOX: a FOX-inspired optimization algorithm. Appl Intell 53:1030–1050
Moosavian N, Roodsari BK (2014) Soccer league competition algorithm: a novel meta-heuristic algorithm for optimal design of water distribution networks. Swarm Evol Comput 17:14–24. https://doi.org/10.1016/j.swevo.2014.02.002
Morales-Castaneda B, Zaldivar D, Cuevas E, Fausto F, Rodriguez A (2020) A better balance in metaheuristic algorithms: does it exist? Swarm Evol Comput. https://doi.org/10.1016/j.swevo.2020.100671
Nama S (2021) A modification of I-SOS: performance analysis to large scale functions. Appl Intell 51:7881–7902. https://doi.org/10.1007/s10489-020-01974-z
Nama S (2022) A novel improved SMA with quasi reflection operator: performance analysis, application to the image segmentation problem of Covid-19 chest X-ray images. Appl Soft Comput 118:108483. https://doi.org/10.1016/j.asoc.2022.108483
Nama S, Chakraborty S, Saha AK, Mirjalili S (2022a) Hybrid moth-flame optimization algorithm with slime mold algorithm for global optimization. In: Mirjalili S (ed) Handbook of moth-flame optimization algorithm: variants, hybrids, improvements, and applications. CRC Press, Boca Raton, pp 155–176
Nama S, Saha AK (2020) A new parameter setting-based modified differential evolution for function optimization. Int J Model Simul Sci Comput 11:2050029
Nama S, Saha AK (2022) A bio-inspired multi-population-based adaptive backtracking search algorithm. Cogn Comput 14:900–925. https://doi.org/10.1007/s12559-021-09984-w
Nama S, Saha AK, Chakraborty S, Gandomi AH, Abualigah L (2023) Boosting particle swarm optimization by backtracking search algorithm for optimization problems. Swarm Evol Comput 79:101304. https://doi.org/10.1016/j.swevo.2023.101304
Nama S, Saha AK, Sharma S (2020) A hybrid TLBO algorithm by quadratic approximation for function optimization and its application. In: Balas VE, Kumar R, Srivastava R (eds) Recent trends and advances in artificial intelligence and internet of things. Springer, Cham, pp 291–341
Nama S, Sharma S, Saha AK, Gandomi AH (2022b) A quantum mutation-based backtracking search algorithm. Artif Intell Rev 55:3019–3073. https://doi.org/10.1007/s10462-021-10078-0
Portugal SJ, Murn CP, Sparkes EL, Daley MA (2016) The fast and forceful kicking strike of the secretary bird. Curr Biol 26:R58–R59
Rao RV, Savsani VJ, Vakharia DP (2011) Teaching-learning-based optimization: a novel method for constrained mechanical design optimization problems. Comput Aided Des 43:303–315. https://doi.org/10.1016/j.cad.2010.12.015
Rashedi E, Nezamabadi-Pour H, Saryazdi S (2009) GSA: a gravitational search algorithm. Inf Sci 179:2232–2248. https://doi.org/10.1016/j.ins.2009.03.004
Rather SA, Bala PS (2021) Constriction coefficient based particle swarm optimization and gravitational search algorithm for multilevel image thresholding. Expert Syst 38:e12717
Reynolds RG (1994) An introduction to cultural algorithms. Proceedings of the 3rd annual conference on evolutionary programming. World Scientific Publishing, Singapore, pp 131–139
Saha A, Nama S, Ghosh S (2021) Application of HSOS algorithm on pseudo-dynamic bearing capacity of shallow strip footing along with numerical analysis. Int J Geotech Eng 15:1298–1311. https://doi.org/10.1080/19386362.2019.1598015
Sahoo SK, Saha AK, Nama S, Masdari M (2023) An improved moth flame optimization algorithm based on modified dynamic opposite learning strategy. Artif Intell Rev 56:2811–2869. https://doi.org/10.1007/s10462-022-10218-0
Sharma S, Chakraborty S, Saha AK, Nama S, Sahoo SK (2022) mLBOA: a modified butterfly optimization algorithm with lagrange interpolation for global optimization. J Bionic Eng 19:1161–1176. https://doi.org/10.1007/s42235-022-00175-3
Storn R, Price K (1997) Differential evolution—a simple and efficient heuristic for global optimization over continuous spaces. J Global Optim 11:341–359
Su H, Zhao D, Heidari AA, Liu L, Zhang X, Mafarja M, Chen H (2023) RIME: a physics-based optimization. Neurocomputing 532:183–214
Taheri A, RahimiZadeh K, Beheshti A, Baumbach J, Rao RV, Mirjalili S, Gandomi AH (2024) Partial reinforcement optimizer: an evolutionary optimization algorithm. Expert Syst Appl 238:122070. https://doi.org/10.1016/j.eswa.2023.122070
Tallini LG, Pelusi D, Mascella R, Pezza L, Elmougy S, Bose B (2016) Efficient non-recursive design of second-order spectral-null codes. IEEE Trans Inf Theory 62:3084–3102. https://doi.org/10.1109/TIT.2016.2555322
Trojovska E, Dehghani M, Trojovsky P (2022) Fennec fox optimization: a new nature-inspired optimization algorithm. IEEE Access 10:84417–84443. https://doi.org/10.1109/ACCESS.2022.3197745
Trojovský P, Dehghani M (2022) Walrus optimization algorithm: a new bio-inspired metaheuristic algorithm
Trojovský P, Dehghani M (2023) Subtraction-average-based optimizer: a new swarm-inspired metaheuristic algorithm for solving optimization problems. Biomimetics (basel). https://doi.org/10.3390/biomimetics8020149
Wang L, Cao Q, Zhang Z, Mirjalili S, Zhao W (2022) Artificial rabbits optimization: a new bio-inspired meta-heuristic algorithm for solving engineering optimization problems. Eng Appl Artif Intell 114:105082. https://doi.org/10.1016/j.engappai.2022.105082
Wei ZL, Huang CQ, Wang XF, Han T, Li YT (2019) Nuclear reaction optimization: a novel and powerful physics-based algorithm for global optimization. IEEE Access 7:66084–66109. https://doi.org/10.1109/access.2019.2918406
Wolpert DH, Macready WG (1997) No free lunch theorems for optimization. IEEE Trans Evol Comput 1:67–82. https://doi.org/10.1109/4235.585893
Wu X, Zhang S, Xiao W, Yin Y (2019) The exploration/exploitation tradeoff in whale optimization algorithm. IEEE Access 7:125919–125928. https://doi.org/10.1109/ACCESS.2019.2938857
Xue J, Shen B (2022) Dung beetle optimizer: a new meta-heuristic algorithm for global optimization. J Supercomput. https://doi.org/10.1007/s11227-022-04959-6
Yapici H, Cetinkaya N (2019) A new meta-heuristic optimizer: pathfinder algorithm. Appl Soft Comput 78:545–568
Zamani H, Nadimi-Shahraki MH (2024) An evolutionary crow search algorithm equipped with interactive memory mechanism to optimize artificial neural network for disease diagnosis. Biomed Signal Process Control 90:105879. https://doi.org/10.1016/j.bspc.2023.105879
Zamani H, Nadimi-Shahraki MH, Gandomi AH (2019) CCSA: conscious neighborhood-based crow search algorithm for solving global optimization problems. Appl Soft Comput 85:28. https://doi.org/10.1016/j.asoc.2019.105583
Zamani H, Nadimi-Shahraki MH, Gandomi AH (2021) QANA: Quantum-based avian navigation optimizer algorithm. Eng Appl Artif Intell 104:104314. https://doi.org/10.1016/j.engappai.2021.104314
Zamani H, Nadimi-Shahraki MH, Gandomi AH (2022) Starling murmuration optimizer: a novel bio-inspired algorithm for global and engineering optimization. Comput Methods Appl Mech Eng 392:114616. https://doi.org/10.1016/j.cma.2022.114616
Zervoudakis K, Tsafarakis S (2022) A global optimizer inspired from the survival strategies of flying foxes. Eng Comput 2022:1–34
Zhao S, Zhang T, Ma S, Wang M (2023) Sea-horse optimizer: a novel nature-inspired meta-heuristic for global optimization problems. Appl Intell 53:11833–11860. https://doi.org/10.1007/s10489-022-03994-3
Zhou A, Qu BY, Li H, Zhao SZ, Suganthan PN, Zhang Q (2011) Multiobjective evolutionary algorithms: a survey of the state of the art. Swarm Evol Comput 1:32–49. https://doi.org/10.1016/j.swevo.2011.03.001
Zolf K (2023) Gold rush optimizer: a new population-based metaheuristic algorithm. Op Res Decis. https://doi.org/10.37190/ord230108
Acknowledgements
This work was supported by the Technology Plan of Guizhou Province (Contract No: Qian Kehe Support [2023] General 117), (Contract No: Qiankehe Support [2023] General 124) and (Contract No: Qiankehe Support [2023] General 302),Guizhou Provincial Science and Technology Projects QKHZC[2023]118, and the National Natural Science Foundation of China (72061006).
Funding
Funding was provided by Natural Science Foundation of Guizhou Province (Contract No.: Qian Kehe Support [2023] General 117) (Contract No: Qiankehe Support [2023] General 124) and (Contract No: Qiankehe Support [2023] General 302), Guizhou Provincial Science and Technology Projects QKHZC[2023]118, and the National Natural Science Foundation of China (Grant No. 72061006).
Author information
Authors and Affiliations
Contributions
YF: Conceptualization, Methodology, Writing—Original Draft, Data Curation, Writing—Review and Editing, Software. DL: Supervision, Writing-Reviewing and Editing. JC: Writing-Original Draft, Formal analysis. LH: Writing-Reviewing and Editing, Drawing, Funding Acquisition.
Corresponding author
Ethics declarations
Competing interests
The authors declare no competing interests.
Additional information
Publisher's Note
Springer Nature remains neutral with regard to jurisdictional claims in published maps and institutional affiliations.
Supplementary Information
Below is the link to the electronic supplementary material.
Rights and permissions
Open Access This article is licensed under a Creative Commons Attribution 4.0 International License, which permits use, sharing, adaptation, distribution and reproduction in any medium or format, as long as you give appropriate credit to the original author(s) and the source, provide a link to the Creative Commons licence, and indicate if changes were made. The images or other third party material in this article are included in the article's Creative Commons licence, unless indicated otherwise in a credit line to the material. If material is not included in the article's Creative Commons licence and your intended use is not permitted by statutory regulation or exceeds the permitted use, you will need to obtain permission directly from the copyright holder. To view a copy of this licence, visit http://creativecommons.org/licenses/by/4.0/.
About this article

Cite this article
Fu, Y., Liu, D., Chen, J. et al. Secretary bird optimization algorithm: a new metaheuristic for solving global optimization problems. Artif Intell Rev 57, 123 (2024). https://doi.org/10.1007/s10462-024-10729-y
Accepted:
Published:
DOI: https://doi.org/10.1007/s10462-024-10729-y