
Abstract
Dihydrogen (H2), commonly named ‘hydrogen’, is increasingly recognised as a clean and reliable energy vector for decarbonisation and defossilisation by various sectors. The global hydrogen demand is projected to increase from 70 million tonnes in 2019 to 120 million tonnes by 2024. Hydrogen development should also meet the seventh goal of ‘affordable and clean energy’ of the United Nations. Here we review hydrogen production and life cycle analysis, hydrogen geological storage and hydrogen utilisation. Hydrogen is produced by water electrolysis, steam methane reforming, methane pyrolysis and coal gasification. We compare the environmental impact of hydrogen production routes by life cycle analysis. Hydrogen is used in power systems, transportation, hydrocarbon and ammonia production, and metallugical industries. Overall, combining electrolysis-generated hydrogen with hydrogen storage in underground porous media such as geological reservoirs and salt caverns is well suited for shifting excess off-peak energy to meet dispatchable on-peak demand.
Introduction
The continual growth and rapid urbanisation of the world population and economy have resulted in an enormous increase in energy need, urging the switch from fossil-based fuels into alternative clean renewables (Dawood et al. 2020). Consequently, global decarbonisation in the transportation, industry and electricity generation sectors is crucially needed to mitigate anthropogenic climate change (Fawzy et al. 2020; Osman et al. 2021a). In this context, there has been a growing interest from scholars and industries with versatile production routes. There is abundant availability of renewable sources used in hydrogen production; however, the variable and intermittent nature of these resources is the major challenge in the transition towards a hydrogen economy. Hence, this calls for technical accommodation, especially for balancing variable renewable supply, i.e. solar, wind and others, and varying energy demand. Furthermore, cost-effective production methods, policies, research and development and hydrogen infrastructure development are areas that need more investigation when transitioning towards the hydrogen economy.
More than 100 current and planned hydrogen production technologies are reported to date, with over 80% of those technologies are focused on the steam conversion of fossil fuels and 70% of them are based on natural gas steam reforming. However, in order to minimise carbon footprint emissions, a wider range of hydrogen extraction processes, such as methane pyrolysis and seawater electrolysis using alternative energy sources, must be addressed. All hydrogen production routes are highlighted in Fig. 1.

Hydrogen production routes, including renewables, fossil fuels and nuclear, with hydrogen being produced in power plants, pharmaceutical applications, synthetic fuels or their upgrades in transportation, ammonia synthesis, metal production or chemical industry applications
Hydrogen is the most abundant element in the universe, and due to its reactivity, it only exists on earth in compounds such as water and organic materials. It is an odourless, flammable and colourless gas, which is leading to its safety concern, especially if a leak is not detected and gas collects in a confined area; it can ultimately ignite and causes explosions. Furthermore, metal hydrogen embrittlement is an issue as it could damage pipelines and containers due to its small molecular size; thus, it escapes through materials. The higher heating value (HHV) of hydrogen is 141.8 MJ/kg at 298 K, and the lower heating value is 120 MJ/kg at the same temperature. This is significantly higher than that of most fuels such as gasoline with a value of 44 MJ/kg at 298 K. However, liquid hydrogen has a lower energy density by volume than hydrocarbon fuels such as gasoline by a factor of four with a density of 8 MJ/l versus density of 32 MJ/l. While hydrogen gas has a high energy density by weight but a low energy density by volume compared to hydrocarbons, it requires a larger tank to store. For example, as opposed to liquified natural gas, liquified hydrogen contains 2.4 times the energy but takes 2.8 times the volume to store. At the same time, the low temperature for liquified hydrogen storage at ambient pressure and a temperature of −253 °C raises quite a few risks. When exposed, it can cause cold burns; furthermore, leakage can result in a combination of liquefied air and hydrogen, resulting in an explosive mixture or the formation of flammable or explosive conduits (Atilhan et al. 2021; El-Halwagi et al. 2020).
Like electricity, hydrogen is an energy carrier and not an energy source; using it to store renewable energies instead of being wasted when not in use is crucial since it is storable, utilisable and transportable (Parra et al. 2019; Abe et al. 2019).
Hydrogen cleanness and colour coding
Dawood et al. (Dawood et al. 2020) reported the four main stages in hydrogen economy: production, storage, safety and utilisation, where hydrogen purification and compression (subsystems) need to be considered along with the life cycle assessment (LCA) when selecting the production method for hydrogen. Hydrogen cleanness level is described in the literature with many colour coding: mainly green, blue and grey, which relies only on the production route, i.e. hydrogen origin, and fails to assess the deep cleanness of the produced hydrogen (Merzian and Bridges 2019), for instance: (1) Grey hydrogen is produced using fossil fuels such as natural gas, one tonne of hydrogen produced in this way is responsible for 10 tonnes of carbon dioxide (Dvoynikov et al. 2021), as shown in Fig. 2; (2) blue hydrogen is produced from fossil fuels like grey hydrogen but with combination of carbon capture and storage to mitigate emissions; (3) green hydrogen is typically produced from 100% renewable sources such as wind or solar energies with lower carbon footprint; (4) brown hydrogen is produced from gasification of coal-based fuel; and (5) turquoise hydrogen is produced from the thermal decomposition of natural gas, i.e. methane pyrolysis or cracking by spitting methane into hydrogen and carbon at a temperature range from 600 to 1200–1400 °C (Dvoynikov et al. 2021). This process produces black carbon (soot) as a by-product instead of carbon oxide emissions in the grey hydrogen, allowing for the sequestration of carbon emissions in the form of solid carbon. However, carbon stability in this black soot is critical for long-term carbon sequestration, along with the utilisation of renewable energy sources in the high-temperature process to achieve carbon neutrality. Interestingly, hydrogen could be produced with a negative carbon footprint via biogas pyrolysis.

Hydrogen colour coding for various manufacturing processes. Green hydrogen is produced using renewable energy sources such as solar or wind energy, followed by water electrolysis. Grey and brown hydrogen are produced by methane steam reforming and coal gasification, respectively, and when combined with carbon capture and storage, blue hydrogen is produced. Turquoise hydrogen is produced through the pyrolysis of methane, with solid carbon as a by-product
However, this colour coding is not precise as it assumes that green hydrogen always has low-carbon emission than blue or grey hydrogen, which is not applicable in all cases. Blue hydrogen, for example, is regarded as less safe than green hydrogen, even though it releases no carbon at the point of use or during the entire process, while green hydrogen may do. For instance, bioenergy feedstocks such as biomass emit greenhouse gas emissions such as CH4, SOx, NOx and CO2 during their growth or thermochemical conversions. Furthermore, the carbon capture and storage technique used in the blue hydrogen reduces toxic emissions significantly. The manufacture of photovoltaic panels as renewable energy technology also has a significant carbon footprint and generates various types of waste, liquid and gaseous by-products that are hazardous to the environment. Starting from the extraction of quartz and other materials used to manufacture solar panels, this is coupled with the carbon and sulphur emission in the energy-intensive process when producing metallurgical silicon. Moreover, the solar panel has a 30-year lifespan, and then, it must be handled as a particular waste at its end of life.
A recent LCA study compared environmental impacts for steam methane reforming with water electrolysis using wind, solar photovoltaic, hydropower, solar thermal and biomass gasification as energy sources (Al-Qahtani et al. 2021). It was concluded that among all the technologies evaluated, solar photovoltaic electrolysis had the most damaging environmental implications because of the significant acidification potential in the photovoltaic panel production phase and the relatively poor efficiency of photovoltaic systems.
Thus, measuring the emitted greenhouse gas emissions accurately in the entire production process along with the life cycle of the equipment used is crucial. This is required to determine how green is the green hydrogen and how blue is the blue hydrogen. A recently proposed model for improved hydrogen colour coding consisted of a hydrogen cleanness index followed by the number of depth levels (Han et al. 2021). For instance, 80 green-4 means hydrogen is produced via renewable resources; however, it is not a zero-emission process, only 80% green, due to emissions related to the process. The number after the colour, which in this case is 4, indicates that greenhouse gas emissions (CO2-e) linked with the purification during the production route have been considered. This model still requires much more analysis to decide the start and end of the continuum thresholds for each colour, as well as the evaluation depth levels and related weight for each level.
Hydrogen production routes
According to the International Energy Agency (IEA), green hydrogen could help reduce our carbon footprint if major challenges such as infrastructure, logistics, cost-effective manufacturing methods and safety are overcome. Globally, hydrogen is responsible for about 843 metric tonnes of CO2 emissions per annum, equal to the combined total emissions of the UK and Indonesia (IEA 2019). The global hydrogen demand is projected to increase from 70 million tonnes in 2019 to 120 million tonnes by 2024 (Global hydrogen market insights 2020; Atilhan et al. 2021; Safari and Dincer 2020). In 2025, the largest global green hydrogen plant will be built, with a capacity of 237,250 tonnes per annum, i.e. 650 tonnes/day hydrogen output through electrolysis and 4 gigawatts of renewable energy from wind, solar and storage.
A wide range of resources is available for hydrogen production, mainly fossil-based and renewable fuels (Dawood et al. 2020; Saithong et al. 2019; Osman et al. 2020a). The former is the more mature and most common used industrially as it is a cost-effective method that deploys cracking or reforming fossil-based fuels. In 2016, hydrogen production globally was about 85 million tonnes used in petroleum, metal industry, fertiliser, food processing, semiconductor production, power plants and generations (Chen and Hsu 2019; El-Emam and Özcan 2019; Acar and Dincer 2019).
There are many ways to extract hydrogen from hydrogen-containing materials, either hydrocarbon or non-hydrocarbon, such as photonic, electric, chemical, bioenergy, heat and a combination of those methods together (Abe et al. 2019; El-Emam and Özcan, 2019; Osman et al. 2020b). Table 1 shows different hydrogen production routes with different energy sources, technology readiness level (TRL) and their % energy efficiency.
Advances and challenges in water electrolysis
Water is typically purified and then sent to an electrolyser, which produces hydrogen and oxygen. The hydrogen is then dried, purified and compressed from a 10.3 to 413.7 bar pressure, and then stored in a tank. Although the electrolysis pathway offers a 100% renewable route for hydrogen production, it represents less than 5% of worldwide hydrogen production (Han et al. 2021). Despite this low percentage contribution, water electrolysis is gaining momentum for various reasons such as zero-carbon emissions, the absence of unwanted by-products such as sulphates, carbon oxides and nitrogen oxides, and high hydrogen purity. The cost of producing hydrogen through electrolysis would be reduced by approximately 70% over the next decade, allowing for the widespread adoption of a green hydrogen production approach.
By 2040, the worldwide market for hydrogen electrolysers is expected to have grown by 1000-fold. Aurora Energy Research predicted that about 213.5 gigawatts of projects will be completed over the next 19 years; this compares to an estimated 200 megawatt that is currently in service. They reported that 85 per cent of anticipated projects are in Europe, with Germany accounting for 23 per cent of expected global electrolyser capacity. The European Union has already set a goal of 40 gigawatts of electrolyser capability by 2030 (Research, 2021). If all this power is available, it will supply up to 32 million tons of hydrogen per year, which is already half of the currently demanded hydrogen. In a 1.5-degree climate change mitigation scenario, meeting 24% of energy demand with hydrogen will necessitate massive amounts of additional renewable electricity generation. To power electrolysers in this scenario, approximately 31,320 terawatt-hours of electricity would be required, i.e. more than is currently produced globally from all sources combined (BNEF 2020). Besides, an investment of more than $11 trillion in manufacturing, storage and transportation infrastructure would be required.
Proton exchange membrane (PEM) along with alkaline anion exchange membrane (AEM) and concentrated potassium hydroxide solution KOH are the most common techniques used in low-temperature water electrolysis. The key benefit of alkaline anion exchange membrane electrolysis over other methods is lower cost since no platinum group metals are used as catalysts herein. The main challenge, however, is the low rate of hydrogen production and the instability of the alkaline method owing to its susceptibility to pressure drop (Dvoynikov et al. 2021; Yu et al. 2019). A typical electrolysis system consists of two metal electrodes, an anode and a cathode, separated by a membrane and immersed in an electrolyte solution (Zhu et al. 2019). As an electric current flows through the solution, oxygen and hydrogen bubbles rise above the anode and cathode, respectively. Both electrodes are typically coated with a catalyst to reduce the amount of energy needed to liberate hydrogen from water.
However, large amounts of freshwater would be needed to generate hydrogen, and these supplies are already depleted worldwide; thus, the utilisation of seawater will be an option to overcome this issue. However, seawater utilisation in hydrogen production is associated with challenges such as the corrosion of chloride ions in seawater to the anode metal. Hung et al. reported a solution to this issue by designing the anode material as a porous nickel foam pan collector coated with an active and inexpensive nickel and iron catalyst, which showed strong conductivity and corrosion resistance. It is worth noting that, while using freshwater is more expensive than using seawater, the cost of water usually accounts for less than 2% of the total cost of hydrogen production via electrolysis (Milani et al. 2020). The affordability and accessibility of freshwater is one side of the coin, while inexpensive and sustainable green energy alternatives are the other, and the proximity of these two supplies, i.e. renewable energy and freshwater, does not always coincide. The main areas that need further investigation in water electrolysis are reducing the capital cost of electrolysis technology, finding water resources and increasing efficiency.
According to the recent literature summarised in Table 1, membrane reactor technology is increasingly being recognised as an encouraging route to expand clean hydrogen production paths from hydrocarbons and hydrogen purification. At least 99.8% can be achieved without any gas purification using a proton exchange membrane analyser (Jorschick et al. 2021).
Recently, it was reported for Australia that the levelised cost of hydrogen (LCOH) for steam methane reforming could reach a cost of $(1.88–2.30)/kg H2 and $(2.02–2.47)/kg H2 for coal gasification production routes. In comparison, the LCOH via electrolysis technologies costs between $4.78 and $5.84/kg H2 for alkaline electrolysis and $6.08–7.43/kgH2 for proton exchange membrane technologies (Milani et al. 2020).
When using partial methane oxidation for hydrogen production via synthesis gas, the average cost is 1.33 euros/kg H2, while the cost of large-scale H2 processing ranges between 1 and 1.5 euro/kg H2 (Dvoynikov et al. 2021). It is important to note that the economic viability of using natural gas or related petroleum gas for hydrogen production should be seen in the light of transportation systems or the direct use of hydrogen on-site of the gas or oil plant.
In terms of blue hydrogen, carbon capture and utilisation lower greenhouse gas emissions but raise the overall production cost. Chemical looping reforming, for instance, has a comparatively short life cycle, global warming potential and low fossil fuel intake. Nevertheless, adding carbon capture and liquefaction process units raises the expense of the steam methane reforming by 18% and autothermal reforming processes by 2% (Atilhan et al. 2021). The process of liquefying hydrogen absorbs approximately 30% of the energy content of hydrogen. Additionally, keeping liquified hydrogen under one atmospheric pressure and at a low temperature of −253 °C is difficult. Furthermore, evaporation and leakage can occur even with robust insulation, losing typically 1 per cent of the stored volume per day (Atilhan et al. 2021).
Biomass gasification
Biomass gasification is seen as one of the most feasible, sustainable and potentially carbon-neutral alternatives to generate hydrogen (Saidi et al. 2020). Since biomass is a renewable feedstock that absorbs atmospheric carbon dioxide during growth, it has a much lower net CO2 footprint than fossil-based fuels. However, the economic feasibility of hydrogen output from biomass must be closely related to the availability and affordability of raw materials in the local area. The biomass physicochemical properties, distribution and hydrogen rate are the main attributes of the supply materials. Since biomass feedstocks vary widely in structural composition and shape, all of these characteristics must be taken into account when combining the feedstock with the appropriate conversion technology (Srivastava et al. 2020).
Consequently, moisture, energy and ash contents are the core criteria for evaluating biomass utilisation in this route. The hydrogen yield from biomass is comparatively poor since the hydrogen content of biomass is roughly 5.9 wt% compared to 25 wt% for methane (natural gas), and the energy content is also low due to high oxygen content within the biomass of 40%. Thus, techno-economic studies backed by adequate life cycle assessment evaluation are crucial in this matter. Since biomass has a lower density, transportation and storage costs for either biomass feedstock or the produced hydrogen should be well justified in terms of economies of scale. In certain ways, these characteristics would make it impossible for biomass-based hydrogen production to compete with common natural gas such as steam methane reforming method unless new regulatory frameworks such as carbon tax favour competitively sustainable hydrogen production routes.
Biomass gasification, like coal, is the most practical process for biomass feedstocks because it produces the best yield at high temperatures, generally, 500–1400 °C, where the overall reaction is presented in Eq. 1. Interestingly, the integration between biomass gasification and carbon capture and storage can potentially lead to an overall negative carbon footprint.
Advances and challenges in fossil-based hydrogen production route
The breakdown of the long-chain hydrocarbon via gasification, reforming or pyrolysis reaction routes is required for hydrogen production from fossil-based feedstocks. The primary product in the reforming reaction is the synthesis gas (a mixture of H2 and CO), followed by H2 separation via autothermal reforming, steam methane reforming, partial oxidation or membrane reforming. Another well-known method that is commonly used in hydrogen production is the gasification of fossil fuels, such as coal gasification (Milani et al. 2020).
Al-Qahtani et al. evaluated and compared the most common hydrogen generation routes on a monetary basis, such as steam methane reforming, coal or biomass gasification, methane pyrolysis with or without carbon capture and storage technology. Besides, the hydrogen production from the water via electrolysis derived from solar or nuclear energy were also assessed. They reported that, at the moment, steam methane reforming with carbon capture and storage appeared to be the most viable alternative (Al-Qahtani et al. 2021).
Steam methane reforming and methane pyrolysis
The primary feedstock for steam methane reforming is natural gas, predominantly methane mixed with other hydrocarbons and carbon dioxide (Osman 2020) Natural gas and steam reaction occur in a two-step reaction, as shown in Eq. 2 at high temperatures, followed by an interaction between the carbon monoxide and the produced hydrogen along with the unreacted natural gas. Following that, more steam is supplied to react with carbon monoxide in a water–gas shift reaction (WGSR), as shown in Eq. 3, to recover further hydrogen and convert carbon monoxide into carbon dioxide. The entire process efficiency is around 76% (Al-Qahtani et al. 2021). The entire process releases a significant amount of carbon dioxide emissions, which may be decreased by installing carbon capture and storage technology, removing and separating the flue gases from the product stream. Following that, an amine solvent such as monoethanolamine absorbs about 90% of the carbon dioxide emission, and then, the processed flue gas stream is released into the environment. Afterwards, carbon dioxide is thermally desorbed and compressed to 110 bars for storage. The integration between steam methane reforming and carbon capture and storage (SMR + CCS) technologies has an energy efficiency of 68 per cent, owing mostly to the energy necessary to regenerate the monoethanolamine and the power required for compression. After the WGSR, hydrogen is further purified to 99.99 per cent in both situations, with or without carbon capture and storage, in a pressure swing adsorption unit, which is also utilised in the gasification technology such as coal or biomass gasification routes.
Regarding methane pyrolysis at high temperatures, thermally or catalytically, the processes degrade hydrocarbons into hydrogen and solid carbon, as shown in Eq. 4. Because there is no oxygen in the process, no carbon oxides are generated, possibly removing the requirement for subsequent processing stages such as the WGSR and lowering the capital and operating expenditures compared to steam methane reforming (Al-Qahtani et al. 2021). The greater H2 content in the product gas stream has the potential to reduce downstream clean-up operations significantly. The cost of methane pyrolysis is heavily influenced by the natural gas prices, processing method and solid carbon by-product.
Coal gasification
During the coal gasification process at high temperatures ranging from 800 to 1300 °C and 30–70 bar pressures, coal is partially oxidised in oxygen or air atmosphere into synthesis gas, as shown in Eq. 5. The synthesis gas is typically composed of carbon monoxide and dioxide, hydrogen and unreacted methane, where the WGSR process (Eq. 3) enriches the syngas further to recover additional hydrogen. Thus, combining Eqs. 3 and 5 will lead to the overall reaction as in Eq. 6. Coal gasification is less efficient than steam methane reforming with 55%, although it has a larger single-train capacity.
Bibliometric analysis
Key research studies were identified to summarise state of the art and discover knowledge gaps in the hydrogen production and LCA research arenas. The advanced search tool for publications from the Web of Science was used for this study, using the terms ‘Hydrogen production’ AND ‘Life cycle assessment’ as inputs. The results were manually scanned, and 24 most complete and relevant studies published from 2019 to 2021 were selected for review in the present study.
Life cycle assessment
Life cycle assessment (LCA) is recognised as a comprehensive tool to evaluate environmental impacts associated with products and processes. There are many hydrogen production methods, such as steam methane reforming, electrochemical routes through water electrolysis using renewable power sources, thermochemical pathways involving renewable feedstock as the hydrogen carrier and biological processes (Valente et al. 2021; Owgi et al. 2021). However, environmental sustainability based on LCA remains one of the key requirements for selecting these processes for hydrogen production (Falcone et al. 2021). This is because policymakers need to adopt transformative solutions based on robust data and evidence-based research to identify processes that go beyond a one-fits-all approach.
To this end, we reviewed 24 LCA studies published from 2019 to 2021 on hydrogen production and life cycle assessment (Table 2). The four main stages defined by ISO 14040 and IS0 14,044 for conducting LCA are: (1) goal and scope definition, (2) life cycle inventory analysis, (3) environmental impacts assessment and (4) life cycle interpretation (Al-Muhtaseb et al. 2021).
Goal and scope of the life cycle assessment
The first stage of LCA consists of defining a goal and the scope of the study. This stage determines whether a study would be attributional or consequential, what functional unit will be considered to evaluate environmental impacts and the extent of the system boundary. This is an important initial step as the questions to be answered determine the results and associated policy implications.
Types of life cycle assessment: attributional and consequential
Life cycle assessment studies can be broadly classified into two categories: (1) Attributional LCA incorporates immediate physical flows such as raw materials, energy and emissions involved across the life cycle of a product (Jeswani et al. 2020), and (2) consequential LCA accounts for how physical flows can change as a consequence of an increase or decrease in demand for the product system under study (Earles and Halog 2011). It includes unit processes inside and outside the product's immediate system boundaries; therefore, consequential LCA studies are more suited for policy decisions. However, as LCA for hydrogen production remains at an embryonic stage, attributional studies are more commonly found. Nevertheless, both attributional and consequential approaches were considered for the purpose of this study.
Functional unit
In LCA, the functional unit is a measure of the purpose of the studied system, and it provides a reference by which the inputs and outputs can be related. This enables the comparison of two essentially different systems. The definition of the functional unit is intricately linked to the goal of an LCA study. It was observed that ~ 42% of the reviewed studies used ‘kg of hydrogen produced’ as the functional unit (Fig. 3). While some studies provided results considering hydrogen as an energy carrier and therefore recorded functional unit as ‘energy produced in MJ or kWh’. Very few studies reported ‘distance travelled in km’ as a functional unit when hydrogen was utilised as fuel for vehicles. The choice of different functional units for the same product, i.e. hydrogen, shows the challenges associated with comparing LCA models.

Types of functional units used in the life cycle assessment studies reviewed in the present work (N = 24)
System boundary
In LCA, the system boundary definition profoundly impacts the materials, processes and emissions considered for evaluation. As such, system boundary limits can also considerably influence the calculation of environmental impacts (Collotta et al. 2019). The two commonly studied kinds of system boundary for hydrogen production are ‘cradle-to-gate’ or ‘well-to-pump’ that includes processes only until production and ‘cradle-to-grave’ or ‘well-to-wheel’, which incorporates emissions during end use as well.
The generalised system boundary used for conducting the LCA of hydrogen production and consumption includes: (1) raw materials and primary energy sources such as natural gas, coal, biomass, nuclear energy and water; (2) the hydrogen production processes, for instance, water electrolysis and thermochemical processes. Some processes may also consider hydrogen purification as a subsystem to the production; (3) storage of hydrogen in underground caves or compressed tanks; (4) transportation of hydrogen in liquified or compressed gaseous form using trucks and tube trailers or pipelines; (5) emissions during end use such as by hydrogen trains or generation of power using hydrogen; and (6) finally, waste treatment processes from these systems such as emissions to land, air and water (Fig. 4).

Generalised system boundary used for conducting life cycle assessment of hydrogen production and consumption. This includes various raw materials such as solar, wind, biomass, coal, water and natural gas
During the review, we observed that studies employed an array of processes and limits in system boundary for conducting LCA of hydrogen production and consumption (Table 3). There were only a handful of studies that considered emissions during the use phase. However, given the increasing interest in using hydrogen as a clean energy carrier, it is important to consider the emissions during the use phase and conduct LCAs that present ‘well-to-wheel’ estimates.
Allocation approaches
The allocation approach refers to both ‘partitioning’ and system expansion/substitution method. The allocation approach has been identified to significantly control the values obtained for environmental impacts (Finnveden et al. 2009). Allocation approaches are required because the life cycle of a product can consist of many multifunctional processes. Therefore, it is imperative to allocate the environmental impacts between the different coproducts generated by the same process in a justified manner.
Life cycle inventory analysis
Life cycle inventory analysis includes data collation for all the inputs and outputs for processes within the system boundary. In general, the more the processes included in the system boundary, the more complex, challenging and cumbersome is the inventory analysis. This also explains the fact that many studies did not include all the processes ranging from raw material acquisition to end-of-life management (summarised in Table 3). The two different kinds of data to be collected for an LCA study are: (1) foreground data for foreground systems which includes primary data that can be easily modified or improved and (2) background data for background systems typically comes from Life Cycle Inventory databases (Silva et al. 2020). Background systems support the foreground systems. Table 2 details the databases/data sources incorporated in LCA studies on hydrogen production such as Ecoinvent, expert communications, Greenhouse gases, Regulated Emissions and Energy use in Transportation.
Environmental impacts assessment
Midpoint and endpoint indicators
Global warming potential due to emissions of greenhouse gases and depletion of fossil fuels was the centre of the attention in the environmental indicators for hydrogen production, with 100% of the studies accounting for either of these two categories (Table 4). More than half (54%) of the reviewed studies computed environmental impacts in categories that go beyond global warming potential and net energy use/performance. These environmental impacts included but were not limited to acidification, eutrophication, abiotic depletion, marine, freshwater and terrestrial ecotoxicity, and human toxicity.
Global warming potential expressed as kg CO2 equivalent relates to greenhouse gas emissions; abiotic depletion recorded in kg Sb equivalent is linked to depletion of minerals, peat and clay; acidification reported in kg SO2 equivalent is due to the emission of acidifying substances; eutrophication measured as kg PO43− equivalent is due to release of nutrients; particulate matter formation calculated as PM 2.5/PM 10 equivalent relates to the emission of PM 2.5 (particulate matter with ≤ 2.5 µm in diameter) and/or PM10 (particulate matter with ≤ 10 µm in diameter). Photochemical oxidation (commonly called as ‘summer smog’) occurs in stagnant air, in the presence of pollutants such as NOx, non-methane VOCs and others. Ozone layer depletion evaluates the global loss of ozone gas caused by trichlorofluoromethane (CFC-11) of the same mass. Land use calculated in m2 is categorised as the transformation of urban, agricultural and natural land. Damage to terrestrial, freshwater and marine ecosystems is measured by ecotoxicity potential. Finally, human toxicity is caused due to the potential human health impacts of carcinogenic and non-carcinogenic pollutants.
The midpoint categories are aggregated to present results as endpoint categories such as human health, damage to ecosystem quality in the form of loss of species and resources depletion (Osman et al. 2021b). It is argued that the environmental impacts should be presented as midpoint categories to prevent oversimplification or misinterpretation of environmental impacts (Kalbar et al. 2017). This is because endpoint indicators entail weighting of impacts. Evidently, only one study was identified that presented environmental impacts for both midpoint and endpoint indicators (Ozturk and Dincer 2019).
Uncertainty and sensitivity analysis
Uncertainty arises in LCA studies due to sparse and imprecise nature of the available data and model assumptions (Cherubini et al. 2018). It is, therefore, imperative to consider and compute these uncertainties quantitatively to reach transparent, robust and trustworthy decisions.
There has been a vast development on the methods to imbibe these uncertainties in LCA models such as parameter variation and scenario analysis, classical statistical theory (e.g. probability distributions and tests of hypothesis); Monte Carlo simulations, bootstrapping and other sampling approaches; nonparametric statistics, Bayesian analysis, fuzzy theory; and the use of qualitative uncertainty methods (Finnveden et al. 2009).
This review recorded that 67% of the studies used scenario analysis to account for parameter uncertainty (Fig. 5). Together with comparative studies mentioned in (Table 2) and scenario analysis in Fig. 5, this value reaches 96%, i.e. all but one study performed comparative and/or scenario analysis (Cvetković et al. 2021). This can be attributed to the dearth of the data and the serious effort required to conduct an LCA of biohydrogen production via anaerobic digestion (Cvetković et al. 2021). Furthermore, it was noted that 8% of the studies employed Monte Carlo simulations to propagate parameter uncertainties in the model.

Details of the scenario, sensitivity and Monte Carlo simulations (to propagate uncertainty) conducted in the reviewed studies (N = 24). Scenario analysis was conducted in 67% of the reviewed studies
Sensitivity analysis is conducted to distinguish processes in the hydrogen production chain that contribute to the burdensome environmental footprints. Relatedly, if environmental impacts are to be minimised, these will be the processes where future research should focus on (Al-Muhtaseb et al. 2021). 42% of the studies reviewed here conducted sensitivity analysis.
Interpretation of results
This stage of the LCA includes making interpretations, drawing conclusions and distinguishing the processes that can be improved to increase the environmental feasibility of the system. This stage could also involve presenting and communicating results to stakeholders. Table 5 summarises key findings from the reviewed studies.
Key findings and recommendations for future life cycle assessment studies
Life cycle assessment is a complex tool that sits at the interface between science, engineering and policy. Despite this inherent complexity, it is recognised as a comprehensive tool to evaluate environmental impacts associated with products and processes. We reviewed LCA studies published from 2019 to 2021. This section draws recommendations for policymakers to create a sustainable hydrogen economy and LCA practitioners to conduct future studies.
-
During the review, no two LCA studies were identified to be similar. Differences in the geographical and temporal span, functional units and system boundaries considered, and environmental impact categories were reported. Therefore, it is recommended that the policymakers pay heed to the modelled processes and extent of the system boundary for making decisions for creating a sustainable hydrogen economy.
-
Most of the studies did not encompass processes, inputs and outputs for ‘cradle-to-grave’ LCA analysis. Thus, future studies should conduct ‘cradle-to-grave’ evaluation for robust decision-making.
-
About 54% of the reviewed studies computed environmental impacts in categories that go beyond global warming potential and depletion of fossil fuels. It is crucial to assess environmental impacts in more categories. Otherwise, there can be the issue of burden shifting, where hydrogen production processes are developed to mitigate climate change and energy security, however, leading to severe environmental and human health impacts such as acidification, eutrophication and human toxicity.
-
Finally, focusing on production pathways, only eight studies were identified that computed environmental impacts for biohydrogen, showing that there is a considerable knowledge gap in production processes utilising bio-based feedstocks.
Hydrogen underground storage
There are ambitious goals of the Paris agreement for climate change to be met than ever by 2050. However, the continuous increase in carbon dioxide (CO2) emission generated by the use and storage of fossil fuels has created a clear demand for alternative sources of clean and renewable energy (Ochedi et al. 2021). Solar and wind energy, however, provide intermittent and volatile power sources (as shown in Fig. 6) that are requiring backup solutions and/or energy storage at scales comparable to their power generation capacity (i.e. longer-term TWh storage solutions). In particular, some industrial sectors are hard to be decarbonised. To help balance the energy supply and demand, a capability of various energy storage technologies, with a dynamic combination of daily, weekly and seasonal storage, can reduce CO2 emissions per unit of energy provided.

[A] Diurnal time series shows the matching of load, wind and solar of a typical day during the winter season for Europe with 15th and 85th percentiles for each average day time series. [B] Annual time series of weekly averages illustrate the seasonal correlation (i.e. excess/shortage) of load, wind and solar. Electricity generation and demand normalised over the corresponding average value. [C] Schematic round-trip efficiency for a short-term (e.g. battery, brown line) and long-term (e.g. power to hydrogen, black line) storage technology. The figures were adapted from (2017) and (Gabrielli et al., 2020)
To date, the technical feasibility and economic attractiveness for developing large-scale, lithium-ion-based and seasonal energy storage batteries can be challenging to be implemented and provide an energy supply during high demand times. Such shortfall can be eliminated by storing the excess renewable energy chemically—in the form of hydrogen—in the subsurface aquifers, salt caverns and/or exhausted hydrocarbon reservoirs in the so-called Underground Seasonal Hydrogen Storage (USHS). The usage of hydrogen as an energy carrier can be a promising solution for clean energy because of its non-toxicity, high specific energy and non-CO2 emission after combustion. The challenge is to find hydrogen storage materials with high capacity. USHS, therefore, can be one of the most promising solutions for offsetting seasonal mismatch between energy generation and demand (Fig. 6), firstly for medium- and long-term storage while increasing contribution to low-carbon energy supply. Despite the vast opportunity provided by USHS, maturity still is considered low, with several uncertainties and challenges (Heinemann et al. 2021).
Hydrogen-based economy requires a large gas transport infrastructure. It has been suggested that existing natural gas pipe networks could be used to transport hydrogen (Melaina et al. 2013; Panfilov 2016). The gases would be transported as a mixture and separated afterwards. Some methods for separating mixtures of methane and hydrogen, particularly gas membrane separation, appear promising (Ockwig and Nenoff 2007).
Geologically, underground formations are suitable for storing hydrogen, which may then be used as a carrier of chemical energy produced in times of surplus energy production, stored for several months and ultimately retrieved for re-electrification when it is needed most (Bauer et al. 2013; Bauer et al. 2017). As an illustration of the possible storage potential, a system volumetric capacity (i.e. the Net Energy Density) of hydrogen-based flow battery stores approximately 2.7 kWh/L (NREL) of electrolyte, and hence, an exhausted million-barrel oil field would hold > 3 TWh of electricity. This is equivalent to 30 weeks’ output from a large offshore wind farm which is far more than is needed to eliminate the intermittency issues associated with such a facility. Hence, it was proved that only a few offshore gas fields are required to store enough energy as hydrogen to balance the entire seasonal demand for UK domestic heating (Mouli-Castillo et al. 2021).
Thermophysical properties of hydrogen
After hydrogen is produced at the surface from one of the technologies, it must be transported to a seasonal storage facility in a liquid or gas phase. Moreover, hydrogen can also be stored on the surfaces of solids (i.e. by adsorption) or within solids (i.e. by absorption) (El-Eskandarany 2020). During the loading cycle, where the power demand is at a peak, hydrogen can be easily re-converted for electrical generation.
Hydrogen can be considered as an ideal gas that may occur in various states over a wide temperature range and even at high pressures. Here, the thermophysical properties of hydrogen at the conditions relevant to the underground hydrogen storage were provided. One of its most important thermophysical characteristics is its low density, making it necessary for any practical application to compress the hydrogen or liquefy it. At intended storage depths, the density and dynamic viscosity of hydrogen are iteratively calculated using equation of state (EOS) and following (Span et al. 2020). Primarily, the hydrogen density (kg/m3) mainly increases with increasing pressure while dynamic viscosities (μPa.s) significantly increase with increasing temperature, as shown in Fig. 7. At low temperatures of − 262 °C, hydrogen is solid with a density of 70.6 kg/m3. At higher temperatures, hydrogen is a gas with a small density of 0.089 kg/m3 at 0 °C and at a pressure of 1 bar. The extent of hydrogen's liquid state can be presented as a narrow zone between the triple and critical points, with a density of 70.8 kg/m3 at − 253 °C.

(left) Density [kg/m3], (right) dynamic viscosity [µPa.s] of hydrogen at representative P–T conditions which are typical for Underground Hydrogen Storage system. The calculations were carried out by the authors, using the fundamental properties of Hydrogen as an ideal gas. By the time pressure of > 35 MPa is reached, a deviation of 15% from the real values is expected
Three potential technologies for hydrogen storage, therefore, can be considered according to combinations of pressure and temperature relevant to the storage conditions (Table 6):
-
Cryo-compressed hydrogen storage (CcH2) and liquid hydrogen (LH2) storage: storage of hydrogen as a liquid requires cryogenic temperatures because the boiling point of hydrogen at one-atmosphere pressure is − 253 °C with a density of close to 71 kg/m3. These properties make storing hydrogen under standard atmospheric pressure and temperature extremely difficult due to the high cost and safety issues. Whereas other gases can be liquefied around the standard temperature of 20 ºC, this is unfortunately practically impossible for hydrogen. Therefore, hydrogen needs compression into cryogenic vessels that can be pressurised to 25–35 MPa. Accordingly, the size of liquid hydrogen requires larger tanks reaching about three times larger than the currently used gasoline tank (El-Eskandarany, 2020).
-
For pressure ranges between 5 and 30 MPa and temperature between 25 and 130 °C, hydrogen can safely be stored as a gas in underground geological formations. For USHS, hydrogen must be transported to a wellhead for underground storage. The hydrogen must then be compressed to be injected at sufficient pressure to enter the geological formation at the in situ pressure and temperature. Different potential geological storage sites for USHS are shown in Fig. 10 and will be discussed in more detail in the following sections.
Additionally, pressurised hydrogen gas takes a great deal of volume compared with, for example, gasoline with equal energy content—about 30 times bigger volume at 10 MPa gas pressure (El-Eskandarany 2020). USHS basically implies the reduction of the enormous volume of hydrogen gas due to the reservoir pressure gradient (Fig. 8). One kilogram of hydrogen in ambient temperature and at atmospheric pressure occupies a volume of 11 m3.
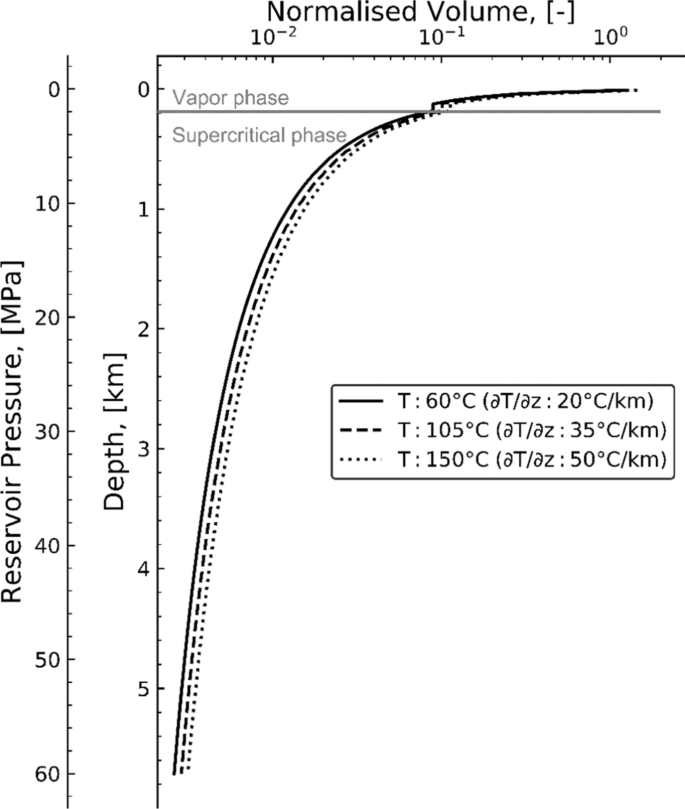
Normalised volume of hydrogen at the pressure–temperature (over the range of geothermal gradients) conditions plotted as a function of depth. Grey horizontal line at 800 m marks the minimum depth recommended for hydrogen injection, where it can be found as a supercritical phase at pressure and temperature conditions relevant for USHS (above 1.3 MPa)
Fluid dynamics of hydrogen in a brine-saturated porous medium
In the context of the USHS system, the cyclic injection of hydrogen into (and possible retrieval from) a brine-filled permeable formation is part of multi-phase flow problems that have been studied extensively (Hashemi et al. 2021; Liebscher et al. 2016). In this case, a two-phase hydrogen–brine system is immiscible—the fluids are separated by a capillary interface. Likewise, the CO2 geological storage, an important first approximation to the behaviour of the hydrogen–brine system, is found via applying a group of dimensionless ratios and solubility (and hence its mobility) that analyse the dynamics of two-phase immiscible flow systems (Ringrose et al. 2021). Viscous/capillary (Nvc) and gravity/viscous (Ngv) ratios are, respectively, the characteristic time ratios for fluid to flow in the transverse direction due to capillary and gravity forces to that in the horizontal direction due to viscous forces using the assumption of (Zhou et al. 1997). The two fluids here are assumed to be vertically segregate due to the gravity and density difference. Both ratios can be formulated in Eqs. 7 and 8 as follows:
and
where ux is the total flow velocity in the horizontal (x) direction, ∆x and ∆z are the system dimensions, μnw is the viscosity of the non-wetting phase (hydrogen), kav is the average permeability, ∆ρ is fluid density difference, g is the acceleration due to gravity and (dPc/dSw) is the capillary pressure gradient as a function of wetting-phase saturation.
Around the injection/production wellbore, viscous-dominated conditions are expected to occur due to the high-pressure gradient (Ringrose et al. 2021). However, within the reservoir and away from the injection/production wellbore region, gravity-dominated conditions are expected to occur. Such ratios, therefore, can be used to expect the fluid dynamic behaviour of the hydrogen-brine flow system and determine which factors are likely to be most critical, particularly when assessing large-scale macroscopic fluid flow, where the capillary and gravity forces become important enough to be not neglected.
Another important factor for USHS is the solubility of hydrogen in the resident formation fluid (water/brine). Therefore, forecasting the phase equilibria (solubility of hydrogen in brine and water content in the hydrogen-rich phase) under the geological storage conditions (i.e. at different temperatures, pressure and molality) is necessary for the study of hydrogen mobility and reactivity, as well as the control, monitoring and optimisation of the storage. Based on new experimental datasets, Chabab et al. developed predictive models to estimate the water content in the hydrogen-rich phase and precisely capture the salting-out effect on hydrogen solubility (Fig. 9) (Chabab et al. 2020).

Solubility of hydrogen in pure water as well as the brine of different molalities (up to 5 M), as a function of pressure (up to 25 MPa), and at the temperature of 50ºC [a] and 100ºC [b]. The symbols represent experimental results from the literature (Chabab et al., 2020). The solid, dotted and dashed lines represent the hydrogen solubilities calculated by the e-PR-CPA, SW and geochemical models, respectively. The figure is modified from Chabab et al., (2020)
Large-scale hydrogen geological storage
A promising solution to help balances the energy supply from renewable intermittent sources and demand is hydrogen as an energy carrier for clean energy and must be accompanied by energy storage systems. The benefits of using hydrogen are because of its non-toxicity, high specific energy and non-CO2 emission after combustion. However, the challenge is to find hydrogen storage materials with high capacity. Large-scale underground storage of natural gas has been practised successfully for many decades, with a global total of 413 billion standard cubic metres (BSCM) of natural gas storage accommodated in depleted gas fields (80%), underground aquifers (12%), and engineered salt caverns (8%) (Perry 2005), as shown in Fig. 10. Here, these types of underground hydrogen storage systems have been considered (Lord et al. 2014; Panfilov 2010).

Schematic diagram of different processes which are associated with hydrogen production using electrolysis, seasonal storage in geological formations and/or salt caverns, utilisation for ammonia production and re-electrification of hydrogen using fuel cells. The figure shows different potential storage mediums for the hydrogen in the underground geological formations: reservoir/aquifer and salt caverns. The dimensions are not to scale
Depleted hydrocarbon reservoirs
More often than not, depleted hydrocarbon reservoirs are appealing targets for USHS because of their storage capacity, proven seal, previous knowledge of reservoirs characterisation and existing infrastructure (i.e. natural gas pipeline network). Nevertheless, various physical, chemical and microbial processes are associated with USHS in hydrocarbon reservoirs (Heinemann et al. 2021) (summarised in Fig. 10).
While one can transfer know-how and technology from underground natural gas storage and underground carbon storage, some of the challenges USHS faces are peculiar. In both compressed gas and liquid forms, the low density of hydrogen makes the seasonal storage of hydrogen in porous media (and possible retrieval) problematic. With a mass–density ratio of less than 0.01 compared to water for most relevant subsurface storage conditions, H2 is very light. Consequently, an H2 plume would experience strong buoyancy forces (i.e. the stronger the buoyancy forces, the higher the potential for hydrogen leakage), and water upconing towards the extraction borehole may occur (Heinemann et al. 2021; Sainz-Garcia et al. 2017).
-
This limitation is felt most strongly during the hydrogen retrieval from the subsurface. The gas saturation around the production well required to keep a gas well flowing is of major concern since it will impact and reduce the production and ultimately will kill the well. The thinner the hydrogen plume will be, the lower gas saturation and the higher accumulation of resident formation brine in the downhole. Therefore, the dynamics of the USHS system require a wellbore model capable of describing/predicting the conditions (pressure and temperature) in the extraction borehole as the fluid(s) flow up (or the liquid accumulation at the bottom of) the borehole.
-
Water upconing is the change in the hydrogen–water contact profile due to drawdown pressures. This phenomenon can be seen as the name implies: a cone of water formed below the perforations. One way to avoid upconing during H2 production is the use of a cushion gas (Kim et al. 2015; Oldenburg 2003), usually a cheaper and denser gas like nitrogen (N2), which helps prevent water flooding of the gas plume when H2 is being produced. This concept is well known in underground natural gas storage and has previously been proposed for USHS (Cao et al. 2020).
Additionally, it is important to note that USHS involves cyclic hydrogen injection (i.e. during power surplus) into and withdrawal (i.e. during energy demand) from the geological formations, where changes in the reservoir pressure may induce fatigue in the caprock and lowering the fracturing pressure at which hydrogen commences to leak through a seal rock. Therefore, assessing the sealing capacity to hydrogen (or hydrogen column height) will be crucial to keeping the risk of the potential upward leakage of hydrogen through the sealing caprock at a minimum. Seal rocks have fine pore and pore throat sizes that, in turn, generate hydraulically tight low-permeability caprocks with high capillary threshold pressures. High threshold pressures, together with wettability and interfacial tension (IFT) properties, determine the final column height that a seal can hold, thereby affecting the ultimate reservoir storage volumes. Compared to the underground natural gas storage, higher capillary entry pressures are expected to occur for hydrogen due to its higher interfacial tension (Hassanpouryouzband et al. 2021; Naylor et al. 2011). Therefore, hydrogen can be stored at a higher pressure in the reservoir than methane, with a reduced risk of geomechanical failure.
On the hydrogen injection into a storage reservoir, a very small fraction of hydrogen will dissolve into the formation fluids (Chabab et al. 2020), and water vapour may contaminate the hydrogen phase due to chemical disequilibrium. Hydrogen losses through diffusion need to be considered, as the diffusion ability of hydrogen is several times more than that of CO2 and methane, to such an extent that hydrogen can travel between the structures of ice-like crystals (Hassanpouryouzband et al. 2020).
In order to show the influence of the large density difference (Fig. 11) between the injected gas (hydrogen) and the resident formation fluid (brine) on the hydrogen plume migration during the seasonal storage period, we numerically simulate the injection of 10-ton kg of hydrogen over 10 days and its storage for 35 days. We used the numerical simulator PorousFlow Module, open-source software for solving parallel tightly coupled nonlinear THM processes in porous media (Wilkins et al. 2021; Wilkins et al. 2020). It is based on the MOOSE framework (Gaston et al. 2009) and its internal architecture relies on state-of-the-art libraries for finite element analysis (Kirk et al. 2006) and nonlinear iterative algebraic solvers (Balay et al. 2019). The simulation results are shown in Fig. 11. It is shown from the simulation standpoint that the leakage rate of hydrogen is going to be the biggest challenge due to the very high mobility of hydrogen, the small molecule size, the high dispersion rate and the large density difference between the hydrogen and brine. Therefore, a proper tightness assessment of the caprock above the reservoir is required to prove its effectiveness for any possible hydrogen leakage. In addition, we propose expressly storing H2/CH4 gas mixtures to improve the density contrast with the water. The mixed gas can, upon demand, then be extracted and transported in the same natural gas pipelines.

Hydrogen–brine displacement in an idealised 2D horizontal cross section (i.e. geological storage formation). The injection wellbore is located at the left-hand side of the simulated domain. The subfigures are showing only the first 50 m horizontal distance from the injection well with 10 × horizontal exaggeration. The horizontal exaggeration is 10x. [A] the reservoir is fully saturated with brine (i.e. before the hydrogen injection start). The migration of the hydrogen phase after [B] 9 days, [C] 23 days, [D] 36 days and [E] 45 days
Subsurface microorganisms, including methanogens, sulphate reducers, homoacetogenic bacteria and iron(iii) reducers can make use of H2 as an electron donor, which may lead to an unwanted accumulation of biomass in the vicinity of the injection borehole and/or loss of H2 (Ganzer et al. 2013; Hagemann et al. 2015a). The local rate of the biochemical reactions depends on the number of the particular microorganism (Hagemann et al. 2015b). Hence, an important problem for the modelling of USHS is the description of microbial growth and decay functions. Microbial conversion of hydrogen can only occur if the hydrogen is in the aqueous phase. A mixture of hydrogen with another gas means it will have a lower partial pressure and hence lower solubility in water. It was stated that if the temperature of the formation is higher than 122ºC or the salinity is higher than 5 M NaCl, the hydrogenotrophic microbial activity becomes highly unlikely (Thaysen and Katriona 2020). Hence, if a storage reservoir is hot enough, one can combine hydrogen storage with CO2, since methanogenic microbial activity will be limited by the temperature constraint. Further, a high-pressure environment is toxic for some microorganisms.
Considering the deep depleted gas-condensate reservoirs, the risks are minimised here due to the presence of well-defined geological traps related to previously formed gas reservoirs. Unfortunately, the risk of migration from the target storage formation cannot be eliminated completely, particularly due to the re-pressurisation and change of the stresses and the long-term well integrity issues of the casing and cement.
Salt caverns
Another underground storage medium, which could be used under certain conditions and locations, is the usage of salts caverns as high-pressure gas storage facilities (Fig. 10) (Gabrielli et al. 2020; Hassanpouryouzband et al. 2021; Pudlo et al. 2013; Foh et al. 1979). Based on energy storage capacity (GWh) and discharge timescale, storing hydrogen in salt caverns can afford utility-scale, long-duration energy storage to meet the market need to shift excess off-peak energy to meet dispatchable on-peak demand. Salt caverns can hold substantial promise due to the self-sealing nature of the salt and the ability to customise the size and often shape of the caverns (Lord et al. 2014). However, the inaccessibility of the salt caverns in the area where hydrogen production is can be a limiting factor.
Salt caverns can be artificially constructed in the salt formation (or salt dome) by injecting water through an access wellbore, dissolving the salt and generating large volumes of brine in the so-called solution mining process. This process is associated with retrieving a large quantity of brine which requires disposal in an eco-environmental way. Finding suitable disposal repositories for brine disposal can be economically problematic due to higher costs for constructing longer pipelines which eventually may slow down or even hinder the permitting process. During the hydrogen withdrawing from the caverns under constant pressure, part of this saturated brine can be injected into the caverns to maintain the caverns' pressure and stability. Cushion gas, therefore, is not needed under these operating conditions (Foh et al. 1979; Taylor et al. 1986).
Compared to depleted oil and gas reservoirs, the key advantages for storing hydrogen in salt caverns are: (1) salt surrounding the caverns is highly impermeable and virtually leakproof where the only possibility for gas loss is escaped through leaky wells (Lord et al. 2014). (2) Salt does not react with hydrogen (Bünger et al. 2016). (3) Withdrawal of ‘discharge’ of hydrogen is highly flexible in rate, duration and volume with lower cushion gas requirements to avoid rock breakage. (4) Caverns are a mature, financeable storage technology that has been successfully used to store compressed gases for over 75 years with possible extensions for USHS.
The city of Kiel’s public utility, as an illustration, has been storing town gas with a hydrogen content of 60–65% in a gas cavern with a geometric volume of about 32,000 m3 and a pressure of 8–16 MPa at a depth of 1330 m since 1971 (Kruck et al. 2013; Carpetis, 1988) estimated the hydrogen storage capacity for cavern volume of 500,000 m3 and a casing shoe depth of 1000 m a pressure range of 180 to 60 bar is suitable of 4.0 Mio kg hydrogen (47 Mio m3(st)) and a cushion gas of 2.2 Mio kg (26 Mio m3(st)). For an economic prospect, the total installed costs, including wellbore drilling, compressors and gas treatment, were estimated to be about € 100 million (Michalski et al., 2017). Compared to energy storage in Li-ion batteries with a cost of 100 €/kWh, USHS in salt caverns offers a significant cost reduction potential in the total investment cost by a factor of 100.
Storage of hydrogen in the form of methane (natural gas) may be a preferable alternative for overcoming the storage problems associated with storing pure hydrogen in geological formations. When there is a surplus of renewable energy in the summer, hydrogen can be produced through water electrolysis. Furthermore, when this hydrogen and carbon dioxide combine in the methanation reaction, methane is produced, which can then be stored in a geological reservoir for winter use. This could be accomplished through a methane reforming reaction followed by using a fuel cell to generate electricity that can be fed into the power grid.
In short, hydrogen storage in a geological medium can offer a viable option for utility-scale, long-duration energy storage, allowing the hydrogen economy to grow to the size necessary to achieve net-zero emissions by 2050. While the operational experience of storing town gas in salt caverns provides considerable proof of its viability and operational best practice, full-scale deployment of USHS has yet to be evaluated for any associated risks and public acceptance of viewpoints, similar to the potential for induced seismicity.
Hydrogen utilisation
Fuel and power systems
Globally, the heat generated from domestic as well as industrial activities contributes by 33 and 50% of the carbon dioxide emissions and universal energy consumption rate, respectively (Dodds et al. 2015). The majority of gaseous emitted by the conventional burning process of natural gas are implicated in numerous environmental contamination issues (i.e. greenhouse gaseous emissions). The primary source of carbon dioxide emissions was energy consumption, with a global emissions rate of 33.1 gigatonnes in 2018, mainly resulting from the burning of fossil fuels. Contrarily, applying hydrogen gas as an alternative fuel to natural gas has proved to be an efficient pathway to reduce greenhouse gaseous emissions. Once it is generated from renewable energy sources, as shown in Fig. 1, it can directly participate in the decarbonisation process in the energy sector thanks to its reacting nature, whether combusted or utilised in the fuel cell. The hydrogen is currently produced by conventional (non-renewable sources) of 18%, 30% and 48% from coal, heavy oil/naphtha and natural gas, respectively, which was negatively responsible for releasing about million 560 tonnes of carbon dioxide per year (Lui et al. 2020).
Moreover, given the costly natural gas employed throughout the power-producing framework (i.e. requires a huge area to store), hydrogen appears to be a viable option as a fuel feeding to gas turbines (Bicer and Khalid 2020). The utilisation of hydrogen in the central heating system instead of natural gas offers numerous merits: comparable operational activity and an increased heat generation rate with minimal harmful emissions (Dodds et al. 2015). Several factors, such as the Wobbe index, should be considered before forwarding hydrogen to various appliances. Generally, Wobbe index values differ considering the chemical composition of the gas. The Wobbe index number of pure hydrogen is about 48 MJ/m3; it falls within the permissible natural gas integrity extent for the vast majority of burners (Zachariah-Wolff et al. 2007). Supplying the operating system with a fuel beyond the Wobbe index band can negatively result in some operational problems (i.e. incomplete combustion and burner overheating). Clearly, attributing to the hydrogen's higher combustion velocity compared with the natural gas fuel, advanced burners with specialised technical specifications must be operated with hydrogen as a fuel feed stream.
Furthermore, the overabundant electricity generated from power facilities can be transformed into hydrogen, which can be either directed to the existing natural system (direct consumption) or chemically converted into chemicals used in different industrial aspects (Collet et al. 2017). Besides, hydrogen can be used individually in the aerospace industry or in combination with oxygen as propellants. The mentioned liquid mixture (oxygen and liquid) generates a large amount of energy and makes it more suitable for space applications. Because of releasing water during hydrogen combustion, in addition to its high efficacy compared with gasoline, these characters qualify it to be employed as an automotive fuel (Gurz et al. 2017).
Hydrogen employment in power systems
Hydrogen is enormously used to store and transport energy in a variety of power applications, typically illustrated in Fig. 1 and discussed as follows (Parra et al. 2019):
Storing of energy and auxiliary services
Given the hydrogen's high storing efficacy, hydrogen-based energy storage has gained traction for storing energy over a medium/long term and in auxiliary services in the last decades. It can meet energy storage requirements over a broad timescales to avoid any defect (shortage) that may occur between the product and the demand (required) of energy (Al Shaqsi et al. 2020). Recently, renewable energy production has grown rapidly; however, certain renewable energy supplies are sporadic and seasonally dependent. As a result, the produced renewable energy should be stored in a dependable form that is resistant to the fluctuation in those energy sources (Mehrjerdi et al. 2019). In particular, the most popular types of energy storage are: (1) power-to-power, (2) power-to-heat and (3) power-to-gas (Widera 2020). Hydrogen, in comparison, has a large energy storing capacity, a great storing time and flexibility. It has the ability to reduce energy volatility and absorb the surplus of energy production. Practically, it can deal with the economic and seasonal variations issues. Hydrogen can exceptionally balance between the resultant and required energies by storing the surplus energy when the production rate exceeds the required one as well as in times at which the electricity's price is minimal and reuse it in the opposite cases. Contrarily, hydrogen can be forwarded to generate electricity in the high energy demand.
Moreover, the storing capacity of hydrogen is higher than batteries, as it may range to weeks or months, unlike batteries that may extend (limited) for hours (Bocklisch 2016). Otherwise, hydrogen can be subjected to transform renewable resources to produce energy during different climatic conditions in different seasons. The storage capacity of hydrogen is estimated to reach up to megawatt-hours (1000 Kilowatts hours), even terawatts-hours, which is considered a high value by considering that of batteries (i.e. kilowatts hours). A slew of hydrogen power storage plants has been commenced worldwide, showing the technology's potency for the large scale. Examples of power plants established to produce and store hydrogen are Underground Sun Storage, Orsted and SoCalGas in Austria, Denmark and USA, respectively (Home | SoCalGas, https://www.socalgas.com).
In the Underground Sun Storage, the energy derived from wind and solar renewable resources is stored beneath the earth's surface. Referring to the difficult storing of the produced energy from renewable resources, the rest released power in reprocessed into hydrogen via electrolysis process and conserved for the futuristic challenges. The findings of the plant outlines revealed that it has the efficiency to equilibrate the basic energy requirements in line with the various seasonal variations. Other projects were established to face the shortage between the system supply and demand. Orsted plant was designed to operate the electrolysers by subjecting the oversupply of energy generated from wind farms to them. Another project launched by SoCalGas on campus succeeded in directly converting the produced hydrogen from the solar electric system into methane inside a bioreactor.
Besides, hydrogen is hugely accounted as an assistant tool for providing the energy sector (grid) with the necessary services such as frequency maintenance and voltage strengthening via electrolysers and fuel cells (Bird et al. 2016). In the HAEOLUS facility (Haeolus. https://www.haeolus.eu/), the oversupply of wind generation is directly fed into an electrolyser to generate hydrogen, which is subsequently forwarded into fuel cells to be used later for various purposes (utilities, data transmittance, systems controlling and others) (Larscheid et al. 2018). Another form of energy storage can be achieved by regulating the grid frequency near its normal value (50–60 Hz) by injecting or consuming energy in a coordinated manner to maintain the gap between the product and the required power. Numerous regulation reserves have been installed in different European grid systems. Commonly, frequent containment and restoration reserves have been used to handle the frequencies through the distributed control systems. The first mentioned controlling scenario supplies a steady feed stream in case of occurring a sudden corruption in frequency in a very short period, whereas the latter can tolerate a longer corruption beyond the 30 s. The twice services can be attained via electrolysers and fuel cells by incrementing or decreasing their power setpoints related to frequency signals (Alshehri et al. 2019).
Besides, hydrogen-based equipment can contribute to voltage support by adjusting their power factor to meet the local voltage support requirements, which can be accomplished using inverter or rectifier monitoring systems (Alshehri et al. 2019). Some troubles such as blackout can occur in power plants, which was conventionally faced using a diesel Genset. The use of fuel cells may have the advantage to realise this scope given its no emissions and noiseless nature. These studies imply the profitability of hydrogen scaling up in the power sector.
Power-to-gas
Power-to-gas is a process in which electrical energy is used to generate a combustible gas. Since hydrogen is thought to be a combustible gas with a large power density, power-to-hydrogen technologies are increasing (Eveloy and Gebreegziabher 2018). Because of the combustibility nature of hydrogen, it has been inserted into gas applications. The hydrogen generated from the electrolyser can be converted into methane by the methanation process, which is either pumped to the natural gas grid operating system or stored to achieve the financial budget for the energy market (Gondal 2019). By the literature, numerous pilot projects have been commenced worldwide with the highest establishment rate of 85% in Europe, followed by the USA and Japan (Thema et al. 2019). Among different European countries, Germany constructed a power-to-gas plant with a maximum production capacity of (40–100 megawatts) to be directed for industrial purposes, and it will pump in the natural gas grid operating system from 2022 (Romeo et al. 2020).
Furthermore, several power-to-gas infrastructures have been installed in the regions rich in solar and wind renewable resources. A realistic study is displayed in the HAEOLUS project (north of Norway). Chiefly, its core idea was based on using 2.5 Megawatts proton exchange membrane electrolyser to transform the produced wind power generated from wind farms into hydrogen, which can be consumed in various aspects. HyCAUNAIS project displays the viability of running a resilient power to gas facility in conjunction with the methanation approach by equipping a nominal 1 megawatts electrolysis area to produce hydrogen, which was methanated and inserted into natural gas grid operating system or combined with biomethane generation area from landfill biogas (HYCAUNAIS – Storengy – Europe en BFC. https://www.europe-bfc.eu/beneficiaire/hycaunais-storengy/).
Fuel cells
Lately, fuel cells have gained worldwide attention as efficient and environmentally friendly energy generators. Practically, they are integrated electrochemical devices widely used to convert the delivered chemical energy into its electrical counterpart via redox reactions (Yuan et al. 2021). Regarding their efficacy for energy generation, they can be served as energy carriers. Fuel cells are composed of two electrodes (i.e. anode and cathode) separated by electrolytes responsible for the migration of ions between electrodes (Ogawa et al. 2018). There are numerous types of fuel cells such as alkaline fuel cell, direct carbon fuel cell, direct methanol fuel cell, microbial fuel cells, molten carbonate fuel cells, phosphoric acid fuel cell, proton exchange membrane fuel cells and solid acid fuel cells.
Table 7 displays different types of fuel cells with their operational conditions and efficiency%. During system operation, hydrogen is passed to the anode while oxygen is passed to the cathode. At the anode, the hydrogen molecules are split into protons and electrons by a catalyst. The positive hydrogen particles can pass through the membrane to the cathode side, but the negative cannot. However, electrons change their path by being forced to the circuit and generating electric current. At the cathode, the hydrogen protons, electrons and oxygen combine to produce a water molecule which is the end product of this reaction. Among different types of fuels (i.e. hydrocarbons and chemical hydrides), applying hydrogen in fuel cells is eco-friendly because it does not expel any pollutants (Psoma and Sattler 2002). It works within low temperatures ranges comparing with the internal combustion engine. As mentioned before, the end product of the hydrogen-based fuel cell is water, whereas the end products of diesel/natural gas-based fuel cells are carbon dioxide and greenhouse gases (Xu et al. 2021). The main differences between fuel cells and traditional batteries are presented as follow: (1) operational mode of fuel cells is mostly like the traditional batteries, but the latter requires an electrical powering to run, (2) batteries can store hydrogen, unlike fuel cells that can provide a continuous electricity supply wherever hydrogen (fuel) and oxygen (oxidising agent) are available from outside sources. In addition to the mentioned differences, the batteries electrodes are steadily consumed during their extended usage, which entirely differs (not found) in the fuel cells (Spingler et al. 2017; Aydın et al. 2018).
Co-generation and tri-generation distribution systems
Interestingly, fuel cells can be employed to optimise the efficiency of different power systems and reduce the overall production cost of these processes in several aspects, including co-generation systems (i.e. heat + power/cold + power) or tri-generation systems (i.e. cold + heat + power). Co-generation is the sequential generation of two different forms of beneficial energy from a primary single source (fuel cells). In that case, the electricity generated from fuel cells is used to meet the electrical demand, and the released heat is directed towards the heating activities. As a result, total efficiency will be about 95%. Systematically, co-generation fuel cell systems consist of different components, including fuel processors, power suppliers, heat recovery unit, energy (thermal/electrochemical) storage unit, control devices, additional apparatus (i.e. pumps) and stack. Commercially, a large number of facilities have been launched to improve the performance of co-generation systems. Different co-generation projects were erected around the world. In Japan, the plant installed by the ENE-FARM project (300,000 units/2018) simultaneously supplied the home with electricity and heat necessary for daily activities by using proton exchange membrane fuel cells ranged from 0.3 to 1 kilowatt. Initially, liquefied petroleum gas feedstock streams are fed into a reformer, where they are converted into hydrogen, which is further combined with oxygen inside the fuel cells to produce water, electricity and heat used later for various residential purposes (Yue et al. 2021). Recently, the manufacturing of micro-co-generation fuel cells has grown in Europe. Besides, more than 1000 micro-combined heat and power fuel cells were launched in 10 European countries between 2012 and 2017. The primary European plant for a micro-co-generation fuel cell was the ENE. Field project (ene.field. http://enefield.eu/). An LCA study was successfully performed for the mentioned project, and simply it revealed that co-generation fuel cell was environmentally in nature compared with other gas boilers and heat pumps strategies considering its less greenhouse gaseous emissions. PACE was another project, firstly started in 216, whereas about 2800 of combined heat and power fuel cells are fabricated. Briefly, the overall development in the electrical efficiency through the two inspected projects were 60 and 95%, respectively (Home - PACE Pathway to a competitive European fuel cell micro-cogeneration market. https://pace-energy.eu/).
Tri-generation strategy is an improved strategy of co-generation in which a single primary source achieves the required cooling by thermally driven equipment. The working principle of heat pumps mainly stands on producing cooling from a thermal source. Typically, this can be achieved by using condenser and evaporator types of equipment. The gas released from absorbent/adsorbent is cooled down in the condenser and converted into a liquid by releasing its heat (refrigeration process). Then, the cooled down fluid continues to an evaporator, whereas it is evaporated by losing its contained heat. Significantly, the tri-generation fuel cells simultaneously reduce carbon emissions and enhance energy efficacy (Yue et al. 2021). Fong and Lee (2014) reported that employing a 593 kilowatts solid oxide fuel cell and absorption chillers, the carbon emissions were notably decreased by about 50% with an increase in the energy efficacy up to 75% (Fong and Lee 2014). A simulated 339 kilowatts solid oxide fuel cell combined with a combustor and a heat recuperation system proficiently recovered about 267 kilowatts of heat with an efficacy of 84%. Besides, they announced that 339 kilowatts solid oxide fuel cells provided with an absorption chiller generated about 303.6 kilowatts of cold with an efficacy of 89% (Yu et al. 2011).
Transportation sector
Compared with conventional battery-powered powertrains, vehicles based on hydrogen fuel (hydrogen-fuelled vehicles) represent a promising solution to surpass them. Globally, the sales rate of hydrogen-fuelled vehicles is anticipated to be 3% and enhanced up to 36% in 2030 and 2050, respectively (Path to Hydrogen Competitiveness: A Cost Perspective - Hydrogen Council. https://hydrogencouncil.com/en/). Currently, innumerable vehicles companies are developing their operating system to be hydrogen-based, attributing to its dependability and quality. Toyota has evolved Mirai fuel cell vehicles by using proton exchange membrane fuel cells with a volume power density and maximum power productivity of 3.1 km/L and 144 kilowatts, respectively. The hydrogen-fuelled vehicles can be driven by different forms of hydrogen (i.e. liquid and compressed). The compressed (high pressurised) hydrogen is the most appropriate form in the vehicles storage system of Clarity and NEXO; hydrogen-based fuel cell vehicles developed by Honda and Hyundai companies, respectively. At the same time, liquid hydrogen operates Hydrogen 7 vehicle improved by BMW company (Yue et al. 2021). Moreover, regional multi-unit trains powered by hydrogen have been entered into service in Europe and are projected to gain more economic benefits. Approximately 30% of presently employed diesel fleets may be phased out in the future (Study on the use of Fuel Cells and Hydrogen in the Railway Environment - Shift2Rail. https://shift2rail.org/publications/study-on-the-use-of-fuel-cells-and-hydrogen-in-the-railway-environment/).
Among different modes of transportation, the aviation division is regarded as the fastest transportation mode with anticipated annual growth in air traffic. The most common aircraft fuel is kerosene. Various aviation fuels often display a set of specifications, such as resistance to corrosion and severe temperature changes (Tzanetis et al. 2017). It is worth noting that petroleum accounts for the majority of the fuel used in the aviation sector. To improve energy preservation and reduce the negative environmental effects of fossil fuels, alternative, less harmful fuels such as liquid hydrogen are developed and thought to be eco-friendly. Table 8 presents some variations in the physicochemical properties between hydrogen and kerosene fuels. Refrigerated hydrogen fuel can be potentially better than kerosene as aviation fuel. It emits fewer greenhouse gaseous emissions and is easily produced from a variety of sources. Aside from that, the operating hydrogen-fuelled aircraft is characterised by minimal maintenance costs, long lifetime engines, high energy content and better combustion.
Furthermore, some constraints may arise during hydrogen utilisation as aviation fuel, such as depressed ignition energy, high flammability and the possibility of unburned traces forming that promotes metal embrittlement. Furthermore, the hydrogen admission with the onboard technology instead of inserting into the grid commercially allows its manufacturing companies to resell it (Nanda et al. 2017). The National Renewable Energy Laboratory manifested that the hydrogen cost in the mentioned case ranges from 3 to 10 USD/Kg, while the most traded hydrogen cost is about 13.99 USD/Kg. To sum up, liquid hydrogen presents admirable efficacy as an aviation fuel for reducing greenhouse gaseous emissions, resulting in a significant improvement in air quality. Furthermore, by using hydrogen-based aviation fuels, over-reliance on traditional fuels could be decreased. The total cost of aircraft powered by liquid hydrogen is predominately associated with the cost of production and storage technologies (Eichman et al. 2012).
Recently, the global navigation movement in terms of maritime shipping has become increasingly important in the movement of different types of goods worldwide, which is in line with tremendous industrial progress in various fields. Unfortunately, this, in turn, led to an increase in the consumption of conventional fuels (i.e. diesel and heavy fuels). Regrettably, the pollution created by ships significantly implicates about 2.5% of the universal greenhouse gaseous emissions. Furthermore, bunkering activities broadly contribute to the leakage of heavy fuels in the aquatic environment, consequently posing a threat to the ecosystem. It was announced that carbon dioxide emissions associated with shipping activities release about 3.3% of the global emissions (Vogler and Sattler 2016). Other gaseous emissions such as nitrogen oxide and sulphur oxide are also associated with shipping activities. Accordingly, the maritime industry seeks more environmentally alternative fuels than conventional ones to overcome these obstacles (Prussi et al. 2021). Numerous suitable substitutes in different states, gas (i.e. hydrogen, propane) and liquid (i.e. bio-oil, methanol and ethanol) are used to compensate for the usage of traditional fuels (Al-Enazi et al. 2021; Abou Rjeily et al. 2021). Among them, hydrogen can be employed in maritime activities in two routes: (1) internal combustion engines and (2) fuel cells (Banawan et al. 2010). Relatively, fuel cells meet the energy requirements needed by ships sailing for long distances travelling and supply the ancillary energy requirements of larger ships in contrast to the other battery-powered ones. Numerous studies have been conducted to assess the feasibility of using hydrogen in maritime activities. Deniz and Zincir (2016) stated that hydrogen had a durable, safe and bunker capability criterion, qualifying as a favourable fuel for shipping. Although they reported that liquefied natural gas has the preference to be used as an alternative fuel, they recommended more research studies on utilising hydrogen as an effective alternative fuel (Deniz and Zincir 2016).
Production of hydrocarbon fuels
Production of hydrocarbon fuels via Fischer–Trospch pathway
Syngas (synthesis gas), a mixture of carbon monoxide and hydrogen, is a product of different thermochemical conversion processes (i.e. pyrolysis, gasification and others) and can be utilised by two scenarios: (1) direct fuel or (2) transformed into transportation fuels via Fischer–Trospch synthesis process and syngas fermentation (Wainaina et al. 2018). The two strategies are categorised as gas-to-liquid transformation strategies that can generate hydrocarbon fuels and alcohols based on syngas feedstock stream (Gruber et al. 2019). Normally, the Fischer–Trospch strategy (exothermic) operates at 200–350 °C and 1.5–4 MPa for reaction temperature and pressure, respectively (Okolie et al. 2019). Majorly, it comprises three main stages: (1) syngas production, (2) syngas treatment and (3) transforming into hydrocarbon fuels associated with their upgrading. Besides the production process of transportation fuel, other valuable products (i.e. paraffin, naphtha and others) can be produced. Significantly, the as-produced green fuels based on the Fischer–Trospch process have numerous advantages over petroleum-based fuels. They have excellent burning characters, elevated smoking points and free of heavy contaminants. The physicochemical properties of resultant fuels depend heavily on reaction conditions (i.e. reactor type, heating rate, residence time and others) (Sun et al. 2017). The given equations from (Eqs. 9, 10, 11, 12, 13, 14 and 15) explicates the synthesis of different products (i.e. alkanes, alkenes, oxygenated products, methanol, ethanol and dimethyl ether via the Fischer–Trospch process by participating in hydrogen. The hydrogen/carbon monoxide ratio is a critical controlling parameter in the Fischer–Trospch synthesis process (Bermudez and Fidalgo 2016). Different types of catalysts (i.e. copper-based catalysts) can be used to optimise the yield of the Fischer–Trospch process.
Synthesis of alkanes:
Synthesis of alkenes:
Synthesis of alcohols:
Synthesis of carbonyl:
Synthesis of ethanol:
Synthesis of methanol:
A ratio of H2/ CO of 2:1 is preferable for the synthesis of hydrocarbon fuels via water—gas shift reaction as given in Eq. 15:
Dimethyl ether is admirable commonly realised as an efficient alternate for diesel fuel (Kim and Park 2016). Distinctly, numerous physicochemical features characterise liquefied petroleum gas, such as anti-corrosive, anti-carcinogenic, less nitrogen oxide and carbon monoxide emissions during its burning, less engine noise and high cetane number (Dincer and Bicer, 2020). In general, dimethyl ether can be produced by (1) direct route (combined single step of methanol synthesis and dehydration) or (2) indirect route (separated methanol synthesis and dehydration steps) as shown in Eqs. (16, 17 and 18) (Gogate, 2018):
Direct route (single step):
Indirect route (two steps):
Synthesis of methanol:
Dehydration of methanol:
Production of hydrocarbon fuels via Syngas fermentation pathway
Syngas fermentation (biorefining) pathway is regarded as the interconnection between the biochemical and thermochemical scenarios (Thi et al. 2020). It produces value-added products (i.e. alcohols) from syngas by flexibly employing several groups of microorganisms at different reaction temperatures of 37–40 °C and 55–90 °C for mesophilic (i.e. Clostridium autoethanogenum) and thermophilic (i.e. Moorella thermoacetica), respectively. During the process, the feedstock of syngas can be simply converted into alcohols (i.e. ethanol) via two subsequent stages via (1) producing acetyl coenzyme A and then (2) its transformation into ethanol. Other alcohols and chemicals (i.e. acetate, butanol and formate) can be synthesised by acetogenic bacteria (Park et al. 2017). Regarding several operational advantages characterised to syngas fermentation such as (1) no necessity for using costly pretreatment step, (2) process' versatility with different biomass composition, (3) independent on the hydrogen/carbon monoxide ratio in the feedstock upstream, (4) high selectivity of as-used microorganisms and (5) moderate (ambient) working parameters with no necessity for catalysts usage or its poising trouble, they support it over the Fischer–Trospch process. However, there are some operational challenges such as (1) weak solubility of the gas in the liquid state, (2) complicated bioreactor design, (3) existence of impurities and (4) low yield of production. Briefly, integration between different thermochemical, biochemical and hydrothermal routes can effectively compensate for the shortage of individual techniques and maximise productivity (Rigueto et al. 2020).
Refining of crude oil and petroleum products
Commercially, hydrogen is conceived as an upgrading (improving) agent for crude oil products and petroleum distillates in terms of hydrocracking and hydroprocessing and processes. The hydrocracking process is defined as treating heavier hydrocarbons with hydrogen to simultaneously split them into lighter derivatives and enhance the hydrogen/carbon ratio (El-Sawy et al. 2020). In hydroprocessing, various heteroatoms such as nitrogen, sulphur, oxygen and heavy metals are majorly captured from petroleum products via different treatment processes named: hydrodenitrogenation (Dasgupta and Atta 2020), hydrodesulphurisation (Han et al. 2018), hydrodeoxygenation (Yfanti and Lemonidou 2020) and hydrodemetallisation (Rana et al. 2020), respectively, as displayed in Eqs. (19–21).
Hydrodenitrogenation:
Hydrodesulphurisation:
Hydrodeoxygenation:
This can be achieved by reacting the upstream feedstock (heavy oils and petroleum products) with hydrogen through catalytic reaction, resulting in removing these contaminants and saturating the aromatics (C–C) bonds. The elimination process of these contaminates from feedstocks directly contributes to fuel upgrading because they deactivate the as-used catalysts due to their adsorption on the surfaces of the catalyst (blocking of active catalyst sites). Recently, the appeal for inserting hydrogen in hydroprocessing has been increasingly growing (Al Obaidi et al. 2018). From the environmental point of view, the key cause of this pattern is the combination of strict environmental legislation governing gaseous greenhouse emissions and other particulate contaminants, as well as product quality specifications. Generally, numerous upgrading techniques are directed to improve the physicochemical properties of heavy oils by decreasing their viscosity and carbon/hydrogen ratio at the same time (Misra et al. 2017).
Production of ammonia
Ammonia is deemed one of the essential chemicals largely employed in industrial fertiliser activities with huge global production rates. The biggest ammonia production plant has projected to achieve a daily capacity rate of 3300 metric tons (Brightling 2018). Broadly, ammonia can be introduced as fertiliser in the agriculture sector. Additionally, it is provided to various industries such as polymers processing, explosives, refrigerant, pharmaceuticals, gas sensors and fuel cells. The ammonia synthesis process is promoted by the catalytic reaction between hydrogen and nitrogen elements through the Haber process (Arora et al. 2018). It is performed in the as-designed reactor under operating conditions of 20–30 Mpa and 300–500 °C for pressure and temperature, respectively, using KOH-promoted finely divided iron catalysts with the required energy of 2.5 EJ (Tolod et al. 2019).
Moreover, the hydrogen addressed to the ammonia synthesis process is primarily derived from steam gas reforming, which is not regarded as environmentally friendly. Accordingly, there is an increasing interest in other green and sustainable ammonia synthesis pathways, such as electrochemical hydrogen manufacturing techniques and photocatalytic nitrogen fixation (artificial photocatalysis). The distinctiveness of the electrochemical ammonia synthesis pathways routes is controlled by the employed energy sources. Hydrogen can be generated from water employing an electrolysis process using renewable green sources (i.e. wind and solar energy) and, hence, reduce harmful greenhouse gaseous emissions (Bicer and Dincer 2017).
Metallurgical industries
Generally, hydrogen can produce oxy-hydrogen flames in industrial metallurgical activities and act as a reducing agent to obtain metals from their ores. During the oxy-hydrogen flames synthesis process (exothermic reaction), hydrogen is allowed to react with oxygen at very high temperatures (3000 °C) to produce oxy-hydrogen flames, used later for cutting and welding working on non-ferrous metals (Polverino et al. 2019). Otherwise, hydrogen is reliably characterised by its high ability to recover (reduce) metals from the aqueous solutions of their salts (hydrogen reduction). The metals may be powdered for later metallurgical usage or incorporated into a composite material. Chemically, hydrogen can interact with the elements of periodic tables in three ways: (1) ionic bond formation between the elements of Ia and IIa groups, (2) interstitial solid solution between the elements of VIa, VIIa and VIII groups and (3) metallic bond between elements of IIIa, Iva and Va groups. Additionally, the electrostatic shielding phenomenon can be generated by attributing the hydrogen's capability to capture free electrons and the self-trapping of metals. Likewise, the small particle size of hydrogen effectively facilitates the process of metal–hydrogen interaction (Agrawal et al. 2006).
Conclusion
To ensure the long-term production of clean and green hydrogen, it is crucial to conduct a critical assessment of various production routes and their environmental impacts, as well as seasonal storage and utilisation options. Hydrogen is produced from either fossil-based or renewable feedstocks; however, each route has advantages and disadvantages. The current hydrogen colour coding is imprecise, assuming that green hydrogen always has lower carbon emissions than blue or grey hydrogen, which is not always accurate.
Water electrolysis is gaining momentum; however, meeting 24% of energy demand with hydrogen in a 1.5-degree scenario of climate change mitigation will necessitate massive amounts of additional renewable electricity generation. In this scenario, approximately 31,320 terawatt-hours of electricity would be required to power electrolysers, which is more than is currently produced globally from all sources combined. Furthermore, > $11 trillion in manufacturing, storage and transportation infrastructure would be needed. The affordability and accessibility of freshwater is one side of the coin, and the proximity of these two supplies, i.e. renewable energy and freshwater, is the other. Water electrolysis research priorities include lowering the capital cost of electrolysis technology, locating water resources, find utilisation routes for the produced oxygen and increasing the efficiency of the process.
In terms of biomass gasification, the economic feasibility of producing hydrogen from biomass must be closely related to the availability and affordability of raw materials in the surrounding area. The main characteristics of the supply materials are the biomass physicochemical properties, distribution and hydrogen rate. Because biomass feedstocks differ greatly in structural composition and shape, all of these factors must be considered when combining the feedstock with the appropriate conversion technology. In conclusion, there are challenges associated with the most common hydrogen generation routes, such as steam methane reforming, water electrolysis, coal or biomass gasification, methane pyrolysis with or without carbon capture and storage technology.
To understand advances in evaluating environmental impacts due to hydrogen production, we performed an intensive critical review of 24 life cycle assessment studies published from 2019 to 2021, including methods and findings. The important methodological approaches and key findings observed were:
-
1.
No two life cycle assessment studies were identified to be similar. There were differences in the geographical and temporal span, functional units and system boundaries considered, and environmental impact categories assessed. Therefore, it is recommended that the policymakers pay heed to the modelled processes and extent of the system boundary for making decisions for creating a sustainable hydrogen economy.
-
2.
Many life cycle assessment studies did not encompass processes, inputs and outputs for ‘cradle-to-grave’ analysis. Thus, future research should pay more attention to ‘cradle-to-grave’ evaluation for robust decision-making.
-
3.
In addition to the global warming potential and depletion of fossil fuels, environmental impacts in more categories for hydrogen production processes must be evaluated.
Furthermore, large-scale energy storage is key in securing the energy supply chain for the next energy transition using electrolysis-generated hydrogen. The Underground Seasonal Hydrogen Storage (USHS) holds great potential to overcome the natural temporal fluctuations inherent in renewable energy production at the scale required to achieve net-zero by 2050. The selection of geological porous media for USHS should be based on a comprehensive geological investigation that includes an assessment of their utility on both a basin and regional scale, fluid flow behaviour of hydrogen in brine-saturated subsurface reservoirs, an assessment of storage capacity, the safety of long-term storage, geochemical and biological reactions triggered by hydrogen injection, the geomechanical response of the subsurface to hydrogen storage and other measures. The discussed procedures can lead to informed decision-making in terms of forecasting best-operating strategies and ensuring safe and efficient hydrogen storage installation. Further research to integrate the theoretical studies with existing experimental USHS trials is required to minimise the uncertainty that might be associated with the feasibility of large-scale hydrogen storage. Finally, blending the need with the various utilisation routes such as fuel production, ammonia production, metallurgical industries and power systems is crucial in the hydrogen economy.
Change history
31 March 2022
A Correction to this paper has been published: https://doi.org/10.1007/s10311-022-01432-x
Abbreviations
- CCSU:
-
Carbon capture storage and utilisation
- Eq:
-
Equivalent
- LCA:
-
Life cycle assessment
- LCOH:
-
Levelised cost of hydrogen
- WGSR:
-
Water–gas shift reaction
- USHS:
-
Underground Seasonal Hydrogen Storage
- PEMFCs:
-
Proton exchange membrane fuel cells
- PAFCs:
-
Phosphoric acid fuel cells
- SOFCs:
-
Solid oxide fuel cells
- MCFCs:
-
Molten carbonate fuel cells
- DMFCs:
-
Direct methanol fuel cells
References
Abe JO et al (2019) Hydrogen energy, economy and storage: review and recommendation. Int J Hydrog Energy. 44:15072–15086. https://doi.org/10.1016/j.ijhydene.2019.04.068
Abou Rjeily M et al (2021) Pyrolysis-catalytic upgrading of bio-oil and pyrolysis-catalytic steam reforming of biogas: a review. Environ Chem Lett 19:2825–2872. https://doi.org/10.1007/s10311-021-01190-2
Acar C, Dincer I (2019) Review and evaluation of hydrogen production options for better environment. J Clean Product. 218:835–849. https://doi.org/10.1016/j.jclepro.2019.02.046
Agrawal A et al (2006) A comprehensive review on the hydro metallurgical process for the production of nickel and copper powders by hydrogen reduction. Mater Res Bull 41:879–892. https://doi.org/10.1016/j.materresbull.2005.09.028
Al Obaidi Y et al (2018) Hydrodearomatization of distillates and heavy naphtha over a precious metal hydrogenation catalyst and the determination of low aromatic content. Ind Eng Chem Res 57:12029–12035. https://doi.org/10.1021/acs.iecr.8b02909
Al Shaqsi AZ et al (2020) Review of energy storage services, applications, limitations, and benefits. Energy Rep 6:288–306. https://doi.org/10.1016/j.egyr.2020.07.028
Al-Enazi A et al (2021) A review of cleaner alternative fuels for maritime transportation. Energy Rep 7:1962–1985. https://doi.org/10.1016/j.egyr.2021.03.036
Al-Muhtaseb AAH et al (2021) Circular economy approach of enhanced bifunctional catalytic system of CaO/CeO2 for biodiesel production from waste loquat seed oil with life cycle assessment study. Energy Convers Manage 236:114040. https://doi.org/10.1016/j.enconman.2021.114040
Al-Qahtani A et al (2021) Uncovering the true cost of hydrogen production routes using life cycle monetisation. Appl Energy. 281:115958. https://doi.org/10.1016/j.apenergy.2020.115958
Alanne K, Cao S (2019) An overview of the concept and technology of ubiquitous energy. Appl Energy. 238:284–302. https://doi.org/10.1016/j.apenergy.2019.01.100
Alshehri F et al (2019) Modelling and evaluation of PEM hydrogen technologies for frequency ancillary services in future multi-energy sustainable power systems. Heliyon 5:e01396–e01396. https://doi.org/10.1016/j.heliyon.2019.e01396
Alviani VN et al (2021) Local initiative hydrogen production by utilization of aluminum waste materials and natural acidic hot-spring water. Appl Energy 293:116909. https://doi.org/10.1016/j.apenergy.2021.116909
Argonne National Laboratory, 2019.https://ora.ox.ac.uk/objects/uuid:fa2b9e7c-1c58-429c-90fd-f780a3c3dc7d
Arora P et al (2018) Remote, small-scale, ‘greener’ routes of ammonia production. J Clean Prod 199:177–192. https://doi.org/10.1016/j.jclepro.2018.06.130
Atilhan S et al (2021) Green hydrogen as an alternative fuel for the shipping industry. Current Opin Chem Eng. 31:100668. https://doi.org/10.1016/j.coche.2020.100668
Aydın Ö et al (2018) Mass transport limitation in inlet periphery of fuel cells: studied on a planar solid oxide fuel cell. Int J Hydrog Energy 43:17420–17430. https://doi.org/10.1016/j.ijhydene.2018.07.030
BNEF, Hydrogen Economy Outlook, Key messages, March 30, 2020, https://data.bloomberglp.com/professional/sites/24/BNEF-Hydrogen-Economy-Outlook-Key-Messages-30-Mar-2020.pdf, accessed on 20–5–2021. 2020, https://data.bloomberglp.com/professional/sites/24/BNEF-Hydrogen-Economy-Outlook-Key-Messages-30-Mar-2020.pdf
Balay S, Abhyankar S, Adams M, Brown J, Brune P, Buschelman K, Dalcin L, Dener A, Eijkhout V, Gropp W, Karpeyev D, Kaushik D, Knepley M, MAY D, Curfman McInnes L, Mills R, Munson T, Rupp K, Sanan P, Smith B, Zampini S, Zhang H, Zhang H (2019) Computer, computational, and statistical sciences division, PETSc users manual, Argonne National Laboratory Argonne National Laboratory. https://ora.ox.ac.uk/objects/uuid:fa2b9e7c-1c58-429c-90fd-f780a3c3dc7d
Banawan AA et al. (2010) Environmental and economical benefits of changing from marine diesel oil to natural-gas fuel for short-voyage high-power passenger ships. Proceedings of the Institution of Mechanical Engineers Part M: Journal of Engineering for the Maritime Environment. 224, 103-113.https://doi.org/10.1243/14750902JEME181
Bareiß K et al (2019) Life cycle assessment of hydrogen from proton exchange membrane water electrolysis in future energy systems. Appl Energy 237:862–872. https://doi.org/10.1016/j.apenergy.2019.01.001
Bauer S et al (2013) Impacts of the use of the geological subsurface for energy storage: an investigation concept. Environ Earth Sci 70:3935–3943. https://doi.org/10.1007/s12665-013-2883-0
Bauer S et al (2017) Subsurface energy storage: geological storage of renewable energy—capacities, induced effects and implications. Environ Earth Sci 76:695–695. https://doi.org/10.1007/s12665-017-7007-9
Bermudez JM, Fidalgo B (2016) Production of bio-syngas and bio-hydrogen via gasification Handbook of biofuels production. Elsevier Inc, Hoboken, pp 431–494. https://doi.org/10.1016/B978-0-08-100455-5.00015-1
Bicer Y, Dincer I (2017) Assessment of a sustainable electrochemical ammonia production system using photoelectrochemically produced hydrogen under concentrated sunlight. ACS Sustain Chem Eng 5:8035–8043. https://doi.org/10.1021/acssuschemeng.7b01638
Bicer Y, Khalid F (2020) Life cycle environmental impact comparison of solid oxide fuel cells fueled by natural gas, hydrogen, ammonia and methanol for combined heat and power generation. Int J Hydrog Energy 45:3670–3685. https://doi.org/10.1016/j.ijhydene.2018.11.122
Bird L et al (2016) Wind and solar energy curtailment: a review of international experience. Renew Sustain Energy Rev 65:577–586. https://doi.org/10.1016/j.rser.2016.06.082
Bocklisch T (2016) Hybrid energy storage approach for renewable energy applications. J Energy Storage 8:311–319. https://doi.org/10.1016/j.est.2016.01.004
Booto GK et al (2021) Comparative life cycle assessment of heavy-duty drivetrains: a Norwegian study case. Transp Res Part d: Transp Environ 95:102836. https://doi.org/10.1016/j.trd.2021.102836
Brightling J (2018) Ammonia and the fertiliser industry: the development of ammonia at Billingham. Johns Matthey Technol Rev 62:32–47. https://doi.org/10.1595/205651318X696341
Bui M et al (2021) Delivering carbon negative electricity, heat and hydrogen with BECCS – Comparing the options. Int J Hydrog Energy 46:15298–15321. https://doi.org/10.1016/j.ijhydene.2021.02.042
Bünger U et al (2016) Large-scale underground storage of hydrogen for the grid integration of renewable energy and other applications. Compend Hydrog Energy. https://doi.org/10.1016/B978-1-78242-364-5.00007-5
Cao C et al (2020) Utilization of CO2 as cushion gas for depleted gas reservoir transformed gas storage reservoir. Energies 13:576–576. https://doi.org/10.3390/EN13030576
Carpetis C (1988) Storage, transport and distribution of hydrogen. Hydrog Energy Carrier. https://doi.org/10.1007/978-3-642-61561-0_10
Chabab S et al (2020) Measurements and predictive models of high-pressure H2 solubility in brine (H2O+NaCl) for underground hydrogen storage application. Int J Hydrog Energy 45:32206–32220. https://doi.org/10.1016/j.ijhydene.2020.08.192
Chen J et al (2019) System development and environmental performance analysis of a solar-driven supercritical water gasification pilot plant for hydrogen production using life cycle assessment approach. Energy Convers Manage 184:60–73. https://doi.org/10.1016/j.enconman.2019.01.041
Chen Y-T, Hsu C-W (2019) The key factors affecting the strategy planning of Taiwan’s hydrogen economy. Int J Hydrog Energy. 44:3290–3305. https://doi.org/10.1016/j.ijhydene.2018.07.159
Cheng J et al (2019) Improving fermentative hydrogen and methane production from an algal bloom through hydrothermal/steam acid pretreatment. Int J Hydrog Energy. 44:5812–5820. https://doi.org/10.1016/j.ijhydene.2019.01.046
Cherubini E et al (2018) Uncertainty in LCA case study due to allocation approaches and life cycle impact assessment methods. Int J Life Cycle Assess 23:2055–2070. https://doi.org/10.1007/s11367-017-1432-6
Collet P et al (2017) Techno-economic and life cycle assessment of methane production via biogas upgrading and power to gas technology. Appl Energy 192:282–295. https://doi.org/10.1016/j.apenergy.2016.08.181
Collotta M et al (2019) Critical indicators of sustainability for biofuels: an analysis through a life cycle sustainabilty assessment perspective. Renew Sustain Energy Rev 115:109358. https://doi.org/10.1016/j.rser.2019.109358
Contreras A et al (1997) Hydrogen as aviation fuel: a comparison with hydrocarbon fuels. Int J Hydrog Energy 22:1053–1060. https://doi.org/10.1016/s0360-3199(97)00008-6
Cortés A et al (2019) Environmental implications of biohydrogen based energy production from steam reforming of alcoholic waste. Ind Crops Prod 138:111465. https://doi.org/10.1016/j.indcrop.2019.111465
Cvetković SM et al (2021) Life Cycle Energy Assessment of biohydrogen production via biogas steam reforming: case study of biogas plant on a farm in Serbia. Int J Hydrog Energy 46:14130–14137. https://doi.org/10.1016/j.ijhydene.2021.01.181
Dasgupta S, Atta A (2020) Computational insights on intensification of hydrodenitrogenation in a trickle bed reactor using periodic flow modulation. Chem Eng Process-Process Intensif 157:108135–108135. https://doi.org/10.1016/j.cep.2020.108135
Dawood F et al (2020) Hydrogen production for energy: an overview. Int J Hydrog Energy. 45:3847–3869. https://doi.org/10.1016/j.ijhydene.2019.12.059
Deniz C, Zincir B (2016) Environmental and economical assessment of alternative marine fuels. J Clean Prod 113:438–449. https://doi.org/10.1016/j.jclepro.2015.11.089
Desantes JM et al (2020) Comparative global warming impact and NOX emissions of conventional and hydrogen automotive propulsion systems. Energy Convers Manage 221:113137. https://doi.org/10.1016/j.enconman.2020.113137
Dincer I, Bicer Y (2020) Enhanced dimensions of integrated energy systems for environment and sustainability Integrated energy systems for multigeneration. Elsevier, Hoboken, pp 403–440. https://doi.org/10.1016/b978-0-12-809943-8.00007-8
Dodds PE et al (2015) Hydrogen and fuel cell technologies for heating: a review. Int J Hydrog Energy 40:2065–2083. https://doi.org/10.1016/j.ijhydene.2014.11.059
Dvoynikov M et al (2021) New concepts of hydrogen production and storage in arctic region. Resources. https://doi.org/10.3390/resources10010003
EIA - U.S. Battery Storage Market Trends. https://www.eia.gov/analysis/studies/electricity/batterystorage/
Earles JM, Halog A (2011) Consequential life cycle assessment: a review. Int J Life Cycle Assess 16:445–453. https://doi.org/10.1007/s11367-011-0275-9
Edwards PP et al (2008) Hydrogen and fuel cells: towards a sustainable energy future. Energy Policy 36:4356–4362. https://doi.org/10.1016/j.enpol.2008.09.036
Eichman, J., et al., Economic Assessment of Hydrogen Technologies Participating in California Electricity Markets. 2012, www.nrel.gov/publications.
El-Emam RS, Özcan H (2019) Comprehensive review on the techno-economics of sustainable large-scale clean hydrogen production. J Clean Product. 220:593–609. https://doi.org/10.1016/j.jclepro.2019.01.309
El-Eskandarany MS (2020) Solid-state hydrogen storage nanomaterials for fuel cell applications. Mech Alloy. https://doi.org/10.1016/B978-0-12-818180-5.00009-1
El-Halwagi MM et al (2020) Disaster-Resilient design of manufacturing facilities through process integration: principal strategies, perspectives, and research challenges. Front Sustain. https://doi.org/10.3389/frsus.2020.595961
El-Sawy MS et al (2020) Co-hydroprocessing and hydrocracking of alternative feed mixture (vacuum gas oil/waste lubricating oil/waste cooking oil) with the aim of producing high quality fuels. Fuel 269:117437–117437. https://doi.org/10.1016/j.fuel.2020.117437
El-Shafie M, Kambara S, Hayakawa Y (2019) Hydrogen production technologies overview. J Power Energy Eng 7:107–154. https://doi.org/10.4236/jpee.2019.71007
Eveloy V, Gebreegziabher T (2018) A review of projected power-to-gas deployment scenarios. Energies. https://doi.org/10.3390/en11071824
Falcone PM et al (2021) Hydrogen economy and sustainable development goals: Review and policy insights. Current Opin Green Sustain Chem 31:100506. https://doi.org/10.1016/j.cogsc.2021.100506
Fawzy S et al (2020) Strategies for mitigation of climate change: a review. Environ Chem Lett 18:2069–2094. https://doi.org/10.1007/s10311-020-01059-w
Fernández-Dacosta C et al (2019) Potential and challenges of low-carbon energy options: comparative assessment of alternative fuels for the transport sector. Appl Energy 236:590–606. https://doi.org/10.1016/j.apenergy.2018.11.055
Finnveden G et al (2009) Recent developments in life cycle assessment. J Environ Manage 91:1–21. https://doi.org/10.1016/j.jenvman.2009.06.018
Foh S et al. (1979) Underground hydrogen storage. Final report. [Salt caverns, excavated caverns, aquifers and depleted fields].https://doi.org/10.2172/6536941
Fong KF, Lee CK (2014) Investigation on zero grid-electricity design strategies of solid oxide fuel cell trigeneration system for high-rise building in hot and humid climate. Appl Energy 114:426–433. https://doi.org/10.1016/j.apenergy.2013.10.001
Gabrielli P et al (2020) Seasonal energy storage for zero-emissions multi-energy systems via underground hydrogen storage. Renew Sustain Energy Rev 121:109629–109629. https://doi.org/10.1016/j.rser.2019.109629
Ganzer L et al (2013) The H2STORE project - Experimental and numerical simulation approach to investigate processes in underground hydrogen reservoir storage European association of geoscientists and engineers. EAGE, Netherlands, pp 679–687. https://doi.org/10.2118/164936-ms
Gaston D et al (2009) MOOSE: a parallel computational framework for coupled systems of nonlinear equations. Nucl Eng Des 239:1768–1778. https://doi.org/10.1016/J.NUCENGDES.2009.05.021
Global hydrogen market insights, 2020–2024 by production process, end-user, generation system and region. Focus Catal. 2020(5):2. https://doi.org/10.1016/j.focat.2020.04.005
Gogate MR (2018) The direct dimethyl ether (DME) synthesis process from syngas I. Process feasibility and chemical synergy in one-step LPDMEtm process. Petrol Sci Technol 36:547–554. https://doi.org/10.1080/10916466.2018.1428628
Gondal IA (2019) Hydrogen integration in power-to-gas networks. Int J Hydrog Energy 44:1803–1815. https://doi.org/10.1016/j.ijhydene.2018.11.164
Gruber H et al (2019) Fischer-Tropsch products from biomass-derived syngas and renewable hydrogen. Biomass Convers Biorefinery. https://doi.org/10.1007/s13399-019-00459-5
Gurz M et al (2017) The meeting of hydrogen and automotive: a review. Int J Hydrog Energy 42:23334–23346. https://doi.org/10.1016/j.ijhydene.2017.02.124
Hagemann B et al (2015) Mathematical modeling of unstable transport in underground hydrogen storage. Environ Earth Sci 73:6891–6898. https://doi.org/10.1007/s12665-015-4414-7
Hagemann B et al (2015) Hydrogenization of underground storage of natural gas. Comput Geosci 20(3):595–606. https://doi.org/10.1007/S10596-015-9515-6
Han Z et al (2018) Novel application of MgH2/MoS2 hydrogen storage materials to thiophene hydrodesulfurization: a combined experimental and theoretical case study. Mater Des 158:213–223. https://doi.org/10.1016/j.matdes.2018.08.036
Han W-B et al (2021) Directly sputtered nickel electrodes for alkaline water electrolysis. Electrochimica Acta. 386:138458. https://doi.org/10.1016/j.electacta.2021.138458
Hashemi L et al (2021) Pore-scale modelling and sensitivity analyses of hydrogen-brine multiphase flow in geological porous media. Sci Rep 11:8348–8348. https://doi.org/10.1038/s41598-021-87490-7
Hassanpouryouzband A et al (2020) Gas hydrates in sustainable chemistry. Chem Soc Rev 49:5225–5309. https://doi.org/10.1039/C8CS00989A
Hassanpouryouzband A et al (2021) Offshore geological storage of hydrogen: is this our best option to achieve net-zero? ACS Energy Lett 6:2181–2186. https://doi.org/10.1021/ACSENERGYLETT.1C00845
Heinemann N et al (2021) Enabling large-scale hydrogen storage in porous media – the scientific challenges. Energy Environ Sci 14:853–864. https://doi.org/10.1039/d0ee03536j
IEA (2019), The Future of hydrogen, IEA, Paris. https://www.iea.org/reports/the-future-of-hydrogen, Accessed on 20 May 2021
Jeswani HK et al. (2020) Environmental sustainability of biofuels: a review. Proceedings of the Royal Society A: Mathematical, Physical and Engineering Sciences. 476, 20200351.https://doi.org/10.1098/rspa.2020.0351
Jorschick H et al (2021) Hydrogenation of aromatic and heteroaromatic compounds – a key process for future logistics of green hydrogen using liquid organic hydrogen carrier systems. Sustain Energy Fuels 5:1311–1346. https://doi.org/10.1039/D0SE01369B
Kalbar PP et al (2017) Weighting and aggregation in life cycle assessment: do present aggregated single scores provide correct decision support? J Ind Ecol 21:1591–1600. https://doi.org/10.1111/jiec.12520
Karaca AE et al (2020) Life cycle assessment study on nuclear based sustainable hydrogen production options. Int J Hydrog Energy 45:22148–22159. https://doi.org/10.1016/j.ijhydene.2020.06.030
Kerscher F et al (2021) Low-carbon hydrogen production via electron beam plasma methane pyrolysis: techno-economic analysis and carbon footprint assessment. Int J Hydrogen Energy 46:19897–19912. https://doi.org/10.1016/j.ijhydene.2021.03.114
Kim J et al (2015) Comparison of nitrogen and carbon dioxide as cushion gas for underground gas storage reservoir. Geosyst Eng 18:163–167. https://doi.org/10.1080/12269328.2015.1031916
Kim H-S et al (2021) Life cycle assessment of molten carbonate fuel cell system for power plants. J Clean Prod 302:126911. https://doi.org/10.1016/j.jclepro.2021.126911
Kim HJ, Park SH (2016) Optimization study on exhaust emissions and fuel consumption in a dimethyl ether (DME) fueled diesel engine. Fuel 182:541–549. https://doi.org/10.1016/j.fuel.2016.06.001
Kirk BS et al (2006) libMesh : a C++ library for parallel adaptive mesh refinement/coarsening simulations. Eng Comput 22:237–254. https://doi.org/10.1007/S00366-006-0049-3
Kruck, O., et al., 2013. Assessment of the potential, the actors and relevant business cases for large scale and seasonal storage of renewable electricity by hydrogen underground storage in Europe. KBB Undergr. Technol. GmbH.
Larscheid P et al (2018) Potential of new business models for grid integrated water electrolysis. Renew Energy 125:599–608. https://doi.org/10.1016/j.renene.2018.02.074
Li G et al (2019) Life cycle assessment of coal direct chemical looping hydrogen generation with Fe2O3 oxygen carrier. J Clean Prod 239:118118. https://doi.org/10.1016/j.jclepro.2019.118118
Li H et al (2021) Technology selection for hydrogen production in China by integrating emergy into life cycle sustainability assessment. J Clean Prod 294:126303. https://doi.org/10.1016/j.jclepro.2021.126303
Liebscher A et al (2016) Geologic storage of hydrogen - fundamentals processing and projects hydrogen science and engineering: materials processes systems and technology. Wiley, USA, pp 629–658. https://doi.org/10.1002/9783527674268.ch26
Liu F et al (2021) Deployment of fuel cell vehicles in China: Greenhouse gas emission reductions from converting the heavy-duty truck fleet from diesel and natural gas to hydrogen. Int J Hydrog Energy. https://doi.org/10.1016/j.ijhydene.2021.02.198
Logan KG et al (2020) Electric and hydrogen rail: Potential contribution to net zero in the UK. Transp Res Part d: Transp Environ 87:102523. https://doi.org/10.1016/j.trd.2020.102523
Lord AS et al (2014) Geologic storage of hydrogen: scaling up to meet city transportation demands. Int J Hydrog Energy 39:15570–15582. https://doi.org/10.1016/j.ijhydene.2014.07.121
Lui J et al (2020) A critical review on the principles, applications, and challenges of waste-to-hydrogen technologies. Renew Sustain Energy Rev 134:110365–110365. https://doi.org/10.1016/j.rser.2020.110365
Mah AXY et al (2019) Review of hydrogen economy in Malaysia and its way forward. Int J Hydrog Energy. 44:5661–5675. https://doi.org/10.1016/j.ijhydene.2019.01.077
Mehrjerdi H et al (2019) Daily-seasonal operation in net-zero energy building powered by hybrid renewable energies and hydrogen storage systems. Energy Convers Manage 201:112156–112156. https://doi.org/10.1016/j.enconman.2019.112156
Melaina M et al (2013) Blending hydrogen into natural gas pipeline networks: a review of key issues. Contract 303:275–3000. https://doi.org/10.2172/1068610
Merzian, R., Bridges, T., 2019. Hydrogen and climate: Trojan horse or golden goose? The Australia Institute, https://apo.org.au/node/230061
Michalski J et al (2017) Hydrogen generation by electrolysis and storage in salt caverns: potentials, economics and systems aspects with regard to the German energy transition. Int J Hydrog Energy. 42:13427–13443. https://doi.org/10.1016/j.ijhydene.2017.02.102
Milani D et al (2020) Renewable-powered hydrogen economy from Australia’s perspective. Int J Hydrog Energy. 45:24125–24145. https://doi.org/10.1016/j.ijhydene.2020.06.041
Misra P et al (2017) Denitrogenation and desulfurization of model diesel fuel using functionalized polymer: charge transfer complex formation and adsorption isotherm study. Chem Eng J 325:176–187. https://doi.org/10.1016/j.cej.2017.05.033
Mouli-Castillo J et al (2021) Mapping geological hydrogen storage capacity and regional heating demands: an applied UK case study. Appl Energy 283:116348–116348. https://doi.org/10.1016/j.apenergy.2020.116348
Nanda S et al (2017) Advancements and confinements in hydrogen production technologies Bioenergy systems for the future. Elsevier Inc, Hoboken, pp 373–418
Naylor M et al (2011) Calculation of CO2 column heights in depleted gas fields from known pre-production gas column heights. Mar Pet Geol 28:1083–1093. https://doi.org/10.1016/J.MARPETGEO.2010.10.005
Ochedi FO et al (2021) Carbon dioxide capture using liquid absorption methods: a review. Environ Chem Lett 19:77–109. https://doi.org/10.1007/s10311-020-01093-8
Ockwig NW, Nenoff TM (2007) Membranes for hydrogen separation. Chem Rev 107:4078–4110. https://doi.org/10.1021/cr0501792
Ogawa T et al (2018) Comprehensive analysis of trends and emerging technologies in all types of fuel cells based on a computational method. Sustainability. https://doi.org/10.3390/su10020458
Okolie JA et al (2019) Supercritical water gasification of biomass: a state-of-the-art review of process parameters, reaction mechanisms and catalysis. Sustain Energy Fuels 3:578–598. https://doi.org/10.1039/c8se00565f
Oldenburg CM (2003) Carbon dioxide as cushion gas for natural gas storage. Energy Fuels 17:240–246. https://doi.org/10.1021/ef020162b
Osman AI et al (2020) Exploring the photocatalytic hydrogen production potential of titania doped with alumina derived from foil waste. Int J Hydrog Energy. 45:34494–34502. https://doi.org/10.1016/j.ijhydene.2020.02.065
Osman AI et al (2020) Critical challenges in biohydrogen production processes from the organic feedstocks. Biomass Convers Biorefinery. https://doi.org/10.1007/s13399-020-00965-x
Osman AI (2020) Catalytic hydrogen production from methane partial oxidation: mechanism and kinetic study. Chem Eng Technol. 43:641–648. https://doi.org/10.1002/ceat.201900339
Osman AI et al (2021a) Recent advances in carbon capture storage and utilisation technologies: a review. Environ Chem Lett 19:797–849. https://doi.org/10.1007/s10311-020-01133-3
Osman AI et al (2021b) Conversion of biomass to biofuels and life cycle assessment: a review. Environ Chem Lett. https://doi.org/10.1007/s10311-021-01273-0
Owgi AHK et al (2021) Catalytic systems for enhanced carbon dioxide reforming of methane: a review. Environ Chem Lett 19:2157–2183. https://doi.org/10.1007/s10311-020-01164-w
Ozturk M, Dincer I (2019) Comparative environmental impact assessment of various fuels and solar heat for a combined cycle. Int J Hydrog Energy 44:5043–5053. https://doi.org/10.1016/j.ijhydene.2019.01.003
Panfilov M (2010) Underground storage of hydrogen. In situ self-organisation and methane generation. Transp Porous Media 85:841–865. https://doi.org/10.1007/s11242-010-9595-7
Panfilov M (2016) Underground and pipeline hydrogen storage Compendium of hydrogen energy. Elsevier, Hoboken, pp 91–115
Park S et al (2017) Acetate-assisted increase of butyrate production by Eubacterium limosum KIST612 during carbon monoxide fermentation. Biores Technol 245:560–566. https://doi.org/10.1016/j.biortech.2017.08.132
Parra D et al (2019) A review on the role, cost and value of hydrogen energy systems for deep decarbonisation. Renew Sustain Energy Rev. 101:279–294. https://doi.org/10.1016/j.rser.2018.11.010
Perry KF (2005) Natural gas storage industry experience and technology: potential application to CO2 geological storage. Carbon Dioxide Capture Storage Deep Geol Form. https://doi.org/10.1016/B978-008044570-0/50135-5
Pinsky R et al (2020) Comparative review of hydrogen production technologies for nuclear hybrid energy systems. Prog Nuclear Energy 123:103317. https://doi.org/10.1016/j.pnucene.2020.103317
Polverino P et al (2019) Study of the energetic needs for the on-board production of Oxy-Hydrogen as fuel additive in internal combustion engines. Energy Convers Manage 179:114–131. https://doi.org/10.1016/j.enconman.2018.09.082
Prussi M et al (2021) Potential and limiting factors in the use of alternative fuels in the European maritime sector. J Clean Prod 291:125849–125849. https://doi.org/10.1016/j.jclepro.2021.125849
Psoma A, Sattler G (2002) Fuel cell systems for submarines: from the first idea to serial production. J Power Sour 106:381–383. https://doi.org/10.1016/S0378-7753(01)01044-8
Pudlo D et al (2013) The H2STORE project: Hydrogen underground storage-A feasible way in storing electrical power in geological media? Springer, Berlin, pp 395–412. https://doi.org/10.1007/978-3-642-37849-2_31
Rana MS et al (2020) Synthesis of large pore carbon-alumina supported catalysts for hydrodemetallization. Catal Today 353:204–212. https://doi.org/10.1016/j.cattod.2019.07.009
Reaño RL (2020) Assessment of environmental impact and energy performance of rice husk utilization in various biohydrogen production pathways. Biores Technol 299:122590. https://doi.org/10.1016/j.biortech.2019.122590
Reaño RL, Halog A (2020) Analysis of carbon footprint and energy performance of biohydrogen production through gasification of different waste agricultural biomass from the Philippines. Biomass Convers Biorefinery. https://doi.org/10.1007/s13399-020-01151-9
Research, A. E., Companies are developing over 200 gw of hydrogen electrolyser projects globally, 85% of which are in europe, https://auroraer.com/media/companies-are-developing-over-200-gw-of-hydrogen-electrolyser-projects-globally-85-of-which-are-in-europe/, accessed on 20–5–2021. 2021.https://auroraer.com/media/companies-are-developing-over-200-gw-of-hydrogen-electrolyser-projects-globally-85-of-which-are-in-europe/
Rigueto CVT et al (2020) Water hyacinth (Eichhornia crassipes) roots, an amazon natural waste, as an alternative biosorbent to uptake a reactive textile dye from aqueous solutions. Ecol Eng 150:105817. https://doi.org/10.1016/j.ecoleng.2020.105817
Ringrose PS et al (2021) Storage of carbon dioxide in saline aquifers: physicochemical processes, key constraints, and scale-up potential. Annu Rev Chem Biomol Eng 12:471–494. https://doi.org/10.1146/annurev-chembioeng-093020-091447
Romeo LM et al (2020) Review of power-to-X demonstration projects in Europe. Front Energy Res. https://doi.org/10.3389/fenrg.2020.00191
Sadeghi S et al (2020) Comparative economic and life cycle assessment of solar-based hydrogen production for oil and gas industries. Energy 208:118347. https://doi.org/10.1016/j.energy.2020.118347
Safari F, Dincer I (2020) A review and comparative evaluation of thermochemical water splitting cycles for hydrogen production. Energy Convers Manag. 205:112182. https://doi.org/10.1016/j.enconman.2019.112182
Saidi M et al (2020) Hydrogen production from waste gasification followed by membrane filtration: a review. Environ Chem Lett 18:1529–1556. https://doi.org/10.1007/s10311-020-01030-9
Sainz-Garcia A et al (2017) Assessment of feasible strategies for seasonal underground hydrogen storage in a saline aquifer. Int J Hydrog Energy 42:16657–16666. https://doi.org/10.1016/j.ijhydene.2017.05.076
Saithong N et al (2019) Thermodynamic analysis of the novel chemical looping process for two-grade hydrogen production with CO2 capture. Energy Convers Manag. 180:325–337. https://doi.org/10.1016/j.enconman.2018.11.003
Sako N et al (2021) Techno-economic and life cycle analyses of battery-assisted hydrogen production systems from photovoltaic power. J Clean Prod. https://doi.org/10.1016/j.jclepro.2021.126809
Sanchez N et al (2021) Technical and environmental analysis on the power production from residual biomass using hydrogen as energy vector. Renew Energy 175:825–839. https://doi.org/10.1016/j.renene.2021.04.145
Siddiqui O, Dincer I (2019) A well to pump life cycle environmental impact assessment of some hydrogen production routes. Int J Hydrog Energy 44:5773–5786. https://doi.org/10.1016/j.ijhydene.2019.01.118
Silva FB et al (2020) Primary data priorities for the life cycle inventory of construction products: focus on foreground processes. Int J Life Cycle Assess 25:980–997. https://doi.org/10.1007/s11367-020-01762-4
Span R et al. (2020) TREND. Thermodynamic Reference and Engineering Data 5.0. Lehrstuhl für Thermodynamik, Ruhr-Universität Bochum
Spingler FB et al (2017) Investigating fuel-cell transport limitations using hydrogen limiting current. Int J Hydrog Energy 42:13960–13969. https://doi.org/10.1016/j.ijhydene.2017.01.036
Srivastava RK et al (2020) Biofuels, biodiesel and biohydrogen production using bioprocesses. A Rev Environ Chem Lett 18:1049–1072. https://doi.org/10.1007/s10311-020-00999-7
Sun Y et al (2017) Fischer-Trospch synthesis using iron-based catalyst in a microchannel reactor: hybrid lump kinetic with ANNs/RSM. Chem Eng Process 122:181–189. https://doi.org/10.1016/j.cep.2017.10.005
Taylor JB et al (1986) Technical and economic assessment of methods for the storage of large quantities of hydrogen. Int J Hydrog Energy 11:5–22. https://doi.org/10.1016/0360-3199(86)90104-7
Thaysen EM, McMahon S, Strobel G, Butler I, Ngwenya B, Heinemann N, Wilkinson M, Hassanpouryouzband A, McDermott C, Edlmann K (2020) Estimating microbial hydrogen consumption in hydrogen storage in porous media as a basis for site selection. https://doi.org/10.31223/X5HC7H
Thema M et al (2019) Power-to-Gas: electrolysis and methanation status review. Renew Sustain Energy Rev 112:775–787. https://doi.org/10.1016/j.rser.2019.06.030
Thi HN et al (2020) Medium compositions for the improvement of productivity in syngas fermentation with clostridium autoethanogenum. Biotechnol Bioprocess Eng 25:493–501. https://doi.org/10.1007/s12257-019-0428-4
Tolod KR et al (2019) Visible light-driven catalysts for water oxidation towards solar fuel biorefineries horizons in sustainable industrial chemistry and catalysis. Elsevier Inc, Hoboken, pp 65–84. https://doi.org/10.1016/B978-0-444-64127-4.00004-5
Tzanetis KF et al (2017) Analysis of biomass hydrothermal liquefaction and biocrude-oil upgrading for renewable jet fuel production: the impact of reaction conditions on production costs and GHG emissions performance. Renew Energy 113:1388–1398. https://doi.org/10.1016/j.renene.2017.06.104
U.S. wind projects, https://us.orsted.com/wind-projects#. https://us.orsted.com/wind-projects#
Valente A et al (2019) Life cycle sustainability assessment of hydrogen from biomass gasification: a comparison with conventional hydrogen. Int J Hydrog Energy 44:21193–21203. https://doi.org/10.1016/j.ijhydene.2019.01.105
Valente A et al (2021) Harmonised carbon and energy footprints of fossil hydrogen. Int J Hydrog Energy 46:17587–17594. https://doi.org/10.1016/j.ijhydene.2020.03.074
Vogler F, Sattler G (2016) Hydrogen-fueled marine transportation Compendium of hydrogen energy. Elsevier, Hoboken, pp 35–65. https://doi.org/10.1016/b978-1-78242-364-5.00003-8
Wainaina S et al (2018) Biochemicals from food waste and recalcitrant biomass via syngas fermentation: a review. Biores Technol 248:113–121. https://doi.org/10.1016/j.biortech.2017.06.075
Widera B (2020) Renewable hydrogen implementations for combined energy storage, transportation and stationary applications. Thermal Sci Eng Prog 16:100460–100460. https://doi.org/10.1016/j.tsep.2019.100460
Wilberforce T et al (2016) Advances in stationary and portable fuel cell applications. Int J Hydrog Energy 41:16509–16522. https://doi.org/10.1016/j.ijhydene.2016.02.057
Wilkins A et al (2020) PorousFlow: a multiphysics simulation code for coupled problems in porous media. J Open Sour Softw 5:2176–2176. https://doi.org/10.21105/joss.02176
Wilkins A et al (2021) An open-source multiphysics simulation code for coupled problems in porous media. Comput Geosci 154:104820–104820. https://doi.org/10.1016/J.CAGEO.2021.104820
Xu Z et al (2021) New insights in light-assisted microbial fuel cells for wastewater treatment and power generation: a win-win cooperation. J Power Sour 501:230000–230000. https://doi.org/10.1016/j.jpowsour.2021.230000
Yfanti VL, Lemonidou AA (2020) Effect of hydrogen donor on glycerol hydrodeoxygenation to 1,2-propanediol. Catal Today 355:727–736. https://doi.org/10.1016/j.cattod.2019.04.080
Yu Z et al (2011) Investigation on performance of an integrated solid oxide fuel cell and absorption chiller tri-generation system. Int J Hydrog Energy 36:12561–12573. https://doi.org/10.1016/j.ijhydene.2011.06.147
Yu L et al (2019) Non-noble metal-nitride based electrocatalysts for high-performance alkaline seawater electrolysis. Nat Commun 10:5106. https://doi.org/10.1038/s41467-019-13092-7
Yuan XZ et al (2021) A review of functions, attributes, properties and measurements for the quality control of proton exchange membrane fuel cell components. J Power Sour 491:229540–229540. https://doi.org/10.1016/j.jpowsour.2021.229540
Yue M et al (2021) Hydrogen energy systems: A critical review of technologies, applications, trends and challenges. Renew Sustain Energy Rev 146:111180–111180. https://doi.org/10.1016/j.rser.2021.111180
Zachariah-Wolff JL et al (2007) From natural gas to hydrogen via the Wobbe index: the role of standardized gateways in sustainable infrastructure transitions. Int J Hydrog Energy 32:1235–1245. https://doi.org/10.1016/j.ijhydene.2006.07.024
Zhou D et al (1997) Scaling of multiphase flow in simple heterogeneous porous media. SPE Reserv Eng 12:173–178. https://doi.org/10.2118/27833-PA
Zhu C et al (2019) Construction of CDs/CdS photocatalysts for stable and efficient hydrogen production in water and seawater. Appl Catal B: Environ. 242:178–185. https://doi.org/10.1016/j.apcatb.2018.09.096
Acknowledgements
The authors would like to thank OQ Oman for their generous financial support (project code: CR/DVC/SERC/19/01). The authors would also like to acknowledge the support of the Sustainable Energy Research Centre at Sultan Qaboos University. Ahmed Osman and David Rooney wish to acknowledge the support of The Bryden Centre project (Project ID VA5048). The Bryden Centre project is supported by the European Union’s INTERREG VA Programme, managed by the Special EU Programmes Body (SEUPB). Neha Mehta acknowledges funding from the Centre for Advanced Sustainable Energy (CASE). CASE is funded through Invest NI’s Competence Centre Programme and aims to transform the sustainable energy sector through business research.
Author information
Authors and Affiliations
Corresponding authors
Ethics declarations
Conflict of interest
The authors declare that no conflict of interest.
Additional information
Publisher's Note
Springer Nature remains neutral with regard to jurisdictional claims in published maps and institutional affiliations.
Rights and permissions
Open Access This article is licensed under a Creative Commons Attribution 4.0 International License, which permits use, sharing, adaptation, distribution and reproduction in any medium or format, as long as you give appropriate credit to the original author(s) and the source, provide a link to the Creative Commons licence, and indicate if changes were made. The images or other third party material in this article are included in the article's Creative Commons licence, unless indicated otherwise in a credit line to the material. If material is not included in the article's Creative Commons licence and your intended use is not permitted by statutory regulation or exceeds the permitted use, you will need to obtain permission directly from the copyright holder. To view a copy of this licence, visit http://creativecommons.org/licenses/by/4.0/.
About this article

Cite this article
Osman, A.I., Mehta, N., Elgarahy, A.M. et al. Hydrogen production, storage, utilisation and environmental impacts: a review. Environ Chem Lett 20, 153–188 (2022). https://doi.org/10.1007/s10311-021-01322-8
Received:
Accepted:
Published:
Issue Date:
DOI: https://doi.org/10.1007/s10311-021-01322-8