
Abstract
This review article provides a synthesis of the most significant transitions taking place in the energy systems of the USA in 2018. These include the leveling off of the total consumption of primary energy and electricity, a shift away from coal-fired electricity generation, advances in the efficiency energy conversions and end-uses, as well as the onshoring and offshoring of some energy applications. Transitions are considered with a long-term, sociotechnological perspective using data from the past 60 years, recognizing the impacts technological developments, economics, public policy, cultural preferences, and concerns about environmental impacts such as climate change. Different transitions are in different phases of development with different scales of impact, with some likely to only become significant over the next few decades.
Introduction
Energy systems are dynamic and always in transition; functioning within the laws of nature and the cultural norms of the societies within which they exist. They are composed of diverse resources, technologies, and end uses, connected by infrastructure, and driven by economics, resource access, public policies, and social behaviors. At the beginning of the twenty-first century, energy systems are changing in response to (a) the shifting costs and availability of specific energy resources, (b) technological innovation, (c) public concerns about the environmental consequences of specific energy practices, and (d) many billions of people in developing nations gaining of access to modern forms of energy. The causes and speed of energy transitions are unsurprisingly complex.
Historically, systemic changes in energy systems are not the result of “Eureka” moments of invention or discovery, but of sustained periods of technological, economic, and social advancement carried out by many actors in diverse locations, beginning long before the “breakthroughs” noted in history books and continued long after [1]. Energy transitions occur at different speeds in different places. Large-scale infrastructure requirements slow the rate of change everywhere.
Energy transitions are socio-technical transitions [2, 3] which involve innovations in technology and public policy to fulfill specific societal function met by energy services. However, technology and policies are mediated by infrastructure and economics and adopted in the context of the social values and culture (or more commonly “consumer preference”).
In this paper, major energy transitions underway in the United States in 2018, are viewed in the context of the past six decades with recognition of sociotechnical factors and a multi-level perspective that recognizes three phases or “levels” of transition [4, 5]:
-
a.
Micro-level (or niche-level) transition describes technological and policy innovation which occurs in “niches” insulated from external forces that would normally stifle them. The distribution of political power between national, state, county, and city governments has provided for many policy niches in the United States. In the private sector, opportunities for significant financial gain also create investment niches. While scholars often view the micro-level as describing “technological niches,” here, I take the broad view of technological and policy niches which address practices and behaviors as well as technologies.
-
b.
Meso-level (or sociotechnical regime-level) transition describes the phase where innovation is large-scale adoption occurs with the assistance of many public and private actors.
-
c.
Macro-level (or landscape-level) transition describes the phase where a technology achieves near-universal acceptance with the support of policies, practices, and infrastructure that both endure for decades and, in turn, create barriers to competition from new technologies and practices.
The USA is distinct in some ways which make it able to undertake specific transitions faster than other nations, such as a relative abundance of domestic energy resources and financial and technological capacities. However, its large area, distribution of political power, and cultural affinities with certain types of energy use such as large vehicles raise distinct challenges too. Similar energy transitions are occurring in other countries. Indeed, some transitions are occurring earlier and faster elsewhere.
Primary energy
Changing consumption
Two macro-scale metrics of energy demand are Total Primary Energy (TPE) consumption (Fig. 1) [6] and Total Primary Energy consumption per capita (Fig. 2) [6, 7]. While both are broad metrics, aggregating heterogeneous parts of energy systems, both indicate significant long-term shifts are underway in the United States.

Total Primary Energy (TPE) consumption [6]

U.S. TPE consumption leveled off at the end of the twentieth century. Since then, TPE has oscillated with economic cycles in the range of 100–106 exajoules (EJ). During this same period (1999–2017), Gross Domestic Product (GDP) grew by 46% and population by 17% [8].
U.S. TPE consumption per capita peaked before the two oil crises of the 1970s and declined in response to them. Irregular growth resumed from a low in 1983 to reach another peak in 2000 (3% lower than the peak of 1979) before beginning a long but uneven decline of 14% through 2017. The ongoing decline in TPE has occurred through significant variations in economic and political conditions. The current level of TPE consumption per capita was last seen in 1967.
Other countries that industrialized early, like those of the European Union (EU), have followed a similar pattern in primary energy use as the U.S. The EU nations experienced a TPE per capita peak in 2004 [9]. However, aggregate EU TPE per capita is less than half that in the United States reflecting significant differences in economies, population densities, travel behavior, public policies, culture, and other factors.
Countries which were less industrialized in the 1950s and 60s have undergone rapid TPE consumption growth associated with increases in GDP and population (Fig. 3 [10]). Industrialization has provided many billions of people with access to modern forms of energy and the benefits of the services that they provide. As should be expected, the relative share of global energy consumption by long-industrialized countries has declined (Fig. 4) [11]. The U.S. share of global energy consumption has dropped from one-third in 1960 to one-sixth in 2017.


Share of world energy consumption 1960–2015 [11]
Projections and predictions
The Energy Information Administration (EIA) within the U.S. Department of Energy (DOE) uses the National Energy Modeling System to project “the production, imports, conversion, consumption, and prices of energy” subject to various assumptions related to macroeconomics, energy markets, resources, behavior, technology, and demographics [12]. Projections are part of an Annual Energy Outlook (AEO) that provide the most widely used vision of the United States energy system over the coming decades, typically through 2050.
EIA projections of U.S. primary energy consumption made in the early 2000s for the period through 2020 proved to be significantly higher than was ultimately consumed, as shown in Fig. 5 [6, 13]. The NEMS projection in the 2000 Annual Energy Outlook (AEO2000, released in late 1999) is used for comparison purposes later in this paper. AEO2000 projected a 2017 TPE consumption of 125 EJ, 21% higher than actual. Projections in AEO2002 and AEO2004 for 2017 were 29% and 26% higher than actual. Thus, during the beginning of the period when TPE consumption leveled off, the scale of change occurring was not clear to many thoughtful analysts of the U.S. energy system.

It is essential to understand that NEMS makes projections, not predictions. Projections are forecasts based on specified assumptions about resource availability, economics, technologies, and policies. The AEO reference projection “generally assumes that existing laws and regulations remain unchanged throughout the projection period” [14]. Many of the changes in the U.S. energy system stem from unexpected events, such as the boom in unconventional oil and gas production, that did not get recognized by the assumptions included in modeling for AEO2000.
The Great Recession of 2007–2009 significantly impacted the economy and energy use of the United States. A simple linear correction for economic growth is made to provide a more appropriate comparison to EIA projections. Recognizing GDP was 5% lower in 2017 than projected in AEO2000, reduces the 2017 forecast to 118 EJ, or 15 EJ higher than actual.
Three changes in production
The three most noteworthy shifts in U.S. primary energy production since 2000 were a boom in unconventional oil and gas production, a rise in biofuel use, and a rise in variable renewable energy (wind and solar).
The most significant change in U.S. primary energy production since 2000 is the rapid expansion of unconventional “tight” oil and “shale” gas production after 2007, which reversed the decline in U.S. oil and gas production and produced new record high levels of production of both (Figs. 6 and 7) [15]. The United States became the world’s largest producer of oil in 2014 after losing that position in 1976 [16]. The U.S. also became the largest producer of natural gas in 2009 [17]. Shale gas became the largest source of natural gas in the U.S. in 2015. The United States was, of course, the largest consumer of both oil and natural gas throughout the past six decades and remains so.

Total U.S. field production of petroleum. This includes natural gas liquids produced in the development of natural gas which constituted 29% of the total in 2017 [15]

U.S. Dry natural gas production [15]
Other nations are developing unconventional oil and gas too. In particular, Canada, China, and Russia have, or are expected to have, significant unconventional production, albeit at lower volumes than the United States [18,19,20].
The rapid expansion of unconventional shale gas production in the United States has led to relatively low domestic natural gas prices since 2009 [21] resulting in greater use, especially in the electric power sector. U.S. natural gas consumption reached a historic high of 30 EJ in 2017.
The second primary energy change is the expanded use of biofuels such as corn ethanol and biodiesel following the adoption of a national Renewable Fuel Standard (RFS) in 2005 [22]. The RFS requires the blending of biofuels with hydrocarbon transportation fuels in increasing volumes. In 2017, biofuels provided 1.5% of all primary energy and 5% of the energy used in the transportation sector (Fig. 8) [23]). Since 2014, most retail gasoline sold in the United States contains 10% bio-based ethanol (E10), and there is widespread use of biodiesel too. The United States is the world’s largest producer of biofuels, accounting for 44% of global production in 2017, followed by Brazil (22%) and the combined countries of the European Union (17%) [24].

Biofuel consumption in the transportation sector [23]
The third significant change in primary energy production is the rise of variable renewable electricity from wind and solar energy sources. Wind power increased from 0.15% of all electricity in 2000 to 6.3% in 2017, while solar generation increased from 0.01% to 1.9% over the same period [25]. In 2017, small-scale photovoltaic systems, such as residential and commercial rooftop systems, generated approximately 31% of all solar electricity in the USA. Hence, the 1.9% electricity share of solar electricity in all sectors in 2017 was 1.3% utility-scale and 0.6% small-scale generation.
In 2017, wind and solar provided the equivalent of 3.2 EJ of primary energy (2.4 EJ from wind and 0.8 EJ from solar) (Fig. 9). Primary energy from wind and solar are determined using the “fossil fuel equivalency” approach as described in the “Generation Efficiency” section. Solar generation (utility and small-scale combined) in recent years has been similar to wind power 8-years prior.
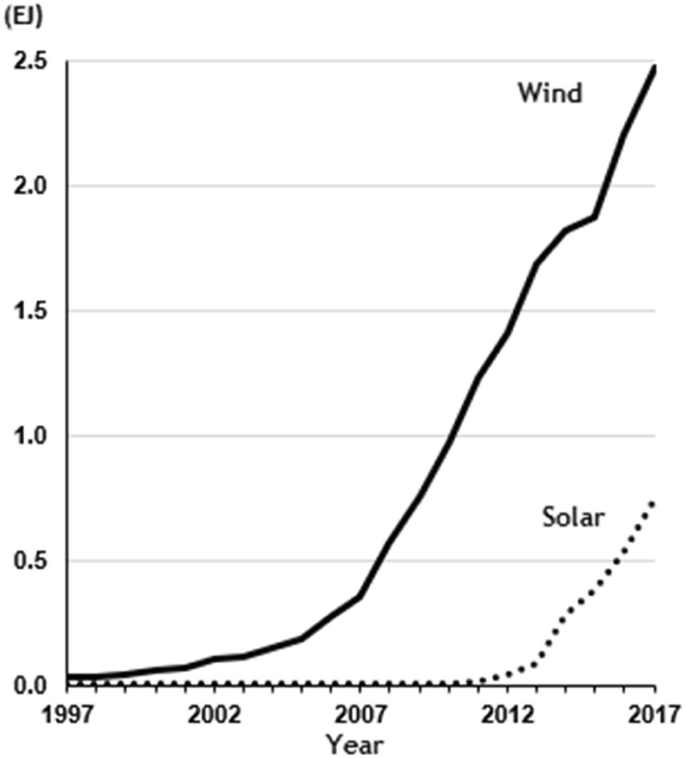
U.S. Wind and solar primary energy using fossil equivalency approach. Solar includes both utility-scale and small-scale generation [25]
In 2017, the European Union (32%), China (25%), and the United States (22%) accounted for 81% of global wind power generation (Fig. 10) [26]. Wind power is expanding more rapidly in the EU and China than in the U.S. In 2017, the European Union (27%), China (24%), and the United States (18%) accounted for 69% of global solar generation (Fig. 11) [27].

Wind power generation in the European Union, China, and the United States [26]

Solar power generation in the European Union, China, and the United States (utility-scale) [27]
Each of the three emergent sources of primary energy achieved prominence in the U.S. as a result of technological innovation, economics, and public policy. The boom in unconventional oil and gas production is a result of the development of two applied technologies - hydraulic fracturing, and horizontal drilling. These technologies were developed over many decades [28] with significant governmental support for research and development [29]. Thus, unconventional oil and gas production can be considered a new technology applied to (and transforming) an incumbent energy source. Unconventional oil and gas development also benefits from specific public policies such as exemptions to specific environmental laws [30] and access to resources on public lands [31].
The rise of biofuels in the United States is directly related to financial incentives from the national government as a response to the first oil crisis [32] which created a micro-level (niche market) transition followed by the adoption of the national Renewable Fuel Standard nearly three decades later which brought about wider adoption (a meso-level transition) within an existing hydrocarbon-based system. Biofuels have also benefited from public (government) investment in research and development [33].
Because biofuels require petroleum-based inputs, their net impact on reducing U.S. petroleum demand is not straightforward. Energy balance is commonly used to measure the energy benefits of biofuels - the energy output compared to the energy inputs required to produce, refine and move the biofuel. The energy balance of corn ethanol, the most utilized biofuel, is estimated to be about 1.5 when only the energy output of the corn ethanol is considered and between 2.1 and 2.3 when byproducts are recognized [34]. Thus, nearly half the energy in corn ethanol is a movement of the energy embedded in fuels consumed in other parts of the energy system. Not surprising, the actual energy impact of biofuels in the U.S. is a topic of controversy [35].
Variable renewable energy (VRE) has benefited from long-term public support for research and development [36] and numerous public policies at the national, state and local levels.
Within the federal system of the U.S., states have considerable political authority over retail electricity sales within their borders [37]. Many states have used that authority to set policies for renewable sources of energy. Twenty-nine states, the District of Columbia and 3 Territories have adopted Renewable Portfolio Standards (RPS) [38] that require retail electricity suppliers to obtain minimum amounts of their electricity from renewable sources. Another eight states and one Territory have adopted goals, rather than mandates, for renewable electricity. RPSs vary significantly from state to state in terms of targets, timeframes, obligated parties, markets for renewable energy credits, compliance rules, eligible renewable sources, and cost caps. California, for example, has a target of 100% “Clean Energy” by 2045 for its electric power sector (clean energy is defined as not emitting carbon dioxide as a part of the electricity generation process) [39]. New York and New Jersey have RPS targets of 50% by 2030. However, Florida, Georgia and many other southeastern states have no RPS. Approximately 56% of U.S. retail electricity sales [40] are subject to RPS policies which are periodically updated by many states.
An RPS guarantees a market for renewable power and facilitates financing for new renewable generation subject to various requirements specific to each state with an RPS [41]. It is estimated that from 2000 to 2016, RPS policies have driven approximately half of all of the non-hydropower renewable electricity deployed in the U.S. [40]. Wind power has dominated new renewable generation projects for RPSs because of its economic advantages over other forms of renewable electricity [42]. However, in recent years, many RPSs have begun to prioritize solar generation with dedicated targets (or “carve-outs”) or by multiplying the value of solar generation over other generation. It is estimated that RPSs were responsible for 21% of wind deployment in 2016 and 59% of large-scale utility solar deployment. The cost of compliance with RPSs in 2015 is estimated to be $3 billion or an average of 1.6% on the average retail electricity bill, but there are large variations between states [40].
RPSs are associated with states that have one or more of the following traits: a strong potential for renewable power; electricity markets that are more open to new sources of electricity; less natural gas-fired generation than the national average; and, state legislatures that are more progressive (Democratic) [43, 44].
At the national level, several federal tax policies such as investment tax credits and production tax credits have incentivized investment in renewable projects and generation. However, tax policies have frequently expired or come close to expiring before being extended for short periods of time. This approach has injected significant uncertainty into federal tax incentives for renewables, resulting in surges in deployment followed by reductions [45, 46]. In late 2015, federal tax incentives were again extended but included a multi-year ramping down of most incentives starting in 2019 [47].
Central to the adoption of wind and solar is the decline in cost. The Levelized Cost of Electricity (LCOE) of wind power dropped 67% between 2009 and 2017, while the LCOE of solar photovoltaic (PV) dropped 86% [48, 49]. Note that LCOE is a useful, but limited metric of the economics related to new power production and is sensitive to location and other conditions. Economic competitiveness is more usefully captured by comparing LCOE with the Levelized Avoided Cost of Electricity (LACE) of existing generation resources. However, all measures of the economic competitiveness of wind and solar show rapid improvement [50, 51].
The future production and integration of these three energy sources will likely define much of the U.S. energy system over the coming decades. There are several reasons why future domestic unconventional production is less predictable than traditional oil and gas development. First, the relatively short experience with unconventional wells means the amount and timing of future production is harder to forecast. Second, the rapid evolution of hydraulic fracturing technology and practice is reducing the cost of production. Finally, new unconventional reserves are being discovered at a rapid pace [52]. While these and other factors raise important questions about the future of unconventional oil and gas development, continued growth and significant increases in production are highly likely [53]. The most recent EIA Annual Energy Outlook (AEO2018) projects that U.S. oil production will increase in coming decades reaching a new peak in 2042, 30% higher than in 2017 [54]. AEO2018 also projects natural gas consumption to rise throughout the next three decades and be 60% higher in 2050 than in 2017.
While the RFS mandates larger volumes of biofuels are blended with traditional fuels over time, there are several difficulties confronting compliance and future growth in consumption. First, blending more than 10% bioethanol into motor gasoline requires an adjustment to the Clean Air Act [55] and the deployment of significant infrastructure to accommodate the distribution of higher blends [56]. As a result, the volumes of biofuels envisioned by the RFS will likely be constrained by growth in overall fuel consumption without additional policy intervention. Second, part of the motivation for the RFS is reducing emissions of greenhouse gases. Conventional biofuels such as corn ethanol result in only a modest net reduction in GHG emissions [57]. Commercial scale production of advanced biofuels with better GHG emissions characteristics has taken longer than anticipated resulting in controversy over the benefits of the RFS. Advanced biofuels can be considered to still be in the micro-level (niche) phase of an energy transition.
The rate of growth of wind and solar power over the next two decades will depend on many factors, including the rate of cost reduction, federal and state policies, the building on new transmission lines to connect production locations to demand centers, and the cost of energy storage. Significant public and private investment in research and development and large-scale production around the world is driving down costs [58] while policies at the state- [59] and federal-level will, over the next decade, play a critical role in increasing energy storage and the rate and scale at which variable renewable energy is integrated into the electric grid [60].
The 2015 DOE Wind Vision report [61] presents a “Study Scenario” whereby wind meets 20% of U.S. electricity demand by 2030 and 35% by 2050. Such as outcome will require the growth of installed wind capacity from 89 GW (April 2018 [62]) to 224 GW by 2030 and 404 GW by 2050. Further, the 2014 LCOE of land-based wind will need to be lowered by 33% by 2030, and 37% by 2050; and the LCOE of offshore wind reduced 43% by 2030, and 51% by 2050.
The 2017 DOE SunShot Initiative 2030 study envisions reducing the LCOE of solar PV electricity by 50% to $3/MWh for utility-scale systems between 2017 and 2030 [63]. An analysis of the impact of achieving the Sunshot 2030 goal estimates that PV might provide 17% of U.S. electricity in 2030 and 33% in 2050 [64].
Both the Wind Vision and the SunShot 2030 Initiative recognize that achieving such significant growth in variable renewable energy generation requires investments in new transmission infrastructure and the existence of sufficient dispatchable generation or energy storage capacity to accommodate variability in wind and solar generation on many time frames. For example, the addition of low-cost storage (~$130/kWh by 2030) might boost PV to 55% of U.S. electricity in 2050 [64]. Low-cost storage (e.g., batteries) is also required to reduce curtailment in power from variable generation sources when they temporarily provide more power than is demanded.
The dispatchable generation/storage requirements needed to integrate the largest levels of wind generation would likely make high penetration by the largest levels of solar generation impossible, and vice-versa. The Wind Vision study contemplates a PV penetration of the electric market of just 9% in 2050, while the SunShot 2030 study envisions a wind penetration of just 11% [64].
An analysis combining variable wind and solar power and allowing for competition between them and with other sources of electricity based on relative cost provides more realistic scenarios [65]. A “mid-case scenario” projects VRE to reach approximately 17% penetration by 2030 and 37% by 2050. For comparison, in 2017 VRE was 8.2% (6.3% wind and 1.9% PV). Under scenarios of high natural gas cost, low renewable energy cost or low wind cost, VRE grows to 48%–55% penetration by 2050. Under scenarios of low natural gas cost or high renewable energy cost, VRE grows to only 17% by 2050.
AEO2018 projects a more modest rise of VRE reaching approximately 15% by 2030 (wind 9.2% and PV 5.5%) and 23% by 2050 (wind 8.3% and PV 14.4%) [66].
Thus, there is significant variation in projections of variable renewable energy over the coming decades which have significant implications for the composition of the electric power sector and emissions of GHGs.
Imports and exports
All three changes noted above, impacted energy markets and energy imports. However, unconventional oil and gas production has had the most substantial effect, shifting the U.S. role in global oil and gas markets from being primarily a large demand center to a one more balanced between supply and demand roles.
In 2005, the United States imported (net) 16.4% of natural gas consumption. In 2017, the U.S. became a net exporter of natural gas (0.5% of consumption) [67]. In 2017, net imports of petroleum were 19% of consumption compared to 61% in 2005 [15].
As noted above, AEO2018 projects further increase in oil and gas production with the United States becoming a net exporter of crude oil and petroleum products in 2029 under the reference scenario, but in the early 2020s in some scenarios [68]. AEO2018 projects that natural gas exports will be 10% of domestic production by 2020 and 19% by 2050 [69]. Under such a scenario, the United States will become the world’s third largest exporter of Liquid Natural Gas (LNG) in 2020, behind Qatar and Australia [70]. The United States is reversing its role in the global LNG market to become a major supplier to the global market. This has implications for nations, like China, who are seeking to shift their energy systems away from coal to natural gas to improve local air quality and reduce emissions of greenhouse gases [71].
The rise of exports will be facilitated by new LNG export terminals currently under construction [72] which will likely narrow the significant price difference between domestic and international natural gas markets that have existed in recent years [73]. However, exports will not eliminate the price spread because of the inherent costs of liquefaction, transportation, and gasification [74].
Net imports of primary energy peaked in 2005–6 at 30% of consumption before declining to 8% in 2017 (Fig. 12). In comparison, China had net imports of 16% of consumption in 2015; the European Union-28, 57%; India, 36%; Japan, 95%, and Brazil, 8% [75]. AEO2018 projects that the United States will become a net exporter of energy in 2022 and remain so through 2050 with exports in the range of 5%–8% of consumption [54].

U.S. Net imports of primary energy as a percentage of consumption [6]
Composition
The rise of unconventional oil and gas, biofuels, and renewable electricity is reflected in significant shifts in the sources of U.S. primary energy (Fig. 13).

Primary energy consumption by energy source [6]
Petroleum remains the most significant source of primary energy in the United States and the world because of its near-monopoly status as a transportation fuel. The U.S. transportation sector gets 92% of its energy from petroleum and consumes 71% of petroleum [23]. Two oil crises, sustained periods of high oil prices (2005–14) [76], a Great Recession (2007–10), and two rounds of fuel economy standards have only set back a seemingly inexorable rise in U.S. petroleum consumption. The role of economics, technology, policy, and the U.S. cultural disposition toward larger vehicles is addressed in the “Transportation energy use” section.
The expanded use of biofuels and variable renewable energy doubled the level of consumption of renewable energy sources (which also includes hydroelectricity, wood, waste, and geothermal) from 2001 to 11.6 EJ in 2017 [77].
The increase in natural gas and renewable electricity has displaced domestic coal use [78] in the electric power sector which consumes 91% of coal production [79]. Coal consumption and production declined approximately 36% from its peak year of 2007 (24 EJ) to under 15 EJ in 2017 [80].
End-use
The rise of electricity marked the twentieth century because of its versatility as an end-use energy source, capable of powering myriad machines and devices and providing most (but not all) energy services. In 1970, the electric power sector became the largest consumer of primary energy in the United States (Fig. 14), and it remains so [81].

Decomposition of primary energy use by the electric power sector, residential and commercial sector, industrial sector, and transportation sector [81]
The displacement of coal by natural gas and renewables led to a 7.8% decline in primary energy use by the electric power sector from 2007 to 2017 [81] because the new sources generate electricity more efficiently as addressed in the “Generation efficiency” section.
The electric power sector is not the ultimate end-user for the electric energy that it produces. Therefore, when considering end-use of energy, it is useful to distribute energy from the electric power sector, including all energy losses associated with its generation and delivery, between the end-use sectors (Fig. 15 and Table 1). This approach makes clear several long-term trends in U.S. energy-use:
-
(1)
Industrial energy use in the United States has undergone a long-term transition over the past five decades marked by leveling off of consumption and punctuated by sharp drops associated with the two oil crises of the 1970s and economic recessions. During that time, the industrial sectors share of U.S. energy use has declined from 46% to 32%. Aspects of this transition include gains in efficiency, changes in composition, and some net offshoring of energy use is explored in the “Industrial energy use” section.
-
(2)
Residential energy use has been approximately one-fifth of U.S. energy use throughout the past six decades. The share of residential energy obtained from electricity has risen from 25% in 1957 to approximately 70% over the past decade [82]. Natural gas accounts for an additional 23% of today’s U.S. residential energy use (Table 1).
-
(3)
Commercial sector energy use has risen from one-tenth of U.S. energy use in 1957 to 18–19% over the past decade. Electricity and natural gas account for 76% (up from 40% in the late 1950s) and 18% of commercial sector energy use respectively (Table 1).
-
(4)
Energy use in the transportation sector follows a very similar trend to petroleum consumption (Fig. 13) reflecting its dominance as a transportation fuel. Transportation’s share of energy use has risen from 24% to 29%. A more detailed exploration of energy use in the “Transportation energy use” section.

Energy use by end-use sector [81]
Both electricity and natural gas are strongly regulated at a state level with significant implications for cost and efficiency of energy use (explored in the “Electricity” section).
Decomposing total primary energy
A simple approach to TPE is to express it in terms of the aggregate energy intensity of the country (TPE per dollar of GDP), economic output per capita, and total population [83]. Figure 16 shows aggregate U.S. energy intensity declining an average of 1.5% annually for the past 60 years and an average of 1.7% from 2008 to 2017. This long-term trend in the United States is reflected in nearly every country in the world [84] and is rooted in both technological advances and a more open global economic system which facilitates the movement of economic activities to locations with (among other factors) lower energy costs.

While the aggregate energy intensities of different nations are declining and converging over time, there are still significant differences between countries (Table 2) [85]. The aggregate energy intensity of the United States is approximately 48% higher than the European Union, 5% higher than the World average, and 10% lower than China. Again, there are profound differences between economies and countries, and within countries.
The aggregate energy intensity of the country, however, is a limited metric because it encompasses all uses of energy regardless of their relationship to GDP and obscures essential differences in the use of energy in different parts of the economy and confuses policymaking [86]. For example, residential energy use and personal driving do not measurably add to GDP but are significant components of the aggregate energy intensity numerator. Trade “offshores” energy use associated with imports and “onshores” energy use associated with exports.
Decomposing or disaggregating energy use can help quantify the contributions of different types of energy use [87] to changes in energy intensity associated with specific activities. There are several methodologies to decompose energy use whose details are beyond the scope of this review [88]. Typically, decomposition studies recognize three types of effects:
-
(a)
Activity effects which measure the change in the level of activity in a given area (e.g., the number of cars produced) assuming that other factors remain constant.
-
(b)
Structure effects which measure changes in the composition of activities in a given area (e.g., the economic balance of activities related to producing a car or the importation of individual components of a car, thereby “offshoring” specific energy uses) assuming that other factors remain constant. On an economy-wide scale, the structural effect captures the long-term shift from an economy emphasizing the production of goods to one more heavily oriented toward producing services.
-
(c)
Intensity effects which measure changes in energy use for a particular activity (e.g., the energy required to produce a car) assuming that other factors remain constant. Intensity effect is close to the common understanding of energy efficiency.
Often studies are normalized by economic activity so that just structural and intensity effects are reported.
Metcalf [89] carried out a broad decomposition of energy intensity by end-use sector (residential, commercial, industrial, and transportation) to allocate a share of improvements between efficiency gains (sector-specific intensity effects) and changes in shifts in economic activity (structure effects). Metcalf finds that “roughly three-quarters of the improvements in U.S. energy intensity” from 1970 to 2003 resulted from efficiency improvements and the remainder from structural shifts in the economy. Looking at variations between states and controlling for climate and other factors, Metcalf found that “price plays most of its role in reducing energy intensity through the efficiency channel.” In particular, Metcalf and other scholars find that the rise in energy prices triggered by the first oil crisis (1973–4) led to significant advances in energy efficiency and declines in energy intensity. The critical role of price on efficiency will be returned to in the “Efficiency of electricity use” section. While Metcalf also found considerable differences between states and over time, recent research suggests that there has been significant convergence in state energy intensities [90].
Huntington [91] carried out a long-term (1972–2006) decomposition into five end-use sectors (the industrial sector was broken into agricultural and non-agricultural components) and a short-term (1997–2006) granular decomposition by 65 different economic activities and excluding residential and personal transport services that do not produce products sold into markets. Huntington reports that 61% of aggregate energy intensity decline is due to intensity (efficiency) gains and 39% due to activity shifts within the economy. However, if transportation is excluded from all sectors, structural shifts account for a much larger 54% of improvements in energy intensity.
Over the past decade, DOE has developed a hierarchical system of sector-specific energy intensity indicators. This approach constructs a weighted average of the separate intensity indicators for the four major end-use sectors into an index for the entire economy of the United States [92, 93].
Studies that disaggregate the economy can also miss feedbacks between different parts of society. The role of indirect rebound effects is particularly susceptible to being lost in disaggregated studies and leads some observers to assert that efficiency improvements in technologies lead to little or no reduction in total energy use [94]. Moreover, reasonable interpretations for changes in energy intensity during one period may be inappropriate during a different period. The relationship between energy consumption and economic growth continues to be a matter of much scholarly debate.
Electricity
Fuel shifting
As already noted, the rise in production of natural gas and renewable electricity has displaced coal-fired generation over the past decade (Fig. 17). Cheap petroleum led to a preference in oil-fired power in the 1960s. However, the oil crisis of 1973 led to a long-term move away for petroleum in favor (initially) of coal, backed by federal law and policy [95]. At the same time, the previously regulated wholesale price of natural gas was deregulated to encourage higher production [96]. Finally, the Federal Power Act regulating electric utilities was amended to mandate utility acceptance of cost-competitive independently produced power [97]. Coal-fired power generation rose for three decades following the first oil crisis, peaking in 2007 before declining 40% through 2017.

A 2017 study by Houser and colleagues [98] quantified the drivers of the decline in coal-fired generation from 2007 to 2015. They attribute 49% of the decline to cheaper natural gas; 26% to lower than expected demand for electricity (addressed in the “National- and state-level electricity consumption” section); and, 18% to renewable power. Some, but not all, of the remaining 7% is attributed to stricter environmental regulation of coal-fired power plants like the Mercury and Air Toxics Standards [99].
In 2016, natural gas-fired generation surpassed coal-fired generation for the first time. The use of natural gas for electricity is very sensitive to price fluctuations [100], and the scale of future consumption will be strongly impacted by any price on carbon [101]. There is less price sensitivity in other end-user sectors for natural gas.
While coal has declined in favor of other fuels, nuclear power has provided a steady one-fifth of U.S. electricity for 30 years. The fleet of commercial reactors in the U.S. had an average age of 37 years at the end of 2017 [102]. While many reactors are receiving 20-year extensions to their original 40-year operating licenses, many are struggling to compete economically with other sources of power and retiring before reaching the end of their operational life. New York state and Illinois are beginning to compensate nuclear power for its low greenhouse gas emissions, suggesting a policy direction that may sustain nuclear power in many parts of the country [103]. Only two new reactors are under construction in the United States [104].
The impact of shifting away from coal on GHG emissions from the electric power sector has been significant (Fig. 18) [105]. Natural gas-fired generation produces about half the emissions of coal per unit of electric power, while nuclear and variable renewables have essentially no emissions related to generation. As a result of fuel-shifting away from coal, emissions of greenhouse gases from the electric power peaked in 2007 [106] and declined 28% through 2017.Footnote 1 The decline in GHG emissions from the electric power sector has contributed the most significant share of the overall decline in U.S. emissions of greenhouse gases.

Carbon dioxide emissions from the electric power sector [105]
Ongoing reductions in coal use in the electric power sector will further reduce emissions of greenhouse gases. How much will depend on both the total demand for electricity and the fuel composition in the electric power sector.
The reduced use of coal has also benefited air quality [107]. However, the decline in coal use has reduced employment in the coal industry and impacted communities where the industry is the largest single employer, which became an issue in the national election of 2016. The continuing closure of coal-fired power plants [108] shows that changes in national policy will not reverse the long-term decline in coal use.
Generation efficiency
One consequence of fuel shifting in the electric power sector is a significant rise in the efficiency of U.S. electricity generation.
Fossil and nuclear power plants convert heat energy into mechanical energy to drive a turbine connected to an electric generator. The efficiency of such “heat engines” is related to the fractional change in the absolute (Kelvin) temperature of the working fluid (typically steam) which is usually small [109]. Coal-fired power plants, nuclear power plants, and older natural gas-fired power plants which operate on a Simple Cycle Combustion Turbine (SCCT) use a single turbine operating under a single thermodynamic cycle with an average operating efficiency of approximately 32%.
Newer natural gas-fired power plants typically use a more efficient “combined cycle” utilizing two turbines and two thermodynamic cycles. Combined Cycle Gas Turbine (CCGT) power plants can reach efficiencies as high as 63% [110]. The U.S. fleet of natural gas power plants, which includes both SCCT and CCGT natural gas plants, had an average operational efficiency of 43.4% in 2017 [111]. The shift from coal-fired generation to natural gas-fired generation has therefore brought about a significant increase in the efficiency of power generation. Figure 19 shows the evolution of efficiency of power generation from fossil fuel power plants [112].

The efficiency of coal, petroleum, natural gas, and fossil fuel power plants combined [112]
The rise in efficiency of fossil fuel power plants from 33% in 2000 to 37% in 2017 is an outcome of two factors. The first is technological - the broad deployment of a new more efficient CCGT power plants, which have become a significant share of all-natural gas-fired power plants. The second factor is economic - the availability of cheap natural gas as a result of unconventional production which allows CCGT power plants to be used more cheaply than coal-fired power plants.
The main sources of renewable electricity do not have thermal heat to electricity conversion processes upon which an equivalent efficiency can be calculated. Because the energy sources have no economic cost, the treatment of efficiency is a matter of methodological choice.Footnote 2 For purposes of developing a useful measure of primary energy from renewables, the EIA utilizes a “fossil fuel equivalency” approach where the efficiency is defined as the average efficiency of fossil fuel generation [113]. In other areas, EIA utilizes the “captured energy” approach whereby the energy of the electricity produced is considered the starting point which implies a conversion process that is 100% efficient. Both approaches have rational uses.
The EIA’s choice of the fossil fuel equivalency approach, followed in this paper, leads to a primary energy equivalency for hydropower, wind, solar and geothermal electricity of 6.17 EJ in 2017. A captured energy approach yields 2.24 EJ which lowers the primary energy of the U.S. by an additional 3.7%. As renewable energy grows, the different approaches to defining their primary energy will become increasingly important [114].
Regardless of the approach used, the displacement of coal-fired generation by renewables brings about additional gains in efficiency of power generation. After an extended period of generation efficiency in the range 32.0% - 32.7% between 1961 and 1999, the total electric power generation efficiency (Fig. 20) has risen steadily to reach 35.4% in 2017 and will continue to rise as the share of electricity generated from coal declines. The efficiency gains from 2000 to 2017 (32.6% to 35.4%) corresponds to a savings of 3.3 EJ of primary energy in 2017 (Fig. 21) which is approximately 22% of the observed reduction below the AEO2000 projection. Future reductions in coal use in the electric power sector will further increase the efficiency of electric power generation.

The efficiency of the electric power sector in the U.S. (1986–2016) [112]

Normalized (1967 = 100) generation and primary energy consumption by the U.S. electric power sector 1967–2017 [112]
The increase in efficiency of power generation lowers the aggregate energy intensity of the United States. It is, therefore, useful to decompose aggregate energy intensity into two terms: [1] the efficiency of conversion of primary energy conversion of end-use energy; and, [2] the end-use energy intensity.Footnote 3 This allows the decomposition of energy use changes between end-use efficiency gains and structural shifts in the economy described above to be more accurately be applied to the end-use energy intensity.
This is particularly important in distinguishing between end-use sectors where the residential (70%) and commercial (76%) sectors are dominated by electricity use compared to the industrial sector (33%) and the transportation sector (0.3%) (Table 1).
National- and state-level electricity consumption
Total U.S. consumption of electricity (Fig. 22 [115]) has also leveled off over the past decade as a result of a long-term decline in per capita electricity consumption (Fig. 23). This mirrors similar trends in other highly industrialized nations (Fig. 24) [116].

Total electricity use in all sectors [115]


The U.S. electricity sector has traditionally been the most highly regulated component of the energy sector and subject to significant national, state and regional rules that vary in their impacts on fuels, competition, and pricing. While electricity is subject to critical national laws [117], the most significant regulation of electric utilities and sales occurs at the state (or equivalent) level. State regulatory bodies such as public service commissions, public utility commissions, and similar organizations, set retail electricity prices in most situations under state energy policies [118]. States also trade significant levels of electricity with some being net exporters and others net importers.
Many, but not all regions of the country participate in regional wholesale electricity markets [119] operated under the leadership of Regional Transmission Organizations [120].
As a result, serious analysis of electricity consumption in the U.S. quickly becomes a complicated but necessary process of state-by-state and regional analysis.
The well-known “Rosenfeld Curve” (Fig. 25) shows how the state of California slowed the growth of its per capita electricity consumption as early as the 1970s contrasted against the continuing rise of consumption in the rest of the U.S [121,122,123]. While advocates of energy efficiency regulation commonly make a simple one-to-one correlation between California’s significant regulations and the relative difference in electricity consumption to the rest of the U.S., the reasons for the difference are more complicated. California’s temperate climate, industrial composition, level of urbanization, building size, household composition, demographics, and many other factors all help it achieve lower energy use. Further, many of California’s energy efficiency initiatives have led to lower energy consumption in the rest of the U.S. For example, California policy requirements may lead a manufacturer to increase the energy efficiency of a product wherever it is sold resulting in a lower relative difference in electricity consumption and obscuring the impact of regulation in California.

Determining how much of difference in per capita electricity consumption between California and the rest of the U.S. is due to state policies has proven difficult. Studies by Sudarshan [124] and Levinson [125] attribute only 10% - 20% of the difference directly to the state’s energy efficiency policies. Thus, California’s state-level energy efficiency regulations do not provide a comprehensive explanation of the difference between California and the rest of the U.S. Per capita electricity consumption for five selected states in addition to California (Fig. 26) [123, 126], illustrates both the dramatic differences between individual states and a more recent stabilization and reduction in per capita consumption across the country.

Comparison of state-level electricity consumption in Fig. 26 and that of select nations in Fig. 24 shows that some U.S. states have comparable per capita electricity consumption to industrialized countries. Massachusetts is similar to Japan, and California to France. Understanding the differences between state policies within the U.S. federal system is essential to understanding electricity consumption.
Efficiency of electricity use
Understanding the efficiency of U.S. electricity use is based upon a recognition of its distribution among end-use sectors. The residential (36%) and commercial (37%) sectors account for nearly three-quarters of electricity consumption in the United States, while industry takes a 26% share (Fig. 27).

U.S. retail electricity sales by sector [81]
Over six decades, energy use in the residential and commercial sectors became dominated by electricity (Fig. 28 and Table 1) with most of the remaining energy coming from natural gas. Energy use in these two sectors is for activities related to buildings such as space heating and cooling, water heating, refrigeration, and lightning [127]. Building energy intensity (energy use per unit of space) has declined steadily but been offset significantly by other changes.

Electricity sales share of energy use by end-use sector [81]. Note that electricity system losses are included in end-use electricity energy
For example, in the residential sector between 1980 and 2009, energy intensity per square foot dropped by over 37% [128]. Note that the energy referred to here is all energy delivery to the building or “site.” This includes electricity as well as on-site primary energy. However, to avoid double counting the efficiency improvement in generation described above, electricity does not include losses that occur in the generation, transmission, or distribution. During this same period, the number of housing units increased 33%; the area per household rose 20%; more Americans lived in locations requiring less heating, and other factors impacted total residential energy use resulting in a net increase in residential energy use of 9%. Similarly, commercial buildings have experienced space efficiency improvements offset by an expansion in space use [129].
There is significant variation in the price of electricity between states. As basic economic theory would suggest, states with higher retail prices have lower consumption (Fig. 29) [130, 131]. However, the lack of any simple correlation between average monthly bill and price (Fig. 30) is perhaps surprising.


The impact of climate and weather conditions in different regions of the United States can be measured in terms of heating-degree and cooling-degree days [132] which quantifies the number of degrees that the daily average temperature is above or below a given temperature and suggests the demand level for heating and cooling. While electricity use generally increases with a larger number of heating-degree and cooling-degree days, there are significant differences between regions. New England and Mid-Atlantic states have lower average electricity consumption per combined heating- and cooling degree day than the South Atlantic and South-Central states [133]. This is likely because of energy-efficiency policies and practices described later in this section. As a result, customers New England and Mid-Atlantic states have lower average monthly bills even though they have higher average electricity prices than customers in the South Atlantic and South-Central states.
State-level Energy Efficiency Resource Standards (EERSs) set energy savings targets for utilities and compensate those efforts in the setting of rates [134]. EERSs are measured in a variety of ways including spending on efficiency as a percentage of utility revenues, or as an amount per customer, or as savings as a percentage of sales. EERSs both raise electricity prices and provide direct investment in efficiency improvements which reduce monthly bills [135]. Through EERSs, utilities offer customers energy efficiency incentives for efficient products and home performance audits [136]. EERSs for electric utilities exist in 26 states with two-thirds of the U.S. population. EERSs are most influential in the New England region which explains, in part, the higher efficiency of electricity usage in that region noted above.
Utility reports to the U.S. Energy Information Administration indicate that $3.6 billion was spent by utilities on customer energy efficiency initiatives in 2016, approximately $24 per customer [137]. This was as high as $128 per customer in the state of Massachusetts to zero in other states. However, Berg and colleagues at the American Council for an Energy-Efficient Economy estimate that “utilities across the United States invested approximately $7.6 billion in energy efficiency and saved approximately 25.4 million megawatt-hours (MWh) in 2016” [138] with an estimated $6.3 billion spent on electricity programs and $1.3 billion on natural gas programs.
States set standards for building energy efficiency based on the International Energy Conservation Code (IECC) standards for residential buildings and ANSI/ASHRAE/IES Standards for commercial buildings [139]. However, specific applied standards differ from state to state.
National policies on electricity efficiency include research and development efforts on efficient lighting, HVAC (Heating, ventilation, and air conditioning), refrigeration, windows, standards, and other aspects of buildings [140]. Research and development in this area amounted to $200 million in 2017 [141]. The federal governmental also develops voluntary energy efficiency standards under the Energy Star Program for a wide range of products [142].
AEO2018 projects electric power consumption in the residential and commercial sectors to remain within 4% of current consumption for the next decade, before slowly rising [54], the ongoing trends in efficiency and state-level policies, these projections should be viewed as potentially high.
Electricity regulation and markets
In the early twentieth century, the electricity sector took the form of utilities operating as regulated monopolies whereby strict state-level regulation in accordance with the national Federal Power Act (FPA) was exchanged for guaranteed profits. Utilities, primarily private corporations, were vertically-integrated, handling generation, transmission and distribution, and retail sales. The FPA was amended in 1978 to create a market for non-utility power generation [97] that could compete with traditional utilities. The success of this first reform has resulted in further amendments to the FPA and changes to the regulatory framework under which states operate, including:
-
(a.)
Turning transmission lines into common carriers for all power producers. This led to the functional unbundling of generation, transmission, and ancillary services in 1996Footnote 4 [143].
-
(b.)
Many states restructuring their electricity markets in areas of competition, wholesale, and choices for end-use customers (retail). Today, Independent Power Producers (IPPs, also known as “merchant generators”) are responsible for 40% of power generation which is sold into wholesale markets. Power marketers, who only sell power to end users, sell 20% of U.S. electricity to 4% of customers. Traditional Investor-owned utilities still serve 58% of customers with 52% of power sold and carry out 39% of generation.
-
(c.)
The formation of regional wholesale electricity markets that can encompass many states.
-
(d.)
Rules to accommodate the rise of variable sources of electricity which bid into wholesale markets at zero (or negative) priceFootnote 5 [144] guaranteeing acceptance and sale. Additional rules related to variable generation address dispatch, frequency control, voltage control, and reliability [145].
-
(e.)
Rules for the compensation of a wide range of services provided by energy storage in wholesale markets [146].
-
(f.)
Rules on the compensation of demand response (i.e., reductions in end-use electricity consumption at times of high demand or price) in wholesale markets [147].
Regulations are guided by a principle of “just, reasonable and non-discriminatory rates” [148] which require different types of generation and non-generation services to be treated equally in wholesale markets. The diversity of generation characteristics and non-generation services is expanding rapidly, creating new regulatory challenges [49] and stimulating the continued evolution of electricity markets.
The past decade has been marketed by a rise in the number of electricity customers who generate and put electricity on to the grid (e.g., with rooftop solar systems) and participate in demand management systems. In coming decades, the interactive roles of these “prosumers” in the electric system are expected to expand to include more participants and more activities such microgrids and energy storage. While prosumers are currently part of a micro-level (or niche-level) energy transition, their number and influence are expected to be significant and require further reform of the electricity system of the United States [149].
Transmission infrastructure has the potential to be a bottleneck when connecting variable renewable energy generation sites to demand centers. While FERC promotes regional coordination in transmission planning [150], states maintain considerable authority over transmission line approval over their territory. States without significant interest in the power exchange made possible by new transmission lines that cross their land are frequently a block to such lines [151]. Overcoming such problems would likely require amending the FPA to give FERC greater authority.
Industrial energy use
Industrial energy use is more sensitive than other sectors to economic cycles, energy prices, technological changes, and structural shifts.
Absolute industrial energy use dropped 10% following the onset of the first oil crisis in October 1973, recovered, and then dropped 19% following the second oil crisis (1979–80) (Fig. 15). U.S. industrial energy use ultimately peaked in 1997 just 8% higher than the 1973 peak and 4% higher than the 1979 peak while industrial output was 78% and 60% higher respectively [152]. In 2017, industrial energy use was 11% lower than the 1997 peak. Industrial end-use of energy has dropped from approximately one-half of total energy use to one-third over the past sixty years.
Bulk chemicals (28%), refining (18%), mining (11%), and iron steel and aluminum (6%) account for nearly two-thirds of U.S. industrial energy use. The unconventional oil and gas production boom of the past decade has resulted in increased energy use in the production, processing, and refining of those commodities. In part because of a continued increase in petroleum and natural gas production, AEO2018 projects a 34% (11.4 EJ) growth in total industrial energy consumption through 2050 [54].
Changing composition
Electricity consumption in the industrial sector peaked in 2000 (34% of industrial energy use) before declining 19% through 2017, reflecting the broader trend toward more efficient electricity generation and use, including state policies described above [153].
Direct use of primary energy sources is an intrinsic part of the operations of many energy-intensive industries. As a result, petroleum and natural gas are as important as electricity as industrial energy sources (Fig. 31).

Industrial energy use by source [153]
Lower natural gas prices resulting from the production boom has lifted its use above that of electricity in the industrial sector but not as significantly as in the electric power sector. These two sectors now use similar amounts of natural gas (Fig. 32) [154] and account for 69% of natural gas consumption.

Natural gas consumption by end-use sector [154]
Natural gas use in the industrial sector is concentrated in a small number of industries such as oil and gas development. In particular, lease and plant fuel accounts for 17% of industrial natural gas consumption. This refers to natural gas used for the production and processing of natural gas and naturally rises with increasing domestic production as does its use for the movement of natural gas through pipelines (94% of natural gas use in the transportation sector). Other key industries for natural gas include combined heat and power systems (13%), refining, paper and pulp, chemicals, fertilizer, and metals.
The impacts of the changing composition of energy use in the industrial sector on emissions of carbon dioxide are shown in Fig. 33. The declining share of electricity and the decarbonization of the electric power sector has resulted in a 38% decline in industrial GHG emissions related to electricity. In 2016, natural gas became the largest source of industrial GHG emissions for the first time since 1974. Total industrial carbon dioxide emissions peaked with energy use in 1997 and declined 27% through 2017 (Fig. 34) [155] compared to an 11% decline in energy use.

Industrial sector carbon dioxide emissions by energy source [155]

Industrial sector total carbon dioxide emissions [155]
Onshoring and offshoring of industrial energy use
Industrial energy use is more complicated to understand than residential and commercial energy use because one must look at the change in composition or “structure” of industrial activity and the energy use changes inside each element of industrial activity (Table 3 [156]). Changes in the relative importance, or structure, of different industries, reflects: (a) the evolution in industrialization (e.g., greater importance of industrial activities with lower energy intensity); (b) efficiency (intensity) gains in industrial activities; and (c) some net “offshoring” of energy use embodied in any trade deficit (Fig. 35) [157].

Trade Balance: Goods, Balance of Payments Basis, Millions of Dollars, Monthly, Seasonally Adjusted [157]
Three industries illustrate this complexity. First, iron and steel production is 95% of metal production by weight in the United States. Net imports of steel mill products (Fig. 36) [158] represent energy offshoring. Exports of U.S. steel mill products must be viewed in the same light and set against imports. Net imports of steel mill products in 2017 were 25% of consumption and correspond to approximately 0.5 EJ of energy offshoring.

U.S. imports and exports of steel mill products, 1991–2016 [158]
Second, U.S. net imports of petroleum in 2017 were about 19% of consumption, down from a high of 60% in 2005. The United States exports approximately 16% of refined products, nearly five times its imports of finished petroleum products; thus, there is a net “onshoring” of energy use for refining [159,160,161]. Refining energy use was 4.7 EJ in 2017, suggesting a net onshoring of approximately 0.6 EJ.
Finally, the U.S. exports over 20% of agricultural production [162] which represents an estimated onshoring of 0.3 EJ before food imports are considered. The embodied energy in such exports varies with crop type, growing region, and level of processing.
As noted above, decomposition studies of energy typically attribute 60% or more of the reduction in energy intensity to efficiency gains and 40% structural changes [163]. However, the preceding discussion suggests that such studies have trade complications [164].
While the U.S. trade imbalance has expanded over the past quarter century, it was still only slightly over 1% of GDP in late 2017, suggesting net offshoring of energy on the scale of 1–2 EJ. Proper consideration of energy use embodied in trade requires the recognition and appropriate attribution of both imports and exports over time, together with careful analysis of industry-by-industry global trade patterns, energy use, and caveats about industrial processes.
Projecting future of industrial energy use is particularly challenging because of the uncertainties in both economic growth and economic structure. EIA’s NEMS projects a 35% increase in total industrial energy demand from 2016 to 2050.
Transportation energy use
Because, highway vehicles account for over 82% of transportation energy use (Table 4) [165], changes in transportation energy use reflect a tension between increases vehicle miles traveled (Fig. 37) [166] and gains in vehicle efficiency (Fig. 38) [167].

Total Vehicle Miles Traveled in the United States [166]

Adjusted Fuel Economy (MPG) by Model Year (1975–2017) [167]. Values are “adjusted” from the fuel economy values used for compliance with fuel economy standards to represent the U.S. Environmental Protection Agency’s best estimates of real-world performance
The first oil crises led to the adoption of fuel efficiency standards for light vehicles. The operational efficiency of new cars increased by 61% between Model Year (MY) 1975 and 1982. However, efficiency standards proved politically unpopular and were held constant for three decades. New vehicle efficiency began declining in the 1980s as greater consumer preference for light trucks (a category which includes Sport Utility Vehicles) asserted itself.
A second wave of fuel economy standards followed the 2007 ruling by the Supreme Court of the United States [168] that emissions of greenhouse gases were pollutants under the Clean Air Act. This ruling led to standards for new vehicles of MY2012–2025 for light vehicles and MY2014–2027 for medium and heavy trucks. Between model years 2004 and 2017, the estimated operational efficiency of new light vehicles (cars and light trucks) rose nearly 31%.
While fuel efficiency standards are generally a national policy, the state of California can, with permission from the U.S. Environmental Protection Agency, implement standards that are stricter than national standards [169]. California’s standards can, in turn, be adopted by other states. Thus, although there is an ongoing move by the federal government to review and reduce the increases in fuel economy standards set for MY2022–2025 [170], many states may sustain the existing higher standards.
Several challenges mediate the impact of vehicle fuel efficiency standards. First, the median age of cars and light trucks on the road in the U.S. is 11.6 years, up from 9.6 years in 2002 [171]. Thus, there is a considerable lag in the impact of the deployment of more fuel-efficient new vehicles because of this longevity.
Second, many U.S drivers prefer light trucks, with lower efficiency standards, over smaller cars. The light truck category of vehicles increased its market share from about 20% in the late 1970s to approximately 38% today. This growth is due primarily to the popularity of Sport Utility Vehicles.
Other societal factors impacting transportation energy use include driver demographics and behavior, residential locations relative to work locations, urban versus rural populations, and mass transit options.
While petroleum possesses a near monopoly as a primary fuel for transportation, the United States has diversified its transportation fuel supply slightly with biofuels. The national Renewable Fuel Standard [172] described above has resulted in most retail gasoline sold in the United States being 10% bio-based ethanol (E10), and widespread use of biodiesel. Biofuels provided 5% of the energy used in the transportation sector in 2017.
Transportation energy use peaked in 2007 at 30 EJ before declining 9% through 2012 in response to higher fuel prices and then with the imposition of new fuel efficiency standards. However, sustained economic growth coupled with the 2014 drop in oil and fuel prices has given rise to a recent uptick in driving and 7% increase in transportation energy use through 2017.
With decreased energy use in other sectors, the transportation sector’s share of energy use has increased from 23% in 1966 to 29% in 2017 (Fig. 15). AEO2018 projects relative stability in transportation energy use through 2050 [173]. The NEMS reference case assumes a 2040 petroleum price of $109/barrel. A lower or higher price would increase or decrease consumption respectively. Consumption of petroleum for transportation will likely increase modestly in the coming decade.
The transportation sector has the largest emissions of greenhouse gases on any end-use sector (Fig. 39) [174], surpassing the industrial sector in 1999. Transportation emissions exceeded the electric power sector in 2017. Thus, transportation represents the most significant challenge to reducing U.S. greenhouse emissions.

Energy use carbon dioxide emissions by end-use sector [174]
AEO2018 projections for transportation sector GHG emissions are based on current fuel efficiency standards and projections of fuel prices, miles driven, and adoption of electric vehicles. The AEO2018 projection (Fig. 40) [175] is that emissions will decline through 2036 as vehicles sold in compliance with current standards for model years through 2025 come to dominate vehicles on the road. This projection assumes no rollback of current national standards and no new higher standards in the future. Thus, declines in transportation emissions level out and begin to rise again. Under different assumptions about future transportation factors, such as additional higher efficiency standards, greater use of biofuels, or high adoption of electric vehicles, result in lower emissions.

Projected emissions from energy use by end-use sector from the Energy information Administration’s 2018 Annual Energy Outlook [175]
The future of energy transitions in the United States
This paper began by noting that energy systems are always in transition and that transitions are best viewed with a long-term, socio-technological and multilevel perspective. Prior sections have shown that profound shifts have been occurring in many aspects of U.S. energy use.
Energy Production
The most significant shifts have occurred where long-term technological and policy efforts have moved from micro-level (or niche-level) activities to meso-level to macro-level. For example, unconventional oil and gas development, wind power and solar electricity were all micro-level activities until the 1990s. Long-term, publicly-funded research and development enabled these technologies to begin to enter the marketplace. Each technology moved through meso-level transitions with the assistance of many public and private actors.
While unconventional oil and gas have fed into existing macro-level energy systems, onshore wind and solar are still making the transition from meso- to macro-level with the assistance of:
-
[i.]
State- and national-level policies that provide financial incentives;
-
[ii.]
technological and manufacturing developments;
-
[iii.]
adaptation of market rules;
-
[iv.]
changing practices by utilities and other actors in electricity markets; and,
-
[v.]
growing (but not universal) public acceptance.
Electricity
While wind power has gained meaningful market share (6.3% in 2017), it is not yet sufficiently entrenched to be considered an “incumbent” technology like coal-fired, natural gas-fired and nuclear electricity generation and faces opposition (albeit declining) from many associated with those technologies [176, 177]. Solar electricity generation is approximately eight-years behind that of wind power (i.e., solar generation in all sectors for 2014–2017 was close to that of wind for 2006–2009) [178].
Lower cost for electricity from natural gas, wind, and solar electricity is steadily driving coal-fired generation from the market.
Several factors will impact the rate of decline in coal-fired power generation in the coming decades, including:
-
(1)
The relative cost of alternatives electricity sources. In particular, the cost of natural gas (based future unconventional production); and, the relative cost of wind, and solar.
-
(2)
Decisions about the closure of existing nuclear power plants and whether to compensate them for their carbon emissions characteristics. The ongoing retirement of aging and non-economic reactors [179] combined with the construction of just two new reactors suggests a declining contribution of nuclear through the coming decades. Whether new nuclear technologies such as Small Modular Reactors will revive the role of nuclear power in the 2030s is an open question [180, 181].
-
(3)
The evolution public policies such as Renewable Portfolio Standards in each of the states; national Clean Air Act regulations; and, reforms to regional wholesale power markets.
-
(4)
The rate at which infrastructure required to move energy from production sites to demand centers can be built or expanded. This includes expansion of the electric transmission grid for wind and solar (in particular High Voltage Direct Current transmission lines) and new pipelines for natural gas. Large-scale infrastructure projects like these experience significant challenges under the U.S.’s federal system where individual states can block significant projects crossing their territory.
-
(5)
The speed of deployment of electricity storage capacity is subject to both technological and economic advances. It is important to note that for electricity, different storage technologies and economics are required for different time frames; hours to address fluctuations and diurnal cycles; and, weeks to months to address weather effects and seasonal variability.
-
(6)
The growth or decline in electricity demand. AEO2018 projects 24% increase in electricity demand through 2050 as a result on a 33% increase in industrial demand, and a sixteen-fold increase in electricity use for transportation. These correspond to a 12.2 EJ and a 1.6 EJ increase in primary energy for generation respectively based on 2017 generation efficiency. However, electricity efficiency gains from evolving state-level policies are not captured in this projection and would likely reduce consumption.
-
(7)
Alternatives to coal-fired electricity are also in competition with each other. For example, very low natural gas prices will also slow the deployment of wind and solar [68].
AEO2018 projects the share of U.S. electricity (from all sectors) coming from natural gas to rise from 32% to 34% in 2030 and 35% in 2050; coal to decline to from 30% to 26% (2030) and 22% (2050); and nuclear from 20% to 15% (2030) and 12% (2050). Renewable electricity from all sources (wind, solar, hydropower, biomass and geothermal) is projected to rise from 17% in 2017 to 23% (2030) and 31% in 2050 [54].
Technological advances which result in low-cost energy storage will boost wind and solar relative to natural gas [68]. However, energy storage technologies are, except for pumped hydroelectricity storage which is well developed and provides over 95% of global energy storage [182], undergoing a meso-level transition. That is, technologies such as batteries, hydrogen fuel cells, and thermal energy storage devices are beginning to be deployed at scale, often with incentives from state policies.
The electricity system of the United States is, therefore, in “mid-transition” with a decade of significant change completed, but several decades of change ahead.
While many scholars have explored scenarios of the future of the U.S. electricity sector with deep decarbonization of emissions, there is significant debate about the what energy sources will be used. Jacobson and colleagues [183, 184] have proposed a transition to 100% renewable hydroelectricity, wind and solar power. However, Clack and colleagues [185] have noted significant challenges to such as transition and proposed models with an 80% decarbonization relative to 1990 levels and a more diversified set of energy sources, including some fossil fuels with carbon capture and sequestration [186]. The Renewable Portfolio Standard adopted by the state of California in September 2018 of 100% “clean energy” by 2045 includes both geothermal power and the option of nuclear power but excludes fossil fuels [39].
The ambitious Renewable Portfolio Standard adopted by the state of California (12% of U.S. electricity consumption) also illustrates the ongoing importance of the federal system in the United States. State governments have considerable power over many kinds of energy use separate and distinct from the policies (or lack thereof) adopted by the national government. Some states, like California, have consistently demonstrated a desire to promote energy efficiency (through Energy Efficiency Resource Standards) and specific energy sources (as through Renewable Portfolio Standards) through state law; while other states have taken a more hands-off approach. Such differences result in significantly different levels of energy use and rates of deployment of specific energy practices.
It should also be noted that state-level Energy Efficiency Resource Standards (EERSs) described above with respect to electricity consumption are also applied to natural gas consumption in 16 states (compared to 26 states for electricity) [130]. As with electricity EERSs, natural gas EERSs are highest in New England states. Other state-level policies incentivize specific energy technologies (e.g., residential rooftop solar panels) and energy-use practices (e.g., carpooling) that have socially desirable outcomes.
Federalism in the United States also provides challenges to the ongoing transition in electricity. Models of deep decarbonization of the electric power system require significant sharing (or “averaging”) of power generation and consumption over large geographic areas, which will only be possible with significant new transmission infrastructure. However, as noted in “Electricity regulation and markets” section, individual states can stop the construction of new transmission lines crossing their territory which do not directly benefit them. Federalism can thus both enable and slow energy transitions.
Transportation
Energy use in the transportation sector has undergone two modest transitions in the past decade; the use of biofuels which accounts for 5% of energy use in the transportation sector; and, an increase in new vehicle efficiency as a result of fuel economy standards. However, two emerging technologies, electric vehicles and autonomous driving vehicles may bring about much more profound transitions in the coming decades.
The fundamental impact of electric vehicles will be to diversify energy sources for transportation to include all those used to generate electricity.
Plug-in hybrid electric vehicles (PHEVs) and full battery electric vehicles (BEVs), accounted for slightly over 1% of new light vehicle sales in the United States in 2017 and 16% of electric vehicle sales worldwide [187]. Electric vehicles are support by federal tax incentives [188] and state-level incentives [189]. The key metric for cost-effective electric vehicles is the cost of battery energy storage which has dropped from over $800/kWh in 2010 to approximately $200/kWh in 2017 [190, 191]. Further cost declines to $100/kWh by 2025 are forecast [192]. Thus, electric vehicles can be viewed as undergoing a meso-level transition supported by rapid technological (cost) advances and public policies.
Forecasts of electric vehicle deployment vary widely based on different assumptions about future cost reductions in batteries, policies to promote electric vehicles, and customer acceptance. The AEO2018 projects BEVs at 14% of total U.S. Vehicle Sales in 2050 and PHEVs to be 2% [193]. However, other estimates are higher. For example, Bloomberg New Energy Finance, projects “55% of new car sales and 33% of the global car fleet will be electric” by 2040, with the U.S. reaching 11% of new sales in 2025 [194]. Such wide variations in electric vehicle deployment bring additional uncertainty into projections of future of energy use [195].
The rate of impact of electric vehicles on energy use will be slowed because the turnover of vehicles in operation is less than 10% per year [196]. Depending on the timing of electric vehicle charging and how electric vehicles are integrated into the grid, electric vehicles may both accelerate deployment of variable sources of electricity such as wind and solar and create additional demand for generating capacity using all fuels [197].
Autonomous (self-driving) vehicles represent a micro-level transition in 2018 with research and development and prototype deployments primarily financed by private investment [198] and policies oriented toward the future deployment of small fleets [199]. However, autonomous vehicles will move to a meso-scale transition in the next few years, with the deployment of taxi fleets in certain cities. At what point autonomous vehicles become a macro-level transition in transportation is a matter of much speculation and dependent on both technological and policies advances.
The energy impact of autonomous vehicles is also difficult to predict. Autonomous vehicles may decrease energy consumption by increasing energy efficient driving; “platooning” vehicles to reduce air resistance; allowing weight reductions because of increased safety; and reducing weight by electrifying the powertrain. Alternatively, by reducing the cost of travel and increasing safety, autonomous vehicles may increase energy consumption by increasing travel; allowing higher speeds; increasing commuting distances; and, providing increased mobility to low-served communities such as the elderly and disabled [200]. Thus, autonomous vehicles may decrease or increase transportation energy use, making projections of future energy use in the transportation sector more uncertainty than in prior years.
Primary and final energy use
The current National Energy Modeling System projection (contained in AEO2018) of the total primary energy consumption of the United States in 2050 under the reference case of assumptions is 115 EJ, 12% higher than in 2017. Nearly all of that increase is projected to occur in the industrial sector with no change in the residential and transportation sectors and a modest 0.4% growth in the commercial sector [54].
However, “reference case” assumptions for NEMS in prior years have projected higher energy use than experienced in most years. Fischer and colleagues, for example, reviewed NEMS projections from 1994 to 2006 and found “a fairly modest but persistent tendency to underestimate total energy demand by an average of 2% per year over the one- to five-year projection horizon after controlling for projection errors in gross domestic product, oil prices, and heating/cooling degree days” [201]. The tendency for NEMS projections to be higher than ultimately seen is rooted in the model’s treatment of several factors. Most significant is a business-as-usual policy assumption. NEMS does not recognize the future lowering of demand as the result of new energy efficiency policies such as more aggressive state-level Energy Efficiency Resource Standards (EERSs) and Renewable Portfolio Standards (which, as shown above impact the efficiency of electricity generation). The impacts of all efficiency gains grow in significance with longer-term projections. Additional factors that impact the accuracy of NEMS projections include projections of energy production and prices, fuel composition, and the impact of new technologies and their rate of deployment. All projections of future energy use must be understood in this context.
If we assume that the projections in AEO2018 are 2% higher per year higher than the actual energy demand that occurs (that is a year with a projected 1% projected growth in TPE will have a 1% decline) primary energy demand in 2050 would be 29% lower than in 2017. This is not a forecast, but an observation about the considerable range of possible energy demand over the coming decades.
Emissions of greenhouse gases
As part of the 2015 Paris Agreement, the United States submitted an Intended Nationally Determined Commitment (INDC) “to achieve an economy-wide target of reducing its greenhouse gas emissions by 26-28 percent below its 2005 level in 2025 and to make best efforts to reduce its emissions by 28%.. .. This target is consistent with a straight line emission reduction pathway from 2020 to deep, economy-wide emission reductions of 80% or more by 2050. The target is part of a longer range, collective effort to transition to a low-carbon global economy as rapidly as possible” [202]. This includes emissions from all sources and the net absorption of GHGs by land use, land-use change, and forestry (LULUCF) which reduce gross U.S. GHG emissions by approximately 10% [106]. In 2016, net emissions of GHGs in the United States were approximately 12% lower than in 2005.
The EIA tracks carbon dioxide emissions related to energy use which constitute approximately 95% of all GHG emissions from energy use and 81% of gross GHG emissions in the United States. In 2016, carbon dioxide emissions from energy use, and total GHG emissions from energy use were approximately 13% lower than in 2005 [106].
AEO2018 projects energy-only carbon dioxide emissions in 2025 to be 15% lower than 2005 levels and 12% lower in 2050 (Fig. 40), with a 2% increase in industrial sector emissions. The electric power sector emissions, before allocation to end-use sectors is projected to be 29% lower than 2005 in 2025 and 26% lower in 2050. Thus, the AEO2018 projection shows the United States falling short of its INDC. However, as noted several times in this paper, the AEO2018 projection is based on certain assumptions about economic growth, technology improvements, and “business-as-usual” policies.
GHG emissions from energy use can be viewed as a combination of energy demand and fuel composition. Factors affecting energy demand include:
-
(1)
Economic growth driving industrial and commercial energy use modified efficiency gains, economic structure, and the onshoring/offshoring of energy use (“Onshoring and offshoring of industrial energy use” section).
-
(2)
Residential energy demand electricity and natural gas modified by efficiency gains helped by such policies as state-level Energy Efficiency Resource Standards (“Efficiency of electricity use” section).
-
(3)
Transportation energy demand which combines total miles traveled and vehicle efficiency. The tension between fuel efficiency standards and customer preference for larger vehicles will be significant (“Transportation energy use” section), as will the potential for autonomous vehicles to impact both total miles traveled and efficiency of driving. (“Transportation” section).
On the fuel composition side, two factors dominate emissions,
-
(1)
The fuel composition of electricity generation, including the rate of decline of coal, the duration of high use of natural gas, and the movement through higher use of natural gas (with about half the CO2 emissions of coal per unit of electric power) to renewables with no emissions (“Electricity” section). The role of state-level Renewable Portfolio Standards may be the most important policy here. California’s target of 100% clean (i.e., carbon-free generation) electricity by 2045 will have national implications, especially if other states follow its lead. Cleetus and colleagues [203] among others have developed scenarios of deep decarbonization of the electricity generation by where carbon dioxide emissions are reduced by 90% below 2005 levels in 2050. This would reduce total projected emissions in 2050 by 29%
-
(2)
The rate of in electrification of vehicles (“Transportation” section). An estimate by Keshavarzmohammadian and colleagues [204] finds that a BEV penetration of the light vehicle new sales market of 15% and 47% in 2030 and 2050 would reduce economy-wide emissions by 5% and 9% respectively compared to Business as Usual.
The development and large-scale deployment of advanced biofuels with low (less than 40%) net GHG emissions compared to petroleum-based fuels may assist in reducing GHG emissions from the transportation sector during any period of electrification and be particularly important for certain applications such as aviation which is challenging to electrify because of battery weight.
-
(3)
The level of natural gas use in all sectors over coming decades. This represents a “double-edged sword,” by reducing coal use but slowing renewable energy deployment. Further, fugitive emissions of methane from natural gas production and distribution can potentially offset all climate benefits of switching from coal. There is significant disagreement between current estimates of fugitive emissions [205] particularly from the oil and gas sector which accounts for 31% of methane emissions according to the U.S. Environmental Protection Agency [106] (a leak rate of 1.4%) but higher (2.3%) by other estimates [206]. This is an issue important to all users of natural gas in all sectors. Some have even posited that additional economic growth from low-cost natural gas may result in even higher emissions [207]; a full “Jevons Paradox.”
It is clear that there are many potential paths for GHG emissions from energy use in the United States which depend on the full range of socio-technological factors influencing the many transitions underway. Many important factors are within the scope of public policy at the national-level and of the 50 individual states.
The energy transitions are varied and complex and are entirely understandable only with the hindsight of many decades. The ongoing transitions in energy use will also have significant implications for other areas of public policy such as local environmental impacts, economics, global trade, and human development.
Notes
As an interesting aside, it is worth noting that in 2014, the U.S. Environmental Protection Agency projected that the, then proposed, Clean Power Plan, when fully implemented by 2030, would result in a reduction of GHG emissions of 32% below the 2005 level.
Note that wind turbines have a theoretical efficiency limit (the Betz limit) and photovoltaic cells have the Shockley–Queisser limit [109]. In-situ efficiencies fall well short of such limits.
Of course, the generation of electricity is just one type of primary energy conversion to end-use energy, albeit the largest.
Ancillary services are defined by FERC at those services “necessary to support the transmission of electric power from seller to purchaser given the obligations of control areas and transmitting utilities within those control areas to maintain reliable operations of the interconnected transmission system.”
Zero price bids are caused by the absence of fuel costs. Negative price bids are made possible by Production Tax Credits. Final market sales occur at the price of the last bid required to meet demand.
References
Smil V (2017) Energy, and civilization: a history. The MIT Press, Cambridge, MA
Geels FW, Schot J (2007) Typology of sociotechnical transition pathways. Res Policy 36(3):399–417
Ulli-Beer S (2014) Conceptual grounds of socio-technical transitions and governance dynamics. In: Ulli-Beer S (ed) Governance dynamics of energy technology change towards sustainability: Analysing and substantiating socio-technical transitions. Springer Verlag, Heidelberg
Geels FW (2002) Technological transitions as evolutionary reconfiguration processes: a multi-level perspective and a case study. Res Policy 31:257–1273
Geels FW (2011) The multi-level perspective on sustainability transitions: responses to seven criticisms. Environ Innov Soc Trans 1:24–40
Energy Information Administration (2018) Table 1.1 Primary energy overview and Table 1.3 Primary energy consumption by source, Monthly Energy Review (June 26, 2018), U.S. Department of Energy. https://www.eia.gov/totalenergy/data/monthly/. Accessed 4 Jul 2018
U.S. Census Bureau. US Population by Year. http://www.multpl.com/united-states-population/table. Accessed 4 Jul 2018
U.S. Bureau of Economic Analysis (2018) Real Gross Domestic Product [GDPC1], retrieved from FRED, Federal Reserve Bank of St. Louis; https://fred.stlouisfed.org/series/GDPC1. Accessed 10 Jul 2018
Vehmas J, Kaivo-oja J, Luukkanen J (2017) Energy efficiency trends in the European Union. In: Saarimaa R, Wilenius M (eds) Futures of a complex world, Finland futures research Centre, FFRC eBOOK 2/2018
International Energy Agency (2014) via World Bank (2018) Available at https://data.worldbank.org/indicator/EG.USE.PCAP.KG.OE. Accessed 4 Jul 2018
BP (2018) Statistical Review of World Energy. Available at https://www.bp.com/en/global/corporate/energy-economics/statistical-review-of-world-energy.html. Accessed 4 Jul 2018
Energy Information Administration (2005) The National Energy Modeling System: An Overview 2009, Office of Integrated Analysis and Forecasting U.S. Department of Energy. Available at https://www.eia.gov/outlooks/aeo/nems/overview/pdf/0581(2009).pdf. Accessed 12 Jul 2018
Energy Information Administration, Annual Energy Outlook Products – Archive. Available at https://www.eia.gov/outlooks/aeo/archive.php. Accessed 13 Jul 2018
Boedecker E, Chase N, Jarzomski K, Sukunta M, Turnure J (2018) Alternative Policies in Power Generation and Energy Demand Markets, Energy Information Administration. Available at https://www.eia.gov/outlooks/aeo/ppg.php. Accessed 18 Jul 2018
Energy Information Administration (2018) Table 3.1 Petroleum Overview and Table 4.1 Natural Gas Overview, Monthly Energy Review (June 26, 2018) U.S. Department of Energy. Available at https://www.eia.gov/totalenergy/data/monthly/. Accessed 4 Jul 2018
BP (2018) Oil Production – Barrels (from 1965) Statistical Review of World Energy. Available at https://www.bp.com/en/global/corporate/energy-economics/statistical-review-of-world-energy.html. Accessed 4 Jul 2018
BP (2018) Gas Production – Mtoe (from 1970) Statistical Review of World Energy. Available at https://www.bp.com/en/global/corporate/energy-economics/statistical-review-of-world-energy.html. Accessed 4 Jul 2018
Energy Information Administration (2015) World Shale Resource Assessments. Available at https://www.eia.gov/analysis/studies/worldshalegas/. Accessed 8 Jul 2018
Energy Information Administration (2017) International Energy Outlook 2017. Available at https://www.eia.gov/outlooks/ieo/. Accessed 16 Jul 2018
International Energy Agency Unconventional gas production database. Available at https://www.iea.org/ugforum/ugd/. Accessed 17 Jul 2018
Energy Information Administration (2018) Henry Hub Natural Gas Spot Price. Available at https://www.eia.gov/dnav/ng/hist/rngwhhdM.htm. Accessed 11 Jul 2018
For example, Environmental Protection Agency (2018) Renewable Fuel Standard Program. Available at https://www.epa.gov/renewable-fuel-standard-program. Accessed 9 Jul 2018
Energy Information Administration (2018) Table 2.5 Transportation sector energy consumption, Monthly Energy Review (June 26, 2018) U.S. Department of Energy. https://www.eia.gov/totalenergy/data/monthly/. Accessed 4 Jul 2018
BP (2018) Renewables - Biofuels production - Kboe/d (from 1990) Statistical Review of World Energy. Available at https://www.bp.com/en/global/corporate/energy-economics/statistical-review-of-world-energy.html. Accessed 9 Jul 2018
Energy Information Administration (2018) Table 7.2a Electricity Net Generation Total (all sectors) Monthly Energy Review (June 26, 2018) U.S. Department of Energy. https://www.eia.gov/totalenergy/data/monthly/. Accessed 17 Jul 2018
BP (2008) Renewables - Wind generation - TWh (from 1965) Statistical Review of World Energy. Available at https://www.bp.com/en/global/corporate/energy-economics/statistical-review-of-world-energy.html. Accessed 17 Jul 2018
BP (2008) Renewables - Solar generation - TWh (from 1965) Statistical Review of World Energy. Available at https://www.bp.com/en/global/corporate/energy-economics/statistical-review-of-world-energy.html. Accessed 17 Jul 2018
For example, Montgomery C, Smith M (2010) Hydraulic fracturing—history of an enduring technology. J Petrol Technol 62(12):80–85. Available at http://www.ourenergypolicy.org/wp-content/uploads/2013/07/Hydraulic.pdf. Accessed 12 Jul. and King, H. (N/A) Directional and Horizontal Drilling in Oil and Gas Wells, Geology.com. Available at https://geology.com/articles/horizontal-drilling/. Accessed 17 Jul 2018
Department of Energy (2015) Unconventional Oil and Gas in Chapter 7: Advancing Systems and Technologies to Produce Cleaner Fuels Technology Assessments, Quadrennial Technology Review 2015. Available at https://www.energy.gov/sites/prod/files/2016/03/f30/QTR2015-7G-Unconventional-Oil-and-Gas.pdf. Accessed 17 Jul 2018
For example, Hatzenbuhler H, Centner TJ (2012) Regulation of water pollution from hydraulic fracturing in horizontally-drilled Wells in the Marcellus shale region, USA, Water 4(4):983–994
For example, Kear AR (2018) Natural gas policy path: built to boom. J Policy Hist 30(2):334–365
Tyner WE (2008) The US ethanol and biofuels boom: its origins, current status, and future prospects. BioScience 58(7):646–653 Available at https://doi.org/10.1641/B580718. Accessed 16 Jul 2018
Department of Energy (2018) FY 2019 budget justification. 3(2):61 Available at https://www.energy.gov/sites/prod/files/2018/03/f49/FY-2019-Volume-3-Part-2.pdf. Accessed 13 Jul 2018
Gallagher PW, Yee WC, Baumes HS (2016) 2015 energy balance for the corn-ethanol industry. Office of Energy Policy and New Uses, United States Department of Agriculture
For example, Pimentel, D. and T. Patzek (2005), Ethanol production using corn, switchgrass, and wood; biodiesel production using soybean and sunflower, Nat Resour Res 14, 65
Department of Energy (2018) FY 2019 budget justification. 3(2):109–146 Available at https://www.energy.gov/sites/prod/files/2018/03/f49/FY-2019-Volume-3-Part-2.pdf. Accessed 13 Jul 2018
Federal Power Act, 16 U.S. Code Chapter 12. Available at https://www.law.cornell.edu/uscode/text/16/chapter-12. Accessed 17 Jul 2018
Renewable Portfolio Standards are also known as Clean Energy Standards and Renewable Electricity Standards. See, for example, Database of State Incentives for Renewables & Efficiency (2018) Renewable Energy Portfolio Standard, North Carolina Clean Energy Technology Center. Available at http://programs.dsireusa.org/system/program/detail/1085. Accessed 19 Jan 2018
California Legislative Information (2018) Senate Bill 100. Available online at https://leginfo.legislature.ca.gov/faces/billNavClient.xhtml?bill_id=201720180SB100. Accessed 10 Sept 2018
Barbose G (2017) U.S. Renewables Portfolio Standards 2017 Annual Status Report, Lawrence Berkeley National Laboratory. Available at https://emp.lbl.gov/projects/renewables-portfolio/. Accessed 13 Jul 2018
For example, Wiser R et al (2017) Assessing the costs and benefits of US renewable portfolio standards. Environ Res Lett 12:094023. Available at http://iopscience.iop.org/article/10.1088/1748-9326/aa87bd. Accessed 17 Jul 2018
Mone C et al (2017) 2015 cost of wind energy review, technical report NREL/TP-6A20–66861. National Renewable Energy Laboratory
Lyon TP, Yin H (2010) Energy J 31:133–157
Vasseur M (2016) Incentives or mandates? Determinants of the renewable energy policies of U.S. states, 1970-2012. Soc Probl 63(2):284–301
Barradale MJ (2010) Impact of public policy uncertainty on renewable energy investment: wind power and the production tax credit. Energy Policy 8(12):7698–7709
Trieu, M. et al. (2015). Impact of Federal tax Policy on utility-scale solar deployment given financing interactions, National Renewable Energy Laboratory, NREL/PR -6A20–65014
Consolidated Appropriations Act of 2016. Available at https://www.congress.gov/bill/114th-congress/house-bill/2029/text
See for example: Energy Information Administration (2018) Levelized Cost and Levelized Avoided Cost of New Generation Resources in the Annual Energy Outlook 2018. Available at https://www.eia.gov/outlooks/aeo/pdf/electricity_generation.pdf. Accessed 8 Jul 2018
Lazard (2017) Lazard’s Levelized Cost of Energy Analysis – Version 11.0. Available at https://www.lazard.com/media/450337/lazard-levelized-cost-of-energy-version-110.pdf. Accessed 5 Jul 2018
Stehly T, Heimiller D, Scott G (2017) 2016 Cost of Wind Energy Review, National Renewable Energy Laboratory, Technical Report NREL/TP-6A20–70363. Available at https://www.nrel.gov/docs/fy18osti/70363.pdf. Accessed 17 Jul 2018
Feldman D, Hoskins J, Margolis R (2018) Q4 2017/Q1 2018 Solar Industry Update, National Renewable Energy Laboratory. Available at https://www.nrel.gov/docs/fy18osti/71493.pdf. Accessed 17 Jul 2018
U.S. Geological Survey, National Oil and Gas Assessment (website). Available at https://energy.usgs.gov/OilGas/AssessmentsData/NationalOilGasAssessment.aspx. Accessed 18 Jul 2018
Kah M (2018) Uncertainties in Forecasting US Tight Oil Production, Commentary, Center on Global Energy Policy, Columbia University. Available at https://energypolicy.columbia.edu/research/commentary/uncertainties-forecasting-us-tight-oil-production. Accessed 7 Jul 2018
Energy Information Administration (2018) Table 1, Annual Energy Outlook 2018. Available at https://www.eia.gov/outlooks/aeo/. Accessed 17 Jul 2018
Stock JH (2018) Reforming the Renewable Fuel Standard, Center on Global Energy Policy, Columbia University. Available at http://energypolicy.columbia.edu/research/report/reforming-renewable-fuel-standard. Accessed on 16 Jul 2018
Moriarty K, Yanowitz Y (2015) E15 and Infrastructure, National Renewable Energy Laboratory. Available at https://www.nrel.gov/docs/fy15osti/64156.pdf. Accessed on 16 Jul 2018
Environmental Protection Agency (2016), Lifecycle Greenhouse Gas Results. Available at https://www.epa.gov/fuels-registration-reporting-and-compliance-help/lifecycle-greenhouse-gas-results. Accessed 16 Jul 2018
International Renewable Energy Agency (2018) Electricity Storage and Renewables: Costs and Markets to 2030. Available online at http://www.irena.org/-/media/Files/IRENA/Agency/Publication/2017/Oct/IRENA_Electricity_Storage_Costs_2017.pdf. Accessed 10 Sep 2018
Patel S (2018) The Big Picture: Energy Storage Mandates, Power magazine, March 1, 2018. Available online at https://www.powermag.com/the-big-picture-energy-storage-mandates/
Hart DM, Bonvillian WB, Austin N (2018) Energy storage for the grid: policy options for sustaining innovation, An MIT energy initiative working paper. Massachusetts Institute of Technology
U.S. Department of Energy (2015) Wind Vision: A New Era for Wind Power in the United States. Available at https://www.energy.gov/eere/wind/maps/wind-vision. Accessed 18 Jul 2018
American Wind Energy Association (2018) Wind Energy in the United States Fact Sheet. Available at https://www.awea.org/fact-sheets. Accessed 20 Jul 2018
U.S. Department of Energy (2017) Sunshot Initiative 2030 Goals Report. Available at https://www.energy.gov/eere/solar/downloads/sunshot-initiative-2030-goals-paper-and-graphics
Cole W et al (2017) SunShot 2030 for Photovoltaics (PV): Envisioning a Low-cost PV Future, National Renewable Energy Laboratory, NREL/TP-6A20–68105. Available at https://www.nrel.gov/docs/fy17osti/68105.pdf
Cole W (2017) 2017 Standard Scenarios Report: A U.S. Electricity Sector Outlook, National Renewable Energy Laboratory, NREL/TP-6A20–68548. Available at https://www.nrel.gov/docs/fy18osti/68548.pdf
Energy Information Administration (2018) Table 16, Annual Energy Outlook 2018. Available at https://www.eia.gov/outlooks/aeo/tables_ref.php. Accessed 17 Jul 2018
Energy Information Administration (2018) Table 4.1 Natural Gas Overview, Monthly Energy Review (June 26, 2018) U.S. Department of Energy. https://www.eia.gov/totalenergy/data/monthly/. Accessed 4 Jul 2018
Energy Information Administration (2018) Table 1–1, Total Energy Supply, Disposition, and Price summary, Projections Tables for Side Cases, Annual Energy Outlook 2018. Available at https://www.eia.gov/outlooks/aeo/tables_side.php. Accessed 17 Jul 2018
Energy Information Administration (2018) Table 13, Annual Energy Outlook 2018. Available at https://www.eia.gov/outlooks/aeo/tables_ref.php. Accessed 17 Jul 2018
Energy Information Administration (2017) United States expected to become a net exporter of natural gas this year, Today in Energy. Available at https://www.eia.gov/todayinenergy/detail.php?id=32412. Accessed 7 Jul 2018
Lu J, Qi Y (2018) U.S. gas to China: Positive energy for bilateral relations, Brookings Institute. Available at https://www.brookings.edu/2018/05/31/u-s-gas-to-china-positive-energy-for-bilateral-relations/. Accessed 7 Jul 2018
Federal Energy Regulatory Commission (2018) LNG Available at https://www.ferc.gov/industries/gas/indus-act/lng.asp. Accessed 11 Jul 2018
Cooper M et al (2015) The Macroeconomic Impact of Increasing U.S. LNG Exports, report by Leonardo Technologies, Inc. for U.S. Department of energy. Available at https://www.energy.gov/sites/prod/files/2015/12/f27/20151113_macro_impact_of_lng_exports_0.pdf
Maxwell D, Zhu Z (2011) Natural gas prices, LNG transport costs, and the dynamics of LNG imports. Energy Econ 33(2):217–226
International Energy Agency (2018) Statistics. Available at http://www.iea.org/statistics/statisticssearch/. Accessed 11 Jul 2018
Energy Information Administration (2018) Short-Term Energy Outlook - Gasoline and Diesel Fuel Update. Available at https://www.eia.gov/petroleum/gasdiesel/. Accessed 17 Jul 2018
Energy Information Administration (2018) Table 10.1 Renewable energy production and consumption by source, Monthly Energy Review (June 26, 2018) U.S. Department of Energy. https://www.eia.gov/totalenergy/data/monthly/. Accessed 4 Jul 2018
Energy Information Administration (2018) Table 7.2b Electricity Net Generation – Electric power sector, Monthly Energy Review (June 26, 2018) U.S. Department of Energy. https://www.eia.gov/totalenergy/data/monthly/
Energy Information Administration (2018) Table 6.2 Coal consumption by sector, Monthly Energy Review (June 26, 2018) U.S. Department of Energy. https://www.eia.gov/totalenergy/data/monthly/
Energy Information Administration (2018) Table 6.1 Coal Overview, Monthly Energy Review (June 26, 2018) U.S. Department of Energy. https://www.eia.gov/totalenergy/data/monthly/. Accessed 19 Jul 2018
Energy Information Administration (2018) Tables 2.1–2.5 Energy consumption by sector, Monthly Energy Review (June 26, 2018) U.S. Department of Energy. https://www.eia.gov/totalenergy/data/monthly/. Accessed 19 Jul 2018
Energy Information Administration (2018) Table 2.2 Residential sector energy consumption, Monthly Energy Review (June 26, 2018) U.S. Department of Energy. https://www.eia.gov/totalenergy/data/monthly/. Accessed 19 Jul 2018
Kaivo-oja J, Luukkanen J, Malaska P (2001) Advanced sustainability analysis. In: Tolba MK (ed) Our fragile world. Challenges and opportunities for sustainable development, encyclopedia of life support systems and sustainable development, vol 2. EOLSS Publishers Co. Ltd, Oxford
Energy Information Administration (2016) Global energy intensity continues to decline, Today in Energy. Available at https://www.eia.gov/todayinenergy/detail.php?id=27032#. Accessed 12 Jul 2018
World Bank, Sustainable Energy for All (SE4ALL) database from the SE4ALL Global Tracking Framework led jointly by the World Bank, International Energy Agency, and the Energy Sector Management Assistance Program, Energy intensity level of primary energy (MJ/$2011 PPP GDP). Available at https://data.worldbank.org/indicator/EG.EGY.PRIM.PP.KD. Accessed 12 Jul 2018
Samuelson RD (2014) The unexpected challenges of using energy intensity as a policy objective: examining the debate over the APEC energy intensity goal. Energy Policy 64:373–381
For example: Heinen S (2013) Analyzing Energy Use with Decomposition Methods, International Energy Agency Energy Training Week. Available at https://www.iea.org/media/training/presentations/Day_3_Session_12_Indicators_Decomposition_Methods.pdf. Accessed 7 Jul 2018
Decomposition methods include, Laspeyres index, Paasche index, Simple average divisia, Fisher Ideal, Parametric Divisia, and Log Mean Divisia. See for example: Ang BW (2004). Decomposition analysis for policymaking in energy: which is the preferred method? Energy Policy 32(9):1131–1139
Metcalf GE (2008) An empirical analysis of energy intensity and its determinants at the state level. Energy J 29 International Association for Energy Economics
Burnet JW, Madariaga J (2017) The convergence of U.S. state-level energy intensity. Energy Econ 62:357–370
Huntington HD (2010) Structural change and U.S. energy use: recent patterns. Energy J 31(3) International Association for Energy Economics
Belzer DB (2014) A comprehensive system of energy intensity indicators for the U.S.: methods, data and key trends, PNNL-22267. Pacific Northwest National Laboratory
Belzer DB, Bender SR, Cort KA (2017) A comprehensive system of energy intensity indicators for the U.S.: methods, data and key trends, PNNL-22267. Pacific Northwest National Laboratory
See, for example, Owen D (2011) The conundrum: how scientific innovation, increased efficiency, and good intentions can make our energy and climate problems worse. Riverhead Books, New York
Powerplant and Industrial Fuel Use Act of 1978
Natural Gas Policy Act of 1978
Public Utilities Regulatory Policies Act of 1978
Houser T, Bordoff J, Marsters P (2017) Can coal make a comeback? Center on Global Energy Policy, Columbia University, New York Available at http://energypolicy.columbia.edu/publications/report/can-coal-make-comeback. Accessed 17 Jul 2018
77 Fed. Reg. 9304 (2012) Available at https://www.gpo.gov/fdsys/pkg/FR-2012-02-16/pdf/2012-806.pdf
Energy Information Administration (2017) Projected electricity generation mix is sensitive to policies, natural gas prices, Today in Energy. Available at https://www.eia.gov/todayinenergy/detail.php?id=29952. Accessed 19 Jul 2018
Mignone BK et al (2017) Sensitivity of natural gas deployment in the US power sector to future carbon policy expectations. Energy Policy 110:518–524
Scott M (2018) Nuclear Power Outlook, Energy Information Administration. Available at https://www.eia.gov/outlooks/aeo/npo.php
For example, Shea D, Hartman K (2017) State Action in Support of Nuclear Generation, National Conference of State Legislators. Available at http://www.ncsl.org/research/energy/state-action-in-support-of-nuclear-generation.aspx
International Atomic Energy Agency (2018) Power Reactor Information System. Available at https://www.iaea.org/PRIS/home.aspx. Accessed 4 Jul 2018
Energy Information Administration (2018a) Table 12.6 Carbon dioxide emissions from energy consumption – Electric Power Sector, Monthly Energy Review (June 26, 2018) U.S. Department of Energy. Available at https://www.eia.gov/totalenergy/data/monthly/. Accessed 20 Jul 2018
Environmental Protection Agency (2018) Inventory of U.S. Greenhouse Gas Emissions and Sinks: 1990–2016. Available at https://www.epa.gov/ghgemissions/inventory-us-greenhouse-gas-emissions-and-sinks-1990-2016. Accessed 7 Jul 2018
For example, U.S. Environmental Protection Agency (2017) Air Data: Air Quality Data Collected at Outdoor Monitors Across the US at https://www.epa.gov/outdoor-air-quality-data. Accessed 23 Jan 2018
Energy Information Administration (2018). Nearly all power plants that retired in the past decade were powered by fossil fuels, U.S. Department of Energy. Available at https://www.eia.gov/todayinenergy/detail.php?id=34452. Accessed 27 Jan 2018
For example, see: Andrews J, Jelley N (2017) Energy science: principles, technologies, and impacts, 3rd edn. Oxford University Press, p 87
Patel S (2018) GE HA Turbine Snags Another World Record for CCGT Efficiency, Power Magazine. Available at http://www.powermag.com/ge-ha-turbine-snags-another-world-record-for-ccgt-efficiency/. Accessed 11 Jul 2018
Energy Information Administration (2018) Table 8.1. Average Operating Heat Rate for Selected Energy Sources, Electric Power Annual. Available at https://www.eia.gov/electricity/annual/. Accessed 23 Oct 2018
Energy Information Administration (2018) Table 2.6 Electric power sector energy consumption, Table 7.2b Electricity net generation: Electric power sector, and Table 7.3b Consumption of combustible fuels for electricity generation: Electric power sector, Monthly Energy Review. Available at https://www.eia.gov/totalenergy/data/monthly/. Accessed 12 Jul 2018
U.S. Department of Energy (2016), Accounting Methodology for Source Energy of Non-Combustion Renewable Electricity Generation, DOE (October 2016). https://www.energy.gov/eere/analysis/downloads/accounting-methodology-source-energy-non-combustible-renewable-electricity. Accessed 12 Jul 2018
Ferris D (2016) How a data tweak could rock tomorrow's grid, Energywire: Wednesday, November 30, 2016. E&E News Available at https://www.eenews.net/stories/1060046374
Energy Information Administration (2018) Table 7.1 Electricity Overview, Monthly Energy Review (June 26, 2018) U.S. Department of Energy. https://www.eia.gov/totalenergy/data/monthly/. Accessed 17 Jul 2018. Fig. 22
International Energy Agency (2014) via World Bank (2018). Available at https://data.worldbank.org/indicator/EG.USE.ELEC.KH.PC. Accessed 18 Jul 2018
For example: Federal Power Act; National Primary and Secondary Ambient Air Quality Standards, 42 U.S. Code § 7409, Available at https://www.law.cornell.edu/uscode/text/42/7409; and the Mercury and Air Toxics Standards, 77 Fed. Reg. 9304 (2012), Available at https://www.gpo.gov/fdsys/pkg/FR-2012-02-16/pdf/2012-806.pdf
Lazar J (2016) In: Second Edition (ed) Electricity regulation in the US: a guide. The Regulatory Assistance Project, Montpelier, VT Available at http://www.raponline.org/knowledge-center/electricityregulation-in-the-us-a-guide-2
For example, Ela E et al (2018) Overview of wholesale electricity markets. In: Lopes F, Coelho H (eds) Electricity markets with increasing levels of renewable generation: structure, operation, agent-based simulation, and emerging designs. Studies in systems, decision and control, vol 144. Springer, Cham
RTOs were advanced by the 1999 Federal Energy Regulatory Commission Order 2000 adopted under the Federal Power Act. Available at https://www.ferc.gov/legal/maj-ord-reg/land-docs/RM99-2A.pdf. Accessed 17 Jul 2018
Energy Information Administration (2017) State Energy Consumption Estimates, 1960 through 2015, DOE/EIA-0214(2015) (June 2017), Table C11, Energy Consumption Estimates by Source, Ranked by State, 2015, U.S. Department of Energy
Energy Information Administration, 1990–2016 Retail Sales of Electricity by State by Sector by Provider (EIA-861). https://www.eia.gov/electricity/data/state/ (Release Date: November 9, 2017), U.S. Department of Energy. Accessed 8 Jul 2018
U.S. Bureau of the Census, Annual Estimates of the Population for the U.S. and States, and for Puerto Rico, retrieved from FRED, Federal Reserve Bank of St. Louis; Available at https://fred.stlouisfed.org/release?rid=118. Accessed 8 Jul 2018
Sudarshan A (2001), Deconstructing the Rosenfeld curve: structural determinants of energy consumption (dissertation), Stanford University and Sudarshan A (2013), Deconstructing the Rosenfeld Curve: Making sense of California’s low electricity intensity
Levinson A (2013) California energy efficiency: lessons for the rest of the world or not? Working paper 19123. National Bureau of Economic Research
Energy Information Administration, 1990–2016 Retail Sales of Electricity by State by Sector by Provider (EIA-861) (November 9, 2017), U.S. Department of Energy. Accessed 8 Jul 2018
Energy Information Administration (2018) 2015 Residential Energy Consumption Survey. Available at https://www.eia.gov/consumption/residential/data/2015/, and U.S. Energy Information Administration (2016) 2012 Commercial Building Energy Consumption Survey. Available at https://www.eia.gov/consumption/commercial/data/2012/
U.S. Energy Information Administration (2015) Drivers of U.S. household energy consumption, 1980–2009. U.S. Department of Energy Available at https://www.eia.gov/analysis/studies/buildings/households/. Access 19 Jan 2019
U.S. Energy Information Administration (2015) 2012 commercial buildings energy consumption survey, energy use summary. U.S. Department of Energy Available at https://www.eia.gov/consumption/commercial/. Accessed 20 Jan 2018
Energy Information Administration (2017) 1990–2016 retail sales of electricity by state by sector by provider (EIA-861) (November 9, 2017). U.S. Department of Energy https://www.eia.gov/electricity/data/state/. Accessed 8 Jan 2018
Energy Information Administration (2018) Electric sales, revenue, and average Price. U.S. Department of Energy Available at https://www.eia.gov/electricity/sales_revenue_price/. Accessed 8 Jan 2018
Energy Information Administration (2018) What is a degree day? https://www.eia.gov/energyexplained/index.php?page=about_degree_days Accessed 6 Jul 2018
Energy Information Administration (2018) Table 1.9 Heating degree-days by Census division and Table 1.10 Cool degree-days by census division, Monthly Energy Review. Available at https://www.eia.gov/totalenergy/data/monthly/pdf/sec1_21.pdf and Energy Information Administration (2018) Electricity Data. Available at https://www.eia.gov/electricity/data.php. Accessed 17 Jul 2018
American Council for an Energy-Efficient Economy (2018) Energy Efficiency Resource Standard (EERS). https://aceee.org/topics/energy-efficiency-resource-standard-eers. Accessed 4 Jul
Hoffman IM et al (2017) Estimating the cost of saving electricity through U.S. utility customer-funded energy efficiency programs. Energy Policy 104:1–12. https://doi.org/10.1016/j.enpol.2016.12.044
For example, Maryland Energy Administration, EmPOWER Maryland http://energy.maryland.gov/Pages/Facts/empower.aspx and First Energy Corp, Potomac Edison, Save Energy. https://www.firstenergycorp.com/content/customer/save_energy/save_energy_maryland.html. Accessed 17 Jul 2018
Energy Information Administration (2018) State efficiency incentives averaged $24 per customer, ranged from $0 to $128 in 2016, Today in Energy. Available at https://www.eia.gov/todayinenergy/detail.php?id=36512. Accessed 18 Jul 2018
Berg W et al (2017) The 2017 State Energy Efficiency Scorecard, American Council for an Energy-Efficient Economy. Available at https://aceee.org/research-report/u1710. Accessed 19 Jul 2018
U.S. Department of Energy. State Code Adoption Tracking Analysis, Building Energy Codes Program. Available at https://www.energycodes.gov/state-code-adoption-tracking-analysis. Accessed 19 Jul 2018
Department of Energy (2018) FY 2019 budget justification. 3(2):199–222 Available at https://www.energy.gov/sites/prod/files/2018/03/f49/FY-2019-Volume-3-Part-2.pdf. Accessed 13 Jul 2018
Department of Energy (2017) Building Technologies Office FY 2017 Budget at a Glance. Available at https://www.energy.gov/sites/prod/files/2016/03/f30/At_A_GLANCE%20%28BTO%29.pdf. Accessed 19 Jul 2018
Sanderford AR, McCoy AP, Keefe MJ (2017) Adoption of energy star certifications: theory and evidence compared. Build Res Inf 46(2):207–219
Federal Energy Regulatory Commission (1996) Order 888. Available at https://www.ferc.gov/legal/maj-ord-reg/land-docs/order888.asp. Accessed 25 Jul 2018
Nicholson E, Rogers J, Porter K (2010) The relationship between wind generation and balancing-energy market prices in ERCOT: 2007–2009, National Renewable Laboratory, NREL/SR-5500-49415
For example: Federal Energy Regulatory Commission (2016) Reliability Primer. Available at https://www.ferc.gov/legal/staff-reports/2016/reliability-primer.pdf
Federal Energy Regulatory Commission (2018) Order 841 Electric Storage Participation in Regional Markets. Available at https://www.ferc.gov/whats-new/comm-meet/2018/021518/E-1.pdf. Accessed 18 Jul 2018
Federal Energy Regulatory Commission (2011) Order 745Demand Response Compensation in Organized Wholesale Energy Markets. Available at https://www.ferc.gov/EventCalendar/Files/20110315105757-RM10-17-000.pdf. Accessed 18 Jul 2018
§205 of the Federal Power Act. Available at https://www.law.cornell.edu/uscode/text/16/824d Accessed 18 Jul 2018
Jacobs SB (2017) The energy prosumer. Ecol Law Q 43(3):519–579 Available at https://scholarship.law.berkeley.edu/cgi/viewcontent.cgi?article=2136&context=elq. Accessed 18 Jul 2018
Federal Energy Regulatory Commission (2011) Order 1000 Transmission Planning and Cost Allocation by Transmission Owning and Operating Public Utilities. Available at https://www.ferc.gov/whats-new/comm-meet/2011/072111/E-6.pdf. Accessed 18 Jul 2018
For example: Spector J (2018) New Hampshire Rejects Northern Pass Transmission Line Permit, Greentech Media. Available at https://www.greentechmedia.com/articles/read/new-hampshire-rejects-northern-pass#gs.rsvmvhc. Accessed 18 Jul 2018
Board of Governors of the Federal Reserve System (US). Industrial Production Index [INDPRO], retrieved from FRED, Federal Reserve Bank of St. Louis; https://fred.stlouisfed.org/series/INDPRO. Accessed 20 Aug 2018
Energy Information Administration (2018) Table 2.4 Industrial sector energy consumption, Monthly Energy Review (June 26, 2018) U.S. Department of Energy. https://www.eia.gov/totalenergy/data/monthly/. Accessed 20 Aug 2018
Energy Information Administration (2018a) Table 4.3 Natural gas consumption by sector, Monthly Energy Review (June 26, 2018). Available at https://www.eia.gov/totalenergy/data/monthly/. Accessed 20 Aug 2018
Energy Information Administration (2018a) Table 12.4 Carbon dioxide emissions from energy consumption - Industrial sector, Monthly Energy Review (June 26, 2018) U.S. Department of Energy. Available at https://www.eia.gov/totalenergy/data/monthly/ Accessed 20 Aug 2018
Energy Information Administration (2018) Tables 25–35, Annual Energy Outlook 2018, U.S. Department of Energy. Available at https://www.eia.gov/outlooks/aeo/. Accessed 16 Aug 2018
U.S. Bureau of Economic Analysis and U.S. Bureau of the Census, Trade Balance: Goods, Balance of Payments Basis [BOPGTB], retrieved from FRED, Federal Reserve Bank of St. Louis; https://fred.stlouisfed.org/series/BOPGTB. Accessed 11 Jan 2018
Data Source: U.S. Geological Survey (2017) Iron and Steel Statistics and Information, https://minerals.usgs.gov/minerals/pubs/commodity/iron_&_steel/. Accessed 21 Jul 2018
Energy Information Administration (2018) Petroleum & Other Liquids Weekly Imports & Exports. Accessed 11 Jan 2018
Energy Information Administration (2018) U.S. Exports of Finished Petroleum Products. Available at https://www.eia.gov/dnav/pet/hist/LeafHandler.ashx?n=PET&s=MTPEXUS2&f=A. Accessed 27 Jul 2018 and Energy Information Administration (2018) and Energy Information Administration (2018)
Energy Information Administration (2018) U.S. Imports of Finished Petroleum Products. Available at https://www.eia.gov/dnav/pet/hist/LeafHandler.ashx?n=PET&s=MTPIMUS2&f=A Accessed 27 Jul 2018 and Energy Information Administration (2018) and Energy Information Administration (2018)
U.S. Department of Agriculture Foreign Agriculture Service (2018) Percentage of Agricultural Products Exported. Available at https://www.fas.usda.gov/data/percentage-us-agricultural-products-exported. Accessed 21 Jul 2018
For example, Nadel S, Elliott N, Langer T. Energy efficiency in the United States: 35 years and counting (Washington, DC: American Council for an Energy-Efficient Economy, June 2015), report E1502, 1–2. Available at www.ourenergypolicy.org/wp-content/uploads/2015/07/e1502.pdf. Accessed 6 Feb 2018
Huntington H (2009) Structural Change and U.S. Energy Use: Recent Patterns, Stanford University Energy Modeling Forum, July 2009. https://web.stanford.edu/group/emf-research/docs/occasional_papers/op65.pdf. Accessed 8 Dec 2017
Transportation Energy Data Book Edition 36 (2017) Table 2.8 Transportation Energy Use by Mode, Center for Transportation Analysis (CTA) in the Oak Ridge National Laboratory. cta.ornl.gov/data. Accessed 15 Dec 2017
U.S. Federal Highway Administration, moving 12-month Total Vehicle Miles Traveled [M12MTVUSM227NFWA], retrieved from FRED, Federal Reserve Bank of St. Louis; https://fred.stlouisfed.org/series/M12MTVUSM227NFWA. Accessed 26 Jan 2018
Environmental Protection Agency (2018) Light-Duty Automotive Technology, Carbon Dioxide Emissions, and Fuel Economy Trends: 1975 Through 2017, Table 2.1 EPA-420-R-18-001. https://www.epa.gov/fuel-economy-trends. Accessed 19 Jan 2018
Massachusetts v. Environmental Protection Agency, 549 U.S. 497 (2007)
Energy Policy and Conservation Act of 1975. See, for example, Yacobucci, Brent D., Bill Canis and Richard K. Lattanzio (2012), Automobile and Truck Fuel Economy (CAFE) and Greenhouse Gas Standards, R42721, Congressional Research Service
U.S. Environmental Protection Agency (2017) EPA to Reexamine Emission Standards for Cars and Light Duty Trucks — Model Years 2022–2025, Press Release March 15, 2017
HIS Markit (2016) Vehicles Getting Older: Average Age of Light Cars and Trucks in U.S. Rises Again in 2016 to 11.6 Years, IHS Markit Says, IHS Markit Press Release, Tuesday, November 22, 2016
For example, Alternative Fuels Data Center (2018) Renewable Fuel Standard, Database of State Incentives for Renewables & Efficiency https://www.afdc.energy.gov/laws/RFS.html. Accessed 19 Jan 2018
Energy Information Administration (2018) Annual Energy Outlook 2018, Table A.2., U.S. Department of Energy. Available at https://www.eia.gov/outlooks/aeo/. Accessed 16 Aug 2018
Energy Information Administration (2018) Tables 12.2–12.6 Carbon dioxide emissions from energy consumption, Monthly Energy Review (June 26, 2018) U.S. Department of Energy. https://www.eia.gov/totalenergy/data/monthly/. Accessed 17 Jul 2018
Energy Information Administration (2018) Table 18. Energy-Related Carbon Dioxide Emissions by Sector and Source, Annual Energy Outlook 2018. Available at https://www.eia.gov/outlooks/aeo/. Accessed 17 Jul 2018
For example: Worland J (2017) Solar and Wind Power Face Serious Threats from the Trump Administration, Time (December 8, 2018). Available at http://time.com/5049849/solar-power-wind-power-trump-coal/
Thompson H, Kempton W (2018) Perceptions and attitudes of residents living near a wind turbine compared with those living near a coal power plant. Renew Energy 123(8):301–311
Energy Information Administration (2018) Table 1.1.A. Net Generation from Renewable Sources: Total (All Sectors) Electric Power Monthly (April 2018). https://www.eia.gov/electricity/monthly/. Accessed 17 Jul 2018
For example, Energy Information Administration (2017) Three Mile Island is the latest nuclear power plant to announce retirement plans, Today in Energy. https://www.eia.gov/todayinenergy/detail.php?id=31612. Accessed 5 Jul 2018
World Nuclear Association (2018) Small Nuclear Reactor Reactors. http://www.world-nuclear.org/information-library/nuclear-fuel-cycle/nuclear-power-reactors/small-nuclear-power-reactors.aspx. Accessed 5 Jul 2018
Sharp P, Kuczynski S (2017) The future of nuclear energy in the United States, 2016 forum of the future of nuclear energy. The Aspen Institute
U.S. Department of Energy (2017) Global Energy Storage Database. Available online at http://www.energystorageexchange.org/projects/data_visualization. Accessed 10 Sep 2018
Jacobson M et al (2015) 100% clean and renewable wind, water, and sunlight (WWS) all-sector energy roadmaps for the 50 United States. Energy Environ Sci 8:2093–2117
Jacobson M et al (2015) Low-cost solution to the grid reliability problem with 100% penetration of intermittent wind, water, and solar for all purposes. Proc Natl Acad Sci U S A 112:15060–15065
Clack C et al (2017) Evaluation of a proposal for reliable low-cost grid power with 100% wind, water, and solar. PNAS 114(26):6722–6727
Alexander MD et al (2016) Future cost-competitive electricity systems and their impact on US CO2 emissions. Nat Clim Chang (6):526–531
Inside EVs (2018) Monthly Plug-In Sales Scorecard. https://insideevs.com/monthly-plug-in-sales-scorecard/
U.S. Department of Energy (2018) Electric Vehicles: Tax Credits and Other Incentives. Available online at https://www.energy.gov/eere/electricvehicles/electric-vehicles-tax-credits-and-other-incentives. Accessed 10 Sep 2018
Plug In America (2018) State Incentives. Available at https://pluginamerica.org/why-go-plug-in/state-federal-incentives/. Accessed 10 Sep 2018
Nykvist B, Nilsson M (2015) Rapidly falling costs of battery packs for electric vehicles. Nat Clim Chang 5:329
Union of Concerned Scientists (2017) Accelerating US Leadership in Electric Vehicles, Policy Brief. Available online at https://www.ucsusa.org/sites/default/files/attach/2017/09/cv-factsheets-ev-incentives.pdf?_ga=2.108452610.1630188791.1517413160-1434713090.1436805699. Accessed 10 Sep 2018
Chediak M (2017) The Latest Bull Case for Electric Cars: the Cheapest Batteries Ever, Bloomberg New Energy Finance. Available at https://about.bnef.com/blog/latest-bull-case-electric-cars-cheapest-batteries-ever/. Accessed 10 Sep 2018
Energy Information Administration (2018) Table 36. Transportation Sector Energy Use by Mode and Type, Annual Energy Outlook 2018. Available at https://www.eia.gov/outlooks/aeo/. Accessed 17 Jul 2018
Bloomberg New Energy Finance (2018) Electric Vehicle Outlook 2018. Available at https://about.bnef.com/electric-vehicle-outlook
Hostick D et al (2014) Projecting Electricity Demand in 2050, Pacific Northwest National Laboratory, PNNL-23491. Available at https://www.pnnl.gov/main/publications/external/technical_reports/PNNL-23491.pdf
IHS Markit (2016) Vehicles Getting Older: Average Age of Light Cars and Trucks in U.S. Rises Again in 2016 to 11.6 Years, IHS Markit Says, Press Release. Available at http://news.ihsmarkit.com/press-release/automotive/vehicles-getting-older-average-age-light-cars-and-trucks-us-rises-again-201
Brown M (2018) What will be the true impact of electric vehicles? Power Engineering International Available at https://www.powerengineeringint.com/articles/2018/02/what-will-be-the-true-impact-of-electric-vehicles.html
Kerry CF, Karsten J (2017) Gauging investment in self-driving cars. Brookings Institute Available online at https://www.brookings.edu/research/gauging-investment-in-self-driving-cars/. Accessed 10 Sep 2018
Taubman Center for State and Local Government (2018) Autonomous vehicles policy knowledge toolkit. Harvard University Available online at https://www.hks.harvard.edu/centers/taubman/programs-research/autonomous-vehicles-policy-initiative/autonomous-vehicles-policy-knowledge-toolkit. Accessed on 10 Sep 2018
Energy Information Administration (2017) Study of the potential energy consumption impacts of connected and automated vehicles. U.S. Department of Energy Available at https://www.eia.gov/analysis/studies/transportation/automated/pdf/automated_vehicles.pdf. Accessed 15 Jan 2018
Fischer C, Herrnstadt E, Morgenstern R (2009) Understanding errors in EIA projections of energy demand. Resour Energy Econ 31(3):198–209
United Nations Framework Convention on Climate Change (website) Intended Nationally Determined Contribution (INDC) of the United States. Available online at http://www4.unfccc.int/Submissions/INDC/Published%20Documents/United%20States%20of%20America/1/U.S.%20Cover%20Note%20INDC%20and%20Accompanying%20Information.pdf. Accessed 11 Sep 2018
Cleetus R, Bailie A, Clemmer S (2016) The US power sector in a net zero world analyzing pathways for deep carbon reductions. Union of Concerned Scientists Available online at https://www.ucsusa.org/sites/default/files/attach/2016/11/UCS-Deep-Decarbonization-working-paper.pdf. Accessed 11 Sep 2018
Keshavarzmohammadian A, Henze DK, Milford JB (2017) Emission impacts of electric vehicles in the US transportation sector following optimistic cost and efficiency projections. Environ Sci Technol 51(12):6665–6673
Heath G, Warner E, Steinberg D, Brandt A (2015) Estimating U.S. methane emissions from the natural gas supply chain: approaches, uncertainties, current estimates, and future studies, NREL/TP-6A50–62820. Joint Institute for Strategic Energy Analysis Available at https://www.nrel.gov/docs/fy16osti/62820.pdf. Accessed 6 Feb 2018
Alvarez RA et al (2018) Assessment of methane emissions from the U.S. oil and gas supply chain. Science (21 Jun 2018) Available at http://science.sciencemag.org/content/early/2018/06/20/science.aar7204.full. Accessed 21 Jul 2018
Shearer C, Bistline J, Inman M, Davis SJ (2015) The effect of natural gas supply on US renewable energy and CO2 emissions. Environ Res Lett 9(9):094008
Acknowledgments
Not applicable.
Funding
Not applicable.
Availability of data and materials
This research relied on a literature and desk research; all data is publicly available online, and the information is provided in the references.
Declarations
Not applicable.
Author information
Authors and Affiliations
Contributions
The author read and approved the final manuscript.
Corresponding author
Ethics declarations
Authors’ information
PS is a Senior Fellow of the National Council for Science and the Environment and an Adjunct Professor of Energy at The Johns Hopkins University. He holds a Ph.D. in physics from the University of Southern California.
Ethics approval and consent to participate
Not applicable.
Consent for publication
Not applicable.
Competing interests
The author declares that he has no competing interests.
Publisher’s Note
Springer Nature remains neutral with regard to jurisdictional claims in published maps and institutional affiliations.
Rights and permissions
Open Access This article is distributed under the terms of the Creative Commons Attribution 4.0 International License (http://creativecommons.org/licenses/by/4.0/), which permits unrestricted use, distribution, and reproduction in any medium, provided you give appropriate credit to the original author(s) and the source, provide a link to the Creative Commons license, and indicate if changes were made.
About this article

Cite this article
Saundry, P.D. Review of the United States energy system in transition. Energ Sustain Soc 9, 4 (2019). https://doi.org/10.1186/s13705-018-0178-8
Received:
Accepted:
Published:
DOI: https://doi.org/10.1186/s13705-018-0178-8