
Abstract
Background
In higher plants, the FAD2 gene encodes the microsomal oleate Δ12-desaturase, one of the key enzymes essential for the biosynthesis of the polyunsaturated lipids that serve many important functions in plant development and stress responses. FAD2 catalyzes the first step, in the biosynthesis of the polyunsaturated fatty acids (PUFAs) found in the cell membrane and cell wall, and it is thus of great importance to investigate the regulatory role of FAD2 in anther development.
Results
We reported the molecular characterization of the cotton (Gossypium hirsutum) GhFAD2 gene family and the essential role of GhFAD2–3 in cotton anther development. G. hirsutum contains four pairs of homoeologous FAD2 genes (GhFAD2–1 to GhFAD2–4). GhFAD2–3 is ubiquitously and relatively highly expressed in all analyzed tissues, particularly in anthers. Specific inhibition of GhFAD2–3 using the RNA interference approach resulted in male sterility due to impaired anther development at the stages from meiosis to maturation. The cellular phenotypic abnormality observed at the meiosis stage of the GhFAD2–3 silenced plant (fad2–3) coincides with the significant reduction of C18:2 in anthers at the same stage. Compared with that of the wild type (WT), the content of C18:1 was 41.48%, which increased by 5 fold in the fad2–3 anther at the pollen maturation stage. Moreover, the ratio of monounsaturated to polyunsaturated fatty acid was 5.43 in fad2–3 anther, which was much higher than that of the WT (only 0.39). Through compositional analysis of anthers cuticle and transcriptome data, we demonstrated it was unfavorable to the development of anther by regulating GhFAD2–3 expression level to increase the oleic acid content.
Conclusions
Our work demonstrated the importance of C18:2 and/or C18:3 in the development of the pollen exine and anther cuticle in cotton and provided clue for further investigation of the physiological significance of the fatty acid composition for plant growth and development.
Background
In higher plants, the microsomal oleate Δ12-desaturase (fatty acid desaturase 2, FAD2) is a hydrophobic endoplasmic reticulum protein, catalyzing the reaction from monounsaturated oleic acid (C18:1) to polyunsaturated linoleic acid (C18:2) by introducing a double bond between the 12th and 13th carbon atoms of C18:1 [1]. FAD2 was first identified in the model plant species Arabidopsis thaliana [2]. Although only a single copy of FAD2 was found in A. thaliana, multiple copies of FAD2 were identified in many other plants, such as canola (Brassica napus), cotton (Gossypium hirsutum), soybean (Glycine max), olive (Olea europaea), sesame (Sesamum indicum) and sunflower (Helianthus annuus) [3,4,5,6,7,8].
As the key gene controlling the conversion of C18:1 to C18:2, the FAD2 transcriptional level directly determines the relative content and proportion of polyunsaturated fatty acids (PUFAs) in plants [9]. FAD2 could be significantly induced by abiotic stresses [10, 11], suggesting that PUFAs could play a key role in plant stress responses and adaptation to environmental change. Due to the oxidative instability of PUFAs, studies on the regulation of FAD2 were mainly focused on reducing its expression level to decrease the C18:2 content in oil seeds, and thus to improve oil quality [4, 12,13,14,15,16].
In flowering plants, the anther cuticle and pollen wall are rich in lipids, mainly fatty acids and their derivatives [17,18,19,20,21]. Genetic analyses of Arabidopsis and rice have found that many genes with an important role in the development of the anther cuticle and pollen wall are involved in lipid metabolism, such as MALE STERILITY 2 (MS2), FACELESS POLLEN 1 (FLP1), CYP703, CYP704B1, CYP704B2, Acyl-CoA Synthetase 5 (ACOS5), NO EXINE FORMATION1 (NEF1), Wax-Deficient Anther1 (WDA1), β-ketoacyl-coenzyme A synthase ECERIFERUM6 (CER6), Defective Pollen Wall (DPW), Fatty acyl-coenzyme A Reductase (FAR), 3-ketoacyl-CoA Synthase 9 (KCS9), and OsC6 [18, 22,23,24,25,26,27,28,29,30,31,32,33,34].
The upland cotton genome is large and complex allotetraploid (AADD; 2n = 52) and several rounds of genome duplication events have been identified in cotton genome [35], which makes it more difficult to analyze gene expression and regulation. In this study, based on the characterization of the cotton (G. hirsutum) FAD2 family genes, we investigated their expression patterns in various vegetative and reproductive tissues and found that GhFAD2–3 is the gene highly expressed in most tissues analyzed, particularly in anthers. We demonstrated that silencing of GhFAD2–3 resulted in male sterility, due to nonviable pollen grains and abnormal anther development resulted from significantly reduced levels of PUFAs at the meiosis and tetrad stages. This is also the first report on the dynamic changes of fatty acid constituents during cotton anther development, which were exactly opposite to those in developing and mature cottonseeds. Our work showed the effect of changes in fatty acid constituents on the physiological activity of anthers and revealed the essentialness of primary PUFAs in the development of the pollen wall and anther cuticle in cotton.
Results
Genome-wide identification of GhFAD2 in cotton
The protein sequence of a previously identified GhFAD2 gene (GenBank acc. no. X97016) was used to BLASTP the annotated proteins of G. hirsutum [35], G. raimondii [36] and G. arboreum [37]. Four, five and nine putative FAD2 genes were identified in G. arboreum (Ga), G. raimondii (Gr) and G. hirsutum (Gh), respectively. Based on phylogenetic analysis, each of the four Ga putative FAD2 and each of the five Gr putative FAD2 has a corresponding copy in the At and Dt subgenomes of Gh, respectively (Additional file 1: Figure S1), suggesting that the FAD2 gene family is highly conserved during the evolutionary history of cotton. Two Gr putative FAD2 on chromosome 13 (Gorai.013G248700 and Gorai.013G248800) are next to each other and Gorai.013G248700 lacks the 3rd conserved histidine-cluster observed in all plant FAD2 proteins [7]. We thus considered Gorai.013G248700 as a non-authentic (or pseudogenized) FAD2 gene. This observation suggests that Gorai.013G248700 could be a result of gene duplication followed by pseudogenization. Interestingly, a similar situation was observed in the two Gh orthologs (Gh_D13G2237 and Gh_D13G2238) of the two Gr genes. We therefore disregarded Gh_D13G2237 as an FAD2 gene and only used the remaining eight in the following analysis. The annotated GhFAD2–4A (Gh_A01G2091) is incomplete due to a sequence gap. We completed its cDNA sequence based on our RNA-seq data. Of these eight genes, five have previously been cloned. We renamed these eight GhFAD2 genes with the aim of keeping the previous nomenclature of the five cloned genes as intact as possible (Table 1).
Expression pattern of different members of the GhFAD2 gene family
We analyzed the expression levels of each GhFAD2 gene in different tissues and at different developmental stages of seeds and fibers using RNA-seq (Fig. 1). GhFAD2–1A and GhFAD2–1D were mainly expressed in developing seeds, particularly in 20–40 days post anthesis (DPA) seeds, expressed at very low levels in anther and ovary, and barely detectable in vegetative tissues and developing fibers, suggesting that the major role of GhFAD2–1 is responsible for C18:2 biosynthesis in seeds, consistent with previous results [7, 38]. The expression of GhFAD2–2, particularly GhFAD2–2A, was mainly observed in ovaries and leaves and was very low or undetectable in other tissues. GhFAD2–3 was constitutively highly expressed in all tissues, with a relatively low expression level in 40–60 DPA seeds. The two homoeologous GhFAD2–3 sequences were equally expressed in most tissues but were significantly biased in anther, stigma and leaves, in which the expression level of GhFAD2–3D was much higher than that of GhFAD2–3A. For GhFAD2–4, there was very little expression in other tissues apart from stem. These results indicate that different GhFAD2 genes are preferentially expressed in different tissues, and in some tissues the two homoeologs of the same GhFAD2 gene are differentially expressed, pointing to a potential different function of the GhFAD2 genes in cotton development. A very high expression level of GhFAD2–3 in anthers suggests that lipid desaturation catalyzed by GhFAD2–3 may have very important roles in anther development.

The expression profiles of GhFAD2 genes in different tissues and at different developmental stages of cotton seed and fiber. Total RNA was isolated from root, leaves, stem, anther, stigma, ovary, seed and fiber. Each sample had three biological replicates. The seeds at 40 DPA and fiber at 24 DPA were used: In seeds, the expression level of GhFAD2 reached its peak at 40 DPA [12]. It has been difficult to identify changes in gene expression for fiber after 30 DPA due to hard to extract mRNA. For each sample, a total of 3 μg RNA was used in preparing the RNA-seq library. Barcoded multiplexed RNA-seq libraries were created using the NEBNext® Ultra™ RNA Library Prep Kit for Illumina® (NEB, USA) according to the manufacturer’s protocol. Clean paired-end reads were aligned to the TM-1 reference genome, and the number of reads aligned to each gene was measured using HTSeq v0.6.1.The expression levels of individual genes were quantified using FPKM. Error bars are standard errors. Genes with an adjusted P-value < 0.05 found by DESeq were assigned as differentially expressed. * indicates a differentially expression of GhFAD2–3D between anther and other tissues (Padj < 0.05)
Molecular characterization of transgenic plants
A 517-bp fragment targeting both homoeologous GhFAD2–3 sequences was used in making the hairpin construct. In total, 12 independent transgenic cotton lines were obtained by Agrobacterium-mediated transformation (Additional file 1: Figure S2). The transgenic cotton lines with the fusion fragment (1113 bp) from GhFAD2–3 and the gus linker were considered as positive transgenic events. To investigate the effect of downregulation of GhFAD2–3 on changes in the anther transcriptome, we compared transcriptomes of wild-type and fad2–3 using RNAs from anthers of the meiosis and tetrad stages, considering that the differences in cellular phenotypes between the wild-type and fad2–3 anthers began to be observed at the meiotic stage by transmission electron microscopy (see below). As expected, both homoeologous GhFAD2–3 (Gh_D11G3169 and Gh_A11G2814) were downregulated at both stages, although downregulation at the tetrad stage was more statistically significant (Additional file 1: Table S1). Among the other GhFAD2 genes, GhFAD2–1 (Gh_A13G1850 and Gh_D13G2238) was significantly downregulated at both stages in fad2–3 due to its closest sequence similarity with GhFAD2–3. However, compared to GhFAD2–3, GhFAD2–2D and GhFAD2–4A had a negligent expression level in anthers, and could thus hardly have function in anther development.
Significantly changed genes encoding key enzymes of these pathways were shown in Additional file 1: Table S1. These results revealed that many significantly changed pathways are related to the metabolism of lipids and their derivers; among them were those involved in biosynthesis of unsaturated fatty acids, alpha-linolenic acid metabolism, and the biosynthesis of cutin, suberin and wax. Apart from GhFAD2, DEGs related to biosynthesis of unsaturated fatty acids also included GhFAD3 (such as Gh_A09G0848 and Gh_A07G0946). The expression levels of genes involved in linoleic acid and alpha-linolenic acid metabolism was also statistically significant at the meiosis stage or tetrad stage in the fad2–3 anthers. In addition, fatty acyl-CoA reductase (FAR) catalyzes the reduction of fatty acyl-CoA to fatty alcohols, which are essential components of wax and cutin monomers. GhFAR2 genes (Gh_A09G1215), orthologous to Arabidopsis MS2 and rice DPW that are related to wax biosynthesis, were found to be downregulated at the tetrad stage in fad2–3. GhCYP86B1 (Gh_D04G1447, Gh_A04G0930, Gh_A03G2129 and Gh_D02G1587), a very long chain fatty acid hydroxylase specifically involved in cutin and suberin biosynthesis, was significantly upregulated in the fad2–3 anther. Furthermore, Cytochrome P450 CYP704B1, which participates in catalyzing omega-hydroxylation of long-chain fatty acids was also differentially expressed. Significant differences were also observed in the expression levels of some genes, such as those encoding peroxygenase and aldehyde dehydrogenase.
Phenotypic analysis of the RNAi plants
All fad2–3 produced lots of completely sterile flowers, although they were able to open as fully as the wild-type flowers. At anthesis, wild-type anthers dehisced to release pollen grains for pollination, whereas fad2–3 anthers did not dehisce, had a smooth and shiny epidermal surface and were plate-shaped (Fig. 2). In wild-type, anthers were clustered in fascicles, and stamens wrapped up stigma before pollen maturation. The fad2–3 had fewer anthers than wild-type, and its anthers did not wrap up stigma as did the wild-type anthers. As a result, stigma of fad2–3 stood out in the anther cluster. We also manually opened fad2–3 anthers and compared its pollen grains with those of wild-type. It was obvious that fad2–3 had fewer pollen grains. While the mature pollen grains of wild-type were spherical and became dark brown when treated with I2-KI (Fig. 2), the manually released fad2–3 pollen grains were smaller, shrunken, irregularly shaped, and were yellow brown when stained by I2-KI (Fig. 2). After acetolysis treatment, wild-type pollen grains remained intact, whereas fad2–3 pollens were severely damaged and became transparent (Fig. 2), suggesting that fad2–3 pollens were sensitive to acetolysis probably due to lack of sporopollenin in the outer pollen wall; i.e., the exine. We compared the surface structure of wild-type and fad2–3 anthers harvested from 1 day before anthesis using scanning electron microscopy (Fig. 3). Compared with the well-formed, relatively smooth wild-type anthers, fad2–3 anthers had a severely shrunken, atrophied and disfigured outer surface.

Comparison of pollen phenotype and vitality between the wild-type (WT) and the fad2–3 plants. a. Wild-type flower; b. Wild-type anthers; c. fad2–3 flower. The magnification was 5 times. d. fad2–3 anthers. The magnification was 5 times. e. Comparison of wild-type and fad2–3 mature anthers. The magnification was 5 times. f. Comparison of developing anthers from the wild-type and the fad2–3 plants; shown are de-bracted young buds collected every 4 days after bud emergence; g. Wild-type pollen grains stained by I2-KI. The magnification was 50 times. h. Wild-type pollens after acetolysis treatment. The magnification was 50 times. i. fad2–3 pollen grains stained by I2-KI. The magnification was 50 times. j. fad2–3 pollen after acetolysis treatment. The magnification was 50 times
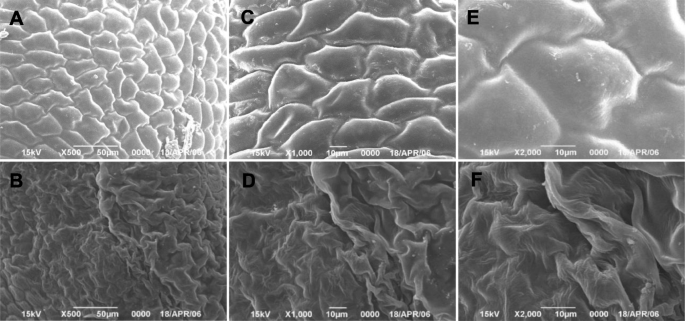
Scanning electron microscopy of the mature anthers from the wild-type and the fad2–3 plants. a, c, and e. mature wild-type anthers. The magnification was 500, 1000 and 2000 times, respectively. b, d, and f. mature fad2–3 anther. The magnification was 500, 1000 and 2000 times, respectively
To have a deeper understanding of the abnormalities of the fad2–3 anther development, we collected anthers at different developmental stages from fad2–3 and wild-type, and analyzed anther cross sections by transmission electron microscopy. Before the sporogenous cell stage, in both fad2–3 and wild-type, stamen primordia were initiated normally and large archesporial cells could be detected in developing anthers. Wild-type and fad2–3 anthers had similar cytological characteristics. At the sporogenous cell stage, wild-type and fad2–3 anthers had no obvious differences in cellular structures (Fig. 4a and b). At the microsporocyte stage, the four layers of the anther wall; i.e., epidermis, endothecium, middle layer and tapetum were well differentiated (Fig. 4c and d) in both wild-type and fad2–3. A clear defect in the fad2–3 anther was first observed at the meiosis stage. Compared with the wild-type anther, the fad2–3 anther showed cytoplasmic diffusion in microsporocytes and disintegration of the tapetum at this stage (Fig. 4e and f). At the early tetrad stage, the middle layer cells of the wild-type anther became narrow and deformed and began to show signs of degeneration (Fig. 4g). The tapetum cells were large, had thick cytoplasm rich in endoplasmic reticulum, mitochondria and plastids, and often contained double nuclei. Profuse vesicles with dense electron substances were continuously produced by the endoplasmic reticulum (Fig. 4i). Later, the endoplasmic reticulum of tapetum disappeared, resulting in accumulation of orbicules, polyvesiculate bodies and lipid bodies in the tapetum, and finally degradation of the tapetum. In contrast, the middle layer cells of the fad2–3 anther did not become thinner at the early tetrad stage (Fig. 4H). However, the tapetal cells of the fad2–3 anther showed significant abnormalities, including having many large vacuoles and defective plastids, without obvious accumulation of lipid droplets in elaioplasts and absence of dual nuclei (Fig. 4j). There were large numbers of vacuoles and dilated vesicles of endoplasmic reticulum in the tapetum cells (Fig. 4l). With the development of microspores, formation of primexine followed by bacula, tectum and nexine could be seen in the wild-type anther (Fig. 4m). Later, microspore exine and intine were fully thickened, and spinules protruding from the exine were formed (Fig. 4m and o). Further, vacuolization was observed in mononucleate-free microspores (Fig. 4q). In the fad2–3 anther, although bacula could form normally with its upper and lower ends extended laterally during the development of pollen exine, the development of microspore exine showed obvious abnormalities, including being unable to form tectum uniformly composed of small spinules (Fig. 4n and p), shrunken protoplasts showing breakage of the cell membrane, and external flow of cytoplasm. Other abnormalities were a concentration of partial cytoplasm in the center of the microspore, dissolution of nuclear membranes, and disintegration of the nucleus and cytoplasm (Fig. 4r).
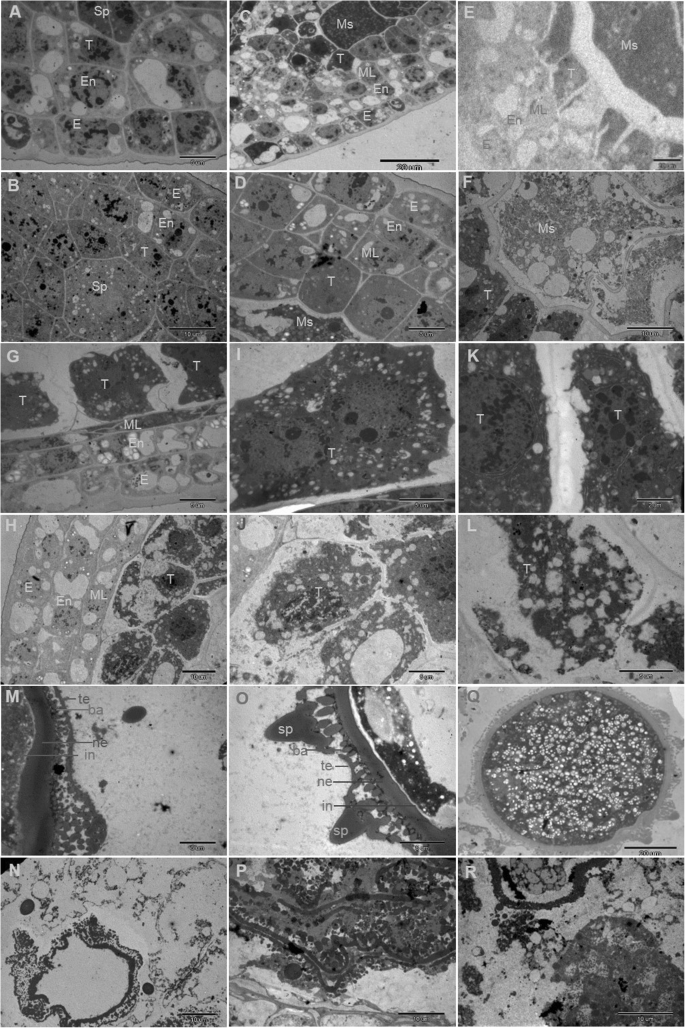
Transmission electron micrographs of anthers from the wild-type and the fad2–3 plants. A, C, E, G, I, K, M, O and Q, wild-type anthers at different developmental stages. B, D, F, H, J, L, N, P and R, fad2–3 anthers at different developmental stages. (a) Wild-type anthers with sporogenous cells and three layers of parietal cells. Bars = 5 μm. (b) fad2–3 anthers with sporogenous cells and three layers of parietal cells. Bars = 10 μm. (c) Wild-type anthers with microsporocytes and four layers of parietal cells. Bars = 20 μm. (d) fad2–3 anthers with microsporocytes and four layers of parietal cells. Bars = 5 μm. (e) Wild-type anthers at the meiosis stage. Bars = 20 μm. (f) fad2–3 anthers at the meiosis stage. Bars = 10 μm. (g) Wild-type anthers at the early tetrad stage. Bars = 5 μm. (h) fad2–3 anthers at the early tetrad stage. Bars = 10 μm. (i) High magnification of the wild-type tapetum showing double nuclei at the tetrad stage. Bars = 5 μm. (j) High magnification of the fad2–3 tapetum at the tetrad stage. Bars = 5 μm. (k) High magnification of the wild-type tapetum showing mitochondrion and endoplasmic reticulum. Bars = 2 μm. (l) High magnification of the fad2–3 tapetum showing large vacuoles, defective plastids. Bars = 2 μm. (m) Wild-type microspore at the middle developmental stage; tectum, bacula and nexine appeared. Bars = 5 μm. (n) fad2–3 microspore at the middle developmental stage; bacula and nexine appeared and showed abnormalities. Bars = 5 μm. (o) The spinules protruding from the wild-type microspore exine were formed at stages of mitosis. Bars = 5 μm. (p) fad2–3 microspore exine showing obvious abnormality. Bars = 5 μm. (q) Wild-type mature pollen grains were uniformly distributed in the small vacuole. Bars = 20 μm. (r) The degraded fad2–3 anthers exhibiting crushed cell structure. E, epidermis; En, endothecium; ML, middle layer; Sp, sporogenous cells; Ms., microsporocyte; T, tapetum; te, tectum; ne, nexine; ba, bacula; in,intine; sp., spinules
Silencing of GhFAD2–3 decreased C18:2 content in anthers
The main fatty acids in cotton anthers are saturated myristic acid (C14:0), palmitic acid (C16:0), stearic acid (C18:0) and arachidic acid (C20:0), monounsaturated oleic acid (C18:1), and polyunsaturated linoleic acid (C18:2) and α-linolenic acid (C18:3). In the wild-type anther, C16:0 was the main fatty acid and reached the maximum in the mature pollen (Fig. 5a). C18:0 accumulated mainly at the early stage of anther development and its relative content significantly decreased from 25.56% at the sporogenous cell stage to 8.14% at the meiosis stage and slightly increased again at the pollen maturation stage. The relative content of C14:0, C20:0 and C18:3 was relatively low in all stages of anthers, although C14:0 was increased up to 8.97% at the mature pollen stage. C18:1 and C18:2 had a similar dynamitic change pattern during anther development and reached their maximum at the microsporocyte and meiosis stage, respectively, suggesting that biogenesis of C18:2 largely depends on the amount of C18:1, which may be negatively correlated with that of C16:0.

The proportion of fatty acid compositions in anthers at different developmental stages. a, wild-type anthers; b, fad2–3 anthers; c, the ratio of C18:2 to C18:1. Anthers at different developmental stages was used for fatty acid assay. St1-St5: Anther at different developmental stages; St1, Sporogenous cell stage; St2, Microsporocyte stage; St3, Meiosis stage; St4, Tetrad stage; St5, Pollen maturation stage. The fatty acid methyl esters were prepared by alkaline transmethylation. The analyses were performed using GCMS-QP2020 at an electron ionization of 70 eV with an HP-88 column. The quantification was carried out according to the response value of quantitative ions and the established standard curve. Each test was repeated three times, and the content of each fatty acid composition was calculated as the percentage of total measured fatty acids. The ratio of C18:2/C18:1 is calculated by dividing the relative percentage content of C18:2 from that of C18:1 at the same developmental stage. Each bar represents the mean data of three biological replicates. Error bars are standard errors. Asterisks denote significant differences to wild-type (WT) as determined by Student’s t test: ***p < 0.001
In the fad2–3 anthers, due to the significantly reduced level of GhFAD2–3, conversion of C18:1 into C18:2 was compromised after the microsporocyte stage. Consequently, a significant reduction in C18:2 was observed at the meiosis and tetrad stages, while the relative content of C18:1 was significantly increased at these two stages (Fig. 5b). Significant reduction in C18:2 at around the meiosis stage coincides with the developmental abnormalities observed at this stage of anther development in fad2–3. A reduction (49.18%) in C18:2 was detected in the mature anthers of fad2–3 compared to that of wild-type, but C18:1 increased almost five-fold in fad2–3 compared to wild-type, suggesting that the biosynthesis steps from C16:0 to C18:1 were not greatly affected by silencing of GhFAD2–3, resulting in accumulation of C18:1.
The ratio of C18:2/C18:1 was analyzed during anther development. The results showed that there was no significant difference between fad2–3 and WT during early anther development (Fig. 5c). At the meiosis stage, the ratio of C18:2/C18:1 was 1.49 in WT anthers. However, the corresponding ratio was only 0.48 in fad2–3 anthers. Compared with the WT anther, there was a more significant decrease in the ratio of C18:2/C18:1 in the fad2–3 anther at the pollen maturation stage (Fig. 5c).
Cuticular wax constituents and cutin monomer of cotton anthers
To eliminate possible effects caused by the changed fad2–3 anther morphology, the experiments were performed using anthers harvested from 1 day before anthesis. The cuticular waxes and cutin of mature anthers was extracted and their components were analyzed accordingly by GC-MS (Fig. 6a).
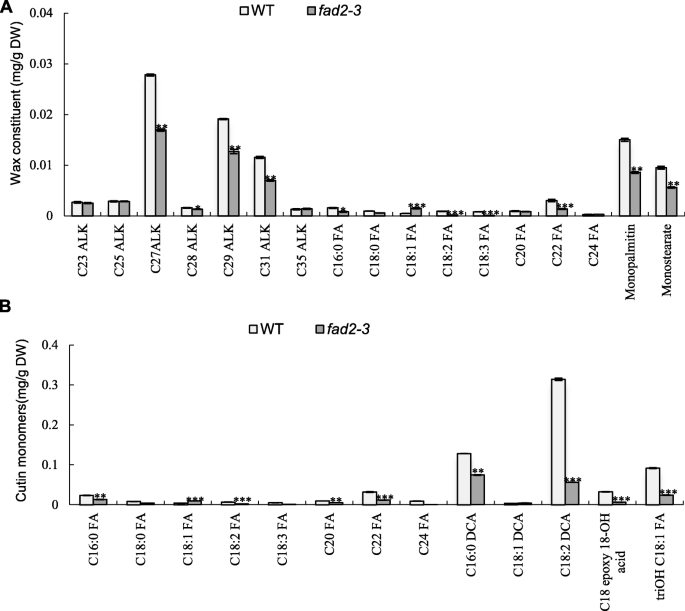
Analysis of anther wax and cutin in the wild type and fad2–3. (a) Wax constituents in the wild-type and fad2–3. (b) Cutin monomers in the wild-type and fad2–3. C23 ALK, tricosane; C25 ALK, pentacosane; C27 ALK, heptacosane; C28 ALK, octacosane; C29 ALK, nonacosane; C31 ALK, hentriacontane; C35 ALK, pentatriacontane. C16:0 FA, hexadecanoic acid; C18:0 FA, octadecanoic acid; C18:1 FA, 9-octadecenoic acid; C18:2 FA, 9,12-octadecadienoic acid; C18:3 FA, 9,12,15-octadecatrienoic acid; C20 FA, eicosanoic acid; C22 FA, docosanoic acid; C24 FA, tetracosanoic. C16:0 DCA, hexadecane-1,16-dioic acid; C18:1 DCA, α, ω-octadecenoic acid; C18:2 DCA, α, ω-octadecadiendioic acid; triOH C18:1 FA, 9,10,18-trihydroxy octadecenoic acid; 9,10 Epoxy 18-OH acid, 9,10-epoxy-18-OH-C18:1; DW, dry weight. The wax of anther at mature pollen stage was analyzed according to Jung et al. [26]. The wax monomer was derivatized with 1 ml BFTSA in 1 ml pyridine (1:1) for 40 min at 70 °C before GC-MS analysis. The constituent analyses were performed using GCMS-QP2020 with a DB-1 column. Each compound was quantified against the internal standard by automatic integrating the peak areas. The protocol for lipid polyester analysis was performed according to Li-Beisson et al. [50]. The cutin monomer fraction was derivatized with BFTSA/pyridine (1:1) for 60 min at 70 °C. The constituent were analyzed using GCMS-QP2020 with a DB-1 column. The GC-MS was conducted according to Li-Beisson et al. [50] with helium carrier gas at 2 ml/min. Each compound was quantified on the basis of their total ion current as described by Li-Beisson et al. [50]. Error bars are standard errors. Values represent the means ± SE, n = 3. Asterisks denote significant differences to wild-type (WT) as determined by Student’s t test: ***p < 0.001; **p < 0.01; *p < 0.05
Interestingly, in wild-type anthers, wax constituents contain wax esters at high content (over 50%), prominently monopalmitin and monostearate, which are products of the acyl reduction pathway. This is different from waxy components in anthers of rice and maize [31, 39], perhaps because cotton is a woody perennial plant, and it seems to be similar to that in wax constituents of Jojoba [40]. The content of alkanes was approximately 40%, mainly with chain lengths ranging from 23 to 35 carbons. Compared with the wild-type, there was no significant difference in the major components of wax in fad2–3. Although the content of fatty acid components was relatively low in wax constituents, fad2–3 had significantly lower levels of C18:2 and C18:3, but a relatively higher level of C18:1. The decrease in C16:0 and C18:0 was also observed in the anther wax of fad2–3. These results indicated that C18:2 and C18:3 were also important components of plant epidermis and downregulation of GhFAD2–3 affected the relative content of components in the cuticular layer.
Cutin monomers in the cuticular layer were methylated by methanolic HCl and reanalyzed by GC-MS. The major monomer was α, ω-octadecadiendioic acid (C18:2 DCA), which is a usual constituent of cutin. 9,10,18-trihydroxy octadecenoic acid (9,10,18-triOH C18:1 FA), hexadecane-1,16-dioic acid (C16:2 DCA) and 9,10-epoxy-18-OH-C18:1 (9,10 Epoxy 18-OH Acid) at relatively high levels had also been detected by GC-MS in wild-type anthers (Fig. 6b). Cutin monomers also include fatty acid components such as C18:2 and C18:3. The strongest effects of the fad2–3 anther on cutin monomers were apparent in the unsaturated C18:2 DCA and 9,10,18-triOH C18:1FA. Especially, the C18:2 DCA content decreased by 82.16% in fad2–3. Our results were also consistent with previous reports that the Arabidopsis fad2 mutant showed a decrease in double unsaturated C18 α, ω-diacids in leaf polyester [41]. Nevertheless, C18:2 and C18:3 are important substrates for biosynthesis of many other lipids that are essential structural components of anthers and the pollen wall.
Discussion
Functional specificity and redundancy of GhFAD2 genes
Each individual GhFAD2 gene is expected to function as a desaturase to convert C18:1 into C18:2 in different cotton organs and/or tissues, a process that is presumably determined by the expression specificity and level of each GhFAD2. Among the four pairs of GhFAD2 genes, GhFAD2–2 and GhFAD2–4 were expressed at very low levels in the tissues analyzed in this study, suggesting a limited role or a specific role in the tissues not analyzed in this study of these genes in cotton development. GhFAD2–1 seems to be specifically expressed in developing seeds, with the highest expression level detected in the 40 DPA seeds (Fig. 1), consistent with its role in the accumulation of C18:2 in seeds [7]. In cotton seeds, the relative content of C18:2 could reach over 50% of the total fatty acid content [12]. In contrast, GhFAD2–3 seems to be ubiquitously expressed in all tissues analyzed, but its expression level was remarkably lower than that of GhFAD2–1 in the 40 DPA seeds although its expression levels in the 5 DPA and 20 DPA seeds were significantly higher than or similar to that of GhFAD2–1, respectively (Fig. 1). The highest expression level of GhFAD2–3, particularly GhFAD2–3D, was observed in anthers, whereas the other three pairs of GhFAD2 genes were not or expressed at very low levels in anther. This expression pattern suggests that GhFAD2–3 is the major, if not the sole, gene responsible for the synthesis of C18:2 in anthers and is important for anther development. The male sterile phenotype observed in fad2–3 supported this conclusion. GhFAD2–3, particularly GhFAD2–3D, was also relatively highly expressed in stigma and leaves, but we did not observe obvious phenotypic changes in these two organs in fad2–3, probably due to the presence of a functional GhFAD2–2 that was not a target of the 517-bp fragment used in generation of fad2–3. This observation suggests that different GhFAD2 genes may be functionally redundant.
One interesting observation was the significantly biased expression levels of the two homoeologous GhFAD2–3 in anthers, stigma and leaves (Fig. 1). The significantly higher expression level of GhFAD2–3D would suggest it is the major functional gene. This speculation could not be tested by using fad2–3 generated in this study because both gene homeologs are targets of the RNAi construct but can be tested by gene homolog-specific knock-out using the gene editing approach.
A role for GhFAD2–3 in anther and pollen development
Fatty acid metabolism is an essential physiological process throughout the plant life cycle. In higher plants, acetyl-CoA carboxylase carboxylates acetyl-CoA to form malonyl-CoA, which is further converted by fatty-acid synthase (FAS) to long-chain fatty acids via the six recurring reactions, until the C16:0 is produced. When the 16:0 carbon fatty acids (FAs) are formed, it then undergoes some modifications leading to desaturation and/or elongation. The elongation begins with stearate (C18:0) and is mainly performed by several membrane-bound enzymes in the endoplasmic reticulum (ER). C18:0 was also further dehydrogenated by Δ9-stearyl-ACP desaturase (SAD) to form monounsaturated C18:1. After that, most PUFAs are synthesized by desaturases located in the ER, namely, FAD2 (C18:1 to C18:2 desaturation) and FAD3 (C18:2 to C18:3 desaturation). Most cuticular wax and cutin are derived from fatty acid precursors and play important roles in developmental events and physiological functions. Our results also showed that the major wax constituents in the cotton anthers were wax esters and alkanes. Importantly, it had been reported that fatty acid desaturases, including FAD2, are responsible for the biosynthesis of 30–35% of the cutin monomers from unsaturated C18 aliphatics [42]. Similar to the observation of a decrease in the double unsaturated C18 diacids in leaf polyester of the Arabidopsis fad2 mutant [41], we showed that the contents of polyunsaturated C18 dioic acid were significantly reduced in the anther cutin of fad2–3, suggesting that maintaining a certain level of polyunsaturated C18 is important for proper development of the cuticular structure of cotton anthers.
In our study, silencing GhFAD2–3 induced transcriptional changes during anther development (Additional file 1: Table. S1). Our qRT-PCR results were in accordance with transcriptional analysis (Fig. 7), as silencing of GhFAD2–3 in anthers resulted in changing expression levels of many genes, such as GhCYP86B1, GhCYP704B1 and GhCYP94C1. With our study, the probable scheme of FAD2 involved in the primary pathways for cutin monomers synthesis in Gossypium was proposed (Fig. 8). In this pathway, the ω-hydroxylation reaction is typically catalyzed by cytochrome P450 monooxygenases, particularly of the GhCYP86B1 and GhCYP704B1. The ω-hydroxy FAs could be further oxidized by ω-hydroxyacid dehydrogenase (HTH) to ω-oxo FAs. GhALDH encodes an aldehyde dehydrogenase that further catalyzes ω-oxo FAs to produce α, ω-dicarboxylic FAs. On the other hand, peroxygenase (PXG) catalyzes the hydroperoxide-dependent epoxidation of unsaturated fatty acids, and then GhCYP94C1 with high omega-hydroxylase activity to 9, 10-epoxyoleic acid metabolized C18 unsaturated FAs to produce polyhydroxy-octadecenoic acid. Mutation in any gene encoding the enzymes involved in the pathway could cause a lack of synthesis of cutin/wax and sporopollenin precursors, resulting in failure to form normal pollen exine and anther cuticle that had also been reported [18, 23, 33].
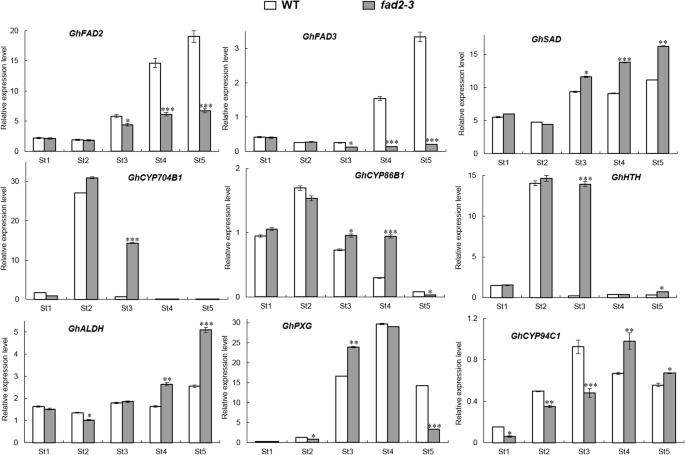
qRT-PCR analysis of some candidate genes involved in the biosynthetic pathways for cutin monomers in in wild-type and fad2–3. St1-St5: Anther at different developmental stages; St1, Sporogenous cell stage; St2, Microsporocyte stage; St3, Meiosis stage; St4, Tetrad stage; St5, Pollen maturation stage. The GhFAD2–1, GhFAD3, GhSAD, GhCYP704B1, GhCYP86B1, GhHTH, GhALDH, GhPXG, and GhCYP94C1 mRNA abundance was determined by qRT-PCR, respectively. These genes encodes enzymes indicated as follows: Fatty acid desaturase 2, Fatty acid desaturase 3, Δ9-stearyl-ACP desaturase, Cytochrome P450 704B1, Cytochrome P450 86B1, ω-hydroxyacid dehydrogenase, aldehyde dehydrogenase, peroxygenase and Cytochrome P450 94C1. GhUBQ14 was used as a reference gene. All qRT–PCR reactions were performed in triplicate. Relative gene expression levels of target genes were normalized against Ct values for GhUBQ14, and the fold change (2–ΔΔCt) was determined by comparison to average expression levels. Significant differences from control were marked with * (P < 0.05), ** (P < 0.01) and *** (P < 0.001)

Model of FAD2 involved in the primary pathways for cutin monomers synthesis in Gossypium. Gossypium candidate genes are given in parenthesis. Arrow thickness indicates the extend of carbon flux. Enzymes presumably involved are indicated as follows: FAS, fatty acid synthase; FAD2, fatty acid desaturase 2; FAD3, fatty acid desaturase 3; SAD, stearoyl-ACP desaturase; P450, Cytochrome P450 monooxygenase; HTH, ω-hydroxyacid dehydrogenase; OADH, ω-oxo-acid dehydrogenase (aldehyde dehydrogenase); PXG, peroxygenase; FAEH, fatty acid epoxide hydrolase
In our model, GhFAD2 could play an important role in the biosynthesis of the cutin and suberin monomers. The fad2–3 is deficient in its ability to catalyze C18:1 to C18:2, which finally results in anther polyesters with less α, ω-octadecadiendioic acid (C18:2) and polyhydroxy-octadecenoic acid (9,10,18-triOH C18:1 FA). Our qRT-PCR results showed that the expression of GhFAD2 was relatively low at the sporogenous cell stage and microsporocyte stage, significantly increased at the tetrad stage, and peaked at the pollen maturation stage in the control plants (Fig. 7). In fad2–3, GhFAD2 had a very similar dynamic expression change at different anther developmental stages; however, its expression level was significantly lower than that of the wild-type at the time points investigated, particularly from the tetrad stage to the pollen maturation stage (Fig. 7). GhFAD3 also had a similar expression change in the wild-type and fad2–3 during anther development. Correspondingly, from the sporogenous cell stage to the microsporocyte stage, there was no difference in the relative content of C18:2 and C18:3 between the wild-type and fad2–3 anthers, but from the microsporocyte stage until the mature pollen stage, the relative content of C18:2 and C18:3 was significantly lower in fad2–3 than in wild-type (Fig. 5).
Overall, in fad2–3, the expression of GhFAD2 and GhFAD3 genes was significantly inhibited; however, the expression levels of the above determined related genes in the pathway, such as GhSAD, GhCYP86B1, GhCYP94C1, GhHTH and GhALDH, were apparently upregulated, especially at the meiosis stage and/or tetrad stage. Thus, it is interesting that the upregulation of the expression of these genes in fad2–3 was accompanied by the increase in C18:1 content relative to the control anther. Similar phenomena have also been previously observed with transgene expression of FAD2, which produces unusual FAs, including epoxidation, hydroxylation and double bonding conjugation [40, 41]. One hypothesis explaining this phenotype is that unusual FA products inhibit the activity of FAD2, thereby effectively preventing the conversion of C18:1 to C18:2 [43,44,45,46]. In cottonseed, the relative content of C18:2 peaked in the mature seeds, accounting for over 50% of the total fatty acid content of seed [12]. However, the accumulated unusual FA products, such as epoxy fatty acid, hydroxyl acid, and dioic acid, may act as inhibitors of GhFAD2 expression in anthers. Thus, this regulatory mechanism may account for part of why the relative proportion of C18:2 is not very high in anthers. In fad2–3, the expression of GhSAD was significantly upregulated at the meiosis stage and the tetrad stage, which would further lead to a much higher proportion of C18:1 content. Under this metabolic scenario, GhFAD2 would be further inhibited by the increased expression of related genes in the pathway, such as GhCYP86B1, GhALDH and GhCYP94C1, resulting in relatively low C18:2 content at the meiosis stage and the tetrad stage in fad2–3. In contrast, the expression of related genes in the pathway to synthesize waxy and cutin monomers could be induced by a low level of C18:2 content. This may be a self-protective mechanism of plant cells. Compared to wild type, GhHTH and GhCYP704B1 shows significantly higher expression level at the meiosis stage. However, this does not mean that it could result in an increase in the content of hydroxy and epoxy fatty acids. At the tetrad stage, the expression of GhHTH and GhCYP704B1 was very low in both wild type and fad2–3, and there was no significant difference between them. The anthers of fad2–3 were smaller than those of wild-type, and the fad2–3 pollen grains appeared to lack the exine layer. These results suggest that the lack of C18:2 and C18:3 have adverse effects on the establishment of functional anther cuticles and pollen exine in fad2–3, probably a result of insufficient biosynthesis and/or deposits of sporopollenin in these protective walls, as suggested by the observation that the fad2–3 pollen grains were unresistant to acetolysis treatment. The high C18:1 content in cottonseeds by specific inhibition of the expression of GhFAD2–1 had disadvantageous effects on seed vigor [12]. As in cottonseed, it seemed to suggest that the too high accumulation of C18:1 was also unfavorable to the development of anthers.
In plants, the synthesis of various fatty acid components has a complex interrelationship, and the synthesis of other fatty acids will be affected when the synthesis of a particular fatty acid component is regulated. In general, with the increase in C18:1 content, the content of C16:1 decreased in this study. The decrease in C16:0 was also observed in the anther wax of fad2–3. Accordingly, the content of C16:0 DCA was reduced in the anther cutin of fad2–3. The relative proportion of fatty acid components accumulated in plant tissues is very important for ensuring that they could preserve the basic physiological activities. Changing the relative content and proportion of one or some fatty acid components in plant tissues may adversely affect vegetative or reproductive growth of plants. It had been reported that the Arabidopsis fad2 mutants showed dwarf phenotypes and the levels of PUFAs in phospholipids were relatively low. The limited membrane fluidity of the fad2 mutant resulted in its inability to survive at a low temperature [47]. We had also previously found that the decreased C18:2 content in cottonseeds by specific inhibition of the expression of GhFAD2–1 had disadvantageous effects on seed vigor [12]. C18:2 and C18:3 could serve as the essential structural components of anthers and pollen walls and/or as the substrates for biosynthesis of signaling molecules and/or hormones, such as Jasmonic acid (JA), essential for anther and pollen development. Jasmonic acid is a carbocyclic fatty acid and plays an essential role in pollen and anther development. Several Arabidopsis male sterile mutants have been shown to be caused by mutation in genes involved in JA biosynthesis and/or signaling pathways, such as coi1 [48] and opr3/dde1 [49, 50]. It has been reported that the crucial requirement for C18:3 in A. thaliana pollen development and anther dehiscence seems to be as a substrate for JA biosynthesis through the octadecanoid pathway [51]; however, the threshold requirement for C18:3 is very low, and anthers with only 1–2% of C18:3 could remain fertile. The wild-type cotton anthers contain a relatively low level of C18:3 compared to C18:1 and C18:2 but could have a level higher than the low threshold reported in Arabidopsis. The C18:3 content was significantly reduced in the fad2–3 anthers and became as low as 0.3% (~ 10-fold reduction) at the mature pollen stage (Fig. 5). Taken together, C18:2 and C18:3 are essential structural components of anthers and are also important substrates for biosynthesis of many other lipids in anther development.
Conclusion
In this study, we show functional specificity and redundancy of GhFAD2 genes that would be helpful to understand gene expression and regulation in allopolyploid crops. We report for the first time on the dynamic changes in fatty acid constituents during anther development and showed that silencing of GhFAD2–3 reduced PUFAs (mainly C18:2 and C18:3) in anthers, severely hampered pollen development and significantly reduced the number and viability of pollen grains. Our results demonstrated that the relative proportions of fatty acid components accumulated in plant tissues is very important to ensure that they could preserve the basic physiological activities. In the future, a comprehensive and in-depth study of unsaturated fatty acids and their derivatives in plant cells would help us to better control plant growth and development on the basis of understanding the physiological significance of the formation of plant fatty acid components.
Methods
Characterization of the GhFAD2 gene family
The genome sequences and annotation files of G. hirsutum (AD1_NBI), G. raimondii (D5_JGI) and G. arboreum (A2_BGI) were downloaded from CottonGen (https://www.cottongen.org). To identify the members of the GhFAD2 family genes, the amino acid sequence of the previously reported GhFAD2 (GenBank accession no. X97016) was used to search for its homologs in the annotated proteins of the three genomes using BLASTP (E-value ≤10− 50). The hits with all three conserved histidine-clusters observed in all reported plant FAD2 sequences were considered as GhFAD2. The relationship of the identified GhFAD2 genes was investigated by sequence alignment and phylogenetic analysis.
Transcriptome analyses
We did two transcriptome analyses. One aimed to investigate the expression profiles of individual GhFAD2 in various tissues and the other compared the difference in anther transcriptomes between the GhFAD2–3 silenced transgenics and wild-type. For the first experiment, total RNA was isolated from root, leaf, stem, anther, stigma, ovary, developing and mature seed (at 5, 20, 40 and 60 days post anthesis) and fiber (at 12 and 24 days post anthesis). Each sample had three biological replicates. For each sample, a total of 3 μg RNA was used in preparing the RNA-seq library. Barcoded multiplexed RNA-seq libraries were created using the NEBNext® Ultra™ RNA Library Prep Kit for Illumina® (NEB, USA) according to the manufacturer’s protocol. Clean paired-end reads were aligned to the TM-1 reference genome [35], and the number of reads aligned to each gene was measured using HTSeq v0.6.1. The expression levels of individual genes were quantified using FPKM (fragments per kilobase of transcript per million mapped reads).
For the anther transcriptome experiment, total RNA was isolated from anthers of wild-type (control) and transgenic plants with silenced GhFAD2–3 (fad2–3). Anthers from two developmental stages, meiotic and tetrad, were investigated. Three samples were collected from each stage for both wild-type and fad2–3. A total amount of 3 μg RNA from each sample was used in generating index-coded RNA-seq libraries using the Illumina TruSeq RNA Library Prep Kit. The clustering of the index-coded libraries was performed using the TruSeq PE Cluster Kit v3-cBot-HS (Illumina) on a cBot Cluster Generation System following the manufacturer’s manual. The libraries were then sequenced using the Illumina HiSeq 2500 platform. Read mapping and FPKM calculations were performed as described previously. The model based on negative binomial distribution was used to determine differentially expressed genes (DEG) with an adjusted p-value < 0.05 [52]. The KOBAS software was used to test statistically the enrichment of DEGs in KEGG pathways.
Plant material and generation of RNAi plants
The cotton variety ‘Xinluzao 33’ provided by the Cotton Research Institute of Shihezi University was used in this study. A 517-bp fragment (Additional file 1: Figure S1) was amplified by PCR using PrimeSTAR™ HS DNA polymerase. The primers used were 5′-CACCCGCTCACTTATCCGTTCA-3′ (CACC was added at the 5′ end for directional cloning of the amplified fragment into the RNAi construct) and 5′-CGTTGTAGATAGGACCGTAT-3′. The PCR cycles were performed as follows: 95 °C for 5 min, followed by 29 cycles at 94 °C for 45 s, 55 °C for 45 s, 72 °C for 45 s, and a final extension at 72 °C for 10 min. The amplified DNA fragment was subcloned into pENTR/D-TOPO (Invitrogen) to generate the entry vector pENTR/D-GhFAD2 that was confirmed by sequencing. The LR recombination reaction between pENTR/D-GhFAD2 and the gateway vector pANDA35HK was then used to create pANDA35HK-dsGhFAD2 using the Gateway™ LR Clonase™ plus enzyme mix (Invitrogen). The native promoter of GhFAD2–3D isolated from cotton genomic DNA (Additional file 1: Figure S2a) was cloned into the Hin dIII-Bam HI site of pBI121 to generate pBIAP. Finally, the fragment with the 517-bp fragment inserted forwardly and reversely at two sides of the intron was excised from pANDA35HK-dsGhFAD2 and used to replace the GUS gene in pBIAP to create pBIAP-dsGhFAD2 (Additional file 1: Figure S2b), which was then electroporated into the Agrobacterium tumefaciens strain LBA4404. Cotton transformation was carried out using hypocotyl explants from G. hirsutum cultivar Xinluzao 33 as described by Jin et al. [53].
A fragment (1,113 bp) containing part of the 517-bp GhFAD2–3 segment and part of the gus linker was amplified by PCR to identify positive transgenic plants. Genomic DNA was isolated from cotton leaf tissues and used in PCR amplification using the primers, 5′-CTGTACAGCGAAGAGGCAGTC-3′ and 5′-CGTTGTAGATAGGACCGTAT-3′. The pair of primers 5′-GAGTCTGGTAATTGGAATGAG-3′ and 5′-TTCGCAGTTGTTCGTCTT-3′ was used to amplify the 18S rDNA gene as a control. Cultivar ‘Xinluzao 33’ and transgenic cotton plants were grown in soil in a growth room with a 16 L:8D photoperiod and 50% relative humidity.
Phenotypic analysis and pollen staining
Plants or flowers were photographed with a digital camera (Canon, Japan) or a SteREO Discovery microscope (Carl Zeiss). In all experiments, phenotypes of the RNAi plants (fad2–3) were analyzed together with wild-type. For testing pollen viability, pollen grains were stained with 1% I2-KI solution and photographed using a SteREO Discovery microscope (Carl Zeiss). For the control plants, sufficient mature pollens were obtained by placing 3–4 open flowers in a microfuge tube. For the fad2–3 plants, mature anthers were dissected from flowers and gently squashed in staining solution using dissecting needles. Acetolysis treatment was carried out according to Aarts et al. [19], and pollen grains were treated with a mixture of sulfuric acid and acetic anhydride at 100 °C. The pollen pellet was then transferred to a microscope slide and viewed with a SteREO Discovery microscope.
Scanning and transmission electron microscopy
For scanning electron microscopy, anthers at different developmental stages were fixed overnight in 2.5% glutaraldehyde, and then washed and postfixed in 1% osmium tetraoxide in 0.1 M sodium phosphate buffer (PBS, pH 7.2). Samples were then dehydrated in a graded ethanol concentration (30, 50, 70, 95 and 100%) and dried with liquid CO2. Before examination with the scanning electron microscope, dried anthers were sputtered with gold palladium for 300 s at 25 mA. Samples were finally visualized using a Hitachi S4500 microscope.
Transmission electron microscopy was performed using a Hitachi H7600 transmission electron microscope. Anthers were fixed in 2.5% glutaraldehyde (stored overnight at 4 °C), washed three times (5 min for each) with 0.1 M PBS, postfixed in 1% OsO4 for 2 h, and washed with PBS (three times, 5 min for each). Samples were then dehydrated as described above, treated with propylene oxide, and embedded in Spurr’s resin. Thin sections (70 nm) were taken using the Leica UC6 cryo ultramicrotome. Sliced sections were placed on 100-mesh copper grids and sequentially stained with uranyl acetate (30 min) and lead citrate (Sato’s Lead; 15 min).
Anther collection and fatty acid analysis
To analyze the composition of fatty acids in developing anthers, different sizes of flower buds (without bracts) with a diameter < 9 mm were collected from wild-type (fertile) and fad2–3 (sterile) and used in isolation of anthers with pollen grains at the following five developmental stages: sporogenous cells, microsporocyte, meiosis, tetrad and pollen maturation. Identification of these developmental stages was done using optical microscopy.
The whole anther (including both anther wall and pollen grains) of the five stages mentioned above was used in fatty acid analysis. The fatty acid methyl esters were prepared by alkaline transmethylation. Briefly, 0.5 g freeze-dried anthers were transferred into glass tubes, and used in oil extraction by using a Soxtherm apparatus (Gerhadt). Then, 5 ml 0.4 M KOH-methanol and 5 ml hexane were added and mixed. The solution was transferred into vials and shaken for 30 min at 40 °C. After adding ~ 1 g of anhydrous sodium sulfate to remove water, the upper hexane layer was used in GC-MS analysis. The quantitative standard curve was established by mixing 37 fatty acid methyl esters (Sigma) determined by GC-MS, and the external standard method was used for quantitative determination. The analyses were performed using GCMS-QP2020 at an electron ionization of 70 eV with an HP-88 capillary column (100 m × 0.2 mm) and film thickness of 0.2 μm. The column program used was: the injection temperature 250 °C, oven temperature kept at 40 °C for 2 min, then increased to 240 °C at a rate of 4 °C/min, and kept constant at 240 °C for 15 min. Operating conditions: helium carrier gas 2 mL/min, split ratio 10:1.
Analysis of anther cuticular waxes and cutin-like polyester
The wax of anther at mature pollen stage was analyzed using a published protocol [29] with some modifications. Briefly, 100 mg of freeze-dried anthers was submersed in 10 ml of chloroform containing 100 μg of tetracosane (Fluka; serving as an internal standard) for 1 min. The solution was transferred to a new vial, and then the solvent was evaporated under a nitrogen gas stream. The remaining compounds were incubated with 200 μl bis-N,N-(trimethylsilyl)-trifluoroacetamide (Sigma-Aldrich) in 200 μl pyridine for 60 min at 70 °C before GC-MS analysis. The constituent analyses were performed using GCMS-QP2020 with a DB-1 column of 30 m × 0.32 mm and film thickness of 0.1 μm. GC-MS analyses were performed as described by Jung et al. [29]. Each compound was quantified against the internal standard by automatic integration of the peak areas.
The protocol for lipid polyester analysis was performed according to Li-Beisson et al. [54]. First, 100 mg of freeze-dried anthers was delipidated. After that, depolymerization was performed by acid catalysis as described by Li-Beisson et al. [50]. The resulting cutin monomer fraction was derivatized with BFTSA/pyridine (1:1) for 60 min at 70 °C, and then samples were analyzed using GCMS-QP2020 with a DB-1 column of 30 m × 0.32 mm and film thickness of 0.1 μm. The GC-MS was conducted according to Li-Beisson et al. [50] with helium carrier gas at 2 ml/min. Each compound was quantified on the basis of their total ion current as described by Li-Beisson et al. [54].
Quantitative real-time PCR (qRT-PCR) analysis
Total RNA was extracted from anthers at different developmental stages using RNAiso Plus (Takara), and then the RNA was reverse transcribed to obtain first-strand cDNA using a PrimeScript™ 1st Strand cDNA Synthesis Kit (Takara, China). The transcript levels of genes were analyzed by qRT-PCR using the LightCycler® 480 II (Roche, Germany). Each reaction was performed in 10 μl volumes using SYBR Green Master Mix (Takara, China) under the following PCR conditions: 94 °C for 3 min followed by 40 cycles of 94 °C for 15 s, 56 °C for 15 s, and 72 °C for 15 s. All gene specific primers for qRT-PCR were designed using the Primer 6.0 program (Additional file 1: Table S2). The cotton poly-ubiquitin gene (GhUBQ14, accession number in GenBank: DW505546) was used as an internal control. The primers for GhUBQ14 were 5′-CAACGCTCCATCTTGTCCTT-3′ and 5′-TGATCGT CTTTCCCGTAAGC-3′. All qRT–PCR reactions were performed in triplicate. The relative expression levels of target genes were calculated with the 2–ΔΔCt method [55].
Abbreviations
- C14:0:
-
Myristic acid
- C16:0 DCA:
-
Hexadecane-1,16-dioic acid
- C16:0:
-
Palmitic acid
- C18:0:
-
Stearic acid
- C18:1 DCA:
-
α, ω-octadecenoic acid
- C18:1:
-
9-octadecenoic acid
- C18:2 DCA:
-
α, ω-octadecadiendioic acid
- C18:2:
-
9,12-octadecadienoic acid
- C18:3:
-
9,12,15-octadecatrienoic acid
- C20:0:
-
Arachidic acid
- DPA:
-
Days post anthesis
- DW:
-
Dry weight
- ER:
-
Endoplasmic reticulum
- FAD2:
-
Fatty acid desaturase 2
- FAD3:
-
Fatty acid desaturase 3
- FAEH:
-
Fatty acid epoxide hydrolase
- FAR:
-
Fatty acyl-coenzyme A Reductase
- FAS:
-
Fatty acid synthase
- FAs:
-
Fatty acids
- HTH:
-
ω-hydroxyacid dehydrogenase
- NPT II:
-
Neomycin phosphotransferase II gene
- OADH:
-
ω-oxo-acid dehydrogenase
- P450:
-
Cytochrome P450 monooxygenase
- PUFAs:
-
Polyunsaturated fatty acids
- PXG:
-
Peroxygenase
- SAD:
-
Stearoyl-ACP desaturase
- triOH C18:1 FA:
-
9,10,18-trihydroxy octadecenoic acid
References
Shanklin J, Cahoon EB. Desaturation and related modifications of fatty acids. Annu Rev Plant Physiol Plant Mol Biol. 1998; https://doi.org/10.1146/annurev.arplant.49.1.611.
Okuley J, Lightner J, Feldmann K, Yadav N, Lark E, Browse J. Arabidopsis FAD2 gene encodes the enzyme that is essential for polyunsaturated lipid synthesis. Plant Cell. 1994; https://doi.org/10.1105/tpc.6.1.147.
Jin UH, Lee JW, Chung YS, Lee JH, Yi YB, Kim YK, Hyung NI, Pyee JH, Chung CH. Characterization and temporal expression of a ω-6 fatty acid desaturase cDNAfrom sesame (Sesamum indicum L.) seeds. Plant Sci. 2001; https://doi.org/10.1016/S0168-9452(01)00489-7.
Jung JH, Kim H, Go YS, Lee SB, Hur CG, Kim HU, Suh MC. Identification of functional BrFAD2-1 gene encoding microsomal delta-12 fatty acid desaturase from Brassica rapa and development of Brassica napus containing high oleic acid contents. Plant Cell Rep. 2011; https://doi.org/10.1007/s00299-011-1095-x.
Li LY, Wang XL, Gai JY, Yu DY. Molecular cloning and characterization of a novel microsomal oleate desaturase gene from soybean. J Plant Physiol. 2007; https://doi.org/10.1016/j.jplph.2006.08.007.
Martínez-Rivas JM, Sperling P, Luhs W, Heinz E. Spatial and temporal regulation of three different microsomal oleate desaturase genes (FAD2) from normal-type and high-oleic varieties of sunflower (Helianthus annuus L.). Mol Breed. 2001; https://doi.org/10.1023/A:1013324329322.
Liu Q, Singh SP, Brubaker CL, Sharp PJ, Green AG, Marshall D. Molecular cloning and expression of a cDNA encoding a microsomal ω-6 fatty acid desaturase from cotton (Gossypium hirsutum). Aust J Plant Physiol. 1999; https://doi.org/10.1071/PP98118.
Pirtle IL, Kongcharoensuntorn W, Nampaisansuk M, Knesek JE, Chapman KD, Pirtle RM. Molecular cloning and functional expression of the gene for a cotton Δ12 fatty acid desaturase (FAD2). Biochim Biophys Acta. 2001; https://doi.org/10.1016/S0167-4781(01)00312-8.
Dar AA, Choudhury AR, Kancharla PK, Arumugam N. The FAD2 gene in plants: occurrence, regulation, and role. Front Plant Sci. 2017; https://doi.org/10.3389/fpls.2017.01789.
Matteucci M, D’Angeli S, Errico S, Lamanna R, Perrotta G, Altamura MM. Cold affects the transcription of fatty acid desaturases and oil quality in the fruit of Olea europaea L. genotypes with different cold hardiness. J Exp Bot. 2011; https://doi.org/10.1093/jxb/err013.
Kargiotidou A, Deli D, Galanopoulou D, Tsaftaris A, Farmaki T. Low temperature and light regulate delta 12 fatty acid desaturases (FAD2) at a transcriptional level in cotton (Gossypium hirsutum). J Exp Bot. 2008; https://doi.org/10.1093/jxb/ern065.
Liu F, Zhao YP, Zhu HG, Zhu QH, Sun J. Simultaneous silencing of GhFAD2-1 and GhFATB enhances the quality of cottonseed oil with high oleic acid. J Plant Physiol. 2017; https://doi.org/10.1016/j.jplph.2017.06.001.
Wells R, Trick M, Soumpourou E, Clissold L, Morgan C, Werner P, Gibbard C, Clarke M, Jennaway R, Bancroft I. The control of seed oil polyunsaturate content in the polyploid crop species Brassica napus. Mol Breed. 2014; https://doi.org/10.1007/s11032-013-9954-5.
Qu J, Mao HZ, Chen W, Gao SQ, Bai YN, Sun YW, Geng YF, Ye J. Development of marker-free transgenic Jatrophaplants with increased levels of seed oleic acid. Biotech Biofuels. 2012; https://doi.org/10.1186/1754-6834-5-10.
Pham AT, Shannon JG, Bilyeu KD. Combinations of mutant FAD2 and FAD3 genes to produce high oleic acid and low linolenic acid soybean oil. Theor Appl Genet. 2012; https://doi.org/10.1007/s00122-012-1849-z.
Lu C, Napier JA, Clemente TE, Cahoon EB. New frontiers in oilseed biotechnology: meeting the global demand for vegetable oils for food, feed, biofuel, and industrial applications. Curr Opin Biotechnol. 2011; https://doi.org/10.1016/j.copbio.2010.11.006.
Piffanelli P, Ross JH, Murphy DJ. Intra- and extracellular lipid composition and associated gene expression patterns during pollen development in Brassica napus. Plant J. 1997; https://doi.org/10.1046/j.1365-313X.1997.11030549.x.
Dobritsa AA, Shrestha J, Morant M, Pinot F, Matsuno M, Swanson R, Møller BL, Preuss D. CYP704B1 is along-chain fatty acid ω-hydroxylase essential for sporopollenin synthesis in pollen of Arabidopsis. Plant Physiol. 2009; https://doi.org/10.1104/pp.109.144469.
Jiang J, Zhang Z, Cao J. Pollen wall development: the associated enzymes and metabolic pathways. Plant Biol (Stuttg). 2013; https://doi.org/10.1111/j.1438-8677.2012.00706.x.
Shi J, Cui M, Yang L, Kim YJ, Zhang D. Genetic and biochemical mechanisms of pollen wall development. Trends Plant Sci. 2015; https://doi.org/10.1016/j.tplants.2015.07.010.
Zhang D, Shi J, Yang X. Role of lipid metabolism in plant pollen exine development. In: Nakamura Y, Li-Beisson Y, editors. Lipids in plant and algae development: Subcellular Biochemistry; 2016. https://doi.org/10.1007/978-3-319-25979-6_13.
Aarts MG, Hodge R, Kalantidis K, Florack D, Wilson ZA, Mulligan BJ, Stiekema WJ, Scott R, Pereira A. The Arabidopsis MALE STERILITY 2 protein shares similarity with reductases in elongation/condensation complexes. Plant J. 1997; https://doi.org/10.1046/j.1365-313X.1997.00615.x.
Chen W, Yu XH, Zhang K, Shi J, De Oliveira S, Schreiber L, Shanklin J, Zhang D. Male Sterile2 encodes a plastid-localized fatty acyl carrier protein reductase required for pollen exine development in Arabidopsis. Plant Physiol. 2011; https://doi.org/10.1104/pp.111.181693.
Ariizumi T, Hatakeyama K, Hinata K, Inatsugi R, Nishida I, Sato S, Kato T, Tabata S, Toriyama K. Disruption of the novel plant protein NEF1 affects lipid accumulation in the plastids of the tapetum and exine formation of pollen, resulting in male sterility in Arabidopsis thaliana. Plant J. 2004; https://doi.org/10.1111/j.1365-313X.2004.02118.x.
Morant M, Jørgensen K, Schaller H, Pinot F, Møller BL, Werck-Reichhart D, Bak S. CYP703 is an ancient cytochrome P450 in land plants catalyzing in-chain hydroxylation of lauric acid to provide building blocks for sporopollenin synthesis in pollen. Plant Cell. 2007; https://doi.org/10.1105/tpc.106.045948.
Li H, Pinot F, Sauveplane V, Werck-Reichhart D, Diehl P, Schreiber L, Franke R, Zhang P, Chen L, Gao YW, et al. Cytochrome P450 family member CYP704B2 catalyzes the omega-hydroxylation of fatty acids and is required for anther cutin biosynthesis and pollen exine formation in rice. Plant Cell. 2010; https://doi.org/10.1105/tpc.109.070326.
de Azevedo SC, Kim SS, Koch S, Kienow L, Schneider K, McKim SM, Haughn GW, Kombrink E, Douglas CJ. A novel fatty acyl-CoA Synthetase is required for pollen development and sporopollenin biosynthesis in Arabidopsis. Plant Cell. 2009; https://doi.org/10.1105/tpc.108.062513.
Ariizumi T, Hatakeyama K, Hinata K, Sato S, Kato T, Tabata S, Toriyama K. A novel male-sterile mutant of Arabidopsis thaliana, faceless pollen-1, produces pollen with a smooth surface and an acetolysis-sensitive exine. Plant Mol Biol. 2003; https://doi.org/10.1023/B:PLAN.0000009269.97773.70.
Jung KH, Han MJ, Lee DY, Lee YS, Schreiber L, Franke R, Faust A, Yephremov A, Saedler H, Kim YW, Hwang I, An G. Wax-deficient anther1 is involved in cuticle and wax production in rice anther walls and is required for pollen development. Plant Cell. 2006; https://doi.org/10.1105/tpc.106.042044.
Smirnova A, Leide J, Riederer M. Deficiency in a very-long-chain fatty acid β-ketoacyl-coenzyme a synthase of tomato impairs microgametogenesis and causes floral organ fusion. Plant Physiol. 2013; https://doi.org/10.1104/pp.112.206656.
Shi J, Tan H, Yu XH, Liu Y, Liang W, Ranathunge K, Franke RB, Schreiber L, Wang Y, Kai G, et al. Defective pollen wall is required for anther and microspore development in rice and encodes a fatty acyl carrier protein reductase. Plant Cell. 2011; https://doi.org/10.1105/tpc.111.087528.
Domergue F, Vishwanath SJ, Joubès J, Ono J, Lee JA, Bourdon M, Alhattab R, Lowe C, Pascal S, Lessire R, Rowland O. Three Arabidopsis fatty acyl-coenzyme a reductases, FAR1, FAR4, and FAR5, generate primary fatty alcohols associated with suberin deposition. Plant Physiol. 2010; https://doi.org/10.1104/pp.110.158238.
Kim J, Jung JH, Lee SB, Go YS, Kim HJ, Cahoon R, Markham JE, Cahoon EB, Suh MC. Arabidopsis 3-ketoacyl-coenzyme a synthase9 is involved in the synthesis of tetracosanoic acids as precursors of cuticular waxes, suberins, sphingolipids, and phospholipids. Plant Physiol. 2013; https://doi.org/10.1104/pp.112.210450.
Zhang DS, Liang W, Yin C, Zong J, Gu F, Zhang D. OsC6, encoding a lipid transfer protein, is required for postmeiotic anther development in rice. Plant Physiol. 2010; https://doi.org/10.1104/pp.110.158865.
Zhang T, Hu Y, Jiang W, Fang L, Guan X, Chen J, Zhang J, Saski CA, Scheffler BE, Stelly DM, et al. Sequencing of allotetraploid cotton (Gossypium hirsutum L. acc. TM-1) provides a resource for fiber improvement. Nat Biotechnol. 2015; https://doi.org/10.1038/nbt.3207.
Paterson AH, Wendel JF, Gundlach H, Guo H, Jenkins J, Jin D, Llewellyn D, Showmaker KC, Shu S, Udall J, et al. Repeated polyploidization of Gossypium genomes and the evolution of spinnable cotton fibres. Nature. 2012; https://doi.org/10.1038/nature11798.
Li F, Fan G, Wang K, Sun F, Yuan Y, Song G, Li Q, Ma Z, Lu C, Zou C, et al. Genome sequence of the cultivated cotton Gossypium arboretum. Nat Genet. 2014; https://doi.org/10.1038/ng.2987.
Liu F, Zhao YP, Wang XD, Li YJ, Sun J. Isolation and functional characterization of seed-specific FAD2-1 promoter from cotton (Gossypium hirsutum L). J Plant Biochem Biotechnol. 2015; https://doi.org/10.1007/s13562-014-0284-4.
An X, Dong Z, Tian Y, Xie K, Wu S, Zhu T, Zhang D, Zhou Y, Niu C, Ma B, et al. ZmMs30 encoding a novel GDSL lipase is essential for male fertility and valuable for hybrid breeding in maize. Mol Plant. 2019; https://doi.org/10.1016/j.molp.2019.01.011.
Huang AH, Moreau RA, Liu KD. Development and properties of a wax ester hydrolase in the cotyledons of Jojoba seedlings. Plant Physiol. 1978. https://doi.org/10.1104/pp.61.3.339.
Bonaventure G, Beisson F, Ohlrogge J, Pollard M. Analysis of the aliphatic monomer composition of polyesters associated with Arabidopsis epidermis: occurrence of octadeca-cis-6,cis-9-diene-1,18-dioate as the major component. Plant J. 2004; https://doi.org/10.1111/j.1365-313X.2004.02258.x.
Franke R, Briesen I, Wojciechowski T, Faust A, Yephremov A, Nawrath C, Schreiber L. Apoplastic polyesters in Arabidopsis surface tissues – a typical suberin and a particular cutin. Phytochem. 2005; https://doi.org/10.1016/j.phytochem.2005.09.027.
Cahoon EB, Ripp KG, Hall SE, McGonigle B. Transgenic production of epoxy fatty acids by expression of a cytochrome P450 enzyme from Euphorbia lagascae seed. Plant Physiol. 2002; https://doi.org/10.1104/pp.010768.
Singh S, Thomaeus S, Lee M, Stymne S, Green A. Transgenic expression of a Δ12-epoxygenase gene in Arabidopsis seeds inhibits accumulation of linoleic acid. Planta. 2001; https://doi.org/10.1007/s004250000456.
Broun P, Somerville C. Accumulation of ricinoleic, lesquerolic, and densipolic acids in seeds of transgenic Arabidopsis plants that express a fatty acyl hydroxylase cDNA from castor bean. Plant Physiol. 1997; https://doi.org/10.1104/pp.113.3.933.
Lunn D, Wallis JG, Browse J. Tri-hydroxy-triacylglycerol is efficiently produced by position-specific castor acyltransferases. Plant Physiol. 2019; https://doi.org/10.1104/pp.18.01409.
Miquel M, James D, Dooner H, Browse J. Arabidopsis requires polyunsaturated lipids for low temperature survival. Proc Natl Acad Sci U S A. 1993; https://doi.org/10.1073/pnas.90.13.6208.
Xie DX, Feys BF, James S, Nieto-Rostro M, Turner JG. COI1: an Arabidopsis gene required for jasmonate-regulated defense and fertility. Science. 1998; https://doi.org/10.1126/science.280.5366.1091.
Sanders PM, Lee PY, Biesgen C, Boone JD, Beals TP, Weiler EW, Goldberg RB. The Arabidopsis DELAYED DEHISCENCE 1 gene encodes an enzyme in the jasmonic acid synthesis pathway. Plant Cell. 2000; https://doi.org/10.1105/tpc.12.7.1041.
Stintzi A, Browse J. The Arabidopsis male-sterile mutant, opr3, lacks the 12-oxophytodienoic acid reductase required for jasmonate synthesis. Proc Natl Acad Sci U S A. 2000; https://doi.org/10.1073/pnas.190264497.
McConn M, Browse J. The critical requirement for linolenic acid is pollen development, not photosynthesis, in an Arabidopsis mutant. Plant Cell. 1996;8:403–16.
Trapnell C, Williams BA, Pertea G, Mortazavi A, Kwan G, van Baren MJ, Salzberg SL, Wold BJ, Pachter L. Transcript assembly and quantification by RNA-seq reveals unannotated transcripts and isoform switching during cell differentiation. Nat Biotechnol. 2010; https://doi.org/10.1038/nbt.1621.
Jin S, Zhang X, Nie Y, Guo X, Liang S, Zhu H. Identification of a novel elite genotype for in vitro culture and genetic transformation of cotton. Biol Plant. 2006; https://doi.org/10.1007/s10535-006-0082-5.
Li-Beisson Y, Shorrosh B, Beisson F, Andersson MX, Arondel V, Bates PD, Baud S, Bird D, Debono A, Durrett TP, et al. Acyl-lipid metabolism. Arabidopsis Book. 2013;11:e0161 https://doi.org/10.1199/tab.0161.
Livak KJ, Schmittgen TD. Analysis of relative gene expression data using real-time quantitative PCR and the 2−ΔΔC T method. Methods. 2001; https://doi.org/10.1006/meth.2001.1262.
Acknowledgements
Not applicable.
Funding
This work was supported by National Key Research and Development Program of China [2016YFD0101900] and National Natural Science Foundation of China [31660353]. The funding bodies had no role in the design of the study and collection, analysis, and interpretation of data and in writing the manuscript.
Author information
Authors and Affiliations
Contributions
JS, FL and QZ planned and designed the research. FL, LM, YL, FX, XZ, XN and YW performed experiments, conducted fieldwork, analysed data etc. FL, QZ and JS wrote the manuscript. JS and QZ contributed equally. All authors read and approved the final version of the manuscript.
Corresponding authors
Ethics declarations
Ethics approval and consent to participate
Not applicable.
Consent for publication
Not applicable.
Competing interests
The authors declare that they have no competing interests.
Additional information
Publisher’s Note
Springer Nature remains neutral with regard to jurisdictional claims in published maps and institutional affiliations.
Additional files
Additional file 1:
Figure S1. The coding sequences and phylogenetic analysis of GhFAD2. A. The coding sequences of GhFAD2 genes. The fragment in GhFAD2–3D and GhFAD2–3A targeted for RNAi is highlighted in red color. The underlined sequence in GhFAD2–4A was filled up in this study, which is a gap in the TM-1 genome (Zhang et al. 2015). B. Putative members of the GhFAD2 family in the TM-1 genome identified based on blastp search using the protein sequence of the published GhFAD2–1 (X97016). Gh_D13G2237 contains three indels (50, 14 and 21 aa, respectively) compared to other proteins, and its 3rd deletion contains the 3rd conserved histidine-cluster observed in all FAD2 protein, this gene was thus considered as a non-functional FAD2 and not analysed further in this study. The three conserved histidine-clusters are highlighted in red. The annotated Gh_A01G2091 was incomplete due to gap in the genomic sequence, and the missing sequence was filled up by sequence cloning in this study. C. Phylogenetic analysis of the cotton FAD2 family. The tree was generated based on protein sequences of cotton FAD2 using the Maximum likelihood module of the MEGA6 software. Figure S2 Generation and molecular analysis of transgenic plants. A. Schematic representation of the pBIAP-dsGhFAD2 expression cassettes used for cotton transformation. Promoter, Anther-specific promoter; NPT II, neomycin phosphotransferase II gene; GhFAD2, The partial fragment GhFAD2–3D coding sequence; RB, right border; LB, left border; B. Generation of transgenic plants. a, induction of embryonic calli; b, calli produced from explants; c, embryoid produced from calli; d, regeneration of kanamycin resistant plantlets. C. Detection of the GhFAD2-gus linker fusion fragment in non-transformed control and transgenic plants by PCR. A 1113-bp fusion fragment was amplified and 18 s rDNA was served as a control. The primers used in amplification were 5′-CTGTACAGCGAAGAGGCAGTC-3′ and 5′-CGTTGTAGATAGGACCGTAT-3′ for GhFAD2-gus linker fusion fragment, and 5′-GAGTCTGGTAATTGGAATGAG-3′ and 5′-TTCGCAGTTGTTCGTCTT-3′ for 18S rDNA. Lane M, DNA marker III; Lane 1–4; 18 s rDNA sequence was amplified from transformants line; Lane 5, 18 s rDNA sequence was amplified from untransformed control; Lane 6–9, The fusion fragment was amplified from transformants line; Lane 10, The fusion fragment was amplified from untransformed control. Table S1. Representative differentially expressed genes involved in anther lipid metabolism. Table S2. Primers of selected genes used for qRT-PCR analysis. (DOCX 1056 kb)
Rights and permissions
Open Access This article is distributed under the terms of the Creative Commons Attribution 4.0 International License (http://creativecommons.org/licenses/by/4.0/), which permits unrestricted use, distribution, and reproduction in any medium, provided you give appropriate credit to the original author(s) and the source, provide a link to the Creative Commons license, and indicate if changes were made. The Creative Commons Public Domain Dedication waiver (http://creativecommons.org/publicdomain/zero/1.0/) applies to the data made available in this article, unless otherwise stated.
About this article

Cite this article
Liu, F., Ma, L., Wang, Y. et al. GhFAD2–3 is required for anther development in Gossypium hirsutum. BMC Plant Biol 19, 393 (2019). https://doi.org/10.1186/s12870-019-2010-9
Received:
Accepted:
Published:
DOI: https://doi.org/10.1186/s12870-019-2010-9