
Abstract
In this paper we address automatic vehicle and engine identification based on audio information. Such data depend on many factors, including vehicle type, tires, speed and its change, as well as road type. In our previous research we designed a feature set for selected vehicle classes, discriminating pairs of classes. Later, we decided to expand the feature vector and find the best feature set (mainly based on spectral descriptors), possibly representative for each investigated vehicle category, which can be applied to a bigger data set, with more classes. The experiments were performed first on on-road recordings, and then continued with test bench (dyno) recordings. The paper also shows problems related to vehicles classification, which is detailed in official documents by national authority for issues related to the national road system, but simplified for automatic identification purposes. Experiments on audio-based vehicle type and engine type identification are presented and conclusions are shown.
1 Introduction
The traffic we experience every day in the roads generates a lot of noise. Many countries measure this traffic and monitor its density. Such monitoring generates data (audio, video, etc.) that can be analyzed to estimate how the roads are used, introduce noise prevention etc. The audio data from the traffic monitoring are the subject of research presented in this paper. The reason of choosing the audio is that audio data require less storage space than video, are cheaper to obtain, and can be recorded at night or at other low visibility conditions, for instance during bad weather, etc. The audio recorders are easier to install, also in a way that is not visible for drivers, so they are less distractive. In the case of video cameras, the drivers are expecting a radar device, and change their behavior, so audio only recording can be even preferred. Also, audio data can be used to classify vehicles according to the noise produced, into classes approximately uniform with respect to how annoying the noise is. Still, extracting information from the audio data is not simple.
Audio data representing vehicles passing by are very complex, as they depend on many factors. The noise generated by vehicles depends on the vehicle type, speed, traffic intensity, how old the vehicles are, technical parameters, engine type, tires, exhaust system, air intake system, and other factors (Iwao and Yamazaki 1996). If different vehicles have the same type of engine, they sound very similar. On the other hand, the same vehicle sounds different when traveling upwards, downwards, with uniform speed or accelerating/decelerating. Also, the noise generated by old vehicles in very bad condition will be raised by a few dB. Diesel engine is up to 5 dB louder than gasoline engine, whereas electric motor produces very little noise. At very low speed, below 30 km/h, electric motors are hardly audible. This actually is dangerous for pedestrians, as in this case they do not hear the vehicle approaching. At higher speed, tire friction makes these vehicles audible. Also, the road surface is an important factor of vehicle noise, and the difference can be about 5 dB.
In order to assess the road traffic in Poland, measurements are performed on various designated roads, at specified dates through the observed year, in day time (6am - 10pm), at night (10pm - 6am), and additionally between 8am and 4pm for trucks. The measurements are taken through week days, on Saturdays, Sundays and holidays (General Directorate for National Roads and Motorways 2015). Measurements can be done automatically, semi-automatically, or manually. In other countries, data about traffic are also collected. European Union also issued a directive on the framework for the deployment of Intelligent Transport Systems (Directive 2010/40/Eu of the European Parliament 2010), with the purpose (among others) of the facilitation of the electronic data exchange between urban control centers for public or private transport. The United States also prepared a strategic plan for Intelligent Transport Systems (ITS) (ITS 2015).
1.1 Content of the paper
This paper is an extended version of the paper (Wieczorkowska et al. 2016), where on-road recordings were used in experiments. For the purpose of this paper, we also prepared test bench recordings (dyno) of vehicles representing car and van classes. These classes are difficult to discern, and also only these vehicles can be recorded using the dyno test bench at the University of Life Sciences in Lublin. This is because motorcycles require a special adapter, not available at this test bench, and bigger vehicles cannot enter the test bench, as its capacity is limited to 3.5 t. For our on-road data, we performed multi-label classification for data representing both single and multiple vehicles, as well as multi-class classification for single-label data. These experiments were performed for 7 classes, but we also performed experiments with 3 classes only, in order to compare results with other researchers. For the dyno data, binary classification was performed. Apart from van vs. car classification, we also performed engine type classification, i.e. Diesel vs. gasoline engine. Vehicle type classification can be performed from video data as well, but engine type classification can be only performed for audio data. The data representing various classes of vehicles can be applied for noise assessment purposes.
1.2 Related work
The research on audio-based automatic classification of vehicles has already been performed, for varying number of classes. Such research is usually performed for low sampling rate, 8–11.025 kHz, or downsampled for faster processing, and the analyzing window is usually short, 10–50 ms. In our research, we decided to use 48 kHz/24 bit recordings, as this is the standard in modern audio recorders. Also, we decided to use longer analyzing frame, 330ms, to have high resolution spectrum, and longer frames yielded better results in our previous research, with a smaller feature set (Kubera et al. 2015).
Various classifiers have already been applied for audio-based vehicle classification, often with feature selection; extensive literature review on this subject is presented in Erb (2007). In George et al. (2013), artificial neural network (ANN) was applied for 3 car classes (and horn as the 4th class). The authors in Johnstone and Woodward (2013) also applied ANN, as well as a naive Bayesian classifier, but for 3 vehicles only. Erb (2007) applied SVM (support vector machines) and feature selection with linear prediction for 3 classes: car, truck, and van. He obtained 87% correctness for vehicles traveling at low speed, and 83% for higher vehicle speeds. For traffic without given probabilities, the best result reached 80%, and increased to 83% if class probabilities matched those from the training data (Erb 2007). Alexandre et al. in Alexandre et al. (2015) applied multi-layer perceptrons combined with feature selection based on a genetic algorithm, for another 3 classes: car, motorcycle, and truck. Features included mel-frequency cepstral coefficients (MFCC), and zero crossing rate, yielding 93% correctness for 22 features and 75% for 66 features (Alexandre et al. 2015). Four target classes were investigated in Mayvan et al. (2015): bus, car, motor, and truck. The authors used quadratic and linear discriminant analysis, and also k-nearest neighbors method (k-NN) and SVM. Feature vector included, among others, short time energy, average zero crossing rate, and pitch frequency of periodic segments of signals, yielding 80% correctness for SVM with 12 Mel coefficients (Mayvan et al. 2015). Generally, such research usually aims at recognizing 3-4 classes, for various vehicles, including military ones (see Duarte and Hu (2004)).
2 Data collection and description
All our data were collected in Poland, and they represent a variety of vehicle classes, recorded according to two different scenarios. Namely, we collected on-road data, and test bench data.
2.1 Vehicle classes
The vehicles can be classified in various ways. In Poland, according to the General Directorate for National Roads and Motorways, the vehicles are classified into the following classes: bicycles, motorcycles (including scooters), cars (including minibuses), vans (light trucks, up to 3.5 t), small trucks (above 3.5 t), big trucks (above 3.5 t with trailers or semitrailers), buses, and tractors (including rollers, excavators etc.) (General Directorate for National Roads and Motorways 2015). Detailed specification is also prepared for tax and customs purposes (Izba Celna w Przemyślu 2016). Modern vehicle classification techniques that can be used for vehicle type recognition are based on image/video data sets of vehicle outlines.
Example 1
Let us imagine that we observe vehicles passing by a selected point on the shoulder of a given road; assume 1-minute observation of a 30 m portion of the road, in both directions. During this one minute we can observe, for instance a bicycle, a big truck, several compact cars, an ER ambulance (using a siren) passing another several cars, 2 small trucks, and a bus. We can observe multiple vehicles passing by our observation point at the same time, i.e. a car coming from the left, and a small truck from the right hand side of the observation point. We can record both audio and video (if the visibility is good) data to store our observation. Next, we can label the audio segments according to the vehicles we can see and hear in this segments. Some of the segments will have multiple labels, as they represent multiple vehicle classes.
Vehicle categories include various types of vehicles, differing in the noise produced; also, similar vehicles can vary in the noise they generate. For instance, scooters differ from motorcycles with respect to the noise generated. Cars include vehicles for up to 9 passengers, including the driver. Off-road vehicle fall into this category, and they can produce more noise if all terrain tires are used. Emergency vehicle also produce different sounds when using audible warning devices. Therefore, to obtain relatively uniform representation of each class, we decided to use most typical vehicles for the following 7 classes:
-
1.
bus,
-
2.
small truck (without trailer),
-
3.
big truck (tractor unit with semitrailer),
-
4.
van,
-
5.
motorcycle, excluding scooters,
-
6.
car,
-
7.
tractor.
Minibuses, scooters, and emergency vehicles using audible warning devices were excluded from our research. Also bicycles were excluded, as they produce almost no sound (we recorded several examples). Tractor units without trailers or semitrailers were also excluded.
2.2 On-road data
The audio and video recordings of on-road data were made in a suburban area near Lublin, Poland, on weekdays in the Fall 2012 (12 November; tractors) and the Spring 2015 (5&10 June; other vehicles), at day time and at good weather, together about 1.5 hour of continuous recording. The position of the audio recorder is shown in Fig. 1. Video data were recorded separately, on another device, placed a bit further away from the main road, in order to see the passing vehicles a bit longer. The road is approximately flat and straight here (bending by five degrees 200 meters away from the recording position, and going a bit uphill nearby). The video was used to mark ground truth data, whereas the audio was used for further investigations. Our goal was to parameterize the audio data for the automatic recognition of the vehicle type. In order to make sure the data are properly labeled, we selected segments where the vehicles can be seen and heard (at the distance of about 30 meters), as labeling the segments where the vehicles can be hardly heard would be problematic. Such segments can be as short as 600 ms for motorcycles, which were very fast, and as long as 1.4 s for buses. Tractors were separately recorded and these vehicles were very slow, so a segment for each tractor was 4 s long. We discarded the segments where we had doubts regarding which vehicles are audible, to assure correct ground-truth labeling. 330 ms frames were taken for parametrization and classification, each frame representing vehicle(s) marked in ground-truth labeling; details about amount of frames in each class are given in Section 5.1.

The position of data acquisition in on-road recordings
Example 1.1 (Ex. 1 continued)
After having our observation recorded, we search for audio segments with the data corresponding to our target classes, i.e. representing the sounds of the target vehicle classes. This means that we can ignore for now the ambulance siren, which is very loud and masks other sounds, and the bicycle (it also produces audible data), as they do not represent any of the target classes, as well as the segments with no vehicles recorded at all. We look for segments representing positive and negative examples for each target class. Next, we divide the selected segments into 330 ms frames, without overlapping. In our example, we will have positive examples for car, small truck, big truck, and bus:
-
If in the first second of the remaining segmented recording we have only the bus recorded, we will have 3 frames (3 × 330 ms = 990 ms) of positive examples for bus. The remaining 10 ms will be discarded.
-
If in the next segment, say from 04.670 s to 05.630 s, i.e. 960 ms, we have two cars, one following the other one, so we will have 2 frames (2 × 330 ms = 660 ms) of positive examples for car, and the remaining 300 ms will be ignored. These positive examples can be used as negative examples for other classes, as we know that they are not present here.
-
If in the next segment, say from 10.630 s to 12.710 s, i.e. 2080 ms, we have a car one coming from the left and a small truck coming a bit later (say 0.350 s later it is certainly audible) from the right, then we will have 6 frames of positive example for car. These examples could be negative for other classes except small truck, because we are not sure whether it is present or not in this segment. The remaining 100ms will be ignored.
-
If in the next segment, say from 21.020 s to 22.510 s we have a car, but we are not sure whether other approaching vehicles are audible, we can use data from this segment as positive examples for car, but we cannot use it as negative examples for other classes.
-
Etc.
2.3 Test bench data
Test bench recordings were performed in May and June 2016, at the University of Life Sciences in Lublin. The position of the audio recorder is shown in Fig. 2. Nine vehicles were recorded:
-
Smart ForFour - car, fuel: gasoline,
Fig. 2 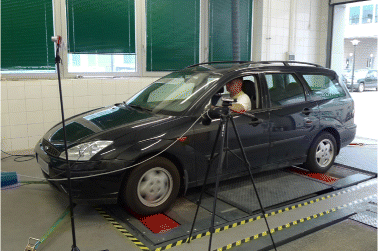
Test bench data recording
-
Ford Focus - car, fuel: gasoline and LPG (liquid petroleum gas),
-
Renault Espace - car, fuel: gasoline and LPG
-
Hyundai i30 - car, Diesel engine,
-
Toyota Corolla Verso - car, Diesel engine,
-
Daewoo Lublin - van, Diesel engine,
-
Fiat Ducato - van, Diesel engine,
-
Volkswagen (VW) Transporters, 2004 and 2007 - van class, Diesel engine.

For each vehicle, we recorded accelerating from 0 to 110 km/h (maintaining speed at 30, 50, 70, 90, and 110 km/h), with the exception of Lublin (to 90 km/h only), and then slowing down to stop. Only recordings within 70–110 km/h range were used in further experiments, as we wanted to have speeds comparable to on-road recordings. All vehicles had manual transmission, and slowing down was performed in two versions: at fifth gear, and at neutral gear. Less than ten minutes of audio and video data were recorded for each car. Ford Focus was recorded in two versions, with engine running on gasoline and when running on LPG. In the test bench setting we also recorded OBD (on-board diagnostics) data when available. These data include vehicle speed, rpm (revolutions per minute), and other data.
Example 2
Let us imagine that we observe a vehicle on the dyno test bench for one minute. In this case, we only have vehicles of interest in our observation, and only one vehicle observed at a time, say Fiat Ducato. If we record our observation, we may have just a single vehicle recorded in our data, or background noises (from outside, people talking, birds singing etc.), which we discard for now before further processing. Since we decided to have 70–110 km/h range, we also remove the parts of recording before the 70 km/h speed is reached, and after the vehicle slows down below this speed. Since we have data recorded in a controlled setting, this can be done easily, as we have access to the OBD data and the speed is known. Subsequently, now we have, say, 37 seconds left. Class labeling is also easy in this case, and we have additional information available, e.g. the engine type. As a result, we have all 112 frames of 330 ms length (non-overlapping, 112 × 330 ms = 36.960 s) labeled as van, and the remaining 40 ms are ignored.
3 Feature set
Our audio data were parameterized, i.e. features describing signal properties were extracted. No pre-processing was applied to the audio signal (no pre-emphasis, filtering etc.). Based on our previous research (Kubera et al. 2015), our features are based on 330 ms audio segments (frames), Hamming windowed for FFT (Fast Fourier Transform) spectrum calculation. Discrete Hamming window w[n] is defined as \(w(n)=0.5(1+cos(\frac {2\pi n}{2M+1}))\) for n=-M,...,M. Infinite length is assumed, so n = 0 behind [−M, M]. Windowing corresponds to multiplication of the data points x[n], i.e. discrete sound representation, by the window function w[n], so the windowed signal s[n] = × [n] × w[n], n = −M,...,M, for the frame length N = 2M + 1. As a result of windowing, the original audio signal values are tapered to zero at both ends of the frame. Windowing is a standard procedure performed before spectrum calculation in order to minimize spectral leakage (and increase spectrum sensitivity), which is unavoidable when cutting out a data frame from the audio signal and introducing discontinuities at the frame border. More information about windowing, window functions and signal processing can be found in the literature, see Madisetti and Williams (1999) for example.
FFT requires the frame length to be a power of two, so the data were zero-padded to the nearest power of two before calculating FFT. Most of the features are spectral, plus zero crossing rate - a temporal feature. The feature vector includes standard features used in audio classification, plus additional features designed to discern objects representing our target classes. The features applied are:
-
Audio Spectrum Envelope - 33 features, SE0, ..., SE32 (The Moving Picture Experts Group 2002),
-
SUM_SE - sum of the spectrum envelope values,
-
MAX_SE_V, MAX_SE_IND - value/index of spectrum envelope maximum,
-
F0_ACor, F0_MLA - fundamental frequency calculated from the autocorrelation function, and through maximum likelihood algorithm (Zhang et al. 2007),
-
EnAb4kHz - proportion of the spectral energy above 4kHz to the entire spectrum energy;
-
Energy - energy of the entire spectrum;
-
Audio Spectrum Centroid (SC) - the power weighted average of the frequency bins in the power spectrum. Coefficients were scaled to an octave scale anchored at 1 kHz (The Moving Picture Experts Group 2002);
-
Audio Spectrum Spread (SS) - RMS (root mean square) of the deviation of the log frequency power spectrum wrt. Audio Spectrum Centroid (The Moving Picture Experts Group 2002);
-
Zero Crossing Rate (ZCR) in the time-domain of the sound wave; a zero-crossing is a point where the sign of the function changes;
-
RollOff - the frequency below which 85% (experimentally chosen threshold) of the accumulated magnitudes of the spectrum is concentrated,
-
A14, A41, A15, A51, A16, A61, A17, A71, A24, A42, A52, A26, A62, A72, A34, A43, A35, A53, A63, A73, A45, A54, A47, A74, A56, A65, A57, A75, A67, A76 - normalized (with respect to the spectrum energy) energies Axy in the spectral ranges determined in such a way that the energy of this frequency range separates classes x and y, i.e. the class x shows higher energy values than the class y in this range; detailed ranges are shown in Table 1. These ranges were automatically found, using twelve 1-second single sounds (without accompanying other vehicles) for each class and 330 ms analyzing frame without overlapping (i.e. 3 frames per second). For the available spectrum resolution, all possible frequency ranges were tested, to find such a range [R low , R up ] that the energy in it is between [min x , max x ] for class x and [min y , max y ] for class y; if min x > max y , then [R low , R up ] is chosen as the range maximizing the margin between objects of x and y. Margin is calculated as (min x − max y )/(max x − min y ). Not for all pairs of classes such discerning ranges were found;
-
B14, B15, B16, B17, B24, B26, B34, B35, B45, B47, B56, B57, B67 - proportion of energies between the indicated spectral ranges, Bxy = Axy/Ayx,
-
BW_10dB, BW_20dB, BW_30dB - bandwidth of the frequency band comprising the spectrum maximum (in dB scale) and the level drop by 10, 20 and 30 dB, respectively, towards both lower and upper frequencies,
-
f_bus, f_smallTruck, f_bigTruck, f_van, f_motorcycle, f_car, f_tractor - features discerning a particular class from all other classes, obtained through multiplication of all available Bxy values; the value for the target class should exceed those for other classes (at least this is the case for the data used to determine the frequency ranges Axy).
Altogether, the feature set consists of 97 features. Some of these features were used in our previous research on vehicle classification (Kubera et al. 2015). New features added in this paper include Audio Spectrum Envelope, SUM_SE, MAX_SE_V, MAX_SE_IND, F0_ACor, F0_MLA, BW_10dB, BW_20dB, BW_30dB, and f_bus, f_smallTruck, f_bigTruck, f_van, f_motorcycle, f_car, f_tractor. Features Axy and Bxy were calculated in the same way as in (Kubera et al. 2015) but for 7 classes and for different audio data (only tractor recordings were the same).
The data for experiments were recorded in stereo, with 48 kHz sampling rate and 24 bit resolution. The average of both channels was used for calculating features, in order to have one-channel data, rather than two separate audio channels.
For each audio frame, the obtained feature vector can be used as input to classifiers. We decided to use binary classifiers, as this allows recognition of plural vehicles per segment, i.e. all recognized target classes (for instance, big truck and car).
Example 1.2 (Ex. 1.1 continued)
All the audio frames we labeled in Example 1.1 are now processed. For each 330 ms stereo audio frame, having 48000 samples per second per audio channel (0.33 × 48000 = 15840 samples per frame), representing sound amplitude, we calculate average of the two channels. Now we calculate Zero Crossing Rate for this frame. Next, we multiply each data point by the Hamming window. This function aims at flattening the data near the frame borders, as then spectrum leaks are diminished. Next, 544 samples of value zero are added to our sequence of samples in the frame, i.e. zero-padding is performed. Now we have a frame of 16384 = 214 samples, and we calculate all the spectral features. Afterwards, we represent each frame of our audio segment through the calculated feature vector. We do this for each frame labeled in Example 1.1.
3.1 Feature selection
After designing the feature set and performing experiments on this set, we also applied feature selection (based on feature importance estimated in random forests), as our feature vector is relatively large, so such a procedure is recommended in this case (Hastie et al. 2009). For each of the classifiers investigated, 3-fold cross validation (CV-3) procedure was applied, with folds manually selected, in order to avoid frames from one segment (i.e. the same vehicle) in different folds, so no training data were present in tests in CV-3. Therefore, we also performed feature selection in folds, to avoid selection bias. Next, we tested 2 versions of feature selection: with constant number of features to be selected (10 features; number arbitrarily chosen), and with feature importance above a selected threshold (0.5 mean decrease of Gini criterion; threshold arbitrarily chosen, based on the observation of feature importance for all classes).
Our experiments were performed first on on-road recordings (7 vehicle classes), and then for test bench recordings (car and van only). For on-road data, hierarchical classification was also performed. Since better results were obtained for these data in the case of threshold-based feature selection, we decided to choose this feature selection scheme in hierarchical classification.
We also performed multi-class classification in further experiments, and for comparison with the related research we performed experiments on the data limited to 3 classes only. Feature selection was performed separately for these experiments, using rfcv function from the randomForest package in The R Foundation (2015) to indicate the number of features to be left in the feature set. The top 12 features were left in the 3-class classification.
4 Classifiers
In our experiments we applied SVM, random forests (RF, (Breiman 2001)), and deep learning (DL) architecture (neural network), using R and packages: h2o, randomForest, and e1071 (Package ’h2o’ 2016; The R Foundation 2015). In each case, we trained a binary classifier for each target class, to recognize automatically whether a target vehicle sound is present in the analyzed audio data (positive answer of the classifier) or not (negative answer). This is because multiple vehicles can be recorded in the same audio frame, and such a frame represents multi-label data. A set of binary classifiers can perform multi-label classification, identifying each vehicle present in the analyzed audio frame. This implements one of the approaches to multi-label classification, namely binary relevance (Dembczyński 2013; Zhang and Zhou 2014). In this approach, the training takes examples representing plural classes as positive examples (and not as negative examples) for each class corresponding to these classes (Wieczorkowska et al. 2006). Therefore, the problem transformation is applied, with fitting the data to the algorithm (Zhang and Zhou 2014). In this case, the task of multi-label learning is transformed into the task of binary classification. Other popular approaches include classifier chains, and label powerset, where each combination of labels constitutes a new class (Dembczyński 2013; Zhang and Zhou 2014). However, in the label powerset approach the number of classes becomes very large, then the data become sparse, and some classes may have very few training examples. Multi-label classification can be also performed through algorithm adaptation approaches, namely through fitting the algorithms to the data, i.e. adapting classifiers to work directly with multi-label data. We decided to follow the binary relevance approach, as then we could use existing classifiers, and avoid the drawbacks of the label powerset approach.
Support vector machines
SVM looks for a decision surface (hyperplane) that maximizes the margin around the decision boundary. The decision hyperplane should be maximally away from the training data points, called support vectors. Data that is not linearly separable is projected into a higher dimensional space where it is linearly separable. This mapping is done by using kernel functions. In our case, we used kernels in form of linear kernel, quadratic kernel, and radial basis functions (RBF). Linear kernel has one parameter, quadratic kernel has two parameters, and RBF also has 2 parameters, c and γ, which require tuning for best performance. We applied automatic tuning available in R package (tune.svm).
Random forests
RF is a set of decision trees, constructed with minimizing bias and correlations between the trees. Each tree is built without pruning to the largest possible extent, using a different N-element bootstrap sample of the N-element training set, i.e. obtained through drawing with replacement. For a K-element feature vector, k features are randomly selected (k ≪ K, often \(k=\sqrt {K}\)) for each node of any tree. The best split on these k features is used to split the data in the node, and Gini impurity criterion is minimized to choose the split. The Gini criterion measures of how often an element would be incorrectly labeled if labeled randomly, according to the distribution of labels in the subset. This procedure is repeated M times, to obtain M trees; M=500 in our first experiments (standard setting in R; this setting was next tuned in further experiments). Classification of is performed by simple voting of all trees in RF.
Deep learning
DL architecture is composed of multiple levels of non-linear operations. DL neural network architecture is a multi-layer neural net, with many hidden layers. This algorithm is implemented in h2o as feedforward neural net, with automatic data standardization. Training is performed through back propagation, with adaptive learning. Weights of connections between neurons are iteratively updated in so-called epochs. Standard setting of DL in h2o were used in our first experiments, and DL tuning was performed for multi-class experiments (see Section 5.2.1), with grid-search of the parameter space. H2o parameters include the number of hidden layers of the network and the number of neurons per layer, the shape of the activation function in neurons, large weight penalization and drop-out regularization, i.e. ignoring a random fraction of neuron inputs.
5 Experiments: on-road data
Continuous recordings contain audio data representing background noise and sounds of vehicles approaching the microphone (and camera) from the left and the right hand side, passing by, and then receding. We selected sections which we could clearly label as positive or negative examples for each target class. Video data were used to guide this manual selection.
5.1 Data
The on-road data used in our experiments contained carefully selected examples representing the target classes. Each positive example represents a 330 ms long segment of audio data with a vehicle from the target class passing by in front of the microphone, possibly accompanied by another vehicle. Negative examples may contain audio material of a vehicle or vehicles from classes other than the target class (or background noise); negative examples outnumber the positive ones for each class. Ground-truth labeling is a demanding task, as we must take into account the vehicles that are not visible, but can be heard in each segment. Video information is used for ground-truth labeling only, whereas each 330 ms audio frame is used for calculating the feature vector, which is next used in further experiments. The data contain:
-
for bus class: 21 positive examples, 158 negative examples,
-
for small truck class: 26 positive examples, 270 negative examples,
-
for big truck class: 39 positive examples, 322 negative examples,
-
for van class: 33 positive examples, 309 negative examples,
-
for motorcycle class: 15 positive examples, 268 negative examples,
-
for car class: 33 positive examples, 160 negative examples,
-
for tractor class: 18 positive examples, 271 negative examples.
Actually, we had much more samples at our disposal, especially for the car class. However, since we had only a few seconds of recordings for tractors and motorcycles, we decided to limit other data, in order to have comparable amounts of positive examples for each class.
The data were divided into 3 folds, with different vehicles data used for training and for testing, in 3-fold cross-validation (CV-3; approximately 2/3 for training and 1/3 for testing in each validation run). The data representing each particular vehicle were always put together in the same fold. The audio data represented sound of a single vehicle, or multiple vehicles. Positive examples contained sounds of the target class (possibly accompanied with other sounds), and negative examples represented any other classes (single or multiple vehicles), or background noise.
Example 1.3 (Ex. 1.1 continued)
Now we can perform training of classifiers on our data from Example 1.2. The frames representing positive examples for car, small truck, big truck, and bus in Example 1.1 are now used as positive examples in training classifiers for car, small truck, big truck, and bus, respectively. Segments where we are sure that we have car only are taken as negative examples for big truck, small truck, and bus. The segments ignored in Example 1.1 with no vehicles recorded can now be used as negative examples for all 4 classes. Therefore, the frames representing ER ambulance with siren, and bicycle as well, can be used as negative examples, if no other vehicles are present in these data.
5.2 Classification results
The error and F-measure for our data using the binary relevance approach are shown in Fig. 3. The classification error is defined as the number of incorrectly classified instances divided by the number of all classified instances. SVM with RBF kernel was applied in this experiment. F-measure in 2 cases could not be calculated, as no positive examples were indicated, or precision and recall were both equal to zero. The error is usually small, with the highest error for car classification using SVM, but still much better than random choice.

F-measure and classification error (binary relevance approach) for the on-road data
We used RF to estimate the importance of the proposed features, for each of the folds in CV-3. As examples, we present feature importance plots for car, motorcycle and tractor in Fig. 4. MeanDecreaseGini in R is used here, which is a measure of feature importance based on the Gini impurity index used for the calculation of splits during RF training (The R Foundation 2015). As we can see, our proposed features are of high importance in these cases. Other important features are related to spectral envelope, also in plots not presented in this paper.

Importance plot for car, motorcycle, and tractor classes
We also performed clustering experiments, in order to check how the proposed feature set is grouping vehicle objects (Struyf et al. 2002). These experiments were performed on the limited feature set, namely f_bus, f_smallTruck, f_bigTruck, f_van, f_motorcycle, f_car, f_tractor. Clustering into 7 clusters was performed for single sounds only (representing only one vehicle), taking approximately 12 seconds of sounds for each class; we had about 36 frames of 330 ms length per class (the number of frames may differ for particular classes, as these 12 seconds might be taken as one segment, or as several segments). Analysis was performed without overlapping of the analyzing frames. Exemplary clustering is presented in Table 2. As we can see, data are a bit mixed in clusters. For example, tractor examples are together with motorcycle data, which can be surprising. This can be caused by the fact that both tractors and motorcycles are noisy vehicles and they use mufflers of similar construction. Still, usually most of the objects are located in one cluster. Only cars and vans are together in one cluster, but these vehicles are similar with respect to produced sound anyway. The obtained clustering shows that our feature set describes vehicle sounds quite well, and explains good results of the classification performed on these data. We should also remember that audio data depend on many factors, including tires, speed, acceleration etc., and these factors can be additionally investigated in further research.
Since our data are imbalanced, we also decided to balance the data when training classifiers. This can be done through downsampling the negative examples for each binary classifiers, or upsampling the examples of each target class (Chen et al. 2001). In our experiments, we decided to perform upsampling, i.e. replicating randomly the target class frames, until the number of the positive examples equals the number of negative examples for a given class. The upsampling, classification and feature selection experiments were performed in 3-fold crossvalidation for each classifier, i.e. repeating the procedure three times. Features of importance exceeding 0.5 threshold of mean decrease of Gini index were kept in the final feature set. The following features were present in each fold for the target classes:
-
bus: SE6-8, SE10-11, SE21-23, SE25, SC, A14, A15, A51, A16, A17, A71, B17, A24, A26, A34, A35, A73, A54, B45, A74, B47, A56, A57, B67, f_bus;
-
small truck: SE0, SE4, SE7, SE11, SE14-16, SE30, SUM_SE, MAX_SE_V, Energy, A14, A16, A61, A24, A52, A26, A34, A35, A53, B35, A45, A54, B45, A47, A56, A67, A76;
-
big truck: SE0-1, SE3, SE5, SE9-15, SUM_SE, F0_Acor, A14, A16, A61, A24, B24, A52, A26, A34, A35, A53, A63, A45, A54, A47, A74, B47, A56, A57, A75, A67, A76;
-
van: SE0, SE7-11, SE13, SE16, SE20, SE23, SE26-32, SUM_SE, F0_Acor, EnAb4kHz, SC, SS, ZCR, RollOff, A14, A41, A15, A16, A61, B16, A17, A24, A52, A26, A62, B26, A34, A43, A53, A54, B45, A74, B47, A56, A65, B56, A67, A76, f_bus, f_smallTruck, f_bigTruck, f_van, f_motorcycle, f_car;
-
motorcycle: SE1, SE4, SE6-7, SE13, SE15, SE22, SE25-32, EnAb4kHz, RollOff, B15, A61, A52, B35, A45, B45, A47, B47, A75, f_bigTruck, f_motocycle;
-
car: SE19-21, SE29-30, SUM_SE, MAX_SE_V, BW_30dB, F0_Acor, SC, SS, ZCR, B14, B16, B24, A52, B26, A43, B34, A53, B56, f_smallTruck, f_bigTruck, f_van, f_car;
-
tractor: SE1, SE7, SE9, SE22-24, SE28-29, SE31-32, A71, B17, A73, B45, A74, B47, f_bigTruck, f_motorcycle, f_tractor.
As we can see, the features designed to identify the target classes, or to discern between pairs of classes, are of high importance and are kept in the feature set after the feature selection procedure.
Classification error and F-measure after feature selection for balanced data are shown in Fig. 5. As we can see, classification error decreased after feature selection in most cases, and deep learning classifiers yield best results. We performed experiments with top 10 features as well, but the results were worse than for features above the threshold. We believe that this is because more features are left in the feature vector, and 10 features for 7 classes might not be sufficient, especially in the case of difficult data, i.e. car and van. The number of features left after threshold-based selection varied from 35 (to discern tractor from other classes) to 80 (for van).

F-measure and classification error (binary relevance approach) after feature selection, for features above threshold
5.2.1 Multi-class classification
Apart from binary relevance multi-label classification approach, we also performed multi-class classification, i.e. single 7-class classifiers were trained. CV-3 scheme was applied, with data manually selected for each fold in such a way that frames from one segment (i.e. the same vehicle) were always in the same fold, so no training data were present in tests in CV-3. Only data representing single vehicles were used (frames with multiple vehicles were discarded), as we needed single-label only for each data item. Both channels of stereo audio data were used separately. We used the same base classifiers as before, and also SVM with linear and quadratic kernel. Additionally, we performed tuning of the parameters of these classifiers, using tuneRF from the randomForest package in R for RF tuning, tune.svm from the e1071 package for SVM tuning, and h2o.grid from the h2o package for DL tuning (Package ’h2o’ 2016; The R Foundation 2015). Additionally, since our feature selection so far was performed with arbitrarily selected number of features or threshold, we decided to apply the rfcv function from the randomForest package to estimate the number of features to be left in the feature set. As a result, no feature selection was applied for 7-class classification, as the best results of the rfcv function were obtained in this case. The following accuracy was obtained:
-
RF: 64.1% (300 trees, 5 variables randomly sampled as candidates at each split),
-
SVM with linear kernel (c = 2): 54.5%,
-
SVM with quadratic kernel, with parameters (2, 0.0625): 37.2%,
-
SVM with RBF kernel, with parameters (4, 0.03125): 51.3%,
-
DL with 2 hidden layers, 50 neurons each, activation function: tanh, dropout=0.05, regularization: l1 = 0.000066, l2 = 0.00001: 74.4%.
As we can see, the results are worse than in the case of any binary classifier in the binary relevance approach, although these results are not directly comparable because of different number of classes and different data (single vehicles only). The best accuracy in multi-class classification was obtained for DL, at a level of 74.4%. This 74.4% accuracy obtained for 7 classes is comparable with the results obtained in Alexandre et al. (2015) for 3 classes only (75% for 66 features), which is encouraging. Therefore, we also decided to perform multi-class classification experiments for our features designed especially for this research, i.e. for 7 features only: f_bus, f_smallTruck, f_bigTruck, f_van, f_motorcycle, f_car, f_tractor. We obtained the following accuracy in this experiments:
-
RF: 46.2%,
-
SVM with linear kernel: 50.6%,
-
SVM with quadratic kernel: 29.5%.
-
SVM with RBF kernel: 43.6%,
-
DL: 60.0%.
Obviously, the results are worse, but for 7 classes quite encouraging. This shows that these features are properly designed.
5.3 Comparison with other research
Research on vehicle identification based on audio data, as described in Section 1.2 (Related Work), has been performed so far, but for varying number of classes, and for various sets of classes. Therefore, direct comparison of our results for 7 classes with other results for 3-4 classes (most common setting) would be difficult. In order to compare our results with other research directly, we decided to perform a limited experiments for 3 classes, as this is the most common case. For the purpose of the comparison experiments, we trained single multi-class classifiers (DL, SVM, RF) instead of a set of binary classifiers. Again, we limited the data to single-label items, as we did in multi-class classification with 7 classes, and both channels of stereo audio data were used separately. Feature selection was performed for this classification, as the rfcv function from the RF indicated the lowest error for 12 features. The features were selected based on the feature importance from RF.
First, we limited the data set to 3 following classes: big truck, car, and van. This set of classes was used in Erb (2007), with reporting car and van as difficult to discern, which was also the case in our experiments. The features selected in this case were: A45, SE14, A57, EnAb4kHz, A53, Se26, SE11, RollOff, SE10, A26, SE15, and A16. As we can see, features for discerning classes 3 (big truck), 4 (van), and 6 (car) are of high importance. We did not have a feature discerning between car and van, as no such spectral range was found, but our features were designed to discern between 7 class. Still, the features indicated as of high importance can be applied to discern these 3 classes. The multi-class classification for big truck, car and van yielded the following accuracy:
-
RF: 88.38%,
-
SVM with linear kernel: 92.90%,
-
SVM with quadratic kernel: 83.78%,
-
SVM with RBF kernel: 89.59%
-
DL: 88.88%.
The experiments in Erb (2007) were performed 50 times with 50% data randomly taken for learning and the rest for testing, we performed our experiments also 50 times, in CV-2 setting. Since the discernment between car and van classes is difficult, we decided to perform the tuning of the classifiers again for this experiment. The best result, i.e. 92.90% accuracy was obtained for SVM with linear kernel, for c = 32, and the worst result was 83.78%, for SVM with quadratic kernel. This compares favorably to Erb (2007), where 83% correctness was obtained for similar data, i.e. car, truck, and van at high speed, 50–70 km/h, also for SVM.
Next, we selected the subset of our 7-class data to represent the following classes: big truck, car, and motorcycle. These classes are much easier to discern, as in Alexandre et al. (2015) the authors reported 93% correctness for their best setting for car, motorcycle, and truck classes. The authors in Alexandre et al. (2015) do not report what vehicles are classified as truck, so we chose big track class, as we did for comparison with Erb (2007). The features selected in this case were: A14, A76, RollOff, SE11, B35, A34, SE14, A45, A26, A35, EnAb4kHz, and B67. As we can see, features for discerning classes 3 (big truck), 5 (motorcycle), and 6 (car) are of high importance, as well as EnAb4kHz, also indicated for big truck vs. car vs. van setting. We did not repeat classifier tuning for the purpose of this experiment, and used the settings of the classifiers found in the tuning for multi-class classification for 7 classes, see Section 5.2.1. We obtained the following results for the multi-class classifiers for big truck, car, and motorcycle:
-
RF: 96.90%,
-
SVM with linear kernel: 98.14%,
-
SVM with quadratic kernel: 68.90%,
-
SVM with RBF kernel: 97.52%
-
DL: 97.45%.
We performed our experiments 50 times with 66/33 random split of the data into the training and testing part, as the authors in Alexandre et al. (2015) followed this setting. Our worst result was again obtained for SVM with quadratic kernel. The best result, 98.14%, was obtained again for SVM with linear kernel. This compares favorably to 93% obtained in Alexandre et al. (2015), for vehicles forced to drive at 50km/h, without gear change. In our case, the speed was not controlled, but since our vehicles were recorded at a highway, in rural area, we assume the speed was similar, or higher.
The results of comparison with other research show that our feature set works well, and the features designed for the purpose of vehicle identification are well constructed.
5.4 Hierarchical classification
We continued the experiments with binary relevance approach to multi-label classification, described in Section 5.2, and we performed hierarchical classification of our data. We again worked on the data described in Section 5.1, so each item could represent single or plural classes. Since our experiments are based on audio data, we decided to group the data into supergroups according to criterion that can be heard. Namely, the vehicle classes were grouped into the following 3 groups according to the typical rotational speed of an engine:
-
LowRot, low rotational speed - tractors, buses, small trucks, big trucks; this class was further subdivided into 2 subclasses:
-
Bus + Truck, big trucks, small trucks, and buses - as these vehicles have similar engines,
-
Tractor, tractors;
-
-
MedRot, medium rotational speed - cars and vans,
-
HiRot, high rotational speed - motorcycles.
Each of our 7 classes constituted a leaf in this hierarchical classification. All classifiers in this scheme are binary, trained using positive and negative examples for a target class. We used again RF, DL and SVM with RBF kernel, as in experiments described in Section 5.2. The data in training here were balanced through upsampling in the case of unbalanced classes; in most cases positive examples were replicated. At each level, the training was performed using examples representing siblings in this hierarchy. For instance, negative examples for car were taken from van, taking only examples where car was absent, and negative examples for van were taken from car, taking only examples where van was absent. Negative examples for bus were taken from small truck and big truck (where bus was absent), negative examples for small truck were taken from big truck and bus (where small truck was absent), negative examples for big truck were taken from bus and small truck (where big truck was absent). Feature selection was applied before these experiments, with 2 options as before: for 10 best features, and for features above the threshold (0.5 mean decrease of Gini criterion). The results for 10 best features are shown in Table 3 and Fig. 6, and the results for features above the threshold are shown in Table 4 and Fig. 7. The results were estimated locally, as we have no full list of labels for each data item, i.e. in some cases we cannot exclude classes other than the target class, so we cannot put such data through hierarchical classification directly; this can be done only for fully labeled data, which is very difficult because of incoming traffic.

F-measure and classification error for each binary classifier in hierarchical classification, using 10 best features in feature selection

F-measure and classification error for each binary classifier in hierarchical classification, using features above the threshold in feature selection
As we can see, better results are obtained again for features above the threshold, and the results are better at higher levels of the hierarchy. For the hierarchical classification, the number of features left after threshold-based selection varied from 3 to 49; 3 features were sufficient to discern bus from other classes from the bus+truck group, whereas 49 features were needed to motorcycles from other classes.
5.5 Multi-label classification using WEKA-based frameworks
5.5.1 Problem transformation approach: MEKA
Apart from our experiments on multi-label classification using the binary relevance approach and next hierarchical classification, we also performed multi-label classification with MEKA (Read et al. 2016), which is a multi-label extension to WEKA (Frank et al. 2016). Because of difficulties with labeling the data for plural vehicles, we decided to take single vehicle sounds and prepare mixes, calculated as the sample-by-sample average of the two frames taken for mixing, separately for each stereo channel of these two frames. Such a mix represented the classes taken for mixing (or one class, if both frames were from the same class). Mixing was performed within each fold separately in CV-3. CV-3 scheme was followed, as described in Section 5.2.1, with data for each particulary vehicle always put in the same fold. Both channels of stereo audio data were used separately.
We used similar base classifiers as in our earlier experiments with binary relevance approach, plus SVM with linear and quadratic kernel, with classifiers’ settings as obtained from tuning performed in Section 5.2.1. Therefore, we had RF (with 300 trees), SVM with linear, quadratic, and RBF kernel, and neural networks (multi-layer perceptron, MLP, with 2 hidden layers, 50 neurons each). Both binary relevance and label powerset approaches were tested. The classification results are shown in Tables 5 and 6.
5.5.2 Algorithm adaptation approach: MULAN
We also decided to test the algorithm adaptation approach, available in MULAN library for multi-label learning (Tsoumakas et al. 2011). We chose MLkNN algorithm, based on k-NN, just to compare algorithm adaptation approach with problem transformation approach. We obtained the following results:
-
accuracy: 36.1%,
-
accuracy per label: bus 66.8%, small truck 66.9%, big truck 66.0%, van 70.7%, motorcycle 71.0%, car 73.4%, tractor 75.7%.
As we can see, the results are similar to the outcomes of the problem transformation approach.
6 Experiments: test bench data
The test bench recordings were altogether shorter than on-road data, but in this case we had audio data with no accompanying other vehicles, so more audio frames were used. Also, in on-road recordings we only had short segments of data per vehicle, as they were passing quickly in front of the recorder, whereas here we had long continuous recordings for each vehicle. The new recordings represent car and van data, which were difficult to discern for on-road recordings. This is why we decided to perform recordings in controlled conditions.
6.1 Data
The test bench data used in our experiments contained 3853 frames representing the car class, and 2222 frames for the van class:
-
Ford Focus: 1469 frames, car, engine: gasoline and LPG,
-
Hyundai: 288 frames, car, Diesel engine,
-
Renault Espace: 491 frames, car, engine: gasoline and LPG,
-
Smart ForFour: 885 frames, car, gasoline engine,
-
Toyota Corolla Verso: 720 frames, car, Diesel engine,
-
Daewoo Lublin: 187 frames, van, Diesel engine,
-
VW Transporter, 2004 year: 556 frames, van, Diesel engine,
-
VW Transporter 2007 year: 867 frames, van, Diesel engine
-
Fiat Ducato: 612 frames, van, Diesel engine.
Again, each frame consisted of 330 ms of audio data. Video and OBD data were used for ground-truth labeling.
For these data we performed binary classification for car and van classes, i.e. we trained one classifier of each type (DL, RF, SVM), discerning between van and car. Additionally, since these data represent vehicles with two types of engine, Diesel engine and gasoline engine, we also decided to experiment with binary classification for the classes corresponding to the engine type. Therefore, we again trained one classifier of each type (DL, RF, SVM), discerning between Diesel and gasoline engine classes. We would like to emphasize that audio data are a proper basis to perform such a classification, and this classification is not feasible from video on-road data.
In these experiments again one frame constitutes one example, labeled as either car or van, and also labeled as either Diesel engine or gasoline engine. The prediction error was estimated through CV-9, with training and testing performed in such a way that the testing examples represented one vehicle which was excluded from the training, i.e. data were divided into nine folds, representing nine vehicles. Therefore, we could observe which particular vehicles are easy or difficult to classify.
Example 2.1 (Ex. 2 continued)
Let us imagine that we want to use the 37 seconds of the dyno recordings we have from Example 2. All the 112 frames are already labeled as van. For the purpose of engine classification, the data need new labeling, namely as Diesel engine. For the engine classification purposes we do not need van/car labeling, so we can simply ignore this information when processing the data, and consider each frame as single-label data item, representing Diesel engine.
6.2 Classification results
Car vs. van classification
For the test bench data, we first performed classification for classes van and car. This time we only needed one classifier to discern between these two classes, i.e. a binary classifier with 2 classes: car and van. Again, RF, SVM (with RBF kernel) and DL classifiers were applied. However, the results for RF and SVM were not satisfactory. F-measure obtained for van vs. car classification, without feature selection, was at a level of 60% for RF and even less for SVM; feature selection improved the results for RF if features above the 0.5 threshold were used, but only by 2 percent points, and taking 10 best features even decreased the results (but improved for SVM, however they were still below 60%). Therefore, these results are comparable with random choice. This is not surprising, as these classes are very similar, and even the border between these classes can be discussed.
The results for car vs. van classification for DL are as follows:
-
without feature selection:
-
car: precision 100%, recall 96.4%, F-measure 98.2%,
-
van: precision 94.2%, recall 100%, F-measure 97%,
-
-
for top 10 features:
-
car: precision 100%, recall 62.5%, F-measure 76.9%,
-
van: precision 60.6%, recall 100%, F-measure 75.5%,
-
-
for features above 0.5 threshold:
-
car: precision 100%, recall 94%, F-measure 97%,
-
van: precision 90.6% recall 100%, F-measure 95.1%.
-
The corresponding confusion matrices for DL are shown in Table 7. These results show that DL classifier works very well with such data, and feature selection only decreases the results, especially when only 10 best features are kept. Apparently the data are too complicated (and difficult to discern) to use a small set of features. Also, the background noise coming from the roller drums drive may influence the recording, and alter the data. Still, van examples are always correctly identified. Incorrectly classified examples represented Ford Focus (104 out of 1469 examples classified as van), Renault Espace (22 out of 491 examples classified as van), and Smart ForFour (12 out of 885 examples classified as van) for best classification results, i.e. without feature selection.
Diesel engine vs. gasoline engine classification
For the test bench data we also performed experiments on engine type classification. We only needed one classifier to discern between Diesel and gasoline engines, i.e. a binary classifier with 2 classes: Diesel and gasoline. Again, RF, SVM results were low, comparable with random choice or even worse for gasoline engine identification. DL classifier again performed very well, and the results for this classification are as follows:
-
without feature selection:
-
Diesel engine: precision 100%, recall 92.7%, F-measure 96.2%,
-
gasoline engine: precision 92.3%, recall 100%, F-measure 96%,
-
-
for top 10 features:
-
Diesel engine: precision 100%, recall 90.1%, F-measure 94.8%,
-
gasoline engine: precision 89.9%, recall 100%, F-measure 94.7%,
-
-
for features above 0.5 threshold:
-
Diesel engine: precision 100%, recall 88.1%, F-measure 93.7%,
-
gasoline engine: precision 88.1%, recall 100%, F-measure 93.7%.
-
Detailed confusion matrices are shown in Table 8. Misclassified examples represented Hyundai i30 (21 examples), Toyota Corolla Verso (139 examples) Daewoo Lublin (24 examples), and VW Transporter 2007 (52 examples), all having Diesel engines classified incorrectly as gasoline engines. All gasoline engines were classified correctly.
As we can see, the results for engine classification are very good. Feature selection decreases the results in both cases, but only by a few percent points. This illustrates that DL can discern engines, and this is what we actually expected, as the difference between the Diesel engine and the gasoline engine can be heard by a listener, too.
7 Summary and conclusions
The features proposed in this paper for audio-based classification of vehicle type yield good results, as the error is below 15% for binary classifiers in most cases (with the exception of car) for on-road data, and in many cases improves after feature selection (below 5%, except bus for SVM and DL, and van for SVM), for 7 classes. This compares favorably with other research, performed for 3-4 classes for similar data. We applied the binary relevance strategy, which allows classification of multi-label data we used, i.e. representing multiple vehicles in a single audio frame. Best results were obtained for deep learning neural network, and hierarchical classification improves the results at higher hierarchy levels. We also performed research on data limited to 3 classes, using multi-class approach for single-label data. The comparison of our results and the results obtained by other researchers for comparable sets of classes shows that our feature set works better in classification tasks. Still, our results can be improved, and we hope to get better results when more data are collected. Also, taking Doppler effect into account may further improve the results, see Berdnikova et al. (2012), where data were compared with prerecorded sounds.
The results obtained for test bench recordings show very good discernment between car and van classes for these data (much better than car vs. van discernment in hierarchical classification of the on-road data), and also showed good discernment of engine type using DL. We would like to underline that engine type classification cannot be performed from video data, and it can be useful in noise assessment tasks.
For test bench recordings, feature selection only decreases the results, and if only ten best features are kept, the discernment between car and van classes deteriorates to a great extent. This illustrates that these classes are indeed difficult to discern, and the set of features must be big enough to catch the small differences between these classes.
In future research, we can also include subclasses not investigated in this research (scooters, emergency vehicles etc.). Other factors than vehicle type can also be taken into account, including vehicle speed, acceleration, tires, etc. Also, video data can be used together with audio data in the vehicle classification task, as video-based vehicle classification is quite a mature domain (see Advanced Driver Assistance Systems (ADAS) (2016) and Hadi et al. (2014)), if video-based classification is applicable.
References
Advanced Driver Assistance Systems (ADAS) (2016). http://www.nvidia.com/object/advanced-driver-assistance-systems.html http://www.nvidia.com/object/advanced-driver-assistance-systems.html.
Alexandre, E., Cuadra, L., Salcedo-Sanz, S., Pastor-Sánchez, A., & Casanova-Mateo, C. (2015). Hybridizing extreme learning machines and genetic algorithms to select acoustic features in vehicle classification applications. Neurocomputing, 152, 58–68.
Berdnikova, J., Ruuben, T., Kozevnikov, V., & Astapov, S. (2012). Acoustic noise pattern detection and identification method in doppler system. Elektronika ir Elektrotechnika, 18(8), 65–68.
Breiman, L. (2001). Random Forests. Machine Learning, 45, 5–32. see also: http://www.stat.berkeley.edu/~breiman/RandomForests/cc_papers.htm.
Chen, C., Liaw, A., & Breiman, L. (2004). Using Random Forest to Learn Imbalanced Data, http://statistics.berkeley.edu/sites/default/files/tech-reports/666.pdf.
Dembczyński, K. (2013). Multi-Target Prediction, Discovery science 2013 (co-located with algorithmic learning theory 2013), tutorial.
Directive 2010/40/Eu of the European Parliament (2010). Directive 2010/40/Eu of the European Parliament and of the Council of 7 July 2010 on the framework for the deployment of Intelligent Transport Systems in the field of road transport and for interfaces with other modes of transport, http://eur-lex.europa.eu/LexUriServ/LexUriServ.do?uri=OJ:L:2010:207:0001:0013:EN:PDF.
Duarte, M.F., & Hu, Y.H. (2004). Vehicle classification in distributed sensor networks. Journal of Parallel and Distributed Computing, 64, 826–838.
Erb, S. (2007). Classification of vehicles based on acoustic features. Thesis, Graz University of Technology.
Frank, E., Hall, M.A., & Witten, I.H. (2016). The WEKA workbench. Online appendix for Data mining: Practical machine learning tools and techniques. Morgan Kaufmann, Fourth Edition.
General Directorate for National Roads and Motorways (2014). (GDDKiA, in Polish) https://www.gddkia.gov.pl/userfiles/articles/z/zarzadzenia-generalnego-dyrektor_13901/zarzadzenie%2038%20Wytyczne%20-%20Zalacznik%20d%20-%20Instrukcja%20%20GPR_2015.pdf.
George, J., Cyril, A., Koshy, B.I., & Mary, L (2013). Exploring sound signature for vehicle detection and classification using ANN international journal on soft computing 4(2).
Hadi, R.A., Sulong, G., & George, L.E. (2014). Vehicle Detection and Tracking Techniques: A Concise Review. Signal & Image Processing : An International Journal (SIPIJ) 5(1). doi:10.5121/sipij.2013.5101.
Hastie, T., Tibshirani, R., & Friedman, J. (2009). The elements of statistical learning. Data mining, inference, and prediction. Springer series in statistics springer.
ITS (2015). Strategic Plan, http://www.its.dot.gov/strategicplan.pdf.
Iwao, K., & Yamazaki, I. (1996). A study on the mechanism of Tire/Road noise. JSAE Review, 17, 139–144.
Johnstone, M.N., & Woodward, A. (2013). Automated detection of vehicles with machine learning, 11Th Australian information security management conference, 102–108.
Kubera, E., Wieczorkowska, A., & Skrzypiec, K. (2015). Audio-Based Hierarchic vehicle classification for intelligent transportation systems. ISMIS 2015. Springer, LNAI.
Madisetti, V.K., & Williams, D.B. (eds.) (1999). Digital Signal Processing Handbook. Chapman & Hall/CRCnetBASE.
Mayvan, A.D., Beheshti, S.A., & Masoom, M.H. (2015). Classification of Vehicles Based on Audio Signals using Quadratic Discriminant Analysis and High Energy Feature Vectors. International Journal on Soft Computing, 6, 53–64.
Package ’h2o’ (2017). http://cran.r-project.org/web/packages/h2o/h2o.pdf.
Read, J., Reutemann, P., Pfahringer, B., & Holmes, G. (2016). MEKA: A Multi-label/Multi-target Extension To Weka. Journal of Machine Learning Research, 17(21), 1–5.
Struyf, A., Hubert, M., & Rousseeuw, P.J. (1997). Clustering in an Object-Oriented Environment, http://www.jstatsoft.org/v01/i04/paper.
The Moving Picture Experts Group (2004). http://mpeg.chiariglione.org/standards/mpeg-7.
The R Foundation (2017). http://www.R-project.org.
Tsoumakas, G., Spyromitros-Xioufis, E., Vilcek, J., & Vlahavas, I. (2011). MULAN: A java library for Multi-Label learning. Journal of Machine Learning Research, 12, 2411–2414.
Wieczorkowska, A., Kubera, E., Słowik, T., & Skrzypiec, K. (2016). Spectral Features for Audio Based Vehicle Identification, New frontiers in mining complex patterns, 4th international workshop, NFMCP 2015, 163–178. springer, LNAI 9607.
Wieczorkowska, A., Synak, P., & Raś, Z.W. (2006). Multi-Label Classification of emotions in music. Advances in Soft Computing: Springer.
Wydawnictwo Podatkowe GOFIN (2013). (in Polish) http://www.poradypodatkowe.pl/artykul,746,4610,klasyfikacja-samochodow-osobowych-a-podatek-akcyzowy.html.
Zhang, M., & Zhou, Z.-H. (2014). A review on Multi-Label learning algorithms. IEEE Transactions on Knowledge and Data Engineering, 26(8), 1819–1837.
Zhang, X., Marasek, K., & Raś, Z.W. (2007). Maximum likelihood study for sound pattern separation and recognition. 2007 international conference on multimedia and ubiquitous engineering MUE 2007, IEEE, 807–812.
Acknowledgments
This work was partially supported by the Research Center of PJAIT, supported by the Ministry of Science and Higher Education in Poland.
Author information
Authors and Affiliations
Corresponding author
Rights and permissions
Open Access This article is distributed under the terms of the Creative Commons Attribution 4.0 International License (http://creativecommons.org/licenses/by/4.0/), which permits unrestricted use, distribution, and reproduction in any medium, provided you give appropriate credit to the original author(s) and the source, provide a link to the Creative Commons license, and indicate if changes were made.
About this article

Cite this article
Wieczorkowska, A., Kubera, E., Słowik, T. et al. Spectral features for audio based vehicle and engine classification. J Intell Inf Syst 50, 265–290 (2018). https://doi.org/10.1007/s10844-017-0459-2
Received:
Revised:
Accepted:
Published:
Issue Date:
DOI: https://doi.org/10.1007/s10844-017-0459-2