
Abstract
Background
Pine wilt disease (PWD), which is caused by the pine wood nematode (PWN) Bursaphelenchus xylophilus, is currently the greatest threat to pine forests in Europe and East Asian countries including Japan. Constructing a detailed linkage map of DNA markers and identifying PWD resistance genes/loci lead to improved resistance in Pinus thunbergii, as well as other Pinus species that are also susceptible to PWD.
Results
A total F1 mapping population of 188 individuals derived from a cross between the PWD-resistant P. thunbergii varieties ‘Tanabe 54’ (resistant rank 2 to PWD) and ‘Tosashimizu 63’ (resistant rank 4 to PWD) was inoculated with PWN, and was evaluated for disease symptoms. To perform linkage analysis for PWN resistance, a set of three maps was constructed; two parental maps generated using the integrated two-way pseudo-testcross method, and a consensus map with population-type cross-pollination. The linkage map of ‘Tanabe 54’ consisted of 167 loci, and covered 14 linkage groups (LGs), with a total genetic distance of 1214.6 cM. The linkage map of ‘Tosashimizu 63’ consisted of 252 loci, and covered 14 LGs, with a total genetic distance of 1422.1 cM. The integrated consensus map comprised 12 LGs with the basic chromosome number of P. thunbergii, and a total genetic distance of 1403.6 cM. Results from quantitative trait loci (QTL) analysis using phenotype data and linkage maps indicated that PWN resistance is controlled by a single dominant allele, which was derived from the ‘Tanabe 54’ female parent. This major QTL was located on linkage group 3 and was designated PWD1 for PINE WILT DISEASE 1.
Conclusions
The PWD1 locus is a major resistance QTL located on the Pinus consensus LG03 that acts in a dominant manner to confer pine wood nematode resistance. Information from the present study will be useful for P. thunbergii breeding programs to improve resistance to PWD, and also to help identify susceptibility genes in Pinus species.
Background
Pine wilt disease (PWD), caused by the pine wood nematode (PWN) Bursaphelenchus xylophilus [1], occurs when the number of PWN within a pine tree increases to such an extent that water transport through the infected tree is compromised, leading to wilting and eventually death [2, 3]. At present, PWD constitutes the greatest threat to pine forests worldwide [2]. The causal agent of PWD is the PWN, and pine sawyer beetles (Monochamus spp.) act as a vector. The PWN has been considered to have originated in North America [4] and is widely distributed in the United States; however, no PWD epidemics have been found and the disease have only occurred in a few exotic pine species [5, 6]. In the areas where it occurs, pine wood nematode is an artificially introduced, invasive pathogen that has caused extensive damage in Japan in 1968, China in 1982, Korea in 1988 and Europe in 1999 [2].
The PWD is a chronic problem in the pine forests (Pinus thunbergii Parl. and P. densiflora Sieb. & Zucc) of Japan, where approximately 40,000,000 m3 of pine forests have been blighted by the PWN since 1978 [7]. As a means of dealing with PWD in Japan, a breeding project to develop resistant pine varieties was started in western Japan in 1978 [8], and related projects have been promoted throughout Japan, excluding Hokkaido Island, as the damage has spread [7, 9]. In the first breeding project from 1978 to 1984, 16 PWD-resistant P. thunbergii clones (selection efficiency; 0.1%) were selected from 15,000 candidate trees, and 92 PWD-resistant P. densiflora clones (selection efficiency; 0.8%) were selected from 11,000 candidate trees [8]. The selected clones were then reared to develop PWD-resistant Pinus varieties.
These varieties were evaluated based on the survival rate of open-pollinated progeny following inoculation with PWN; average rates of survival of openly pollinated progeny from resistant varieties were 51% for P. thunbergii and 65% for P. densiflora, which is respectively 35 and 18% higher than for unselected populations [10]. The narrow-sense heritability based on the open-pollinated family of 15 out of 16 varieties was estimated to be a maximum of 0.486 in P. thunbergii, indicating that resistance (tolerance) is inherited in an additive manner [11]. Furthermore, it was also shown that the number of genetic factors for P. thunbergii resistance was 1.96 based on diallel analysis using a full diallel mating design that used three out of 16 varieties including ‘Tanabe 54’ [12]. The findings have shown that about two genetic factors are involved and that resistance is additive; however, the locus for PWD resistance has not been identified using a molecular genetic approach.
Identifying the genetic determinants for PWD resistance is not only critical for the development of PWD-resistant clones in P. thunbergii, but would also provide valuable information for screening of resistance loci/genes and breeding strategies in other Pinus species. In East Asian countries (China, Korea, and Taiwan), PWD has spread in Pinus species such as P. massoniana Lamb. and P. koraiensis Sieb. & Zucc [13, 14]. In Europe, PWD is also spreading rapidly, causing serious damage in P. pinaster Ait. forests [15,16,17,18,19]. Furthermore, Pinus forests in Europe and East Asia are thought to be at risk of serious damage due to habitat shifts and the spread of PWD due to climate change [20]. In addition, a variety of factors such as shifts in the insect vectors of PWN, the state of international wood trade, and incomplete phytosanitary treatment may also cause further damage [21]. To cope with PWD, screening, selection and genetic evaluation of candidate individuals or families for resistance or tolerance have been carried out in each Pinus species, with the aim of identifying resistant individuals and securing genetic resources [18, 22, 23]. Resistant parents/individuals may be quickly used to promote genetic improvement and more cost-effective breeding if gene-assisted selection (GAS) or marker-assisted selection (MAS) tools are available.
Genetic linkage maps play a major role in genetic analysis and molecular breeding programs, and have been widely used for identification of genetic loci using agronomic traits, such as biological or abiotic stress resistance and yield, which can promote genetic improvement and more cost-effective breeding. In some Pinus species, high-density genetic linkage maps have been constructed using genomic simple sequence repeat (SSR), expressed sequence tag (EST)-derived SSR, or single nucleotide polymorphism (SNP) markers [24,25,26,27], and linkage analysis and genome-wide association studies (GWAS) for agronomic traits (e.g., growth, wood properties, and abiotic/biotic stress resistance) have already been conducted [27, 28]. The previous genetic linkage map in P. thunbergii was mainly constructed by relying on dominant markers, such as random amplification of polymorphic DNA (RAPD) markers to identify loci for resistance to the pine needle gall midge (Thecodiplosis japonensis), and consisted of 17 linkage groups spanning 1469.8 cM with 98 markers [29, 30]. However, it is essential to increase the resolution and density of genetic linkage maps using co-dominant markers in order to identify an effective locus for target traits and to develop a marker for MAS.
To our knowledge, this is the first QTL mapping study of PWD resistance. The present study sought to identify loci related to PWD resistance in resistant P. thunbergii varieties. The specific aims were: (i) to construct a high-confidence genetic linkage map for P. thunbergii; and (ii) to identify loci for PWD resistance in P. thunbergii using the constructed genetic linkage map.
Results
Evaluation of PWD resistance in the population
We evaluated the phenotypes in an F1 population at 56 days post inoculation (dpi) according to the rating scale shown in Table 1. External symptoms occurred at 21 dpi and progressed rapidly until 35 dpi, and disease symptoms were stabilized at 56 dpi (Additional file 1). At 56 dpi, phenotypic scores for PWN resistance showed significant separation into a bimodal distribution with the resistant group (scores 1–2) comprising 50% of all individuals tested, while the susceptible group (scores 3–4) comprised 50% of all individuals tested (Table 2). The phenotypic segregation ratios were not statistically different from 1:1 (x2 = 0.00, p = 1.00), and were different from 3:1 (x2 = 62.67, p = 0.00). These results indicate that PWD resistance in the F1 population is controlled by one major gene. We used the phenotypic scores of the F1 population at 56 dpi for the QTL analysis.
Marker polymorphism
Sixty-one (70.11%) of the 87 genomic SSR markers and 28 (13.59%) of the 206 EST-SSR markers were informative for at least one of the mapping parents. In addition to the SSR data, 138 (17.97%) of the 768 SNPs using the Fluidigm 96.96 Dynamic Array Chip and 268 (30.99%) of the 768 SNPs in the GoldenGate Assay were informative for at least one of the mapping parents; thus, the total number of markers used for linkage mapping was 465. Of these, 98 (21.08%) were segregated in both parents: 17 with four alleles (ab × cd); 16 with three alleles (ef × eg); 65 with two alleles (hk × hk); and 140 (30.11%) were heterozygous in only ‘Tanabe 54’ (lm × ll), while 254 (48.82%) were heterozygous in only ‘Tosashimizu 63’ (nn × np) (Table 3). Being bi-allelic, SNPs were scored as lm × ll, nn × np and hk × hk.
Construction of a genetic linkage map
Three maps were constructed; the two parental maps generated using the integrated two-way pseudo-testcross method, and an integrated consensus map using JoinMap 4.1 (Fig. 1). The linkage map for ‘Tanabe 54’ consisted of 167 loci, and covered 14 LGs (TN54_LG01 to TN54_LG13), with a total genetic distance of 1214.6 cM. The linkage map for ‘Tosashimizu 63’ consisted of 252 loci, and covered 14 LGs (TS63_LG01 to TS63_LG14), with a total genetic distance of 1422.1 cM. The integrated consensus map comprised 12 LGs with a total genetic distance of 1403.6 cM. The average distances between markers in the maps for ‘Tanabe 54’ and ‘Tosashimizu 63’ were 7.9 cM and 6.2 cM, respectively. Gaps wider than 30 cM were identified in five LGs of ‘Tanabe 54’ (TN54_LG01, 02, 03, 05, and 07) and in five LGs of ‘Tosashimizu 63’ (TS63_LG05, 06, 07, 08, and 10) (Table 4).
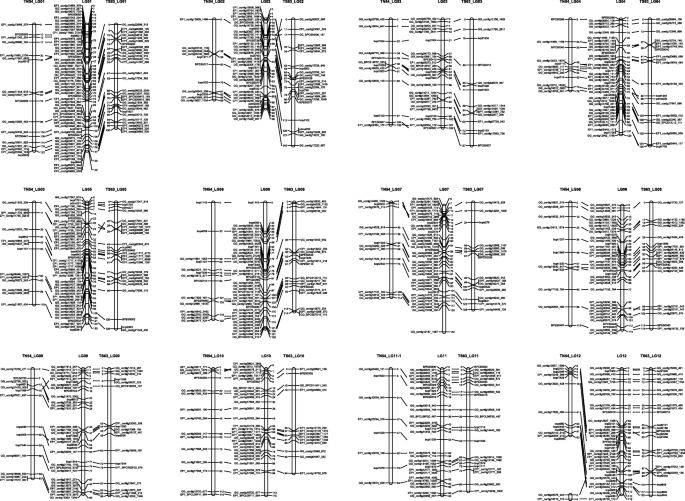
Genetic linkage map of P. thunbergii. The map in the middle (LG01-LG12) is the consensus map constructed from the combined dataset. The maps on the left (TN54_LG01-LG12) and right (TS63_LG01-LG12) are the maternal (‘Tanabe 54’) and paternal (‘Tosashimizu 63’) maps, respectively. Homology between these is depicted by lines. Marker positions are indicated in cM. See Additional files 1, 2, 4, and 5 for DNA marker types mapped on linkage maps
We compared the constructed linkage map in the present study to the P. taeda consensus maps reported recently [24]. The sequences of 397 ESTs mapped on the P. thunbergii linkage map were used to identify the numbering of the linkage group and the order of the DNA markers in P. thunbergii based on the P. taeda linkage map. Of the 397 genes mapped on the P. thunbergii linkage map, 109 were identical to P. taeda genes, with BLASTn e-values ranging from 10E-14 to 0 (Additional file 2). The relative order of mapped genes on the other linkage maps for two Pinus species were highly correlated, R2 = 0.898–0.999 (Additional file 3), although there were not enough markers to compare the relative order of the mapped genes in some linkage groups (LG04), and clear positional differences were seen with a small number of markers in another linkage group (LG12).
Identification of a novel locus for PWD resistance
A QTL analysis performed using a constructed genetic linkage map and phenotypic data from a PWN inoculation test revealed a locus for PWD resistance on LG03 (Fig. 2 and Table 5). This QTL on LG03 was identified in only maternal ‘Tanabe 54’ linkage group 3, and a maximum plateau LOD score value (LOD = 4.27) was detected. The permutation tests with 1000 permutations yielded a LOD score threshold for the PWD resistance of 2.6 at a statistical significance level of α = 0.05, which was used as the threshold to detect QTL for PWD resistance with genome-wide significance. Interval mapping (IM) and Multiple QTL mapping (MQM) mapping confirmed the location of a major QTL explaining up to 9.9% of the total phenotypic variance observed for PWD resistance with a maximum LOD of 4.27 from 38.7 cM to 45.8 cM on LG03. On the other hand, QTL data reanalyzed using an integrated map to reconfirm QTLs detected on the parental linkage maps revealed one major QTL on LG03, and a maximum plateau LOD score value (LOD = 5.51). Permutation tests with 1000 permutations yielded a LOD score threshold for PWD resistance of 4.3 at a statistical significance level of α = 0.05, which was used as the threshold to detect QTL for PWD resistance with genome-wide significance. Interval mapping and MQM mapping confirmed the location of a major QTL explaining up to 12.6% of the total phenotypic variance observed for PWD resistance with a maximum LOD of 5.51 from 41.8 cM to 50.8 cM on LG03. Cofactor selection in MQM mapping selected marker GG_BPCS14F07_283 as a cofactor for this region in all scores.

QTL PWD1 for pine wood disease resistance on linkage group 3. The maps on the left (LG03) and right (TN54_LG03) are the consensus and the maternal (‘Tanabe 54’) maps, respectively. One-LOD support intervals (bars) and diagrams with the LOD values (dashed line) are displayed for interval mapping (line with squares) and MQM analysis (line with circles). The peaks reached a LOD maximum of 4.4, respectively, and explained 10.2% of the variance observed. Marker positions are indicated in cM. The marker used as a cofactor in MQM is highlighted in bold
Using the non-parametric Kruskal-Wallis (KW) test, PWD resistance was associated with three genomic SSR markers; one EST-derived SSR marker, and two EST-derived SNP markers on LG03 (Table 6). Furthermore, all QTLs on LG03 were explained by additive maternal effects (Table 6).
Discussion
In Japan, projects for resistance breeding have produced 183 resistant clones of P. thunbergii and 246 resistant clones of P. densiflora since 1978. Although heritability for resistance traits has been verified using open seedlings of several resistant families [11], the loci involved have not been identified.
This study represents the first attempt to detect the region for PWN resistance. An F1 mapping population derived from a resistant variety cross (‘Tanabe 54’ x ‘Tosashimizu 63’) was used to map the PWN resistance locus. Results from the nematode inoculation test performed on F1 individuals indicated that PWN resistance is controlled by a single dominant allele, which is derived from the ‘Tanabe 54’ female parent. This major QTL for resistance was designated PWD1 for PINE WILT DISEASE 1.
Construction of genetic linkage map
Genetic linkage maps are important in genetic research and breeding for mapping desirable traits and identifying QTL and numerous genetic markers required for constructing linkage maps. In a previous study, 17 linkage groups spanning 1469.8 cM with an average marker density of 15.0 cM were constructed mainly relying on dominant markers such as RAPD markers to identify resistance to the pine needle gall midge (T. japonensis) in P. thunbergii. The present linkage map converged onto 12 linkage groups spanning a distance of 1403.6 cM with an average marker density of 3.3 cM, which defined the positions of 59 polymorphic SSR markers and 369 SNP markers, and were close to the lengths of previously constructed linkage maps.
Furthermore, the development and use of EST-derived SSR and SNP markers in the present study made it possible to construct a more informative genetic linkage map of P. thunbergii by comparison with the information from P. taeda, which has the most dense and accurate genetic information among the Pinaceae taxa studied to date [24]. In some linkage groups, there were not enough markers to compare the relative order of the mapped genes (LG04), but clear positional differences were observed with a small number of markers in the linkage group (LG12). In order to examine the conservation of synteny and chromosome rearrangements between the P. taeda and P. thunbergii genomes for the all linkage groups, including linkage group 4 and 12 (LG04 and LG12), more markers need to be employed in the future. However, the genetic linkage map constructed in this study provided sufficient information to estimate the position of major QTLs for resistance and a number of candidate genes to be targeted in the future.
Paternal and maternal linkage maps constructed using a double pseudo-test cross strategy revealed shorter linkage groups for the maternal map (1214.6 cM) than those for the paternal map (1422.1 cM). The difference in length might be due to differences in the number of informative SNP markers between the overall linkage groups on the maternal (113 SNPs) and paternal (192 SNPs) maps. In addition, the length of LG04 and LG12 showed a noteworthy inconsistency between the maternal and paternal maps. To explore whether this is related to sex, population size or sequencing errors, additional markers need to be developed and more research is required.
QTL analysis for PWD resistance
In the present study, disease severity was evaluated using four degrees of severity, and was converted to a binary standard, such as mortality, which provided reliable data for QTL calculations. For phenotype evaluation, assessment of external wilting symptoms after artificial inoculation is the most commonly used method with regard to evaluating susceptibility and resistance in host pines, and it was revealed that PWD resistance is a heritable trait by genetic analysis of a gene family based on mortality evaluation (alive and dead) [9, 11, 32]. In the present study, PWD resistance in the F1 population was found to be controlled by one major gene as indicated by mortality due to disease severity, and this finding was supported by actual QTL analysis.
The QTL analysis using phenotypic values for PWD resistance in the F1 population succeeded in detecting a major PWD1 locus for PWD resistance on the constructed map of LG03 (Fig. 2 and Table 5), and corresponded to ‘Tanabe 54’ maternal segregation (Fig. 2, Tables 5 and 6). Although the initial hypothesis did not include the detection of a major PWD1 locus related to PWD resistance only in ‘Tanabe 54’, it is a very interesting result demonstrating the heritability of PWD resistance. In a previous study, the heritability of resistance traits in resistant varieties was evaluated based on survival rates of open seedlings, and it was shown that the survival rate of open-pollinated progeny in ‘Tanabe 54’ and ‘Tosashimizu 63’ was 47.5 and 61.1%, respectively, while that of susceptible pines was 12.5% [33]. Furthermore, narrow-sense heritability estimates based on survival data of the open-pollinated family of 15 out of 16 resistant varieties was a maximum of 0.486, indicating that resistance (tolerance) would be inherited in an additive manner [11], and the number of genetic factors for P. thunbergii resistance was 1.96 [12]. The knowledge obtained from previous studies and the results of this study confirmed that ‘Tanabe 54’ has a heterozygous allele involved in PWD resistance, and this locus is a major dominant that exhibits additive effects. We therefore consider that one of the two genetic factors related to PWD resistance reported in a previous study [12] has been identified in this study.
The locus for PWD resistance was detected in ‘Tanabe 54’, but not ‘Tosashimizu 63’. One possible explanation is that ‘Tosashimizu 63’ is a recessive homozygote at the other locus involved in PWD resistance, but the effect cannot be detected in the present crossing. In fact, the locus detected in ‘Tanabe 54’ contributes little to the phenotypic trait (percentage of explained phenotypic variance for the trait by marker). Furthermore, it is also possible that the alleles for PWD resistance in ‘Tosashimizu 63’ had been affected by epistatic interactions by alleles of ‘Tanabe 54’, as well as possibility of having a QTL involving multiple loci rather than a major gene. To identify the resistance locus of ‘Tosashimizu 63’, it will be necessary to cross ‘Tosashimizu 63’ again with susceptible F1 individuals obtained by crossing ‘Tanabe 54’ and ‘Tosashimizu 63’. However, these susceptible individuals will need to be cloned because they will be lost in the inoculation test, and will require a great deal of time to reach the age at which mating is possible. It will be necessary to cultivate new materials and perform inoculation tests in order to identify the resistance locus of ‘Tosashimizu 63’ in the future.
The resistance locus (rhg1-b) for soybean cyst nematode (Heterodera glycines) is recognized as an additive and incompletely dominant gene, and the locus is mediated by copy number variation of three genes within a 31-kb span [34,35,36]. The locus PWD1, which contributes little to the phenotypic trait, might show genetic behavior and mutations (CNV) similar to the soybean cyst nematode resistance (rhg-1b).
By comparison with recently updated P. taeda consensus genetic maps [24], we were able to determine that the PWD1 locus is located on the Pinus consensus LG03. The relatively highly conserved gene order (collinearity) of the P. thunbergii and P. taeda linkage maps facilitates the identification of candidate genes or genomic regions for PWD1 in P. thunbergii and related Pinus species. Genetic and genomic studies of white pine blister rust resistance in P. flexilis and P. lambertiana have identified several major resistance genes (Cr1, Cr2, Cr4) that are anchored on the Pinus consensus genetic map by comparison with P. taeda genetic maps [37,38,39,40]. A candidate gene for PWD resistance might similarly be identified by comparison with the high density linkage map and genomic information for P. taeda [25, 40,41,42,43]. At the present stage, the QTL region (41.8–50.8 cM) detected in P. thunbergii corresponds to the region from 52.1 cM to 117.37 cM on the linkage map of P. taeda, which contains tens of genes. Based on this genomic information from P. taeda, it may be possible to discover further candidate regions and genes by searching for orthologous genes and DNA markers in P. thunbergii.
The pine wilt disease caused by the PWN poses a serious threat to pine forests [20, 44]. In Asia (Japan, South Korea, mainland China, and Taiwan) and Europe (Portugal and Spain), several Pinus species (P. thunbergii, P. densiflora, P. koraiensis and P. massoniana from Asia, and P. sylvestris and P. pinaster from Europe) showing susceptibility to PWN have already been severely affected by PWD. Several other Pinus species are also at risk of serious damage due to future climate change [20]. Furthermore, not only climate change, but factors such as changes in the insect vectors of PWN, the importation of infested wood material via international trade, and incomplete phytosanitary treatment may further increase the damage [21]. As one of a long-lasting approach to address the PWD problem, breeding programs are currently underway to establish PWD-resistant varieties. The linkage map and PWD resistance genes/loci identified in the present study will provide an opportunity to improve resistance and establish a foundation for further genetic research in P. thunbergii and other Pinus species that are susceptible to PWD.
In this study, by using multiple genotyping systems, we constructed a base map for P. thunbergii that can serve as the basis for a genetic approach to resolving the susceptibility of Pinus species to PWD. In addition, this is the first report to identify one of the major loci contributing to PWN resistance in Pinus species. Further research needs to be undertaken to develop more markers using DNA microarrays or next-generation sequencing (NGS) and to construct a high density linkage map for P. thunbergii. On the other hand, phenotypic evaluation methods for PWD resistance need to be improved to detect more QTL contributing to PWD resistance. To date, genotyping systems using DNA microarray or NGS, a DNA microarray that targets tens of thousands of DNA polymorphisms, and next-generation sequencers have become available for conifer species and high density linkage maps have been constructed [24, 25, 45, 46]. Furthermore, for phenotyping, chlorophyll fluorescence and oleoresin flow have been used to evaluate tolerance to PWN infection in P. pinaster, and the physiological condition of pines to PWN has been evaluated [18]. By applying these techniques and methods to other resistant families and resistant P. thunbergii populations in the future, it will be possible to advance the identification of loci that contribute to resistance traits, and to realize GAS and MAS in resistance breeding to PWD.
Conclusions
In this study, we updated the P. thunbergii linkage map, which had been constructed with only dominant DNA markers, by using SSR markers and co-dominant markers derived from ESTs. This was facilitated by a comparison with the previously constructed linkage map information for P. taeda, which has the highest marker density among Pinaceae. Furthermore, QTL analysis of the F1 mapping population, which was conducted using the constructed genetic linkage map and phenotypic data from a PWN inoculation test, revealed a locus for PWD resistance on LG03. This QTL on LG03 was identified in only the maternal ‘Tanabe 54’ linkage group 3, which is a major QTL for resistance.
Methods
Plant material
Sixteen resistant varieties of P. thunbergii were selected for the first breeding program and were ranked with regard to resistance (levels 1–5) based on the survival rate of openly pollinated progeny following PWN inoculation; higher survival rates are thought to indicate greater resistance [33]. An F1 population of 188 individuals was derived from a single cross between two resistant varieties: a female parent ‘Tanabe 54’ and a male parent ‘Tosashimizu 63’ at the Kyushu Regional Breeding Office, Forest Products Research Institute, Forest Tree Breeding Center (FFPRI-FTBC) in Kumamoto, Japan. The female parent ‘Tanabe 54’ had a lower resistance level (level 2), and the male parent ‘Tosashimizu 63’ had a higher resistance level (level 4). Progeny were seeded in March 2013 and planted in a field at the Forest Products Research Institute, Forest Tree Breeding Center (FFPRI-FTBC) in Ibaraki, Japan in April 2014. Seedlings were planted at a spacing of 30 cm × 30 cm. Total genomic DNA of the F1 population was extracted from leaves using a DNeasy Plant Mini Kit (Qiagen, Hilden, Germany) and subjected to polymorphism analysis, as described below.
Artificial inoculation and phenotyping
Inoculation with PWN was conducted on July 23, 2014. The PWN used in this study was the Ka-4 isolate, which has been used in PWD resistance breeding projects since 2003. For inoculation, the main stem was shaved with a knife at 5 cm from the ground to expose cambium cells, and 3000 nematodes suspended in 50 μl of sterile water were injected into the shaved area. Disease symptoms were evaluated every 7 days from 14 dpi to 56 dpi according to the rating scale shown in Table 1.
Genomic SSR genotyping
A total of 87 genomic DNA-derived SSR markers (accession numbers: LC416800-LC416869), including 17 markers identified in previous studies [47,48,49,50], were analyzed using genomic DNA from ‘Tanabe 54’ and ‘Tosashimizu 63’, and informative SSR markers that showed heterozygous patterns in either the female or male parent were used to genotype 188 individuals in the F1 mapping population (Additional file 4). Multiplex PCR with three or four SSR primer pairs was performed using a Multiplex PCR Kit (Qiagen), with 2× QIAGEN multiplex PCR master mix, 0.25 μM of each primer pair, and 40 ng of genomic DNA in a total volume of 10 μl. Amplification was performed on a Veriti thermal cycler (Thermo Fisher Scientific, Waltham, MA, USA) using an initial denaturation step of 95 °C for 15 min, followed by 30 cycles of denaturation at 94 °C for 30 s, annealing at 57 °C for 1.5 min, and extension at 72 °C for 1 min, with a final extension step of 60 °C for 30 min. The PCR products (1 μl) were mixed with 0.2 μl GeneScan 500 LIZ size standard (Thermo Fisher Scientific) and 9.8 μl of Hi-Di formamide (Thermo Fisher Scientific) prior to electrophoresis. The length of amplified fragments was analyzed on an ABI 3130xl sequencer (Thermo Fisher Scientific) and alleles were scored with GeneMapper v5.0 software (Thermo Fisher Scientific).
Development of EST-derived SSR markers and genotyping
PureLink Plant RNA Reagent (Thermo Fisher Scientific) was used to extract total RNA from needles and stems of P. thunbergii ‘Namikata 37’. cDNA libraries were constructed for each organ and then sequencing analysis and data processing were performed as described previously [51]. Microsatellites or SSR motifs (a minimum length of 15 bp with minimum repetitions for di-, tri-, and tetra-nucleotides) were searched based on high-quality reads that comprised > 50 bp of contiguous sequence, and 756 candidate SSR markers without duplication were obtained (accession numbers: HX995015-HX995770). Primer pairs were designed against the flanking sequences of each SSR, as described previously [51]. Genomic DNA from 16 P. thunbergii varieties was analyzed for the 756 SSR markers. The 206 informative SSR markers that showed polymorphic patterns were used to genotype the 188 F1 progeny (Additional file 5). The PCR and genotyping analyses were as described above for genomic SSR genotyping.
Development of EST-derived SNP markers and genotyping
For construction of the reference transcriptome, we extracted total RNA from the stem of a resistant variety, P. thunbergii ‘Namikata 73’, and a susceptible variety (plus-tree), P. thunbergii ‘Kataura 1’, inoculated with PWN Ka-4 isolate at eight time points (1, 3, 6, and 12 h post-inoculation, and 1, 2, 3, and 7 dpi). Total RNA was isolated using an RNeasy Plant Mini kit (Qiagen), and the quality of total RNA was assessed via an Agilent Bioanalyzer 2100 system (Agilent Technologies, Palo Alto, CA). cDNA was synthesized from a mixture of RNA samples by nebulization, adaptor ligation and emulsion PCR, and the 1/2 plate was sequenced using a Roche 454-FLX Life Sciences sequencer (Roche/454 Life Sciences, Branford, CT). All sequence data produced from the 454-FLX were deposited in the DDBJ Sequence Read Archive [DDBJ: DRA000531].
Sequences from the Roche 454-FLX system were trimmed of adapter sequences and poly(A/T) sequences using the cutadapt tool, and low-quality sequences and short sequences (< 100 bp) were removed. The Roche 454-FLX reads and Sanger reads obtained to develop EST-SSR above mentioned markers were assembled using Newbler version 2.6, resulting in a unigene set comprising 22,066 contigs and 1286 singletons. A total of 23,352 unigenes were annotated with BLASTX analysis using the NCBI-nr, PGI database, and KEGG GENES database (Additional file 5). All assembled data produced from 454-FLX and Sanger sequencing were deposited in the DDBJ, Transcriptome Shotgun Assembly division [DDBJ: IADK01000001-IADK01023202]; sequences that overlapped with EST-SSR markers gave priority to accession numbers already given (see Additional file 6).
For SNP discovery, resequencing to the reference sequences was performed for five resistant clones and three susceptible clones using the Illumina HiSeq 2500 platform (Illumina, Branford, CT). RNA was extracted from needles and stems prior to nematode inoculation and at 3 days post-inoculation with nematodes, and mixed for each clone. RNA extraction and quality checks followed the same method used for EST library construction. Using a TruSeq RNA Sample Prep kit ver.2 (Illumina), cDNA synthesis from an RNA sample from each organ, nebulization, adaptor ligation (including index tagging for individual recognition), bridge PCR and paired-end sequencing were performed on the Illumina HiSeq 2500 platform. Reads sequenced on the Illumina HiSeq system were also trimmed of adapter sequences and poly(A/T) by cutadapt. Then, the reads of each library were mapped to reference sequences by BWA [31] and SNPs were identified using SAMtools software [52] with default settings.
For SNP genotyping, we used on two independent SNP assay platforms: an array of 768 SNPs on Illumina’s GoldenGate platform and KBiosciences’ KASPar assay platform. The 768 candidate genes and SNPs supplied on each platform were selected by gene expression profiling between resistant and susceptible clones (Hirao et al. unpublished), and special attention was paid to select only one SNP per differentially expressed transcript. For Illumina’s GoldenGate platform, the 768 selected SNPs were designed with the custom oligonucleotide pooled assay (OPA; Illumina Inc., San Diego, CA) containing the allele-specific and locus-specific oligos for use in the Illumina GoldenGate assay. Genotyping of the SNP markers was carried out using the 768-OPA and Illumina’s BeadArray Express Reader according to the standard manufacturer’s protocol. Automatic allele calling for each locus was inferred with the GenomeStudio Software (Illumina). The list of SNPs and their flanking regions that constituted the OPA are presented in Additional file 7.
For the other SNP assay platform, genotyping of SNPs was performed by competitive allele-specific polymerase chain reaction KASPar chemistry (KBiosciences Ltd., Hoddesdon, UK) using the Fluidigm (Fluidigm Corp., San Francisco, CA) 96.96 dynamic array according to the standard manufacturer’s protocol. End-point fluorescent images of the chip were measured with the EP1 reader (Fluidigm Corp.) and plotted on two axes, and genotypes based on EP1 measurements were assessed using Fluidigm SNP Genotyping Analysis software (Fluidigm, 2011). The list of SNPs and their flanking regions for a total of 768 SNP markers (8 marker panels constituting 96 SNPs) are presented in Additional file 8.
Linkage map construction
Linkage analysis was conducted using JoinMap 4.1 software [53] with population type cross-pollination (CP) [54]. To construct an integrated map of ‘Tanabe 54 ‘and ‘Tosashimizu 63’, all segregating markers that showed polymorphism in at least one parent were used in the JoinMap configurations for CP mode (ab × cd, lm × ll, nn × np, ef × eg, and hk × hk). The ratio of marker segregation was calculated by Chi-squared test. Markers showing significantly distorted segregation (P-value < 0.001) were excluded from the map construction. Markers were grouped with a minimum logarithm of odds (LOD) score of 5.0 and a recombination frequency of 0.45. A regression mapping algorithm was used to build the linkage map, and map distances were calculated according to the Kosambi mapping function [55]. All other calculation conditions were used at default settings. The number of linkage groups and the order of markers in this study were determined.
A double pseudo-test cross strategy [54] was applied for genetic linkage map construction. The LOD threshold for mapping was set at 4.0 and the recombination frequency at 0.45. The marker configurations ab × cd, lm × ll, and ef × eg were used for the maternal maps ‘Tanabe 54’, and configurations ab × cd, nn × np, and ef × eg were used for the paternal maps ‘Tosashimizu 63’. The marker configuration hk × hk refers to a bi-parental marker with genotypes hh, hk and kk, and hk was coded as the non-informative marker (−-). The genetic linkage map was drawn with MapChart 2.2 software [56], and homologous linkage groups were compared using the software and illustrated so that each integrated map group was between the parental maps.
The numbering of the linkage map and the order of the DNA markers derived from EST in P. thunbergii were estimated by identifying highly conserved Pinus genes or orthologs by local BLAST analysis (E values < 10e-10) with P. taeda [24]. Based on the results of BLAST analysis, the number and orientation of the linkage group or the relative order and location of the mapped genes in P. thunbergii were determined based on information from the P. taeda linkage map.
QTL analysis
QTL analysis was performed using MapQTL 6.0 software [57]. QTL identification was initially performed using the parental maps of ‘Tanabe 54’ and ‘Tosashimizu 63’ separately; data were then reanalyzed using an integrated map to reconfirm the QTLs detected on the parental linkage maps. To perform the binary trait method in the present QTL analysis, the resistant and susceptible phenotypes were converted to values equal to 0 and 1 (Table 2), respectively, and two different methods were used. First, interval mapping (IM) at 1 cM intervals was carried out to detect QTLs. The genome-wide and LG-specific LOD (logarithm of the odds) thresholds for each QTL were calculated using a permutation test with 1000 repetitions at P < 0.05 (5%). Closely flanking markers were then selected as cofactors and multiple QTL mapping (MQM) performed. Second, the non-parametric KW test module was performed for traits to confirm the significance of the marker nearest the detected QTL. An allelic effect for the QTL was calculated in MapQTL6 based on the SSR genotypes significantly detected by KW using the formula proposed by Knott et al. [58].
Availability of data and materials
All data generated or analyzed during this study are included in this published article and its Additional information files.
Abbreviations
- EST:
-
Expressed sequence tag
- LG:
-
Linkage group
- LOD:
-
Logarithm of the odds
- MAS:
-
Marker-assisted selection
- QTL:
-
Quantitative trait locus
- SNP:
-
Single nucleotide polymorphism
- SSR:
-
Simple sequence repeat
References
Kiyohara T, Tokushige Y. Inoculation experiments of a nematode, Bursaphelenchus sp., onto pine trees. J Japanese For Soc. 1971;53:210–8.
Futai K. Pine wood nematode, Bursaphelenchus xylophilus. Annu Rev Phytopathol. 2013;51:61–83.
Jones JT, Moens M, Mota M, Li H, Kikuchi T. Bursaphelenchus xylophilus : opportunities in comparative genomics and molecular host–parasite interactions. Mol Plant Pathol. 2008;9:357–68.
Tarès S, Lemontey J-M, de Guiran G, Abad P. Use of species-specific satellite DNA from Bursaphelenchus xylophilus as a diagnostic probe. Phytopathology. 1994;84:294–8.
Dropkin VH, Foudin A, Kondo E, Linit M, Smith M, Robbins K. Pinewood nematode: a threat to U.S. forests? Plant Dis. 1981;65:1022–7.
Sutherland JR. A brief overview of the pine wood nematode and pine wilt disease in Canada and the United States. In: Pine Wilt Dis. Tokyo: Springer Japan; 2008. p. 13–7.
Forestry Agency, Ministry of Agriculture, Forestry and Fisheries of Japan. Annual report on trends of forest and forestry-fiscal year 2009. Tokyo: Forestry Agency, Ministry of Agriculture, Forestry and Fisheries of Japan; 2010. (In Japanese).
Fujimoto K, Toda T, Nishimura K, Yamate H, Fuyuno S. Breeding project on resistance to the pine-wood nematode. –an outline of the research and the achievement of the project for ten years. Bull For Tree Breed Inst. 1989;7:1–84.
Kurinobu S. Current status of resistance breeding of Japanese pine species to pine wilt disease. Forest Sci Technol. 2008;4:51–7.
Toda T, Kurinobu S. Realized genetic gains observed in progeny tolerance of selected red pine (Pinus densiflora) and black pine (P. thunbergii) to pine wilt disease. Silvae Genet. 2002;51:42–4.
Toda T, Kurinobu S. Genetic improvement in pine wilt disease resistance in Pinus thunbergii : the effectiveness of pre-screening with an artificial inoculation at the nursery. J For Res. 2001;6:197–201.
Kuramoto N, Ohira M, Hiraoka Y, Taniguchi T, Kashiwagi M, Inoue Y, et al. Genetic analysis of resistance against the pine wilt disease in the full-diallele families of Japanese black and red pines. Japanese For Soc Congr. 2007;118:393 (In Japanese).
Zhao BG. Pine wilt disease in China. In: Zhao BG, Futai K, Sutherland JR, Yuko T, editors. Pine Wilt Dis. Tokyo: Springer Japan; 2008. p. 18–25.
Shin S-C. Pine Wilt Diseas in Korea. In: Zhao BG, Futai K, Sutherland JR, Yuko T, editors. Pine Wilt Dis. Tokyo: Springer Japan; 2008. p. 26–32.
Burgermeister W, Braasch H, Sousa E, Penas AC, Mota M, Metge K, et al. First report of Bursaphelenchus xylophilus in Portugal and in Europe. Nematology. 1999;1:727–34.
Robertson L, Cobacho Arcos S, Escuer M, Santiago Merino R, Esparrago G, Abelleira A, et al. Incidence of the pinewood nematode Bursaphelenchus xylophlius Steiner & Buhrer, 1934 (Nickle, 1970) in Spain. Nematology. 2011;13:755–7.
Soliman T, Mourits MCM, van der Werf W, Hengeveld GM, Robinet C, Lansink AGJMO. Framework for modelling economic impacts of invasive species, applied to pine wood nematode in Europe. PLoS One. 2012;7:e45505.
Menéndez-Gutiérrez M, Alonso M, Toval G, Díaz R. Testing of selected Pinus pinaster half-sib families for tolerance to pinewood nematode (Bursaphelenchus xylophilus). Forestry. 2018;91:38–48 Oxford University Press.
Vicente C, Espada M, Vieira P, Mota M. Pine wilt disease: a threat to European forestry. Eur J Plant Pathol. 2012;133:89–99.
Hirata A, Nakamura K, Nakao K, Kominami Y, Tanaka N, Ohashi H, et al. Potential distribution of pine wilt disease under future climate change scenarios. PLoS One. 2017;12:e0182837.
d’Errico G, Carletti B, Schröder T, Mota M, Vieira P, Roversi PF. An update on the occurrence of nematodes belonging to the genus Bursaphelenchus in the Mediterranean area. Forestry. 2015;88:509–20.
Mine N, Susumu S. Breeding for resistance to Pine Wilt Disease. In: BG Z, Futai K, Shutherland J, Takeuchi Y, editors. Pine Wilt Dis. Tokyo: Springer Japan; 2008. p. 334–50.
Ribeiro B, Espada M, Vu T, Nóbrega F, Mota M, Carrasquinho I. Pine wilt disease: detection of the pinewood nematode (Bursaphelenchus xylophilus) as a tool for a pine breeding programme. For Pathol. 2012;42:521–5.
Westbrook JW, Chhatre VE, Wu L-S, Chamala S, Neves LG, Muñoz P, et al. A consensus genetic map for Pinus taeda and Pinus elliottii and extent of linkage disequilibrium in two genotype-phenotype discovery populations of Pinus taeda. G3. 2015;5:1685–94.
Neves LG, Davis JM, Barbazuk WB, Kirst M. A high-density gene map of loblolly pine ( Pinus taeda L .) Based on exome sequence capture genotyping. G3. 2014;4:29–37.
Moraga-Suazo P, Orellana L, Quiroga P, Balocchi C, Sanfuentes E, Whetten RW, et al. Development of a genetic linkage map for Pinus radiata and detection of pitch canker disease resistance associated QTLs. Trees Struct Funct. 2014;28:1823–35.
Bartholomé J, Bink MC, Van Heerwaarden J, Chancerel E, Boury C, Lesur I, et al. Linkage and association mapping for two major traits used in the maritime pine breeding program: height growth and stem straightness. PLoS One. 2016;11:1–21.
Xiong JS, McKeand SE, Isik F, Wegrzyn J, Neale DB, Zeng ZB, et al. Quantitative trait loci influencing forking defects in an outbred pedigree of loblolly pine. BMC Genet. 2016;17:1–11.
Kondo T, Terada K, Hayashi E, Kuramoto N, Okamura M, Kawasaki H. RAPD markers linked to a gene for resistance to pine needle gall midge in Japanese black pine (Pinus thunbergii). Theor Appl Genet. 2000;100:391–5.
Hayashi E, Kondo T, Terada K, Kuramoto N, Kawasaki S. Identification of AFLP markers linked to a resistance gene against pine needle gall midge in Japanese black pine. Theor Appl Genet. 2004;108:1177–81.
Li H, Durbin R. Fast and accurate short read alignment with burrows-wheeler transform. Bioinformatics. 2009;25:1754–60.
Menéndez-Gutiérrez M, Alonso M, Toval G, Díaz R. Variation in pinewood nematode susceptibility among Pinus pinaster Ait. provenances from the Iberian Peninsula and France. Ann For Sci. 2017;74:76 Annals of Forest Science.
Toda T. Studies on breeding for resistance to pine wilt disease in Pinus densiflora and P. thunbergii. Bull For Tree Breed Cent. 2004;20:83–217 (In Japanese with English summary).
Kim M, Hyten DL, Bent AF, Diers BW. Fine mapping of the SCN resistance locus rhg1-b from PI 88788. Plant Genome J. 2010;3:81–9.
Cook DE, Lee TG, Guo X, Melito S, Wang K, Bayless AM, et al. Copy number variation of multiple genes at Rhg1 mediates nematode resistance in soybean. Science. 2012;338:1206–9.
Liu S, Kandoth PK, Lakhssassi N, Kang J, Colantonio V, Heinz R, et al. The soybean GmSNAP18 gene underlies two types of resistance to soybean cyst nematode. Nat Commun. 2017;8:1–11.
Liu JJ, Schoettle AW, Sniezko RA, Sturrock RN, Zamany A, Williams H, et al. Genetic mapping of Pinus flexilis major gene (Cr4) for resistance to white pine blister rust using transcriptome-based SNP genotyping. BMC Genomics. 2016;17:1–12 BMC Genomics.
Liu JJ, Sniezko RA, Zamany A, Williams H, Wang N, Kegley A, et al. Saturated genic SNP mapping identified functional candidates and selection tools for the Pinus monticola Cr2 locus controlling resistance to white pine blister rust. Plant Biotechnol J. 2017;15:1149–62.
Jermstad KD, Eckert AJ, Wegrzyn JL, Delfino-Mix A, Davis DA, Burton DC, et al. Comparative mapping in Pinus: sugar pine (Pinus lambertiana Dougl.) and loblolly pine (Pinus taeda L.). Tree Genet Genomes. 2011;7:457–68.
Neale DB, Wegrzyn JL, Stevens KA, Zimin AV, Puiu D, Crepeau MW, et al. Decoding the massive genome of loblolly pine using haploid DNA and novel assembly strategies. Genome Biol. 2014;15:1–13.
Zimin A, Stevens KA, Crepeau MW, Holtz-Morris A, Koriabine M, Marçais G, et al. Sequencing and assembly of the 22-Gb loblolly pine genome. Genetics. 2014;196:875–90.
Zimin AV, Stevens KA, Crepeau MW, Puiu D, Wegrzyn JL, Yorke JA, et al. Erratum: an improved assembly of the loblolly pine mega-genome using long-read single-molecule sequencing. Gigascience. 2017;6:1–4.
Wegrzyn JL, Liechty JD, Stevens KA, Wu LS, Loopstra CA, Vasquez-Gross HA, et al. Unique features of the loblolly pine (Pinus taeda L.) megagenome revealed through sequence annotation. Genetics. 2014;196:891–909.
Pukkala T, Möykkynen T, Robinet C. Comparison of the potential spread of pinewood nematode ( Bursaphelenchus xylophilus ) in Finland and Iberia simulated with a cellular automaton model. For Pathol. 2014;44:341–52.
Plomion C, Bartholomé J, Lesur I, Boury C, Rodríguez-Quilón I, Lagraulet H, et al. High-density SNP assay development for genetic analysis in maritime pine ( Pinus pinaster ). Mol Ecol Resour. 2016;16:574–87.
Mishima K, Hirao T, Tsubomura M, Tamura M, Kurita M, Nose M, et al. Identification of novel putative causative genes and genetic marker for male sterility in Japanese cedar (Cryptomeria japonica D.Don). BMC Genomics. 2018;19(1):277.
Lian C, Miwa M, Hogetsu T. Isolation and characterization of microsatellite loci from the Japanese red pine, Pinus densiflora. Mol Ecol. 2000;9:1186–7.
Watanabe A, Iwaizumi MG, Ubukata M, Kondo T, Lian C, Hogetsu T. Isolation of microsatellite markers from Pinus densiflora Sieb. et Zucc. using a dual PCR technique. Mol Ecol Notes. 2006;6:80–2.
Iwaizumi MG, Tsuda Y, Ohtani M, Tsumura Y, Takahashi M. Recent distribution changes affect geographic clines in genetic diversity and structure of Pinus densiflora natural populations in Japan. For Ecol Manage. 2013;304:407–16 Elsevier.
Iwaizumi MG, Miyata S, Hirao T, Tamura M, Watanabe A. Historical seed use and transfer affects geographic specificity in genetic diversity and structure of old planted Pinus thunbergii populations. For Ecol Manag. 2018;408:211–9.
Shirasawa K, Oyama M, Hirakawa H, Sato S, Tabata S, Fujioka T, et al. An EST-SSR linkage map of Raphanus sativus and comparative genomics of the Brassicaceae. DNA Res. 2011;18:221–32 Oxford University Press.
Li H, Handsaker B, Wysoker A, Fennell T, Ruan J, Homer N, et al. The sequence alignment/map format and SAMtools. Bioinformatics. 2009;25:2078–9.
Van Ooijen JW. JoinMap 4: software for the calculation of genetic linkage maps in experimental populations. Netherlands: Kyazma BV; 2006.
Grattapaglia D, Sederoff R. Genetic linkage maps of Eucalyptus grandis and Eucalyptus urophylla using a pseudo-testcross: mapping strategy and RAPD markers. Genetics. 1994;137:1121–37.
Kosambi DD. The estimation of map distances from recombination values. Ann Eugenics. 1943;12:172–5.
Voorrips RE. MapChart: software for the graphical presentation of linkage maps and QTLs. J Hered. 2002;93:77–8.
Van Ooijen JW. MapQTL version 6.0, Software for the mapping of quantitative trait loci in experimental populations of diploid species. Wageningen: Kyazma BV; 2009.
Knott SA, Marklund L, Haley CS, Andersson K, Davies W, Ellegren H, et al. Multiple marker mapping of quantitative trait loci in a cross between outbred wild boar and large white pigs. Genetics. 1998;149:1069–80.
Acknowledgements
We thank Dr. S. Hattori and Dr. K. Ohshima at the Center for Omics and Bioinformatics, Tokyo University for sequencing using the Roche 454-FLX Life Sciences sequencer. We also thank Dr. M. Yano and Dr. Y. Katayose of the National Institute of Agrobiological Sciences for GoldenGate SNP genotyping and for giving us permission to use their bead array reader. We thank Dr. M. Kunihisa at the NARO Institute of Fruit Tree Science and Dr. H. Takahashi of Akita Prefectural University for advice on the construction of linkage maps and QTL analysis. We thank Dr. M. Takahashi and Dr. H. Hoshi of FTBC, FFPRI for their well coordination of the research project. We also thank our colleagues in the field management section of FTBC, FFPRI for the production and cultivation of plant materials.
Funding
The development of EST-derived SNP markers and genotyping were funded by “Project to advance the development of technology for varieties of Japanese black pine and red pine resistant to the pine wood nematode” (Forestry Agency, Ministry of Agriculture, Forestry and Fisheries of Japan).
Author information
Authors and Affiliations
Contributions
TH - prepared DNA/RNA, sequenced ESTs, analyzed EST data, genotyped each DNA marker, constructed linkage maps, performed QTL analysis, wrote the manuscript, and revised the manuscript; KMa - Contributed materials, wrote the manuscript, and revised the manuscript; HH - Analyzed sequencing data and prepared DDBJ data submissions; KS - Sequenced ESTs and developed EST-SSR markers; KI - Developed genomic SSR markers; KMi - performed genotyping using the Fluidigm EP1 system and sampling; MT - prepared EST-derived SNP markers; AW - proposed research project, guided research process and wrote the manuscript. All authors assisted with manuscript preparation, and read and approved the final manuscript.
Corresponding authors
Ethics declarations
Ethics approval and consent to participate
This study required no ethics approval.
Consent for publication
Not applicable.
Competing interests
The authors declare that they have no competing interests.
Additional information
Publisher’s Note
Springer Nature remains neutral with regard to jurisdictional claims in published maps and institutional affiliations.
Supplementary information
Additional file 1: Figure S1.
The phenotypes in an F1 population before inoculation and from 14 days post-inoculation (dpi) of PWN until 56 dpi. Full view of individual numbers 1 to 96.The phenotypes in an F1 population before inoculation and from 14 days post-inoculation (dpi) of PWN until 56 dpi. Full view of individual numbers 97 to 198.
Additional file 2: Table S1.
Correspondence of orthologous markers mapped on P. thunbergii and P. taeda linkage groups.
Additional file 3: Table S2.
Syntenic relationship between Pinus thunbergii linkage group and P. taeda linkage group. P. taeda genetic linkage map data were based on a previous report [25].
Additional file 4: Table S3.
Details of 87 genomic DNA-derived SSR markers in Pinus thunbergii.
Additional file 5: Table S4.
Summary of BLAST search results of ESTs derived from Roche 454-FLX and Sanger reads assembly. Accession ID of 454 and Sanger data is as for the Transcriptome Shotgun Assembly (TSA) division of the DDBJ database.
Additional file 6: Table S5.
Details of 206 EST-SSR markers derived from 756 non-redundant ESTs in Pinus thunbergii.
Additional file 7: Table S6.
Characteristics of 768 SNPs of Pinus thunbergii on Illumina’s GoldenGate platform. Locus name, LG position, target SNP and sequence flanking the queried SNPs (in brackets) are described.
Additional file 8: Table S7.
Primer information for 768 SNPs of Pinus thunbergii for BioMark 96.96 Dynamic Array (Fluidigm) using KASPar assays. Locus name, LG position, target SNP and sequence flanking the queried SNPs (in brackets) are described. Furthermore, sequences for allele-specific primers (ASP1 and ASP2), locus-specific primer (LSP), and specific target amplification primer (STA) are also described.
Rights and permissions
Open Access This article is distributed under the terms of the Creative Commons Attribution 4.0 International License (http://creativecommons.org/licenses/by/4.0/), which permits unrestricted use, distribution, and reproduction in any medium, provided you give appropriate credit to the original author(s) and the source, provide a link to the Creative Commons license, and indicate if changes were made. The Creative Commons Public Domain Dedication waiver (http://creativecommons.org/publicdomain/zero/1.0/) applies to the data made available in this article, unless otherwise stated.
About this article

Cite this article
Hirao, T., Matsunaga, K., Hirakawa, H. et al. Construction of genetic linkage map and identification of a novel major locus for resistance to pine wood nematode in Japanese black pine (Pinus thunbergii). BMC Plant Biol 19, 424 (2019). https://doi.org/10.1186/s12870-019-2045-y
Received:
Accepted:
Published:
DOI: https://doi.org/10.1186/s12870-019-2045-y