
Abstract
For the first time, planar joints between pure aluminum and galvanized or uncoated DP450 steel joints have been developed via magnetic pulse welding. Both present a wavy interface. The microstructure of the interfacial zone differs according to the joint. With uncoated steel, the interface is composed of discrete 2.5-µm-thick FeAl3 intermetallic compounds and Fe penetration lamellae, whereas the interface of the pure Al-galvanized steel joint is bilayered and composed of a 10-nm-thick (Al)Zn solid solution and a few micrometers thick aggregate of Al- and Zn-based grains, arranged from the Al side to the Zn coating. Even if the nature of the interfacial zone differs with or without the steel coating, both welds present rather similar maximum tensile forces and ductility in shear lap testing.
1 Introduction
For lightening and subsequent energy cost purposes, aluminum alloy and steel joining has gained increasing interest, particularly in the automotive and railway industry.[1] Because of its light weight and good formability, aluminum alloy has been tested to replace, or at least to be joined to, stiff, strong, and tough steel. However, aluminum to steel dissimilar joining remains a challenge because of the difference in their melting points [933 (660) vs 1836 K (1563 °C)], specific heats (897 vs 450 J kg−1 K−1), thermal conductivities (238 vs 75 W m−1 K−1), thermal expansion coefficients (23.8 × 10⁻⁶ vs 12.3 × 10⁻⁶ K−1), elasticity moduli (72000 vs 210000 MPa), and tensile strengths (80 vs 270 to 410 MPa) (from References 2 and 3), which causes voids, residual stresses, and distortion. The high chemical affinity of these materials[4] is another key difficulty for welding because it causes the formation of intermetallic compounds (IMCs).[2,5]
Many investigations report welding of Al to galvanized or bare steel, for instance, (1) in the liquid state through various processes, such as metal arc joining,[6,7,8,9,10,11,12,13,14] cold metal transfer,[15,16] resistance spot welding,[17,18,19,20,21,22,23,24,25] electric discharge bonding,[26] electron beam welding,[27,28] explosive welding,[29,30,31] laser welding,[1,2,3,32,33,34,35,36,37,38,39,40,41,42,43,44] laser[45,46,47,48,49] or furnace brazing,[50,51] or hybrid processes such as laser metal inert gas (MIG) welding,[52,53] laser roll welding,[42] and tungsten inert gas (TIG) welding plus brazing,[54,55] and (2) in a semi-solid state by friction stir brazing.[56,57] However, in addition to the problems of distortion and solidification defects that occur, due to the good chemical affinity of Al and Fe, these processes lead to the rapid formation of IMCs at the interface of both materials. Such precipitation is all the more favored in the liquid state (see Table IV in the appendix at the end of the paper). Even if the IMCs can ensure bonding between the base materials, their formation remains a common problem during dissimilar joining, especially if they are continuous and too thick.[58] With these features, they can deteriorate the mechanical properties of the assembly because of their brittleness.
To limit the formation of IMCs during the joining of Al to steel and to improve the joint strength, various solutions have been proposed:
-
(1)
Adjusting the process parameters to either limit the heat input at the Al/steel interface[3,36] or reduce the welding time by preheating the steel.[5,35]
-
(2)
Changing the chemical composition of the interface to either modify the nature of IMCs or reduce the diffusion kinetics. Such modifications, for instance, consist of a larger proportion of Al in a steel-pure Al laminate filler during resistance spot welding[24] or of a Si[3,5,59,60] or Zn addition in an Al filler metal.[45,60,61] The Zn addition promotes the formation of an aggregate of Fe2Al5Zn x , FeZn10, and Al-rich amorphous particles, enhancing the joint mechanical resistance.[62] The beneficial effects of a 15 wt pct Cu[59,60,63] or 0.1 wt pct Be[3] addition in liquid Al during steel aluminization have also been reported. A Zn,[56] Ni,[16] Ag,[27,64] Al, Al-Mg, Ni-Zn, Zn-Al, or Ag-Zn[3] coating on steel also hampers the interdiffusion between Fe and Al during arc welding.
-
(3)
Using solid-state welding processes. Some studies consider friction welding,[65,66,67,68] friction stir welding,[58,69,70,71,72,73,74,75,76,77,78,79,80,81,82,83,84,85,86,87,88] friction stir diffusion bonding,[89] ultrasonic welding,[90] roll bonding,[91,92,93] diffusion bonding,[64,75,94,95,96,97,98] or hybrid processes[5] such as FSW assisted by diffusion bonding,[83] by an electrical current,[99] by gas tungsten arc welding,[100] or by a laser.[101]
These solid-state welding processes require a significant heat input to ensure suitable steel plasticization or sufficient atomic mobility. However, such a condition can still entail the formation of IMCs, whose nature and distribution will depend on the process settings.[102]
Table IV illustrates some results from a non-exhaustive list of examples addressing the features of the IMCs that form during steel-Al welding in the liquid or solid state.
In addition to all of the previously cited joining processes, Table IV lists some semi-solid-state processes such as explosive welding[29,30,31] and magnetic pulse welding (MPW). MPW is an environmentally friendly and repeatable process that is particularly recommended for joining dissimilar materials. Although it is not commonly used (Table IV), magnetic pulse welding (MPW) indeed leads to rather low peak temperatures for a very short time (a few microseconds)[103,104] and thus to no significant heat-affected zone.[103,104,105] MPW is based on high-speed electromagnetic forming at room temperature. This process can be applied to tubular or planar workpieces.[103,104,106] The principle of MPW used with planar workpieces is thoroughly covered in previous works.[107,108] With regard to the Al-steel system, various joints were obtained by MPW in tubular[109,110,111,112,113,114,115,116,117,118,119] and planar[105,107,108,120,121,122,123] configurations. In the latter case, joining was supposed to consume much less energy than with tubes,[123] which should limit the formation of IMCs. Moreover, among the few studies of the interface microstructure,[105,107,108,109,111,112,113,120] only a few short investigations concern the case of planar joints[105,107,108,120,123] and none consider the MPW joining of galvanized steel with aluminum.
To fill this gap, the current paper aims to investigate the effect of a galvanized steel coating at various length scales on the microstructure of the Al-steel interface in planar magnetic pulsed welds. The influence of the consecutive change of the interface microstructure on the mechanical properties of both kinds of joints is subsequently considered.
2 Experimental Procedure
The base materials are 40-mm-wide coupons of AA1050 aluminum (90 mm long and 0.5 mm thick, hardness of 40 HV0.05) and of either industrially hot-dip galvanized or uncoated cold-rolled DP450 steel (110 mm long and 1.17 mm thick, hardness of 160 HV0.05). Their chemical compositions, supplied by the provider, are listed in Table I. Aluminum, which is the better electrical conductor, constitutes the flyer sheet, whereas steel, with a greater yield strength, is the target workpiece. An 8-mm-wide and 12-mm-long hump was deep drawn on the Al flyer sheet (Figure 1). The sheets were cleaned with acetone and stacked over a lap length of 50 mm. They were finally joined by magnetic pulse welding with a discharge energy of 10 kJ. The generator has a capacitance of 408 µF, an inductance of 100 nH, and a resistance of 14 mΩ. The Cu inductor (Figure 2) presents a 20-mm-long and 2.7-mm-thick active zone, a 44-nH inductance, and a 0.1-mΩ resistance. An insulating sheet with a thickness of 0.1 mm is inserted at the Al–inductor interface. The stand-off distance corresponds to the hump depth of 1.5 mm.

Schematics and dimensions of the hump on the flyer plate

Schematics of the Cu inductor: three-dimensional and unfolded two-dimensional views with dimensions. The thickness of the inductor active zone is 2.7 mm
The transverse cross sections of the joints were diamond polished to 1 µm and characterized by light microscopy, scanning electron microscopy, and X-ray energy dispersive spectroscopy (EDX/SEM) with the secondary electron (SE) or back-scattering electron (BSE) mode.
For the (scanning) transmission electron microscopy ((S)TEM)/EDX) and electron diffraction investigations, thin foils were prepared using the focused ionic dual beam (FIB) technique. During cutting, the thin foil edge facing the ion beam was protected by a 3.5-µm-thick deposit of platinum. A 300-pA beam intensity was applied for final thinning.
X-ray diffractometry (XRD) was performed on the transverse cross section of the weld using a Bragg-Brentano configuration and a cobalt anticathode [λCo (Kα1) = 1.78901 Å].
Vickers microhardness tests were performed under a 50 g load with a 15-second dwell time along the MPW joint in the transverse cross section.
Three to four tensile shear lap tests were finally performed on each kind of full weld along the length of the rectangular joint at a rate of 1 mm/min.
3 Results
3.1 Validation of the Process Settings
The physical parameters of MPW are the impact velocity (Vi) and angle of incidence (β). To obtain a sound weld, the first value should exceed 200 m/s, whereas the second setting that ensures the required progressive impact is an angle of incidence between 6 deg and 30 deg.[124,125,126] The controllable process parameters are the discharge energy and the coil and hump geometries and dimensions. A fully coupled 3D numerical simulation was performed using the LS-Dyna code in order to confirm the suitability of the physical parameters for welding. LS-Dyna is a dynamic code that uses a coupled FEM (finite element method)–BEM (binary element method) numerical scheme for coupling electromagnetic results with mechanical and thermal solutions.[127]
As displayed in Figure 3, the simulation model allows drawing a velocity profile at the moment of impact between the flyer (i.e., Al 1050) and the parent metal (i.e., DP450 steel). Once the required impact velocity and angle are obtained, the process parameters are experimentally validated.

Schematics of the principle of magnetic pulse welding: (a) prior to discharge and (b) at the moment of impact
The Johnson–Cook law[128] was used for the dynamic behavior of Al 1050 (Eq. [1]):
where σeq is the equivalent flow stress; A is the yield strength coefficient, equal to 25 GPa; B is the hardening modulus, equal to 25 GPa; C is a constant, equal to 8; p is the plastic strain; \( {\dot{{p}}} \) is the plastic strain rate; \( {\dot{{p}}}_{0} \) is the reference plastic strain rate, equal to 1 s−1; n and m are constants, equal to 19 and 1, respectively[128]; and
where Tm is the melting temperature, equal to 918.15 K, and T0 is the room temperature. Applying a discharge energy of 10 kJ, which corresponds to a discharge voltage of 7 kV, the peak of the sinusoidal discharge current in the simulation is 277 kA and the frequency is close to 20.65 kHz. The simulation results sufficiently agree with the measured values, which are 280 kA and 20.4 kHz, respectively. The error is thus approximately 1.1 pct.
According to the simulation, the impact occurs after approximately 9.5 µs which corresponds to the time at which the current reaches its peak value. This estimation is again verified by experiments.[129,130] The nearly 514 m/s impact velocity and the nearly 9 deg impact angle are in the range of acceptable values. In accordance with these results, a successful weld was obtained by applying this discharge energy with the present coil and hump parameters.
3.2 Base Materials
As depicted in Figure 4, the DP450 steel has a dual-phase structure composed of both equiaxed grains of ferrite with a 10 µm mean size and allotriomorphic martensite-austenite compounds (MACs), which are characteristic of thermomechanical steels.[131] The Al 1050 alloy exhibits finer and rather equiaxed grains with a size close to 1 µm in diameter.

Transverse cross section of the DP450 steel after either 2 pct nital etching (SE/SEM) (a) or Marder–Benscoter etching (b), and aluminum structure (TEM) (c, d). In micrograph b, austenite is white, ferrite is off-white, blocky martensite is black, and pearlite is black and white
The hot-dip coating of the galvanized DP450 steel comprises two layers including, from the steel surface, a 150-nm-thick inhibition layer (see Figure 13) covered by a 6- to 10-µm-thick Zn layer (Figure 5). The formation of the thin layer of FeAl3, Fe4Al13, and Fe2Al5Zn x is the rule when steel is hot-dipped in a Zn melt enriched in Al.[132]

Transverse cross section of the galvanized DP450 steel (light microscopy)
3.3 Magnetic Pulsed Joints
3.3.1 Macroscopic view of the joint
A schematic of the MPW joint, as well as its three-dimensional view, transverse section, and global top overview, is displayed in Figure 6. It is worth noting that the Al sheet is bent after magnetic pulse welding as suggested by the 3D view. In addition, both sheets are welded along an elliptical shaped ribbon with a 1 mm average width. This ribbon follows the inner border of the hump. As schematized in Figure 6, in the area encircled by the ribbon, both sheets are not bonded because of the rebound. Such a lack of joining is the rule for magnetic pulsed welds as reported in the literature.[107, 133]

Various views of the magnetic pulse joint. The white circle in the top view of the joint encircles the elliptical weld trace that corresponds to the border of the hump
3.3.2 Microstructure of the joint
3.3.2.1 Vicinity of the weld interface
Figure 7(a) shows that at the bonded interface, the steel microstructure is not modified at the mesoscopic scale by magnetic pulse welding. This result is consistent with some previous studies.[104,120] Otherwise, the Al grains are rather equiaxed with a size close to 1 µm. In addition, the steel grains contain dislocation cells close to 0.7 µm in size, whereas the Al grains are dislocation free and contain some second phases composed of 70 at. pct Al, 25 at. pct Fe, and 5 at. pct Si at first sight (Figures 7(b) and (d)). Such an uncommon chemical composition is very likely overestimated in Al due to the overly large extent of the X-ray source region. The presence of particles that are more enriched in Fe and Si is indeed the rule in raw Al 1050 alloys.[134]

Al 1050-coated DP450 steel joint: (a) Transverse cross section of the joint (BSE/SEM). The steel was etched with 2 pct nital. (b) The steel grains in close contact with the interface contain dislocations cells (TEM). (c and d) Al grains near the interface and X-ray Al-Kα (red), Fe-Kα (green), and Zn-Kα (blue) composite map (EDX/STEM) (Color figure online)
In addition, regardless of the joint, i.e., with or without the galvanized layer, the interface has the same wavy shape, which results from the pulsed waves generated during welding (Figure 8). Figure 8 further displays the variability of the transition zone width which can extend up to 2 µm in steel.

Aspect of the Al 1050-DP450 steel interface (a): BSE/SEM, (b): SE/SEM magnified view of figure (a) (Y,Z plane)
In relationship with the impact symmetry and the planar joint configuration, the slope of the waves is reversed from one side of the central unbonded zone to the opposite side.
3.3.2.2 Chemical nature of the joint interface
The X-ray diffractometry analysis of the interface shows the following:
-
(1)
For the case of the uncoated steel, the FeAl3 compound is predominantly detected together with small amounts of the Fe2Al5 and Fe4Al13 phases (Figure 9(a)).
Fig. 9 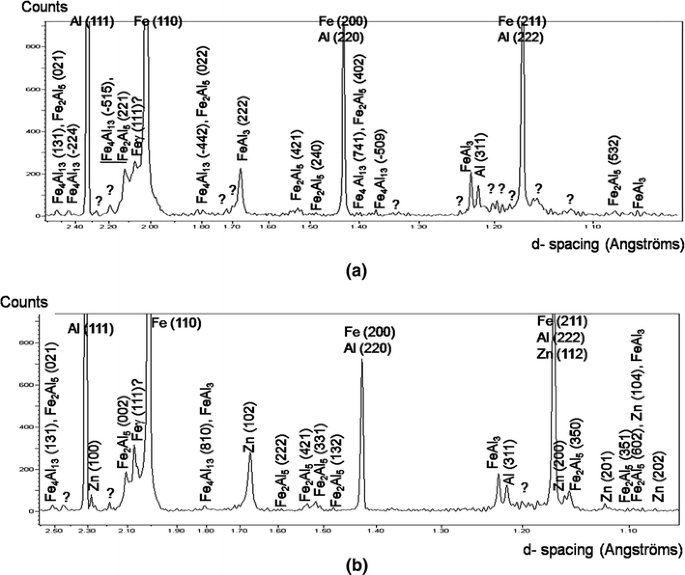
X-ray diffraction patterns of (a) the Al 1050-DP450 steel joint and (b) the Al 1050-galvanized DP450 steel joint
-
(2)
For the joint with coated steel, some pure Zn, Fe2Al5, FeAl3, and Fe4Al13 compounds are observed, which is very likely due to the presence of the inhibition layer in the galvanized layer (Figure 9(b)).

In addition, most of the small intensity peaks and those marked by question marks in Figure 9 may correspond either to cementite or to the Al x Fe y Si z compounds observed in Figure 7.
The transverse cross sections of both joints were also investigated at the finer length scale of TEM.
In the case of the Al 1050-uncoated steel weld, some discrete intermetallic compounds with a maximum thickness of approximately 2.5 µm are detected in the interfacial zone (Figure 10). In accordance with the XRD analyses (Figures 9(a) and (b)), their chemical composition determined by STEM/EDX is approximately 75 at. pct Al and 25 at. pct Fe, which corresponds to FeAl3 (Figure 11). At the interface, some harder Fe-rich convoluted lamellae are further detected within the softer Al part and inside the mixed zone (Figures 10 and 11). They are composed of grains that are nearly 100 nm in size which is approximately 100 times smaller than the grains of the base steel. These grains result either from the dynamic recrystallization of Fe during MPW or from recrystallization due to heating during thin foil preparation by FIB.

Pockets (indicated by yellow arrows) containing thick IMCs along the interface of the Al 1050-uncoated steel joint observed in the X-Y transverse section (BSE/SEM) (Color figure online)

Thin foil 1 (see its location in Fig. 10). (a) Interfacial zone of the Al 1050-uncoated steel joint in the X-Y transverse section (bright field-STEM) and combined Al-Fe X-ray map (EDX) [Al is colored in red and Fe in green]; (b) and (c): Al and Fe quantitative profiles along the lines (b) and (c) drawn in panel (a) (Color figure online)
For the Al 1050-galvanized steel weld, it is worth noting the irregular thickness of the interfacial zone (Figure 12). In addition, going from steel to aluminum, the interfacial zone is composed of an inhibition layer, a zinc layer, and an Al + Zn bi-phased layer (Figure 13). This observation agrees with the XRD results (Figure 9(b)) obtained at the mesoscopic scale. In the following, the Al + Zn bi-phased layer will be called the extra layer because, contrary to the other layers, it does not take part in the original steel coating. The flatness of the galvanized interface between steel and Zn contrasts with the unevenness of the Zn/extra layer and extra layer/Al interfaces. In addition, two types of waviness that are differentiated by both their periodicity along the joint and their amplitude of oscillation can be noted along the zinc/extra layer and extra layer/Al interfaces. According to the location along the joint, the respective thicknesses of both the zinc and the extra layer may significantly change, but their total thickness remains less than 12 µm (Figure 12). At the location of thin foil 2, an 8-µm-thick extra layer composed of equiaxed grains with a diameter between 50 and 450 nm is formed (Figure 13). This extra layer can be thinner (1 µm) (Figure 14), for instance at the constricted place marked by a white arrow in Figure 12. The Zn layer is approximately 2.3 and 7 µm thick in the first (thin foil 2) and second (thin foil 3) cases, respectively. Compared to the [6 to 10 µm] initial thickness of the Zn coating, the pure Zn layer thickness can thus be divided by a factor of 5 at places where the (Al + Zn) layer is thick.

Interfacial zone of the Al 1050-galvanized steel joint in the X-Y transverse section (BSE/SEM). In the interfacial zone, Zn is the brightest phase

Thin foil 2 (see its location in Fig. 12). (a) X-Y transverse section of the Al 1050-galvanized steel joint (bright field-STEM) and combined Al-Zn-Fe X-ray map (EDX) [Al is colored in red, Fe in green, and Zn in blue]; (b) Al, Fe, Si, and Zn quantitative profiles along the heavy white arrow drawn in panel a. The brightest green band is due to a zone that was less thinned during the preparation of the thin foil by FIB (Color figure online)

Thin foil 3 (see its location in Fig. 12). Al side of the X-Y transverse section of the interfacial zone in the Al 1050-galvanized steel joint (bright field-STEM) and Al, Fe, Si, and Zn quantitative profiles along the white arrow drawn in the micrograph
At the constricted parts of the interfacial zone (exemplified by the location of thin foil 3 in Figure 12), an additional (Al)Zn, Al-10 at. pct Zn, solid solution is observed adjacent to Al (Figure 14). The width of this layer is approximately 200 nm (Figure 14).
3.3.3 Mechanical properties of the joint
The hardness profiles across the interface and along the Y normal direction of both joints are depicted in Figure 15.

Hardness profiles along the plate thickness (Y direction) for the Al 1050-DP 450 steel and Al 1050-galvanized DP 450 steel joints
On the Al side, no softening originating from an extended heat-affected zone (HAZ) is observed, which is consistent with the absence of this zone. The latter deduction is confirmed by the invariability of the grain size and shape compared to those in the base material. The absence of an HAZ also agrees with both the high thermal conductivity of Al and the very short welding time. In the case of the joint with the coated steel, softening is observed close to the interface, which is very likely due to the presence of the Zn and (Zn + Al) layers (Figure 15).
It is worth noting that the microhardness profiles presented here are similar to other results,[118] but they differ from those of Yu et al., who noted hardening over a distance of 50 µm from the AA3003-low-carbon steel joint interface because at once of the presence of IMCs at the interface, of grain size refinement and of strain hardening on both sides of the interface.[109] In the current case of the joint formed with the uncoated steel, the lack of detection of hardening close to the interface is very likely due to the use of an important load for indentation and to an overly large measurement interspacing. Strengthening due to the presence of both hard FeAl3 IMCs and fine recrystallized grains is expected on the Al side of the interface. According to the Hall–Petch relationship, the grain size effect must be significant in aluminum as it should lead to about an approximately 30 MPa hardening compared to the one close to 85 MPa yield strength of the base material. In contrast to the previous interpretation of Yu et al.,[109] strain hardening is not efficient in the present case, as suggested by the low density of dislocations on the Al side close to the interface (Figure 7(c)).
Table II and Figure 16 present the shear lap tensile properties of both kinds of joints. According to the continuity of the load-displacement curves, there is no shift between the joining partners before reaching the peak strength. The ultimate tensile force is higher for the joint with the uncoated steel. The maximum displacement is rather low, independently of the joint type. However, the shear lap behavior of the joint with the uncoated steel is very similar to that of Al 1050-Al 1050 joints prepared with the same conditions (Table II).

Typical shear lap tensile curves of the joints
Sound, i.e., not macroscopically damaged, joints were obtained when fracture occurred by ductile tearing in the Al base material and in front of the transverse part of the joint. The latter joints are characterized by a progressive decrease of the load with displacement.
In contrast, for half of the joints with the galvanized steel, named joint 1, the load dropped rapidly after its peak, as fracture occurred in the transverse part of the weld around the C zone denoted in Figure 17. Figures 17(a) and (b) display the general character of both sides of the fracture surface. The fracture area on the galvanized steel side is essentially enriched in Zn, whereas some parts are Al-rich (Figures 17A, B, and C). The latter islands are obviously plastered in the shear direction over the Zn layer (Figure 17(D)), which indicates that they were the last zones to break during testing.

Fracture surface of joint 1: (a) galvanized steel side and (b) Al side, with A, B, and C being magnified views with corresponding combined Al-Kα (red) and Zn-Kα (blue) X-ray maps of the zones encircled in micrograph (a), and (D) a close-up of zone C
4 Discussion
4.1 Interface Waviness
During MPW, a sudden temperature increase is observed at the Al-steel interface because of the loss of kinetic energy due to impact. Heating is very likely significant because the peak temperature is expected to reach 1473 K (1200 °C) in MPW of AA6061-T6 according to thermomechanical simulations.[135] This temperature increase, combined with the high rate of deformation, leads to material softening (and even sometimes melting), which promotes the formation of a wavy joint interface.[103,106,116]
In the present case, the observation of wavy interfaces is consistent with the studies by Watanabe[136] and Aizawa[105] but differs from some previous results that report a planar interface at MPW Al-steel joints.[103] The differences in interfacial features (wave amplitude and periodicity) directly depend on numerous parameters, namely, (1) the evolution of the collision angle in the oblique configuration[107] and the magnitude of the discharge energy, both of which govern the collision velocity, (2) the flyer plate thickness,[103] and (3) instabilities in the magnetic signal during the process.
A comparison of Figures 10 and 12 shows that the waviness of the interface is more pronounced for the uncoated steel. This observation is very interesting because both kinds of welds were obtained with the same process settings. This suggests that waviness is promoted by the ease of plastic deformation of the two base materials. Indeed, Zn presents fewer slip systems than steel or aluminum.
In addition, in the case of the Al-uncoated steel joint, the waviness is further amplified by the insertion of hard Fe fragments, expelled by the spallation of the steel surface into softer Al during impact. The latter phenomenon has previously been observed in a study by Watanabe.[136]
4.2 Microstructure of the Interfacial Zone
4.2.1 Defect-free joints
It is worth noting that with the present process parameters, the microstructure of the magnetic pulsed joints is defect-free.
4.2.2 Joints without Zn
In the absence of Zn and in accordance with data from the literature,[105,120] intermetallic compounds are formed at the Al–steel interface. Some FeAl3 compounds up to 2.5 µm thick are predominantly found on the Al side of the interface as shown by XRD and TEM analyses (Figures 9(a) and 10). These IMCs are more specifically located in pockets distributed along the wavy interface and in close contact with the steel fragments that are torn and spread into the softer Al during impact. Such observations are consistent with previous works.[120,136] A close examination of the literature data, not presented here to be concise, suggests that the discontinuity of the joint microstructure seems to result from a reduced input voltage and a low discharge energy. The IMC nature is consistent with a previous work,[109] whereas other studies report the presence of discrete particles of both FeAl3 and Fe2Al5,[107] Fe4Al13 or Fe2Al5,[120] or continuous layers of Fe4Al13 and FeAl3.[109] It is worth noting that neither a glassy (Al + Fe) zone[111] nor an oversaturated (Fe)Al solid solution was observed, which is in contrast to other studies.[107,111] The observed discrepancies very likely result from differences in parameter settings. Process parameters are, however, often not reported in the literature, which makes the comparison difficult. In addition, the different natures of the steel used here compared to steel used by other authors may also explain the discrepancies in results because steels of different chemical compositions will have different material flow responses during MPW, exacerbating the variability of the microstructure.
In the current case, on the Al side of the interface, the predominant formation of FeAl3 among all the FexAly IMCs reported in the equilibrium phase diagram[4] can be questioned.
The formation of FeAl3 and Fe4Al13 generates a volume increase of 5764 pct vs 715 pct, 283 pct, and 4 pct for Fe2Al5, Fe3Al, and FeAl, respectively, with respect to the Al matrix. Accordingly, the formation of FeAl3 should not have been promoted because during MPW, the Al flyer piece is more plastically deformed than steel and compressive residual stresses are already constrained close to the interface. The formation of FeAl3 is, however, aided by its compressibility, as it presents a lower bulk modulus than Fe2Al5, i.e., 284 GPa vs 475 GPa.[137] The latter argument is nevertheless doubtful because of the plastic nature of the lattice deformation.
In addition, according to the effective heat of formation model, the first intermetallic phase to nucleate would be Fe2Al5 which possesses the most negative heat of formation at the composition corresponding to the lowest temperature of the liquidus in the Al-Fe system.[138] In contrast, the Walser-Bené model predicts that the first phase to nucleate would be FeAl3, which is the congruent phase immediately adjacent to the low-temperature eutectic phase in the Al-Fe phase diagram.[139] Another factor favorable for the preferential formation of FeAl3 is the large extent of its composition range. Indeed the extent of composition is as efficient as diffusion for the growth of phases.[140]
In addition, although the materials are not at equilibrium during MPW, the very low equilibrium solubility of Fe in Al (0.025 at. pct)[4] and the local chemical composition could also explain the preferential formation of FeAl3, which is the most Al-rich FexAly IMC on the Al side.
Finally, it is important to emphasize that some rather large IMC particles are formed in spite of the short (µs) welding time. The high kinetics of formation (some meters per second) is very likely assisted by the very high deformation rate (Table III). Two explanations are proposed. In the first hypothesis, welding proceeds in the solid state. Due to high strain rates and great pressures up to 105 MPa, Al would behave like a high velocity fluid, although it remains solid.[106,120,141] The viscous state would be induced by a high heat input and/or by a great atomic disorder due to a high density of defects generated by the high strain rate at the interface. The high density of dislocations and the high oversaturation of vacancies[142,143,144,145] produced during impact should markedly increase the diffusion of elements. The dislocation density is, for instance, estimated at 1011 dislocations per cm2 after explosion welding.[144] In the second assumption, the heating effect due to a high strain rate for a short time[135] may induce local melting followed by rapid solidification at the interface.[106,110,111,113] In this case, diffusion is exacerbated during the process, which leads to the fast formation of IMCs. However, because of the absence of clue of solidification structures, the solid-state mechanism is the most likely mechanism in the present case. This contradicts assertions in the literature in which pockets at interfaces (see Figures 8 and 10) should result from local melting.[110]
4.2.3 Joints with the galvanized steel
In the presence of the galvanized coating, except for the 150-nm-thick and continuous inhibition layer, no IMC is detected on either side of the joint interface. Instead, some pure zinc, with a thickness smaller than the primitive Zn coating, is observed together with a zone of interdiffusion.
A comparison with the 6 to 10 µm initial thickness of the Zn coating shows that, in the joint, the pure Zn layer thickness can be divided by 5 when the (Al + Zn) layer is thick (approximately 9 µm) (Figure 13). Two assumptions can be made to explain this observation.
The first assumption would be that Al diffused into Zn over a distance greater than that over which Zn migrated within Al. This explanation is indeed consistent with the different orders of magnitude of both diffusion coefficients. The diffusion coefficient of Zn in Al is 2.17 × 10⁻¹⁷, 1.57 × 10⁻¹⁵, and 3.63 × 10⁻¹⁰ cm2/s at 383 (110), 433 (160), and 688 K (415 °C), respectively,[4] whereas the diffusion coefficient of Al in Zn is equal to 3.16 × 10⁻⁹ cm2/s at 573 K (300 °C).[146] The deformation very likely further promotes the diffusion of Al in Zn since the distance covered by the elements during the process (i.e., in approximately 15 µs) is equal to a few micrometers, which is greater than the distance of 0.24 µm calculated by considering the previous diffusion coefficients measured in deformation-free samples. Only Al should diffuse in Zn since the original Zn coating thickness is very close to the total thickness of both the (Al + Zn) and Zn layers after welding.
A second explanation would be fracturing of the brittle zinc layer under the impact effect followed by filling of the empty spaces (let by the cracks) by viscous Al.
Moreover, as previously stated for the case of the Al-uncoated steel joint, the absence of clue of solidification structures suggests that joining very likely occurred in the solid state in spite of the easy melting of Zn with its low melting temperature, i.e., 419.5 °C.
4.2.4 Role and interest of zinc
Without the galvanized coating, only discrete and thin Fe x Al y IMC particles are formed, whereas the presence of Zn contributes to the formation of both a bi-phased (Al + Zn) layer and an (Al)10 at. pct Zn solid solution. The comparison of both kinds of joints proves that the presence of Zn hinders the formation of Fe x Al y IMCs at the interface. Indeed, the presence of the Fe2Al5Zn x inhibition layer on the steel hinders the diffusion of Fe and, subsequently, the formation of both Fe x Zn y and Fe x Al y IMCs.
From the mechanical point of view, the comparison between the results of the shear lap tensile tests suggests that the presence of a continuous Zn layer is more deleterious than that of discrete IMCs particles at the interface. Discrete IMC particles may not be redhibitory with regard to joint fracture.[19,56,147] Otherwise, it is worth noting the absence of the (Al + Zn) bi-phased layer over the fracture surface (Figure 17). This observation may result from both the insufficient spatial resolution of the present SEM images and/or the high plasticity of the bi-phased layer. The latter hypothesis agrees with both the submicrometer size and the chemical composition of the grains. Superplasticity was observed in Zn-22 at. pct Al alloy at room temperature and at a similar strain rate.[148]
4.2.5 Comparison of MPW with other welding processes to join Al and steel
A comparison of the current results with those summarized in Table IV proves that the nature and thickness of the IMCs formed at the Al/steel interface depend on the nature of the parent and filler materials, on the process parameter settings and, therefore, on the liquid or solid nature of the welding process. The significant sizes of most of the IMCs compiled in Table IV suggest that they were formed under sub-optimal processing conditions.
In fusion welding processes, chemical diffusion occurs easily because of the liquid state, and the process duration is sufficient to allow the formation of various types of IMCs with thicknesses up to 35 µm (Table IV). The preferential formation of Fe2Al5 (and less frequently of FeAl3) is generally noted when only Al melts.[3,16] When both steel and aluminum are in the liquid state, such as in the case of anisothermal laser welding,[39] additional Fe-rich intermetallic compounds, namely, FeAl and FeAl2, form.
In the same way, diffusion bonding at the solid state and at a high homologous temperature for the material with a lower melting point favors the generation of different kinds of IMCs all the more when the holding time is long, i.e., one to several hours (Table IV).
Regarding the semi-solid and solid processes, the formation of IMCs will depend on the thermomechanical parameters differing by several orders of magnitude. For MPW, the strain rate is 105 (106) times that for FSW (FW), the temperature is lower than in FW and FSW, and the welding time is far shorter (Table III). According to Table IV, the tendency for slightly easier formation of Fe2Al5 during FSW and FeAl3 during MPW may suggest that the kinetics of formation of FeAl3 is very rapid with a high vacancy density. This remark agrees with the easier accommodation of the very important lattice distortion due to the formation of the asymmetric monoclinic FeAl3 lattice in a disordered state rather than in a perfect crystal lattice.
5 Conclusions
The current study of planar joints using magnetic pulse welding led to the following conclusions:
-
Some defect-free Al-galvanized, or not, steel joints characterized by a wavy interface were developed by using magnetic pulse welding.
-
In the uncoated steel case, both FeAl3 particles and Fe fragments were formed on the Al side of the joint.
-
With regard to the joint with galvanized steel, two interfacial layers occurred, namely, an (Al)Zn solid solution and an (Al + Zn) bi-phased layer. The Zn layer enables to avoid the formation of Fe x Al y intermetallic particles at the Al-steel interface.
-
Despite the presence of intermetallic compounds, the joints with uncoated steel present better mechanical properties than those with galvanized steel.
References
G. Liedl, R. Bielak, J. Ivanova, N. Enzinger, G. Figner, J. Bruckner, H. Pasic, M. Pudar, S. Hampel: Phys. Procedia, 2011, vol. 12A, pp. 150-156
F. Möller, C. Thomy (2013) Handbook of laser welding technologies. In: S.Katayama (ed.). Laser welding and brazing of dissimilar materials, Woodhead publishing, Cambridge, 2013, pp. 255-279
G. Sierra: Etude métallurgique et mécanique de l’assemblage hétérogène accier/aluminium par les procédés laser et TIG, Université Montpellier 2, PhD, 2006
E.A. Brandes, G.B. Brook (1992), Smithells Metal Reference Book. Butterworth-Heinemann Ltd, Oxford
L.H. Shah, M. Ishak: Mater. Manuf. Processes, 2014, vol. 29, pp. 928-933
M.A. Miller, E.W. Mason: Weld. J. 1956, vol. 35(7), pp. 323S-328S
T. Murakami, K. Nakata, H. Tong, M. Ushio: ISIJ Int. 2003, vol. 43(10), pp. 1596-1602
H.T. Zhang, J.C. Feng, P. He, H. Hackl: Mater. Charact. 2007, vol. 58, pp. 588-592
L.A. Jacome, S. Weber, A. Leitner, E. Arenholz, J. Bruckner, H. Hackl, A. R. Pyzalla: Adv. Eng. Mater., 2009, vol. 11(5), pp. 350-358
J.L. Song, S.B. Liu, C.L. Yang, C.L. Fan: J. Alloys Compd., 2009, vol. 488(1), pp. 217-222
H. Dong, L. Yang, C. Dong, S. Kou: Mater. Sci. Eng. A, 2010, vol. 527, pp. 7151-7154
H. Zhang, J. Liu: Mater. Sci. Eng. A, 2011, vol. 528, pp. 6179-6185
H. Dong, L. Yang, C. Dong, S. Kou: Mater. Sci. Eng. A, 2012, vol. 534, pp. 424-435
Y. Su, X. Hua, Y. Wu: Mater. Sci. Eng. A, 2013, vol. 578, pp. 340-345
R. Cao, G. Yu, J.H. Chen, P.C. Wang: J. Mater. Process. Technol., 2013, vol. 213, pp. 1753-1763
L. Agudo, D. Eyidi, C.H. Schmaranzer, E. Arenholz, N. Jank, J. Bruckner, A.R. Pyzalla: J. Mater. Sci., 2007, vol. 42, pp. 4205-4214
R. Qiu, C. Iwamoto, S. Satonaka: Mater. Charact., 2009, vol. 60(2), pp. 156-159
R. Qiu, C. Iwamoto, S. Satonaka: J. Mater. Process. Technol., 2009, vol. 209, pp. 4186-4193
R. Qiu, S. Satonaka, C. Iwamoto: Mater. Des., 2009, vol. 30, pp. 3686-3689
R. Qiu, H. Shi, K. Zhang, Y. Tu, C. Iwamoto, S. Satonaka: Mater. Charact., 2010, vol. 61, pp. 684-688
W. Zhang, D. Sun, L. Han, Y. Li: Mater. Des., 2015, vol. 85, pp. 461-470
X. Sun, E.V. Stephens, M.A. Khaleel, H. Shao, M. Kimchi: Weld. J., 2004, vol 83(7), pp. 188-195
M. Yasuyama, K. Ogawa, T. Taka: Weld. Intern., 1996, vol. 10(12), pp. 965-970
H. Oikawa, T. Saito, T. Yoshimura, T. Nagase, T. Kiriyama: Weld. Intern., 1996, vol. 10(12), pp. 943-954
H. Oikawa, T. Saito: Weld. Intern. 1999, vol. 13(5), pp. 349-359
K. Matsugi, Y. Wang, T. Hatayama, O. Yanagisawa, K. Syakagohri: J. Mater. Process. Technol., 2003, vol. 135, pp. 75-82
Z.B. Gang, C.G. Qing, Z.C. Guangl, N.I.J. Qiang: Trans. Nonferrous Metals Soc. China, 2011, vol. 21, pp. 2592-2596
A. Grodzinski, J. Senkara, M. Kozlowski: J. Mater. Sci., 1996, vol. 31, pp. 4967-4973
J.H. Han, J.P. Ahn, M.C. Shin: J. Mater. Sci., 2003, vol. 38, pp. 13-18
Y. Li, H. Hashimoto, E. Sukedai, Y. Zhang, Z. Zhang (2000) J. Elect. Microscopy, 49(1), 5-16
V.R. Ryabov, L.B. Pervukhin, G.A. Volferts, V.V. Tsitsilin (1995) Paton welding J., 7(12), 690-693
G. Sierra, P. Peyre, F. Deschaux-Beaumec, D. Stuart, G. Fras (2007) Mater. Sci. Eng. A447, 197-208
N. Cavusoglu, H. Ozden (2013): Weld. J., 14, pp. 32-37
K.J. Lee, S. Kumai, T. Arai: Mater. Trans., 2005, vol. 46(8), pp. 1847-1856
H. Laukant, C. Wallmann, M. Müller, M. Korte, B. Stirn, H.G. Haldenwanger, U. Glatzel: Sci. Technol. Weld. Join., 2005, vol. 10(2), pp. 219-226
R. Borrisutthekul, T. Yachi, Y. Miyashita, Y. Mutoh: Mater. Sci. Eng. A, 2007, vol. 467, pp. 108-113
J. Yang, Y.L. Li, H. Zhang: Trans. Nonferrous Met. Soc. China, 2016, vol. 26, pp. 994-1002
S. Meco, G. Pardal, S. Ganguly, R.M. Miranda, L. Quintino, S. Williams: Intern. J. Adv. Manuf. Technol., 2012, vol. 6 https://doi.org/10.1007/s00170-012-4512-6
S. Katatyama: Weld. Int. 2004, vol. 18(8), pp. 618-625
R. Brockmann, K. Dickmann, C. radscheit, E. Schubert, G. Sepold: Weld. Cutti. 1996, vol. 3, pp. E46-E47
J. Ding, F. Li, F. Qu, P. Peyre, R. Fabbro: Chinese Optics Lett., 2005, vol. 3(1), pp. 1-4
M.J. Rathod, M. Kutsuna: Weld. J., 2004, 83, pp. 16-26
M. Kutsuna, H. Ozaki, S. Nakagawa, K. Miyamoto: in Proceedings of the 4th International congress on laser advanced materials processing, Kyoto, 2006.
Y. Miyashita, Y. Mutoh, M. Alahori, H. Okumura, I. Nakagawa, X. Jin-Quan: Weld. Intern., 2005, vol. 19(6), pp. 687-696
A. Mathieu, R. Shabadi, A. Deschamps, M. Suery, S. Matteï, D. Grevey, E. Cicala: Optics Laser Technol., 2007, vol. 39, pp. 652-661
C. Dharmendra, K.P. Rao, J. Wilden, S. Reich: Mater. Sci. Eng. A, 2011, vol. 528, pp. 1497-1503
M. Alexander, M. Simone, V. Jean-Claude: In Laser materials processing conference. Proceeding of ICA-LEO’05, Miami, 2005, pp. 985–91.
R. Shabadi, M.Suery, A. Deschamps: Met. Mater. Charact., 2013, vol. 44A, pp. 2672-2682
M.J. Zhang, G.Y. Chen, Y. Zhang, K.R. Wu: Mater. Des., 2013, vol. 45, pp. 24-30
B.Y.M. Roulin, J.W. Luster, G. Karadeniz, A. Mortensen: Weld. Res., 1999, vol. 78, pp. 151-155
L. Peng, L. Yajiang, W. Juan, G. Jishi: Mater. Res. Bull., 2003, vol. 38, pp. 1493-1499
F. Vollertsen, C. Thomy: in Proceedings ICALEO, Orlando, 2009, pp. 89–97.
G.I. Qin, Y.H. Su, S.J. Wang: Trans. Nonferrous Met. Soc. China, 2014, vol. 24, pp. 989-995
J.L. Song, S.B. Lin, C.L. Yang, G.C. Ma, H. Liu: Mater. Sci. Eng. A, 2009, vol. 509, pp. 31-40
H. Zhang, J. Liu, J. Feng: Trans. Nonferrous Met. Soc. China, 2014, vol. 24(9), pp. 2831-2838
G. Zhang, W. Su, J. Zhang, Z. Wei: Metall. Mater. Trans. A, 2011, vol. 42(9), pp. 2850-2861
C. van der Rest, P. Jacques, A. Simar: Scripta Mater., 2014, vol. 77, pp. 25-28
T. Tanaka, T. Morishige, T. Hirata: Scripta Mater., 2009, vol. 61, pp. 756-759
D.R. Andrews: British Weld. J., 1962, 79(7), pp. 650-658
G.A. Bel’Chuk: State of the art of argon-arc welding technology in joining aluminium and aluminium alloys to steel. (Naval Intelligence Support Centre. Washington, DC, 1973).
J. Vrenken, C. Goos, T. van der Veldt, W. Braunschweig: Joining in Automotive Engineering, CD-Rom, 2009.
J. Yang, Y.L. Li, H. Zhang, W. Guo, Y. Zhou: Mater. Sci. Eng. A, 2015, vol. 645, pp. 323-327
M.V. Akdeniz, A.O. Mekhrabov: Acta Mater., 1998, vol. 46 (4), pp. 1185-1192
P.D. Calderon, D.R. Walmsley, A. Munir: Weld. J., 14, 1985, pp. 104-112
S. Fukumoto, H. Tsubakino, K. Okita, M. Aritashi, T. Tomita: Mater. Sci. Technol., 1999, vol. 15, pp. 1080-1086
S. Fukumoto, H. Tsubakino, K. Okita, M. Aritoshi, T. Tomita: Mater. Sci. Technol., 1998, vol. 14, pp. 333-338
G. Kawai, K. Ogawa, H. Hochi, H. Tokisue: Weld. Intern., 2000, vol. 14(2), pp. 101-07
B.S. Yilbas, A.Z. Sahin, N. Kahraman, A.Z. Al-Garni: J. Mater. Process. Technol., 1995, vol. 49, pp. 431-443
K. Kimapong, T. Watanabe: Mater. Trans., 2005, vol. 46(4), pp. 835-841
W.H. Jiang, R. Kovacevic: J. Eng. Manuf., 2004, vol. 218, pp. 1323-1331
K. Kimapong, T. Watanabe: Weld. J., 2004, vol. 83, pp. 277-282
Y.C. Chen, T. Komazaki, Y.G. Kim, T. Tsumara, K. Nakata: Mater. Chem. Phys., 2008, vol. 111, pp. 375-380
R.S. Coelho, A. Kostka, S. Sheikhi, J. Dos Santos, A.R. Pyzalla: Adv. Eng. Mater., 2008, vol. 10, pp. 961-972
S. Bozzi, A.L. Helbert, T. Baudin, B. Criqui, J.G. Kerbiguet: Mater. Sci. Eng. A, 2010, vol. 527, pp. 4505-4509
H. Springer, A. Kostka, J.F. Dos Santos, D. Raabe: Mater. Sci. Eng. A, 2011, vol. 528, pp. 4630-4642
M. Movahedi, A.H. Kokabi, S.M.S. Reihani, H. Najafi: Procedia Eng., 2011, vol. 10, pp. 3297-3303
S. Kundu, D. Roy, R. Bhola, D. Bhattacharjee, B. Mishra, S. Chatterjee: Mater. Des., 2013, vol. 50, pp. 370-375
Y. Kusuda: Ind. Robot Int. J., 2013, vol. 40, pp. 208-212
[79] Z.W. Chen, S. Yazdanian, G. Littlefair: J. Mater. Sci., 2013, vol. 48, pp. 2624-2634
M. Ghosh, R.K. Gupta, M.M. Husain: Metall. Mater. Trans. A, 2013, vol. 45, pp. 854-863
M. Mohavedi, A.H. Kokabi, S.M.S. Reihani, W.J. Cheng, C.J. Wang: Mater. Des., 2013, vol. 44, pp. 487-492
X. Liu, S. Lan, J. Ni: Mater. Des., 2014, vol. 59, pp. 50-62
M. Haghshenas, A. Abdel-Gwad, A.M. Omran, B. Gökçe, S. Sahraemejad, A.P. Gerlich: Mater. Des., 2014, vol. 55, pp. 442-449
H. Das, R.N. Ghosh, T.K. Pal: Metall. Mater. Trans. A, 2014, vol. 45, pp. 5098-5106
H. Das, S.S. Jana, T.K. Pal, A. De: Sci. Technol. Weld. Join., 2014, vol. 19, pp. 69-75
K.K. Ramachandran, N. Murugan, S. Shashi-Kumar: Mater. Sci. Eng. A, 2015, vol. 639, pp. 219-233
C.M. Chen, R. Kovacevic: Intern. J. Mach. Tools Manuf., 2004, vol. 44, pp. 1205-1214
A. Simar, M.-N. Avettand-Fènoël: Sci. Technol. Weld. Join., 2017, vol. 5, pp. 389-403
M. Girard, B. Huneau, C. Genevois, X. Sauvage, G. Racineux: Sci. Technol. Weld. Join.. 2010, vol. 15, pp. 661-665
J. Tsujino, K. Hidai, A. Hasegawa, R. Kanai, H. Matsuura, K. Matsushima, T. Ueoka: Ultrasonics, 2002, vol. 40, pp. 371-374
M.S.A. Nehzad, A.H. Ardakani: Mater. Des., 2009, vol. 30, pp. 1103-1109
H.D. Manesh, H.S. Shahabi: J. Alloys Compnds., 2009, vol. 476, pp. 292-299
H.D. Manesh, A.K. Taheri: J. Alloys Compnds., 2003, vol. 361, pp. 138-143
P. Zhang, Y. Du, S. Xing, L. Zhang, D. Zeng, J. Cui, L. Ba: J. Mater. Sci. Technol., 2002, vol. 18(5), pp. 468-470
M.K. Karfoul, G.J. Tatlock, R.T. Murray: J. Mater. Sci., 2007, vol. 42, pp. 5692-5699
H. Springer, A. Kostka, E.J. Payton, D. Raabe, A. Kaysser-Pyzalla, G. Eggeler: Acta Mater., 2011, vol. 59, pp. 1586-1600
N. Iwamoto, M. Yoshida, S. Tabata, T. Takeuchi, M. Makino: Trans. Jap. Weld. Res. Intern., 1975, vol. 4(2), pp. 171-174
H. Shi, S. Qiao, R. Qiu, X. Zhang, H. Yu: Mater. Manuf. Process., 2012, vol. 27(12), pp. 1366-1369
J. Luo, W. Chen, G. Fu: J. Mater. Process. Technol., 2014, vol. 214, pp. 3002-3012
H. Bang, G. Jeon, I. Oh, C. Ro: Mater. Des., 2012, vol. 37, pp. 48-55
M. Merklein, A. Giera: Int. J. Mater. Forum., 2008, vol. 1, pp. 1299-1302
M.-N. Avettand-Fènoël, R. Taillard, G. Ji, D. Goran: Metall. Mater. Trans. A, 2012, vol. 43, pp. 4655-4666
A. Kapil, A. Sharma: J. Clean. Prod., 2015, vol. 100, pp. 35-38
R.M. Miranda, B. Tomas, T.G. Santos, N. Fernandes: Soldag. Insp. Sao Paulo. 2014, vol. 19(01), pp. 69-81
T. Aizawa, M. Kashani, K. Okagawa: Weld. J., 2007, vol. 86, pp. 119-124
V. Psyk, D. Risch, B.L. Kinsey, A.E. Tekkaya, M. Kleiner: J. Mater. Proc. Technol, 2011, vol. 211, pp. 787-829
A.P. Manogaran, P. Manoharan, D. Priem, S. Marya, G. Racineux: J. Mater. Process. Technol., 2014, vol. 214, pp. 1236-1244
A.P. Manogaran, P. Manoharan, D. Priem, S. Marya, G. Racineux: in 6th International Conference on High Speed Forming, 2014, pp. 89–96
H.P. Yu, Z.D. Xu, Z. Fan, Z. Zhao, C. Li: Mater. Sci. Eng. A, 2013, vol. 561, pp. 259-265
J. Li, Q. Yu, Z. Zhang, W. Xu, X. Sun: Appl. Phys. Lett., 2016, vol. 108, pp. 201606
Z. Fan, H. Yu, C. Li: Scripta Mater., 2016, vol. 110, pp. 14-18
H.P. Yu, Z.D. Xu, H.W. Jiang, Z.X. Zhao, C.F. Li: Trans. Nonferrous Met. Soc. China, 2012, vol. 22, pp. s548-s552
H. Yu, Z. Fan, C. Li: J. Mater. Proc. Technol., 2014, vol. 214, pp. 141-150
J-Y Shim, I-S. Kim, M. J. Kang, I.J. Kim, K.J. Lee, B.Y. Kang: Mater. Trans., 2011, vol. 52(5), pp. 999-1002
Z. Fan, H. Yu, C. Li: J. Mater. Process. Technol., 2016, vol. 229, pp. 230-243
A. Ben-Artzy, A. Stern, N. Frage, V. Shribman, O. Sadot: Intern. J. Impact Eng., 2010, vol. 37, pp. 397-404
A. Lorenz, J. Lueg-Althoff, G. Göbel, C. Weddeling, E. Beyer, A.E. Tekkaya: in 6th International Conference on High Speed Forming, 2014, pp. 189–98.
I. Oliveira, P. Teixeira, A. Reis: in 6th International Conference on High Speed Forming, 2014, pp. 117–26.
J. Cui, G. Sun, J. Xu, Z. Xu, X. Huang, G. Li: J. Mater. Process. Technol., 2016, vol. 227, pp. 138-146
K.-J. Lee, S. Kumai, T. Arai, T. Aizawa: Mater. Sci. Eng. A, 2007, vol. 471, pp. 95-101
M. Geyer, A. Rebensdorf, S. Böhm: in 6th International Conference on High Speed Forming, 2014, vol. 51–60.
S.D. Kore, P.P. Date, S.V. Kulkarni: J. Mater. Process. Technol., 2008, vol. 208, pp. 486-493
Y. Zhang, S.S. Babu, C. Prothe, M. Blakely, J. Kwasegroch, M. LaHa, G.S. Daehn: J. Mater. Process. Technol., 2011, vol. 211, pp. 944-952
T. Blazynski (2012), Explosive welding, forming and compaction. Springer: Dordrecht
K. Mori, N. Bay, L. Fratini, F. Micari, and A. E. Tekkaya (2013) CIRP Ann.Manuf. Technol., vol. 62(2), pp. 673–694
J. Verstraete, W. De Waele, K. Faes (2011) Sustain. Constr. Design. 2(3), 458-464
EM THEORY MANUAL Electromagnetism and Linear Algebra in LS-DYNA, 2012.
H.O.S. Eide, E.A. Melby: Blast Loaded Aluminum Plates Experiments and numerical simulation, Norwegian University of Science and Technology, 2013.
A.P. Manogaran: “Développement de procédé de soudage par point par impulsion électromagnétique-Assemblage hétérogène Al/Fe,” PhD, Ecole Centrale de Nantes, Nantes, 2013.
M. Leroy, J. Renaud: Formage électrohydraulique, Tech. l’ingénieur. Génie mécanique, 1980.
P. Deshayes, R. Taillard, C. Perdrix, E. Amoris: in 6th International Rolling Conference, Dusseldorf, VDEh, 1994, pp. 205–12.
A.R. Marder: Prog. Mater. Sci., 2000, vol. 45(3), pp. 191-271
M. Watanabe, S. Kumai, T. Aizawa: Mater. Sci. Forum, 2006, vol. 519-521, pp. 1145-1150
A. Anghelus, M.-N. Avettand-Fènoël, C. Cordier, R. Taillard : J. All. Cpnds. 2015, vol.631, pp. 209-218
T. Sapanathan, R.N. Raoelison, E. Padayodi, N. Buiron, M. Rachik: Mater. Des., 2016, vol. 102, pp. 303-312
M. Watanabe, S. Kumai, G. Hagimoto, Q. Zhang, K. Nakayama: Mater. Trans., 2009, vol. 50(6), pp. 1279-1285
P. Matysik, S. Jozwiak, T. Czujko: Mater., 2015, vol. 8, pp. 914-931
R. Pretorius, T.K. Marais, C.C. Theron: Mater. Sci. Eng., 1993, vol. 10, pp. 1-83
C.C. Theron, O.M. Ndwandwe, J.C. Lombaard, R. Pretorius: Mater. Chem. Phys., 1996, vol. 46, pp. 238-247
M. Kajihara: Acta Mater., 2004, vol. 52, pp. 1193-1200.
V. Shribman: Magnetic pulse welding for dissimilar and similar materials, in Proceedings 3rd International Conference on High Speed Forming, Dortmund, 2008, pp. 13–22.
K. Masaki, Y.S. Sato, M. Maeda, H. Kokawa: Scripta Mater., 2008, vol. 58, pp. 355-360.
M. Militzer, W.P. Sun, J.J. Jonas: Acta Metall. Mater., 1994, vol. 42, pp. 133-141.
S.H. Carpenter: Explosion welding: a review in Shock waves and high strain rate phenomena in metals. In: MA Meyers, LE Murr (eds.). Concepts and applications. Plenum press, New York, 1981, pp. 941-959
M.P. Bondar, V.M. Ogolikhin: J. Phys., 1985, vol. 46(5), pp. 379–384
S. Cui, Y. Du, L. Zhang, Y. Liu, H. Xu: Calphad, 2010, vol. 34, pp. 446-451
A. Vivek, S.R. Hansen, B.C. Liu, Glenn S. Daehn: J. Mater. Process. Technol., 2013, vol. 213, pp. 2304-2311
S.H. Xia, J. Wang, J.T. Wang J.Q. Liu: Mater. Sci. Eng. A, 2008, vol. 493(1-2), pp. 111-115
S.K. Singh, K. Chattopadhyay, G. Phanikumar, P. Dutta: Acta Mater., 2014, vol. 73, pp. 177-185
L. Fu, L.Y. Duan, S.G. Du: Weld. Res., 2003,19, pp. 65-70
R.S. Mishra, Z.Y. Ma: Mater. Sci. Eng. R, 2005, vol. 50, pp. 1-78.
R. Nandan, T. DebRoy, H.K.D.H. Bhadeshia: Prog. Mater. Sci., 2008, vol. 53, pp. 980-1023
A. Arora, Z. Zhang, A. De and T. DebRoy: Scripta Mater., 2009, vol. 61, pp. 863-866
G. Buffa, J. Hua, R. Shivpuri, L. Fratini: Mater. Sci. Eng. A, 2006, vol. 419, pp. 381-388
K.V. Jata, S.L. Semiatin: Scripta Mater., 2000, vol. 43, pp. 743-749
Ø. Frigaard, Ø. Grong, O.T. Midling: Metall. Mater. Trans. A, 2001, vol. 32, pp. 1189-1200.
A. Gerlich, G. Avramovic-Cingara, T.H. North: Metall. Mater. Trans. A, 2006, vol. 37, pp. 2773-2786.
P. Heurtier, C. Desrayaud, F. Montheillet: Mater. Sci. Forum, 2002, vol. 396-402, pp. 1537-1542.
H. Schmidt, J. Hattel: Modell. Simul. Mater. Sci. Eng. A, 2005, vol. 13, pp. 77-93
G. Buffa, J. Hua, R. Shivpuri, L. Fratini: Mater.Sci. Eng. A, 2006, vol. 419, pp. 389-396
R.S. Mishra, M.W. Murray (eds.).Friction Stir Welding and Processing, , ASM international, Novelty, 2007
T. Sapanathan, R.N. Raoelison, N. Buiron, M. Rachik: Scripta Mater., 2017, vol. 128, pp. 10-13
Author information
Authors and Affiliations
Corresponding author
Additional information
Manuscript submitted July 18, 2017
Appendix
Appendix
See Table IV in Appendix.
Rights and permissions
About this article

Cite this article
Avettand-Fènoël, M.N., Khalil, C., Taillard, R. et al. Effect of Steel Galvanization on the Microstructure and Mechanical Performances of Planar Magnetic Pulse Welds of Aluminum and Steel. Metall Mater Trans A 49, 2721–2738 (2018). https://doi.org/10.1007/s11661-018-4651-y
Received:
Published:
Issue Date:
DOI: https://doi.org/10.1007/s11661-018-4651-y