
Abstract
The effects of varying Mg and Si levels on the microstructural inhomogeneity and eutectic Mg2Si morphology in die-cast Al–Mg–Si alloys have been investigated. It was found both Mg and Si additions decreased the microstructural inhomogeneity by producing more well distribution of primary α-Al and Al–Mg2Si eutectics, but had contrary effects on eutectic Mg2Si morphology. The increasing Mg level transformed eutectic Mg2Si from rod or lamellae to curved flake with larger eutectic spacing λ, while the increasing Si level promoted the formation of rod-like or lamellar eutectic Mg2Si with smaller λ. The reason for the above evolutions can be traced back to alloys’ solidification behaviour. Thermodynamic calculation indicates that both Mg and Si decrease the liquidus temperature and suppress the precipitation of coarse primary α-Al grains (which tend to agglomerate in centre zone of samples) during the first solidification in shot sleeve, thus reducing the microstructural inhomogeneity. Mg addition shifts the eutectic point to lower Mg2Si concentration and induces a slower eutectic growth rate, causing a lower Mg2Si volume fraction in Al–Mg2Si eutectic cell. On the contrary, Si addition increased the Mg2Si volume fraction in eutectic cell by raising the Mg2Si eutectic concentration and the eutectic growth rate. To minimize the interfacial energy, Al–Mg2Si eutectics with different Mg2Si volume fractions exhibit various morphologies. The tensile test results show that both Mg and Si improved the strength at the cost of ductility. However, due to the formation of fine Al–Mg2Si eutectics, Si induced less ductility sacrifice than Mg when achieving the same strength improvement.
Introduction
The structure–property relationship is at the heart of materials science and engineering. It is widely accepted that a good structure benefits high properties of a given alloy. The materials’ structure is decided by both composition and processing method. High-pressure die casting (HPDC) is a widely used manufacturing method in the casting industry. In comparison with other casting methods, HPDC has a high cooling rate and therefore leads to fine grain microstructure and good mechanical properties. However, for the samples prepared by cold-chamber HPDC, the inhomogeneity of the as-cast microstructure is very obvious [1]. The skin zone of the casting cross section mainly contains fine grains, while the centre zone includes a large fraction of coarse grains.
It is generally thought that such a bimodal structure is due to the two-step solidification during HPDC process, which was analysed in detail by Laukli [2] and Ji [3]: (1) when the melt is poured into the cold shot sleeve, partial melt in contact with the shot sleeve is cooled below its liquidus temperature and forms coarse dendritic grains; (2) then, the remnant liquid is injected into die cavity, and the liquid starts to solidify immediately against the cavity wall under a high cooling rate (up to over 1000 Ks−1 [4]) and forms a fine-grained skin zone. At the same time, the coarse dendritic grains preformed in shot sleeve fill into the centre zone of castings in die cavity. Through a strong Hall–Petch effect, the centre zone with coarse grains has a lower strength than the skin zone, resulting in a decrease in casting’s overall strength. Therefore, decreasing the size of grains in centre zone (or the inhomogeneity) is an effective way to improve casting’s strength. It is believed that adjusting the composition can affect the microstructural inhomogeneity by changing the detailed solidification paths during HPDC two-step solidification process. On the other hand, composition adjustment also influences the amount and kind of solidified phases in a sample, inducing the change of strengthening mechanisms for alloys.
Al–Mg–Si alloys with in situ Mg2Si reinforcing particles are attractive candidate materials for aerospace, automotive and other applications. Lu [5] reported that Mg2Si has a high melting temperature of 1085 °C, low density of 1.99 × 10³ kg m−3, high hardness of 4.5 × 10⁹ Nm−2, a low thermal expansion coefficient of 7.5 × 10⁻⁶ K−1 and a reasonably high elastic modulus of 120 GPa. A series of commercial Al–Mg–Si die-cast alloys (such as 516.0 in USA, GK-AlMg5Si in Germany, YL302 in China and AMг4K1 in Russia) have been widely used in industry. In general, Al–Mg–Si die-cast alloys provide a better ductility, but a little lower strength compared with most popular Al–Si and Al–Si–Cu die-cast alloys. Recently, Ji [3] found that Al–Mg–Si alloys are also capable of providing high strength for high-pressure die castings. Up to now, the effects of compositional variation on the solidified microstructure and mechanical properties of Al–Mg–Si alloys have been the subject of many studies. For example, Yan [6] reported that Mg addition transformed eutectic Mg2Si to primary Mg2Si and significantly improved the mechanical properties of Al–Mg–Si alloys, Yang [7] reported that Ni enlarged the spacing of Al–Mg2Si eutectic phase and resulted in a slight increase in the yield strength but a significant decrease in elongation, and Ji [3, 8, 9] also reported the improving the effect of Ti, Fe and Zn on mechanical properties of Al–Mg–Si alloys. Meanwhile, the microstructural inhomogeneity of an individual HPDC Al–5Mg–1.5Si–0.6 Mn–0.2Ti alloy (all compositions quoted in this paper are in wt % unless otherwise stated) has also been reported [3]. However, it is still unclear how compositional variation affects the microstructural inhomogeneity of die-cast Al–Mg–Si alloys, although it is also an important factor to determine the overall strength of samples, especially for these components with thick wall.
To investigate the effect of compositional variation on the microstructural inhomogeneity, microstructural evolution and mechanical properties, a series of Al–Mg–Si alloys with varying major alloying element (i.e. Mg and Si) levels were prepared by cold-chamber HPDC in the present work. In our previous work, a high-strength alloy (containing 11.0 Mg and 2.9Si) [9] and a super-ductile Al–Mg–Si alloy (containing 5.0–5.5Mg and 1.5–2.0Si) [10] have been developed. It is believed that a reliable alloy with wanted ductility and strength can be achieved by further adjusting the composition between the above-mentioned Mg and Si ranges. Therefore, the composition in current work is set as 5.0–12.0Mg and 2.0–2.9Si. The morphology and size of primary α-Al and eutectic Mg2Si phases were characterized. The CALPHAD was also studied to understand the interrelationships between the composition, solidification behaviours, microstructure and mechanical properties.
Materials and methods
Commercial pure aluminium, pure magnesium and Al–50%Si ingots were used to prepare a series of Al–Mg–Si alloys. Batches of 6–10 kg were melted each time in a clay–graphite crucible using an electric resistance furnace at 730 °C. The melt was subjected to degassing, during which N2 was input into the melt by a commercial rotatory degasser at 350 rpm for 5 min. The melt was subsequently homogenized in the furnace for about 30 min. Then, a mushroom sample with Φ60 × 10 mm testing part was made by casting the melt directly into a steel mould and the casting was cut off 3 mm from the bottom before performing composition analysis. The composition was analysed using an optical mass spectroscopy, in which at least six spark analyses were carried out and the average value was taken as the chemical composition of the alloy. The tested compositions of the experimental alloys are given in Table 1.
The melt was manually released into the shot sleeve of a FRECH DAK 450–54 HPDC machine (cold chamber) to make standard ASTM tensile samples (Φ6.35 mm). The pouring temperature was controlled at 680 °C. During whole casting, the die was preheated by the circulation of mineral oil at 250 °C. All samples were at ambient condition for at least 48 h before the tensile test, which was performed using an Instron 5500 Universal Electromechanical Testing Systems at room temperature (~ 25 °C). The mechanical properties for each alloy are the average value of 10 samples without obvious casting defects. A Zeiss optical microscope (OM) and SUPRA 35VP scanning electron microscope (SEM) were used to examine the microstructure of alloys. Quantitative metallography was performed using an AxioVision 4.3 Quantimet digital image analysis system. During quantitative analysis of the microstructure, 10 different view fields were analysed for each sample and the average was taken as the measured value.
Results
Microstructures of Al–Mg–2.4Si alloys with varying Mg levels
Distribution and size of primary α-Al in Al–xMg–2.4Si alloys
Figure 1 provides an overview of the microstructure over the entire cross section of the experimental alloys which mainly contain primary α-Al grains (white phase) and Al–Mg2Si eutectic cells (grey area). Although Mg is excess to react with all Si atoms to form Mg2Si phase, no β-AlMg phase was found. It means the excess Mg atoms dissolved in α-Al matrix. In each alloy, two types of primary α-Al grains are found: the coarse dendritic or fragmented dendritic primary α-Al grains (marked as α1) and small globular primary α-Al grains (marked as α2). The distribution of these α-Al grains is very inhomogeneous. Figure 1 shows that the coarse α1 grains predominate at the centre zone, while at the skin zone, a fine primary α2 grain microstructure prevailed, although with a few scattered α1 grains. In the alloys with 9.6% and 12.3% Mg, some black primary Mg2Si particles are also observed, as shown in Fig. 1d and e. Similar to primary α-Al phase, primary Mg2Si particles also have a bimodal size and inhomogeneous distribution. Most of the relatively larger primary Mg2Si particles locate in the centre zone, while the relatively smaller primary Mg2Si particles prefer to skin and band zones. The above-mentioned microstructural inhomogeneity phenomenon is similar to previous study [2, 3]. It is decided by the two-step solidification of cold-chamber HPDC process. The α1 grains firstly solidify in cold shot sleeve and grow dendritically under the low cooling rate. During the following die-filling process, these coarse dendritic α1 grains are partially fragmented while passing the narrow ingate with high-speed turbulent flow and then segregate into the centre zone of casting due to the Stoke’s motion and Marangoni motion. At the same time, the remnant melt solidifies quickly against the die cavity wall, resulting in the formation of fine globular α2 grains in skin zone. The relatively larger primary Mg2Si particles in high-Mg alloys also firstly form in the shot sleeve and grow large crystals in the following solidification process, and most of them are pushed into the centre zone of casting, as shown in Fig. 1e3. The relatively smaller primary Mg2Si particles precipitated late in the die thus have a shorter growth time and a resulting small size.

Optical micrographs showing the microstructures of Al–xMg–2.4Si alloys at (1) skin zone, (2) band zone and (3) centre zone. a: x= 5.2, bx = 6.8. cx = 7.5, dx = 9.6 and ex = 12.3
Although the microstructural inhomogeneity exists in each alloy, it still has many differences as the alloy composition changes, as shown in Fig. 1. To investigate the effect of Mg level on microstructural inhomogeneity, the quantitative metallographic analysis was performed and the results are shown in Figs. 2 and 3. Figure 2 shows the volume fraction and average grain size of primary α-Al phase in three zones. Due to the characteristics of die-filling and two-step solidification of cold-chamber HPDC, the centre zone receives most coarse α1 grains and thus has a relatively higher volume fraction and larger average size of primary α-Al grains, compared with the skin and band zones. As Mg level increases from 5.2 to 9.6%, the volume fractions of primary α-Al phase for all three zones decrease monotonically. The average primary α-Al grain size for centre and band zones also decreases as shown in Fig. 2b. The α-Al grain size for skin zone is stable at a level of about 8 µm. So, the addition of Mg (until 9.6%) can decrease the grain size difference between three zones. What is more, Fig. 1 shows that the scattered coarse α1 grains, which exist in the skin zone of Al–5.2Mg–2.4Si and Al–6.8Mg–2.4Si alloys, disappear in the skin zone of Al–9.6Mg–2.4Si alloy, resulting in a more uniform skin zone. Therefore, from the view of average grain size and volume fraction of primary α-Al phase, it can be concluded that a high Mg level (less than 9.6%) can suppress the microstructural inhomogeneity in cold-chamber HPDC castings. However, a further increase in Mg level from 9.6 to 12.3% induces a pronounced rise of α-Al volume fraction (for all three zones) and a slight increase in α-Al grains size for centre and band zones. The increase in Mg level from 9.6 to 12.3% also increases the amount and size of primary Mg2Si (especially in surface and band zones), as shown in Fig. 1d and e. In 9.6 Mg % alloy, the primary Mg2Si particles in surface and band zones are very few and very small (Fig. 1d). In 12.3% alloy, lots of larger primary Mg2Si particles are be observed in surface and band zones (Fig. 1e). Therefore, the increasing Mg level from 9.6 to 12.3% seems to be beneficial for the homogeneous distribution of primary Mg2Si. However, considering the primary Mg2Si is a minority phase in alloys, the whole microstructure still shows a strong inhomogeneity characteristic.

a Measured volume fraction and b average primary α-Al grain size as the function of Mg levels in Al–xMg–2.4Si alloys

a Measured volume fraction of Al–Mg2Si eutectics and b calculated volume fraction of α-Al and Mg2Si phases as the function of Mg levels in Al–xMg–2.4Si alloys
Distribution and microstructure of Al–Mg2Si eutectics in Al–xMg–2.4Si alloys
Figure 3a shows the measured volume fraction of Al–Mg2Si eutectics in alloys. Contrast to the changing trend of α-Al volume fraction, the Al–Mg2Si eutectic volume fraction initially exhibits a rise with the Mg level increase from 5.2 to 9.6%, followed by a decrease when Mg level further increases to 12.3%. Al–Mg2Si eutectics are a fine mixture (Fig. 4). Because the quantitative metallographic analysis software (AxioVision) cannot distinguish the eutectic α-Al and Mg2Si phases automatically, the CALPHAD software (Pandat) was used to calculate the volume fraction of α-Al and Mg2Si phases by Scheil model. In all experimental Al–xMg–2.4Si alloys, Mg levels are in excess of the needed Mg level (4.15%) to react with 2.4%Si to form Mg2Si. However, as shown in Fig. 3b, the volume fraction of Mg2Si increases from 5.2 to 6.7 vol% as the Mg level increases from 5.0 to 12.5%. It means Mg2Si has a solid solubility in α-Al matrix, and increasing Mg level can decrease the solid solubility of Mg2Si. Another thing should be noted: although the volume fraction of Mg2Si phase still increases as Mg level increases from 9.6 to 12.3%, the Al–Mg2Si eutectic volume fraction decreases, as shown in Fig. 3a. It is because some Mg2Si phase begins to precipitate as primary Mg2Si (Fig. 1) which has very different morphology and size with eutectic Mg2Si. Therefore, such an evolution from eutectic phase to primary phase will have an important effect on alloy’s mechanical properties and will be discussed in the following.

Backscattered SEM micrographs showing the microstructures of Al–Mg2Si eutectic cell in Al–xMg–2.4Si alloys: (1) the skin zone, (2) the centre zone. ax = 5.2, bx = 6.8, cx = 7.5, dx = 9.6 and ex = 12.3
Except the distribution of Al–Mg2Si eutectic cells, eutectic Mg2Si morphology also varies and depends on the zone and component of alloys, as shown in Fig. 4. Compared with the eutectic Mg2Si in skin zone, the eutectic Mg2Si in centre zone is coarser and has a larger inter-lamellar or inter-flake spacing λ, which is the result of different cooling rates in skin and centre zones. More interesting and important is that the eutectic Mg2Si phase undergoes a remarkably morphological evolution from initial rod or lamellae to final curved flake with the increase in Mg level from 5.2 to 12.3%. Take, for example, the morphological evolution of eutectic Mg2Si in skin zone. In Al–5.2Mg–2.4Si alloy, eutectic Mg2Si is rod-like and Al–Mg2Si eutectic cell has a well definite boundary, as shown in Fig. 4a1. As the Mg level increases to 6.8% and 7.5%, Al–Mg2Si eutectic cell evolves to a coexistence of rod-like morphology in inner layer and lamellar morphology in outer layer, as shown in Fig. 4b1 and c1. The eutectic Mg2Si lamellae show a radial pattern from the inner part outward boundary of eutectic cell. With the further increase in Mg level to 9.6% and 12.3%, the rod-like eutectic Mg2Si phase disappears and lamellar one evolves to be curved flake-like eutectic Mg2Si, as shown in Fig. 4d1 and e1. Simultaneously, the eutectic spacing λ becomes obviously larger and the Al–Mg2Si eutectic cells lose definite boundary, showing a characteristic of divorced eutectic microstructure. The morphological evolution of eutectic Mg2Si in centre zone is very similar to the evolution in skin zone, but it starts from a mixture of rod-like and lamellar morphologies, rather than a single rod-like morphology, as shown in Fig. 4a2–e2.
Microstructure of Al–7.5Mg–Si alloys with varying Si levels
As the second major alloying element in Al–Mg–Si alloys, Si can improve the fluidity and provide an effective strengthening effect by forming Mg2Si phase. In the present work, a series of Al–7.5Mg–Si alloys with varying Si levels (2.0–2.8%) were investigated to reveal the effect of Si on microstructural inhomogeneity of die-cast alloys.
Distribution and size of primary α-Al in Al–7.5Mg–xSi alloys
Figure 5 shows the overview of the microstructures of Al–7.5Mg–xSi alloys. For simplicity, here only provides the microstructure comparison of the alloys with lowest and highest Si levels (2.0% and 2.8%, respectively). Similar to Al–xMg–2.4Si alloys, Al–7.5Mg–xSi alloys also only contain α-Al and Mg2Si, but no β-AlMg. Figure 5 shows that the distribution of α-Al grains is also inhomogeneous: the centre zone contains more and coarser α1 grains than the skin zone. The quantitative metallographic analysis results shown in Fig. 6 also approve it. What is more, Fig. 6a also illustrates that increasing Si level cannot obviously change the difference of α-Al volume fractions between the skin and centre zones, although it indeed decreases the volume fractions of α-Al phase in each zone. However, from the microstructure comparison of two alloys shown in Fig. 5, it can be found that the degree of microstructural inhomogeneity decreases as the Si level increases. What should be responsible for it is the decrease in average α-Al grain size and the disappearance of coarse α1 grains. As shown in Fig. 6b, although the average grain size of skin zone is approximately stable at a level of about 8 µm, the increasing Si level can the decrease average size of α-Al grains in centre and band zones. Thus, the grain size difference between three zones can be reduced by increasing Si level. What is more important is the change of coarse α1 grains. In Al–7.5Mg–2.0Si alloy, coarse α1 grains are dominant in centre zone, but also exist in skin zone occasionally, as shown in Fig. 5a. As the Si level was increased to 2.8%, the skin zone is very uniform and no longer has coarse α1 grains, and most previous coarse α1 grains in centre zone also disappear as shown in Fig. 5b. Therefore, the increasing Si level plays an effective role in suppressing the microstructural inhomogeneity in cold-chamber HPDC castings.

Optical micrographs showing the microstructures of Al–7.5Mg–xSi alloys: (1) skin zone, (2) band zone and (3) centre zone. ax = 2.0, bx = 2.8

a Measured volume fraction and b average primary α-Al grain size as the function of Si levels in Al–7.5Mg–xSi alloys
Distribution and microstructure of Al–Mg2Si eutectics in Al–7.5Mg–xSi alloys
Figure 7a shows the measured volume fraction of Al–Mg2Si eutectic cells. Contrast to the α-Al phase volume fraction, the Al–Mg2Si eutectic volume for skin zone is the highest, followed by these for band zone and centre zone. As Si level increases from 2.0 to 2.8%, the Al–Mg2Si eutectic volume for each zone is also on the rise. The volume fraction of Mg2Si phase was calculated by the Pandat (Scheil model), and the results are plotted in Fig. 7b. Obviously, the increasing Si level (from 2.0 to 2.8%) induces a linear increase in Mg2Si volume fraction (from 5.4 to 7.4 vol%).

a Measured volume fraction of Al–Mg2Si eutectic cells and b calculated volume fraction of α-Al and the Mg2Si phases as the function of Si levels in Al–7.5Mg–xSi alloys
Figure 8 shows the typical microstructures of Al–Mg2Si eutectic cell in Al–7.5Mg–xSi alloys. For simplicity, here only provides the microstructure comparison of the alloys with lowest (2.0%) and highest Si (2.8%) levels. And the Al–Mg2Si eutectic microstructure in Al–7.5Mg–2.4Si alloy is illustrated in Fig. 4c. It was also observed that the Mg2Si crystals in skin zone and centre zone have different eutectic spacing λ. This inhomogeneity is decided by the different cooling rates in skin and centre zones and cannot be eliminated. However, it can be influenced by varying the Si levels. As illustrated in Fig. 8, when the Si level was increased to 2.8%, eutectic Mg2Si becomes finer and has shorter λ. In other words, the volume fraction of Mg2Si in Al–Mg2Si eutectic cells becomes higher as Si level increases. Another notable fact is the morphological evolution of eutectic Mg2Si phase. In Al–7.5Mg–2.0Si alloy, eutectic Mg2Si exhibits an irregular lamellar or rod-like morphology in skin zone and a curved flake-like morphology in centre zone (Fig. 8a). As the Si level increases to 2.8%, Al–Mg2Si eutectic cell evolves to be a well-organized structure with rod-like Mg2Si in inner layer and lamellar Mg2Si in outer layer (Fig. 8b). What is more, the eutectic Mg2Si lamellae show a radial pattern from the boundary of inner layer (marked by white dot circle in Fig. 8b) outward the boundary of whole eutectic cell.

Backscattered SEM micrographs showing the microstructures of Al–Mg2Si eutectic cell in Al–7.5Mg–xSi alloys: (1) the skin zone, (2) the centre zone. ax = 2.0, bx = 2.8
Mechanical properties of Al–Mg–Si alloys
As discussed above, the varying Mg and Si levels induce remarkable evolutions of microstructural inhomogeneity and eutectic Mg2Si morphologies, which will have important influences on the mechanical properties. Figure 9 presents the as-cast mechanical properties of Al–xMg–Si (x= 5.2, 6.8, 7.5, 9.6 and 12.3) and Al–7.5Mg–xSi (x= 2.0, 2.2, 2.4, 2.6 and 2.8) alloys prepared by cold-chamber high-pressure die-cast. As shown in Fig. 9a, with increasing the Mg level from 5.2 to 12.3%, an expected improvement in yield strength (from 159 to 192 MPa) and a considerable decrease in elongation (from 16.9 to 4.2%) were observed. The ultimate tensile strength initially is on rise to 346 MPa when Mg level was increased to 7.5%, but has an opposite decreasing trend to 306 MPa when Mg level was further increased to 12.3%. The later decrease in ultimate tensile strength is believed to be related to the formation of primary Mg2Si, which is shown in Fig. 1d3 and e3. Figure 9b indicates that the increase in Si level (from 2.0 to 2.8%) can increase yield strength (from 162 to 171 MPa) and ultimate strength (from 327 to 348 MPa), but decrease elongation significantly (from 14.3 to 8.9%). Therefore, it can be concluded that the improvement in strength by varying Mg or Si levels is at the expense of elongation. However, it can be calculated that, in the experimental range, the cost of 1 MPa yield strength improvement is 2.60% elongation reduction by adding Mg, but is only 1.67% elongation reduction by adding Si. Therefore, to improve the strength of Al–Mg–Si alloys, it is better to increase Si level, rather than Mg level.

Effect of a Mg and b Si levels on the mechanical properties of die-cast Al–xMg–2.4Si and Al–7.5Mg–xSi alloys
Discussion
Solidification behaviour and its influence on microstructure
The experimental observations confirmed that the varying Mg and Si levels can alter the microstructural inhomogeneity and eutectic Mg2Si morphology of experimental die-cast Al–Mg–Si alloys. According to previous study [3], the microstructural inhomogeneity is induced by the characteristic two-step solidification of cold-chamber high-pressure die-cast process. It is also well accepted that the crystal morphology has a close relationship with the solidification condition. Therefore, in this section, the equilibrium phase diagrams of Al–Mg–Si system were calculated by Pandat software to understand the solidification behaviour of Al–Mg–Si alloys and its influences on microstructure.
Precipitation of primary phase in shot sleeve and microstructural inhomogeneity
The microstructural inhomogeneity is mainly decided by the distribution and size of α-Al grains formed in cold shot sleeve (i.e. α1 grains). These α1 grains often have a coarse dendritic morphology due to the low cooling rate in shot sleeve and finally were pushed into the centre zone of samples. So, if the precipitation of primary α-Al phase in shot sleeve is suppressed to some degree, α1 grains will get a smaller size and lower volume fraction, reducing the microstructural inhomogeneity degree. Laukli [2] reported that the precipitation of primary α-Al in shot sleeve is conditioned by a number of variables such as the pouring temperature of the melt and the temperature of the shot sleeve walls. However, for the given machine and operating conditions in the present work, the formation of α1 grains largely depends on the primary α-Al crystallization temperature range (TRα-Al) which is decided by the alloy composition. TRα-Al is the temperature range in which only the primary reaction L → α-Al occurs. It is below the liquidus Lα-Al (i.e. starting temperature of primary reaction L → α-Al), but higher than the starting temperature of eutectic reaction L → Mg2Si + α-Al.
Figure 10 shows the calculated equilibrium phase diagrams of Al–xMg–2.4Si and Al–7.5Mg–xSi alloys. The liquidus (Lα-Al) and primary α-Al crystallization temperature range (TRα-Al) of experimental Al–Mg–Si alloys are also listed in Table 2. It should be noted that, although the real solidification occurs under non-equilibrium conditions, the equilibrium phase diagram is still an effective tool to study the changing rule of solidification behaviours of alloys. Obviously, according to Fig. 10 and Table 2, increasing Mg or Si levels can remarkably decrease the liquidus temperature of Al–Mg–Si alloys. For example, the liquidus temperature is 620.8 °C for Al–5.22Mg–2.4Si alloy, but is only 598.7 °C for Al–9.61Mg–2.4Si alloy. Considering all the operating conditions are same for each alloy, it can be inferred that, for the alloys with a higher Mg or Si level, the nucleation of α1 grains is late and the following growth time of α1 grains in the shot sleeve is short. So, higher Mg or Si level makes these α1 grains have a smaller size and keep their initial spherical morphology, as shown in Figs. 1, 2b, 5 and 6b. On the other hand, as shown in Fig. 11, the increase in Mg or Si level also decreases the solid fraction of primary α-Al phase, resulting in the decrease in primary α-Al volume fraction (Figs. 2a and 6a) and increase in Al–Mg2Si eutectic volume fraction (Figs. 3a and 7a). Besides, according to the results of Laukli [2], at higher solid fraction, the coarse α1 grains induce a wider centre zone of casting and are therefore easy to penetrate towards the surface. So, some scattered coarse α1 grains appear in the skin zone of alloys with lower Mg or Si level, but disappear when Mg or Si level was increased, as shown in Figs. 1 and 5.
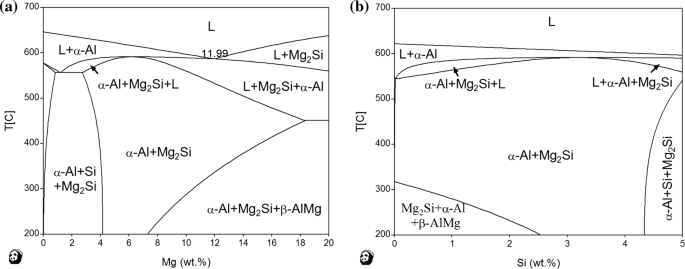
Calculated equilibrium phase diagrams of Al–Mg–Si alloys: a Al–xMg–2.4Si alloy, b Al–7.5Mg–xSi alloy

Solid fraction of primary α-Al as the function of the temperature for a Al–xMg–2.4Si and b Al–7.5Mg–xSi alloys
Another thing should be noted is that, although Al–12.3Mg–2.4Si alloy has a higher Mg level than Al–9.6Mg–2.4Si alloy, it has a higher α-Al volume fraction (Fig. 2a) but a less Al–Mg2Si eutectic volume fraction (Fig. 3a). The reason for this different changing trend is that the formation of lots of primary Mg2Si in Al–12.33Mg–2.4Si alloy decreases the amount eutectic Mg2Si phase, thus decreasing the fraction of Al–Mg2Si eutectic cell. On the other hand, primary Mg2Si seems to induce the divorced Al–Mg2Si eutectic cells and therefore can increase the fraction of separate α-Al phase. Moreover, the increasing amount of primary Mg2Si particles also makes it more possible to penetrate towards the band and skin zones, as shown in Fig. 1e.
Solidification and microstructural evolution of Al–Mg2Si eutectics
In Al–Mg2Si eutectics, the growth of faceted Mg2Si phase is often affected by crystal defects such as twins. Therefore, the resulting eutectic structure is often complex. It has been reported that the eutectic Mg2Si in as-cast Al–Mg–Si alloys have a variety of morphologies. Li [11] and Shimosaka [12] reported two typical morphologies: lamella and rod. Zhang [13, 14], Li [15] and Li [16] also reported the other typical morphology: flake. It was noticed that Li [15] also described this flake-like morphology as ‘crossed and rooftop-like’. In the present work, the widely accepted ‘flake’ was used to describe this typical morphology. Here, the difference between flake and lamellae should be mentioned to distinguish them. Lamellae only extend along one direction and are approximately parallel to each other, while flakes are not parallel to each other and one flake often alters its extending direction. However, there is no a sharp boundary between three typical morphologies; many observed morphologies are actually the mixture of typical morphologies. For example, a common morphology named as fibre [12,13,14] is the mixture of lamella and rod. Besides, depending on the detailed solidification conditions, the morphology of eutectic Mg2Si phase often deviates from the typical morphologies, exhibiting an irregular lamellar morphology or curved flake-like morphology.
Among the above-reported morphologies, the rod-like morphology is finest and thus least harmful to the ductility of alloys. So, the morphological evolution of Al–Mg2Si eutectics arouses the interest of researchers. Li [11] and Shimosaka [12] found that increasing the cooling rate could transform eutectic Mg2Si from lamellae to rod. The literatures also reported that alloying elements could induce morphological change of eutectic Mg2Si phase. Tebib [17] and Farahany [18] reported that Sr, Bi altered the eutectic Mg2Si morphology from flake-like (or described as ‘Chinese script-like’ flake-like) to fibrous. Li [16] also reported that the flake-like eutectic Mg2Si transforms into rods with the increase in Ni content. Mischmetal changed eutectic Mg2Si from a fibrous morphology to a flake-like morphology [13]. Nordin [19] also found Sb increased the irregularity of flake-like eutectic Mg2Si and resulting in an obvious divorced eutectic microstructure. However, up to now, as the main alloying elements in Al–Mg–Si alloys, Mg and Si have never been focused on. In present work, the effect of varying Mg and Si levels on eutectic Mg2Si morphology was discovered (as shown in Figs. 4 and 8), and its mechanism is revealed in this section.
The faceted/non-faceted (F/NF) eutectic systems often have very complex morphologies. It has been proved that the morphology of a given eutectic system is determined by both (1) eutectic growth rate R and (2) relative volume of eutectic phase in eutectic cells VE [20, 21]. Croker [21] summarized the relationship between R and eutectic morphologies in tens of different eutectic systems and found that the increasing R induced a morphological evolution of eutectic phase along the direction of ‘irregular → degenerate complex regular → complex regular → quasi-regular’. In other words, the increasing R can increase regularity of eutectic morphology. What is more, R also has a close relationship with eutectic spacing λ: λ2R = constant [22]. So, a higher R produces a smaller λ. It is just the reason for the fact that eutectic Mg2Si in skin zone, where has a higher cooling rate and a resulted higher R, has a smaller λ and more regular morphology in comparison with the eutectic Mg2Si in centre zone (Figs. 4 and 8).
The morphology of F/NF eutectics is also highly dependent on the relative volume of eutectic phase in eutectic cells VE. During eutectic growth, new interface was created between two solid eutectic phases. In order to minimize the interfacial energy, the eutectic phase would develop a variety of morphologies. For a given eutectic system, the total interfacial energy depends on the total interfacial area that is closely corresponding to relative volume of eutectic phase in eutectic cells. So it is considered that VE plays a major role in determining the eutectic morphology. According to the study of Croker [22], the morphological irregularity of eutectic phase will increase as its VE decrease. The VE mainly depends on eutectic point. The higher the solute concentration in melt at eutectic point is, the larger the volume fraction corresponding eutectic phase is.
To observe the parameters of Al–Mg2Si eutectic reaction, the calculated equilibrium phase diagram of Al–Mg–Si alloys was presented in the form of Al–Mg2Si pseudo-binary system, as shown in Fig. 12. Despite the existence of a narrow three-phase region (L + α-Al + Mg2Si) between 591 °C and 578 °C, the pseudo-binary Al–Mg2Si system behaves like a normal binary eutectic system with a eutectic point at 13.9% Mg2Si. In the present work, all the experimental Al–Mg–Si alloys can be considered as Al–Mg2Si alloys with different excess Mg levels. For example, Al–7.5Mg–2.0Si and Al–12.3Mg–2.4Si alloys can be expressed as Al–5.5Mg2Si–4.0Mg and Al–6.5Mg2Si–8.2Mg alloys, respectively. Figure 12 shows the pseudo-binary diagram of Al–Mg2Si with extra 0%, 4% and 8% Mg. It was found that excess Mg leads to three obvious changes: (1) the solid solubility of Mg2Si in α-Al decreases remarkable; (2) the Al–Mg2Si eutectic point moves towards lower Mg2Si concentration; and (3) Al–Mg2Si eutectic reaction temperature range (TRAl–Mg2Si), namely the temperature range of the three-phase region, becomes wider. The first change, i.e. the decrease in solid solubility of Mg2Si, can explain the fact that the addition of Mg into Al–xMg–2.4Si alloys increased the volume fraction of Mg2Si phase in alloys, as shown in Fig. 3b. The second and third changes are about Al–Mg2Si eutectic reaction and related to the eutectic Mg2Si morphology. To show the change of Al–Mg2Si eutectic reaction more clear, some characteristic eutectic reaction parameters of all experimental Al–Mg–Si alloys were calculated and are listed in Table 3.

Calculated equilibrium phase diagram of Al–Mg2Si pseudo-binary alloys with excess Mg
It was found that the eutectic point of Al–xMg–2.4Si alloys decreased remarkably from 12.61 to 6.31% Mg2Si when the Mg level increased from 5.22 to 12.33%. The Mg2Si concentration at eutectic point lays the base of volume fraction of Mg2Si phase in eutectic cell (VE). Therefore, following the change of eutectic point, VE also decreased from 16.37 vol% to 8.37%. According to the study of Croker [21], the morphological irregularity of eutectic phase will increase, giving rise to a change in eutectic Mg2Si morphology from the initial rod or lamellae to the final curved flake in 12.3 Mg alloy, as shown in Fig. 4. What is more, Table 3 shows that the Al–Mg2Si eutectic reaction temperature range TRAl–Mg2Si is enlarged dramatically to 24.4 °C (9.61% Mg) and 58.2 °C (12.33% Mg) from the initial 2.7 °C (5.22% Mg) when Mg level was increased. However, the amount (or volume fraction) of Mg2Si increased very slowly, only from 5.2 vol% (5.0% Mg) to 6.7 vol% (12.5% Mg) as the Mg level increased, as shown in Fig. 3b. The dramatically enlargement of TRAl–Mg2Si and much slowly increase in Mg2Si amount indicate a slower eutectic growth rate R of Mg2Si phase. It further increases the morphological irregularity of eutectic Mg2Si and thus promotes the above-mentioned morphological evolution from the rod or lamellae to curved flake. What is more, according to the relationship λ2R = constant, the slower eutectic growth rate R also results in a larger eutectic spacing λ (as shown in Fig. 4).
As the Si level in Al–7.5Mg–xSi alloys increases from 2.02 to 2.78%, the eutectic point increases gradually from 9.72 to 10.98% Mg2Si, and the corresponding VE also increases gradually from 12.75 to 14.33 vol%. Moreover, the Al–Mg2Si eutectic reaction temperature range TRAl–Mg2Si becomes much narrower (only 1.3 °C) from the initial 8.7 °C. This change can be also observed from the equilibrium phase diagram of ternary Al–7.5Mg–xSi alloys shown in Fig. 10b. The much narrower TRAl–Mg2Si means a much higher eutectic growth rate R, which results in the increase the VE and a smaller eutectic spacing λ (as shown in Fig. 8). Therefore, the eutectic Mg2Si morphology changes from irregular lamellae or curved flake to regular lamellae or rod, as shown in Fig. 8.
Microstructure–property relationship
The experimental results confirmed that the increase in Mg or Si levels alters the mechanical properties of Al–Mg–Si alloys. The variation in the mechanical properties is closely associated with the microstructure, which affect the strengthening mechanism in the alloys. The microstructure of die-cast Al–Mg–Si alloy consists of solute-enriched α-Al phase and Mg2Si intermetallic phase. The dissolved Mg and Si atoms in matrix provide solution strengthening to α-Al phase. Mg2Si phase can act as pins to prevent dislocations from sliding under stress, playing a secondary phase strengthening role. Moreover, the experimental results demonstrate that the increase in Mg or Si levels can suppress the microstructural inhomogeneity and decrease the average α-Al grain size, and therefore also enhance the grain boundary strengthening effect to some degree. Although the grain boundary strengthening can improve strength and elongation simultaneously, the Mg2Si intermetallics are brittle and can initialize cracks, resulting in the reduction in ductility. The addition of Mg or Si elements can increase the fraction of Mg2Si intermetallics obviously. Therefore, the improvement in yield strength and ultimate tensile strength by adding Mg or Si levels is at the cost of ductility, as shown in Fig. 9. It should be noted that primary Mg2Si appears when Mg level increases up to 9.6% and 12.3%. As reported by Li [23], primary Mg2Si crystal has polyhedron morphology with sharp edges which benefit the formation and growth of cracks. So, the ultimate tensile strength of these two alloys with 9.6% and 12.3% Mg decreases, although the yield strength still increases, as shown in Fig. 9a. It is suggested that the Mg level should be limited to prevent the formation of primary Mg2Si in order to gain a high ultimate tensile strength.
Both Mg and Si elements can strengthen experimental Al–Mg–Si alloys, but the detailed strengthening mechanisms are not same. As shown in Figs. 3b and 7b, both Mg and Si additions can increase the fraction of Mg2Si phase by combing the dissolved Si or Mg atoms in α-Al grains, thereby providing an enhanced secondary phase strengthening effect at the cost of solution strengthening effect to some degree. It was noticed that, in all experimental alloys, the Mg atoms are excess to combine Si atoms to form Mg2Si. Therefore, almost all added Si atoms can form Mg2Si phase and induce a linear increase in the volume fraction of Mg2Si phase (Fig. 7b). On the contrary, only a small part of added Mg atoms can combine with limited dissolved Si atoms in α-Al grains and induce a slower increase in the volume fraction of Mg2Si phase (Fig. 3b); most added Mg atoms still dissolved in α-Al grains and played a solution strengthening role, which induces a weaker enhancement of strength than the secondary strengthening role of precipitated Mg2Si phase. From this view, it can be concluded that Si atoms has a better strengthening effect than Mg atoms when their amounts are same. What is more important, it was found Mg or Si additions have contrary effects on Al–Mg2Si eutectic structure. The Mg addition increases the irregularity of eutectic Mg2Si morphology, resulting in a curved flake-like eutectic Mg2Si phase with large eutectic spacing λ (Fig. 8), while Si addition leads to rod-like or regular eutectic Mg2Si phase with small eutectic spacing λ, which has a better strengthening effect and is less harmful to ductility, as reported by Hosch [24]. The experimental results (Fig. 9) confirmed that Si has a better strengthening effect but a lower deleterious effect on ductility. Based on the mechanical properties of experimental alloys, it can be calculated that 1 MPa enhancement of yield strength only needs 0.089% Si addition and a 1.67% elongation sacrifice, but needs 0.215% Mg addition and a 2.60% elongation sacrifice. Therefore, it is better to increase Si level to get a good balance of strength and ductility of die-cast Al–Mg–Si alloys. Beside, adding Si can reduce the temperature range of solidification and is beneficial for HPDC which requires a narrow solidification range.
Conclusions
-
1.
The microstructural inhomogeneity of die-cast Al–Mg–Si alloys can be improved by increasing Mg or Si levels. Mg or Si addition decreases the amount of coarse primary α-Al grains agglomerating in centre zone and the average primary α-Al grain size, making the microstructure more uniform.
-
2.
Mg and Si additions have contrary effects on eutectic Mg2Si morphology. Mg increases the irregularity of eutectic Mg2Si morphology, resulting in a curved flake-like eutectic Mg2Si phase with large eutectic spacing. Si promotes regular rod-like eutectic Mg2Si with small eutectic spacing, decreasing the morphological irregularity.
-
3.
The effects of Mg and Si additions on the evolution of microstructural inhomogeneity and Mg2Si eutectic morphology can be traced back to the alloys’ solidification behaviour. Both Mg and Si decrease the liquidus temperature and thus suppress the precipitation of coarse dendritic primary α-Al grains in cold shot sleeve, reducing the microstructural inhomogeneity. The increasing Mg level shifts the eutectic point towards lower Mg2Si concentration and slower eutectic growth rate, resulting in a lower Mg2Si volume fraction in Al–Mg2Si eutectic cells. On the contrary, adding Si can shift the eutectic point to higher Mg2Si concentration and faster eutectic growth rate, thereby increasing the Mg2Si volume fraction in eutectic cells and leading to a regular and fine Al–Mg2Si eutectic cell.
-
4.
For experimental die-cast Al–Mg–Si alloys, both Mg and Si improved strength at the cost of ductility. However, the elongation cost for 1 MPa yield strength improvement is 2.60% by adding Mg, but is only 1.67% by adding Si.
References
Ji S, Yang H, Cui X, Fan Z (2017) Macro-heterogeneities in microstructures, concentrations, defects and tensile properties of die cast Al–Mg–Si alloys. Mater Sci Technol 33:2223–2233
Laukli HI, Gourlay CM, Dahle AK (2005) Migration of crystals during the filling of semi-solid castings. Metall Mater Trans A 36:805–818
Ji S, Wang Y, Watson D, Fan Z (2013) Microstructural evolution and solidification behavior of Al–Mg–Si alloy in high-pressure die casting. Metall Mater Trans A 44:3185–3197
Yu W, Liang S, Cao Y et al (2017) Interfacial heat transfer behavior at metal/die in finger-plated casting during high pressure die casting process. China Foundry 14:258–264
Lu L, Lai MO, Hoe ML (1998) Formaton of nanocrystalline Mg2Si and Mg2Si dispersion strengthened Mg–Al alloy by mechanical alloying. Nanostruct Mater 10:551–563
Yan F, Ji SX, Fan ZY (2013) Effect of excess Mg on the microstructure and mechanical properties of Al–Mg2Si high pressure die casting alloys. In: Materials Science Forum. Trans Tech Publ, pp 64–68
Yang H, Watson D, Wang Y, Ji S (2014) Effect of nickel on the microstructure and mechanical property of die-cast Al–Mg–Si–Mn alloy. J Mater Sci 49:8412–8422. https://doi.org/10.1007/s10853-014-8551-2
Ji S, Yang W, Gao F et al (2013) Effect of iron on the microstructure and mechanical property of Al–Mg–Si–Mn and Al–Mg–Si diecast alloys. Mater Sci Eng, A 564:130–139
Ji S, Yan F, Fan Z (2015) Development of a high strength Al–Mg2Si–Mg–Zn based alloy for high pressure die casting. Mater Sci Eng, A 626:165–174
Ji S, Watson D, Fan Z et al (2012) Development of a super ductile diecast Al–Mg–Si alloy. Mater Sci Eng, A 556:824–833
Li S, Zhao S, Pan M et al (1997) Solidification and structural characteristics of α (Al)–Mg2Si eutectic. Mater Trans, JIM 38:553–559
Shimosaka D, Kumai S, Casarotto F, Watanabe S (2011) Effect of cooling rates during solidification of Al–5.5%Mg–2.3%Si–0.6%Mn and Al–13%Mg2Si pseudo-binary alloys on their secondary-particle morphology and tear toughness. Mater Trans 52:920–927
Zhang J, Fan Z, Wang YQ, Zhou BL (2000) Microstructural development of Al–15wt.% Mg2Si in situ composite with mischmetal addition. Mater Sci Eng, A 281:104–112
Zhang J, Fan Z, Wang YQ, Zhou BL (2001) Equilibrium pseudobinary Al–Mg2Si phase diagram. Mater Sci Technol 17:494–496
Li SP, Zhao SX, Pan MX et al (2001) Eutectic reaction and microstructural characteristics of Al(Li)–Mg2Si alloys. J Mater Sci 36:1569–1575. https://doi.org/10.1023/A:1017525520066
Li C, Wu Y, Li H et al (2010) Effect of Ni on eutectic structural evolution in hypereutectic Al–Mg2Si cast alloys. Mater Sci Eng, A 528:573–577
Tebib M, Samuel AM, Ajersch F, Chen XG (2014) Effect of P and Sr additions on the microstructure of hypereutectic Al–15Si–14Mg–4Cu alloy. Mater Charact 89:112–123
Farahany S, Ghandvar H, Nordin NA et al (2016) Effect of primary and eutectic Mg2Si crystal modifications on the mechanical properties and sliding wear behaviour of an Al–20Mg2Si–2Cu–xBi composite. J Mater Sci Technol 32:1083–1097
Nordin NA, Farahany S, Ourdjini A et al (2013) Refinement of Mg2Si reinforcement in a commercial Al–20%Mg2Si in situ composite with bismuth, antimony and strontium. Mater Charact 86:97–107
Hanqi H (2000) Solidification theory of metals, 2nd edn. China Machine Press, Beijing
Croker MN, Fidler RS, Smith RW (1973) The characterization of eutectic structures. Proc R Soc Lond A 335:15–37
Flemings MC (1974) Solidification processing. Metall Trans 5:2121–2134
Li C, Wu YY, Li H, Liu XF (2011) Morphological evolution and growth mechanism of primary Mg2Si phase in Al–Mg2Si alloys. Acta Mater 59:1058–1067
Hosch T, Napolitano RE (2010) The effect of the flake to fiber transition in silicon morphology on the tensile properties of Al–Si eutectic alloys. Mater Sci Eng, A 528:226–232
Author information
Authors and Affiliations
Corresponding author
Ethics declarations
Conflict of interest
The authors declare that they have no conflict of interest.
Rights and permissions
Open Access This article is distributed under the terms of the Creative Commons Attribution 4.0 International License (http://creativecommons.org/licenses/by/4.0/), which permits unrestricted use, distribution, and reproduction in any medium, provided you give appropriate credit to the original author(s) and the source, provide a link to the Creative Commons license, and indicate if changes were made.
About this article

Cite this article
Zhu, X., Yang, H., Dong, X. et al. The effects of varying Mg and Si levels on the microstructural inhomogeneity and eutectic Mg2Si morphology in die-cast Al–Mg–Si alloys. J Mater Sci 54, 5773–5787 (2019). https://doi.org/10.1007/s10853-018-03198-6
Received:
Accepted:
Published:
Issue Date:
DOI: https://doi.org/10.1007/s10853-018-03198-6