
Abstract
The growing number of available data graphs in the form of RDF Linked Data enables the development of semantic exploration applications in many domains. Often, the users are not domain experts and are therefore unaware of the complex knowledge structures represented in the data graphs they interact with. This hinders users’ experience and effectiveness. Our research concerns intelligent support to facilitate the exploration of data graphs by users who are not domain experts. We propose a new navigation support approach underpinned by the subsumption theory of meaningful learning, which postulates that new concepts are grasped by starting from familiar concepts which serve as knowledge anchors from where links to new knowledge are made. Our earlier work has developed several metrics and the corresponding algorithms for identifying knowledge anchors in data graphs. In this paper, we assess the performance of these algorithms by considering the user perspective and application context. The paper address the challenge of aligning basic level objects that represent familiar concepts in human cognitive structures with automatically derived knowledge anchors in data graphs. We present a systematic approach that adapts experimental methods from Cognitive Science to derive basic level objects underpinned by a data graph. This is used to evaluate knowledge anchors in data graphs in two application domains - semantic browsing (Music) and semantic search (Careers). The evaluation validates the algorithms, which enables their adoption over different domains and application contexts.
You have full access to this open access chapter, Download conference paper PDF
Keywords
1 Introduction
With the recent growth of linked data graphs, a plethora of interlinked domain entities is available for users’ exploratory search tasks, such as learning and topic investigation [1]. Gradually, data graphs are also being exposed to users in different Semantic Web applications, taking advantage of the exploration of the rich knowledge encoded in the graphs. Among the applications for supporting user exploration, the two closest to the context of this paper are semantic data browsers [2,3,4] and semantic search systems [5, 6]. A broad range of users interact with such applications. Often, the users are not domain experts and struggle to formulate queries that represent their needs. Furthermore, the users are usually exposed to an overwhelming amount of unfamiliar options for exploration of the data graph, which can lead to confusion, high cognitive load, frustration and a feeling of being lost. This hinders the users’ exploration experience and effectiveness. A way to overcome these challenges is to suggest ‘good’ trajectories through the graph which can bring some utility to the users (e.g. increase effectiveness, improve motivation, or expand knowledge). Our work focuses on knowledge utility – expanding one’s domain knowledge while exploring the graph.
Lay users, who are not experts in the corresponding domain, are unaware of the underlying complex knowledge structures encoded in a data graph [1, 7]. In other words, the users’ cognitive structures about the domain may not match the semantic structure of the data graph. To address this challenge, we propose a novel approach to support graph exploration that can expand a users’ domain knowledge. Our approach is underpinned by the subsumption theory for meaningful learning [8]. It postulates that a human cognitive structure is hierarchically organized in terms of highly inclusive concepts which can be used as anchors to introduce new knowledge [8]. A core algorithmic component for adopting subsumption theory for generating ‘good’ trajectories is the automatic identification of knowledge anchors in a data graph (KA DG), i.e. entities that refer to anchoring concepts in human cognitive structures.
Our earlier research has developed several metrics and corresponding algorithms for identifying KA DG, which are presented in detail in [9]. To utilize the KA DG metrics in applications for data graph exploration, a systematic evaluation approach that examines the performance of the metrics is needed. Such an approach is presented in this paper. As the KA DG should align with anchoring concepts in human cognitive structures, we develop an original way to derive such familiar concepts in a domain that corresponds to a data graph and considers the domain coverage of the graph. We adapt Cognitive Science experimental approaches of free-naming tasks to identify basic level objects (BLO) in human cognitive structures, i.e. domain concepts that are highly familiar and inclusive, so that people are able to recognize them quickly [10].
The evaluation approach presented in this paper contributes to developing usable semantic data graph exploration applications by providing:
-
formal description of an algorithm for identifying basic level objects which correspond to human cognitive structures over a data graph;
-
implementation of the BLO algorithm and utilization to evaluate KA DG metrics over two application contexts for data graph exploration - semantic browsing (in musical instrument domain) and semantic search (in Career domain); and
-
analysis of the performance of KA DG metrics, including hybridization heuristics, using the benchmarking sets of BLO identified by humans.
The rest of the paper is structured as follows. Section 2 positions the work in the relevant literature and points at the main contribution. Section 3 briefly outlines the KA DG metrics, summarizing [9]. An algorithm for identifying a benchmarking set of BLO is presented in Sect. 4. Sections 5 and 6 describe experimental studies where we apply the algorithm for identifying BLO using data graphs of two semantic exploration applications – music browser (MusicPinta) and career guidance (L4All). The BLO are used to evaluate the derived KA DG . Section 7 discusses the evaluation findings, points at generality and applicability of the algorithms, and concludes the paper.
2 Related Work
Recent research on data exploration over the semantic Web examines different approaches to reduce users’ cognitive load, especially when the users are exposed to complex domains which they are not familiar with. This has brought together research from Semantic Web, personalization, and HCI to shape user-oriented application for data exploration [1, 3, 6]. Personalized exploration based on user interests has been presented in [11]. A web-based graph visualization approach was used in [12] to help domain experts with analysis tasks. A co-clustering approach that organizes semantic links and entity classes was presented in [13] to support iterative navigation of entities over RDF data. The notion of relevance based on the relative cardinality and the in/out degree centrality of a graph node has been used to produce graph summaries [14]. Our work brings a new dimension to this research effort by looking at the knowledge utility of the exploration, i.e. providing ways to expand the user’s awareness of the domain. This is crucial for the usability of semantic exploration applications, especially when the users are not domain experts.
Our approach is based on identifying knowledge anchors in data graphs. Relevant work on finding key concepts in a data graph was developed by research on ontology summarization [15] and formal concept analysis [16]. Ontology summarization aims at helping ontology engineers to make sense of an ontology in order to reuse and build new ontologies [17]. The closest ontology summarization approach to this paper’s context is [18], which highlighted the value of cognitive natural categories for identifying key concepts. The work in [19] has formalized the main psychological approaches for identifying basic level concepts in formal concept analysis. In [9] we have operationalized these approaches, allowing automatic identification of KA DG .
According to [17], there are two main approaches for evaluating a user-driven ontology summary: gold standard evaluation, where the quality of the summary is expressed by its similarity to a manually built ontology by domain experts, or corpus coverage evaluation, in which the quality of the ontology is represented by its appropriateness to cover the topic of a corpus. The evaluation approach used in [18] included identifying a gold standard by asking ontology engineers to select a number of concepts they considered the most representative for summarizing an ontology. To the best of our knowledge, there are no approaches that consider key concepts in data graphs which correspond to cognitive structures of lay users who are not domain experts. We identify such concepts in data graphs including both an automatic method to derive KA DG and an experimental method to derive BLO that correspond to human cognitive structures. We evaluate KA DG against benchmarking sets of BLO over the data graphs of two semantic exploration applications – browsing (Music) and search (Careers). By providing a systematic evaluation approach, the paper facilitates the adoption of the KA DG metrics, and the corresponding hybridization methods, to enhance the usability of semantic web applications that offer user exploration of data graphs.
3 Identifying Knowledge Anchors in Data Graphs
A Data Graph \( DG \) describes entities (vertices) and attributes (edges), represented as Resource Description Framework (RDF) statements. Each statement is a triple of the form <Subject, Predicate, Object> [20]. Formally, a data graph is as a labeled directed graph \( DG = \langle V,E,T\rangle \), depicting a set of RDF triples where:
-
\( V = \{ v_{1} ,v_{2} , \ldots ,v_{n} \} \) is a finite set of entities;
-
\( E = \{ e_{1} ,e_{2} , \ldots ,e_{m} \} \) is a finite set of edge labels;
-
\( T = \{ t_{1} ,t_{2} , \ldots ,t_{k} \} \) is a finite set of triples where each \( t_{i} \) is a proposition in the form of a triple \( \left\langle {v_{s} ,e_{i} ,v_{o} } \right\rangle \) with \( v_{s} ,v_{o} \in V \), where \( v_{s} \) is the Subject (source entity) and \( v_{o} \) is the Object (target entity); and \( e_{i} \in E \) is the Predicate (relationship type).
The set of entities \( V \) is divided further by using the subsumption relationship rdfs:subClassOf (denoted as \( \subseteq \)) and following its transitivity inference. This includes category entities (\( C\,\subseteq\,V \) which is the set of all entities that have at least one subclass, at least one superclass, and at least one instance) and leaf entities (\( L \,\subseteq\, V \) which is the set of entities that have no subclasses).
The set of edge types \( E \) is divided further considering two relationship categories: hierarchical relationships (\( H \): is a set of subsumption relationships between the Subject and Object entities in the corresponding triples) and domain-specific relationships (\( D \): represent relevant links in the domain, other than hierarchical links, e.g. in a Music domain, instruments used in the same performance are related).
Our work in [9] has formally adopted the Cognitive science notion of basic level objects [10], to describe two groups of metrics and their corresponding algorithms for identifying knowledge anchors in data graphs (KA DG).
Distinctiveness metrics.
These are adapted from the formal definition of cue validity, to identify the most differentiated categories whose attributes are associated exclusively with the category members but are not associated to the members of other categories. For example, in Fig. 1, the AV value for entity v 2 is the aggregation of the AV values of entities (e 3, e 4, e 5) linked to members of v 2 (v 21, v 22, v 23, v 24) using the domain-specific relationship D. The AV value for e 3 equals the number triples between e 3 (Source vertex) and the members of v 2 (Target vertices v 21, v 22) via relationship D (2 triples), divided by the number of triples between e 3 (Source vertex) and all entities in the graph (Target vertices v 12, v 21, v 22) via relationship D (3 triples).

A data graph showing entities and relationship types between entities.
Distinctiveness metrics include:
-
Attribute Validity (AV) – represents the proportion of relationships involving the category’s members.
-
Category Attribute Collocation (CAC) – uses frequency of an attribute within the category’s members; gives preference to categories with many attributes shared by members.
-
Category Utility (CU) - considers whether a category has many attributes shared by its members, and at the same time has attributes not related to many other categories.
Homogeneity Metrics.
These metrics aim to identify categories whose members share many entities among each other. In this work, we have utilized three set-based similarity metrics [9]: Common Neighbors (CN), Jaccard (Jac), and Cosine (Cos). For example (see Fig. 1), consider the entity v 2 and the hierarchical relationship rdf:type and the domain-specific relationship D . Entity v 2 has three entities (e 3, e 4, e 5) linked to its members (v21, v 22, v 23, v 24), with two entities (e 3, e 5) shared among the four members through the hierarchical relationship rdf:type and relationship D, whereas the entity v 1 has no entities shared by similar relationship types with its members (v11, v 12). This indicates that entity v 2 is more homogenous than v 1.
4 Identifying Basic Level Objects Over Data Graphs
The notion of basic level objects was introduced in Cognitive Science research, illustrating that domains of concrete objects include familiar categories that exist at a highly inclusive level of abstraction in humans’ cognitive structures, more than categories at the superordinate level (i.e. above the basic level) or the subordinate level (i.e. below the basic level) [10, 21]. An example from [10] of a BLO is Guitar - most people are likely to recognize objects that belong to the category Guitar (basic level). However, users who are not experts in the music domain are unlikely to be able to recognize the category Folk Guitar (subordinate level) and name it with its exact name; instead, users may consider such objects equivalent to Guitar (closest basic level) rather than Musical Instrument (superordinate level).
4.1 Cognitive Science Experimental Approaches for Deriving BLO
While studying the notion of basic level objects, Rosch et al. [10] conducted several experiments comprising free-naming tasks testing the hypothesis that object names at the basic level should be the names by which objects are most generally designated by adults. In a free-naming task, objects in a taxonomy are shown to a participant as a series of images in fixed portions of times, and the participant is asked to identify the names of the objects shown in the images as quickly as possible. Three types of packets of images were shown to the participants: those in which one picture from each superordinate category appeared; one in which one image from each basic level category appeared; and one in which all images appeared. The participants overwhelmingly used names at the basic level while naming objects in the images [10].
To identify BLO, accuracy and frequency were considered. Accuracy considers whether a participant provides an accurate name for the object in the taxonomy, while frequency indicates how many times an object was named correctly by different participants. In the example of Guitar , when participants were shown members of Guitar (e.g. Folk Guitar , Classical Guitar ) in a packet, they named them with their parent Guitar at the basic level more frequently than with names at the superordinate level (e.g. Musical instrument ) or with their exact names (e.g. Folk Guitar , Classical Guitar ) at the subordinate level.
The selection of object names used in the free-naming tasks in [10] was based on the population of categories of concrete nouns in common use in English. Every noun with a word frequency of 10 or greater from a sample of written English [22] was selected as a basic level object. A superordinate category was considered in common use if at least four of its members met this criterion.
However, the Cognitive Science approach for selecting BLO cannot be applied directly in the context of a data graph. The principal difference is that we need to constrain the human cognitive structures upon the data graph, as opposed to using a bag of words from popular dictionaries. This is because a data graph presents a lesser number of concepts from a domain, which belong to the graph scope, and there can be concepts that have been omitted. Moreover, the Cognitive Science studies included concrete domains where images of the objects could be shown to participants. Many semantic web applications utilize data graphs which include more abstract concepts for which images cannot be reliably shown to users (e.g. medical illnesses, environmental concepts, professions). Therefore, we adapt the Cognitive science experimental approach for deriving BLO to take into account the domain coverage of a data graph, which is applicable to any domain presented with a data graph.
4.2 Algorithm for Identifying BLO Over Data Graphs
Following Cognitive Science experimental studies outlined above, we present two strategies with the corresponding algorithm for identifying BLO in a data graph.
-
Strategy 1. Takes into account whether a leaf entity \( v \in L \) that has no subclasses is presented to a user and named with its parents (i.e. superclasses).
-
Strategy 2. Takes into account whether a category entity \( v \in C \) that has one or more subclasses is presented and named with its exact name, or with the name of a parent that is a superclass or a category member (i.e. subclass that is not a leaf entity).
Algorithm 1 describes the two strategies for identifying BLO using accuracy and frequency. Accuracy refers to naming an entity correctly. It considers whether a user names an entity with its exact name, or with a parent (superclass) or with a category member (subclass) of the entity. Frequency indicates how many times a particular category was accurately identified by different participants.
The algorithm takes a data graph as input and returns two sets of BLO. For any class entity \( v\, \subseteq\, V \), we identify the number of users to be asked to name the entity (line 2). For Strategy 1 (lines 3–7), we consider accurate naming of a category entity (a parent) when a leaf entity \( v \in L \) that is a member of this category is seen. For Strategy 2 (lines 8–14), we consider naming a category entity \( v \in C \) with its exact name (lines 10, 11) or a name of its superclasses (parents) or subclasses (members) (lines 12–13). In each strategy, we use a representation function \( show(r,v) \) to create a representation of an entity \( v \) to be shown to the user. The representation of a leaf entity \( v \in L \) (in Strategy 1) will consider the leaf itself (e.g. show a single label or a single image for the leaf entity), while the representation of a category entity \( v \in C \) (in Strategy 2) will consider all (or some) of the category leaves (e.g. showing a random listing of a set of labels of entity leaves or showing a group of images of leaves as a collage).

For an entity \( v \), the following SPARQL query is used to get the set of entity leaves:

The two strategies in Algorithm 1 for obtaining BLO are applied as follows:
Strategy 1, when a user is shown a representation of a leaf entity \( v \in L \) (line 4), the following steps are conducted:
-
The function \( answer(a,v) \) assigns a user’s answer \( a \) to the leaf entity \( v \).
-
The function \( parent(p,v) \) returns a set of labels (i.e. names) of the parent(s) \( p \) of the leaf entity \( v \) via the following SPARQL query:

-
The algorithm in (line 5) checks if the user named the leaf entity \( v \) with one of its parents. If an accurate name of a parent was provided, then the frequency of the parent entity will be increased by one (line 6).

Strategy 2, when a user is shown a representation of a category entity \( v \in C \) (line 9), the following steps are conducted:
-
The function \( answer(a,v) \) assigns a user’s answer \( a \) to the category entity \( v \).
-
The function \( parent(p,v) \) returns a set of labels of parent(s) \( p \) of the category entity \( v \) via SPARQL queries similar to Strategy 1 above.
-
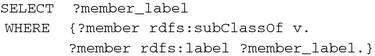
The function \( member(m,v) \) returns a set of labels (i.e. names) of member(s)\( m \) of the category entity \( v \) via the following SPARQL query:
-
The function \( label(b,v) \) returns the label (i.e. name) of the category entity \( v \) via the following SPARQL query:

-
The algorithm in (lines 10, 12) checks if the user named the category entity \( v \) with its exact name, or a name of its parents or its members. If there was accurate naming of the category, a parent or a member, the frequency of the category name (line 11), the parent name or the member name (line 13) will be increased by one.


4.3 Application Contexts Used for Experimental Evaluation
Linked Data graphs represented as a set of RDF triples can be ideal structures for Semantic exploration applications [23]. One class of applications is semantic data browsers which operate on semantically tagged content and present browsing trajectories using relationships in the underpinning ontologies [1, 2], supporting uncertain or complex information needs [3]. They enable the users to initiate a data exploration session from a single entry point in the graph and move through entities by following RDF links [2]. Another class of widely used semantic Web applications are semantic data search engines [24]. Such applications allow the users to enter search queries though keyword-based search interfaces and provide the users with a list of search results obtained by using semantic queries automatically generated by the system [6].
In this paper, we present experimental studies over two different application domains for evaluating KA DG metrics against BLO. The first study is in the context of a semantic data browser in the Music domain, called MusicPinta [2]. MusicPinta enables users to navigate through musical instruments extracted from DBpedia, and get information about these instruments together with musical performances and artists using these instruments. MusicPinta provides context for studying BLO in a concrete domain, as users can see images of musical instruments (as in [10, 25]). The second study is in the context of a semantic search engine in Career guidance, called L4All [26]. L4All is a proprietary semantic search application which enables learners to explore various career options to plan their career progression [26]. L4All provides context for studying basic level objects in an abstract domain, where the users cannot be shown concrete representations of the graph entities.
The data graphs of the two applications are used for the evaluation studies.
MusicPinta.
The dataset includes several open sources. DBpediaFootnote 1 for musical instruments and artists - this dataset is extracted from dbpedia.org/sparql using CONSTRUCT and made available as open source at the sourceforgeFootnote 2. DBTuneFootnote 3 for music-related structured data - this dataset is made available by the DBTune.org in linked data fashion. Among the datasets on DBTune.org we utilize: (i) Jamendo - a large repository of Creative Commons licensed music; (ii) Megatune - an independent music label; and (iii) MusicBrainz - a community-maintained open source encyclopaedia of music information. All datasets are available as RDF datasets and the Music ontologyFootnote 4 is used as a schema to interlink them. For the experimental study, we use the top level class Music Instrument and all its entities (classes and instances).
L4All.
The dataset is drawn from the “LifeLong Learning in London for All” (L4All) project [26], bringing together experts from lifelong learning and careers guidance, content providers, and groups of students and tutors. It provided lifelong learners with access to information and resources that would support them in exploring learning and career opportunities and in planning and reflecting on their learning. The L4All dataset uses the ontology developed by the L4All project, and users’ data collected during the project (anonymised for privacy). Among five class hierarchies in the L4All ontology, the Occupation and Subject class hierarchies have the richest class representation and depth (see Table 1).
5 MusicPinta: Evaluating KA DG Against BLO
As a use case in a representative domain for evaluating knowledge anchors over a data graph, we used a typical semantic data browser, MusicPinta, which was developed in our earlier research [2]. Knowledge anchors would lead to extending MusicPinta to suggest exploration paths that can improve the user’s domain knowledge.
5.1 Obtaining BLO
To enable impartial comparison of the outputs of the KA DG algorithms and BLO, we conducted a user study in the Musical Instrument domain following Algorithm 1.
Participants.
40 participants, university students and professionals, age 18–55, recruited on a voluntary basis. None of them had expertise in Music.
Method.
The participants were asked to freely name objects that were shown in image stimuli, under limited response time (10 s). Overall, 364 taxonomical musical instruments were extracted from the MusicPinta dataset by running SPARQL queries over the MusicPinta triple store to get all musical instrument concepts linked via the rdfs:subClassOf relationship. The entities included: leaf entities (total 256) and category entities (total 108). Applying the two strategies in Algorithm 1, for each leaf entity, a representative image was collected from the Musical Instrument Museums Online (MIMO)Footnote 5 to ensure that pictures of high quality were shownFootnote 6. For a category entity, all leaves from that category entity were shown as a group in a single image (similarly to a packet of images in [10]). Ten online surveysFootnote 7 were run: (i) leaf entities: eight surveys presented 256 leaf entities, each showed 32 leaves; (ii) category entities: two surveys presented 108 category entities, each showed 54 categories.
Free-naming task.
Each image was shown for 10 s on the participant’s screen. She was asked to type the name of the given object (for leaf entities) or the category of objects (for category entities). The image allocation in the surveys was random. Every survey had four respondents from the study participants (corresponds to line 2 in Algorithm 1). Each participant was allocated only to one survey (either leaf entities or category entities). Figures 2, 3 and 4 show example instrument images and participant answers (Fig. 2 from Strategy 1, and Figs. 3, 4 from Strategy 2).

An image of Piccolo trumpet (a leaf in the data graph) was shown to a user, who named it as “Trumpet”

An image of Trumpet (a Category concept in the data graph with two subclasses) was shown to a user, who named it as “Trumpet”.

An image of Brass (Category concept in the data graph) shown to a user, who named it as “Trumpet”.
Applying Algorithm 1 over the MusicPinta dataset, two sets of BLO were identified. Set1 (Strategy 1) was derived from presenting leaf entities. We consider accurate naming of a category entity (parent) when a leaf entity that belongs to this category is seen. For example (see Fig. 2), a participant was shown the image of Piccolo trumpet , a leaf entity in the data graph, and named it with its parent category Trumpet . This will be counted as an accurate naming and will increase the count for Trumpet . The overall count for Trumpet will include all cases when participants named Trumpet while seeing any of its leaf members. Set2 (Strategy 2) was derived from presenting category entities. We consider naming a category entity with its exact name or a name of its parent or subclass member. For example (see Fig. 3), a participant was shown the image of category Trumpet and named it with its exact name. This will increase the count for Trumpet . In Fig. 4, a participant saw the category Brass and named it as its member category Trumpet .
In each of the two sets, entities with frequency equal or above two (i.e. named by at least two different users) were identified as potential BLO. The union of Set1 and Set2 gives BLO. It includes musical instruments such as: Bouzouki , Guitar and Saxophone . The BLO obtained from MusicPinta are available hereFootnote 8.
5.2 Evaluating KA DG Against BLO
Quantitative Analysis.
We used the BLO identified to examine the performance of the KA DG metrics. For each metric, we aggregated (using union) the KA DG entities identified using the hierarchical relationships (H). We noticed that the three homogeneity metrics have the same values; therefore, we choose one metric when reporting the results, namely Jaccard similarityFootnote 9. A cut-off threshold point for the result lists with potential KA DG entities was identified by normalizing the output values from each metric and taking the mean value for the 60th percentile of the normalized lists. The KA DG metrics evaluated included the three distinctiveness metrics plus the Jaccard homogeneity metric; each metric was applied over both families of relationships – hierarchical (H) and domain-specific (D). As in ontology summarization approaches [18], a name simplicity strategy was applied to reduce noise when calculating key concepts (usually, basic level objects have relatively simple labels, such as chair or dog). The name simplicity approach we use is solely based on the data graph. We identify the weighted median for the length of the labels of all data graph entities \( v \subseteq V \) and filter out all entities whose name length is higher than the median. For the MusicPinta data graph, the weighted median is 1.2, and hence we only included entities which consist of one word. Table 2 illustrates precision and recall values comparing BLO and KA DG derived using hierarchical and domain specific relationships.
Hybridization.
Further analysis of the False Positive (FP) and False Negative (FN) entities indicated that the algorithms had different performance on the different taxonomical levels in the data graph. This led to the following heuristics for hybridization.
Heuristic 1: Use Jaccard metric with hierarchical relationships for the most specific categories in the graph (i.e. the categories at the bottom quartile of the taxonomical level).
There were FP entities (e.g. Shawm and Oboe ) returned by distinctiveness metrics using the domain-specific relationship MusicOntology:Performance because these entities are highly associated with musical performances (e.g. Shawm is linked to 99 performances and Oboe is linked to 27 performance). Such entities may not be good knowledge anchors for exploration, as their hierarchical structure is flat. The best performing metric at the specific level was Jaccard for hierarchical attributes - it excluded entities which had no (or a very small number of) hierarchical attributes.
Heuristic 2: Take the majority voting for all other taxonomical levels.
Most of the entities at the middle and top taxonomical level will be well represented in the graph hierarchy and may include domain-specific relationships. Hence, combining the values of all algorithms is sensible. Each algorithm represents a voter and provides two lists of votes, each list corresponding to hierarchical or domain-specific associated attributes (H, D). At least half of the voters should vote for an entity for it to be identified in KA DG . Examples from the list of KA DG identified by applying the above hybridization heuristics included Accordion, Guitar and Xylophone. The full KA DG list is available hereFootnote 10. Hybridization improved Precision to 0.65 and Recall to 0.63.
6 L4All: Evaluating KA DG Against BLO
The Career domain is a suitable domain for studying basic level objects due to the richness of its ontological structures and the fact that the identification of knowledge anchors can facilitate users’ exploration of such structures, as discussed in [27]. We followed Algorithm 1, conducting a study with human participants to identify BLO.
6.1 Obtaining BLO
Participants.
28 participants, university students and professionals, age 25–64, recruited on a voluntary basis. Most of them were experienced mainly in Computing.
Method.
The experimental study for evaluating knowledge anchors in the L4All dataset included categories from the Occupation and Subject class hierarchies, for the reasons discussed above. Categories were represented to participants (corresponding to the \( show(r,v) \) function in Algorithm 1) using names (i.e. labels) of the category’s leaves. Overall, 624 class entities were extracted from the two class hierarchies (464 for Occupation and 160 for Subject) by running SPARQL queries to get all class entities linked via the rdfs:subClassOf relationship. The entities included: leaves (349 for Occupation and 141 for Subject) and categories (115 for Occupation and 19 for Subject). Seven online surveys7 were developed (six surveys presented the 114 category entities of the Occupation class hierarchy, with each survey showing 19 categories; and one survey presented the 19 categories of the Subject class hierarchy). The category allocation in each survey was random. Every survey had four respondents from the study participants. Each participant was allocated only to one survey.
Category identification task.
A representation of each category was shown on the participant’s screen and he/she was asked to identify the category name. The representation included a list of leaves’ names of that category (at most four leaf names were shown on the participant’s screen). The participant was provided with four different categories as candidate answers (including the category which the leaves belong to) and the participant was asked to select one category that he/she thinks the leaf entities belong to. The three additional candidate categories covered three levels of abstraction, namely: a parent from the superordinate level, a member from the subordinate level, and a sibling at the same category level. In cases where no parents or members could be added to the candidate answers, siblings were used instead.
Applying Strategy 2 in Algorithm 1 over the Occupation and Subject class hierarchies in the L4All dataset, we considered naming a category entity with its exact name or a name of its parents or its non-leaf subclass members shown to the participants. Figures 5 and 6 show examples of the category identification task from the Occupation and Subject class hierarchies respectively. For instance, the participant in Fig. 5 saw two leaves (the category has two leaves only) of the category Housekeeping Occupation and the participant identified the category’s parent Personal Service Occupation , which he/she thinks that the leaves belong to. This will increase the frequency for the category Personal Service Occupation . In Fig. 6, a participant was shown the leaf names of the category Biological Sciences (four random leaves where selected among 9) and selected its exact name. This will increase the count for the category Biological Sciences .

A representation of Housekeeping Occupation (a Category concept in the Occupation hierarchy with two subclasses) was shown to a user, who identified it as “Personal Service Occupation”.

A representation of Biological Sciences (a Category concept in the Subject hierarchy with four random subclasses) was shown to a user, who identified it as “Biological Sciences”.
Category entities in the Occupation and Subject class hierarchies with frequency equal or above two (i.e. categories named by at least two different users) were identified as potential BLO. Examples of BLO from Occupation were Administrative , IT Service Delivery , Functional Managers and from Subject were Biological Sciences, Law, Medicine and Dentistry . The full KA DG and BLO lists obtained from the L4All data set are available hereFootnote 11.
6.2 Evaluating KA DG Against BLO
Quantitative Analysis.
The KA DG metrics developed in [9] were run over the Occupation and Subject class hierarchies and the metrics outputs of KA DG were tested against the BLO identified. For each KA DG metric, we aggregated (using union) the entities identified using the hierarchical relationships ( rdfs:subClassOf and rdf:type ). One domain-specific relationship was used by the metrics ( Job for Occupation and Qualification for Subject). We normalized the metrics output values and took the 60th percentile of the normalized lists as a cut-off threshold point. Name simplification was applied using the weighted medians for the length of the labels of class entities in the Occupation and Subject class hierarchies (for Occupation = 3.2 and for Subject = 2.8) to filter out entities whose name length is higher than the median. Entities with name length greater than 3 were excluded (the names of the two class hierarchies - Occupation and Subject - and conjunctions, e.g. “and”, were not taken into account in counting the name length of entities).
Precision and Recall values for the metrics were identified (see Table 3). The three homogeneity metrics from [9] had the same values; therefore, we choose the Jaccard similarity metric in reporting the results (similarly to the MusicPinta analysis). Using the hierarchical relationships ( rdfs:subClassOf and rdf:type ), precision and recall values were good for Occupation (precision ranging from 0.72 to 0.79 and recall from 0.44 to 0.88) and very mixed for Subject (precision ranging from 0 to 1 and recall from 0 to 0.53). For the domain-specific relationships, the precision and recall were mixed for Occupation (precision ranging from 0 to 0.75 and recall from 0 to 0.76) and Subject (precision ranging from 0 to 1 and recall from 0 to 0.31).
By inspecting what caused the zero precision and recall values for the Category Utility (CU) distinctiveness metric and Jaccard (Jac) similarity metric, we noticed that none of these two metrics picked False Negative (FN) entities (i.e. potential KA DG) using the domain-specific relationships (for Occupation and Subject) and using the hierarchical relationships (for Subject). The CU metric did not pick any FN entities since it multiplies the ratio [number of instances of a category divided by number of all entities, classes and instances in Occupation] with the total CU values for members of a category. Hence, the CU value will be decreased especially when there are 1000s of entities (i.e. classes and instances) in the graph. For instance, in the Occupation class hierarchy, the CU ratio for the FN category Sales Related Occupation is: 87 instances divided by 4201 (464 classes + 3737 instances in the Occupation hierarchy), reducing the CU value for Sales Related Occupation to become less than the 60th percentile cut-off point (0.01). The Jaccard similarity metric did not pick FN entities since each entity has instances linked with one instance only via a domain-specific relationship (e.g. Job). Hence, the categories will have no intersections among their instances, producing zero values in the Jaccard metric.
Hybridization.
Analysis of the False Positive (FP) and False Negative (FN) entities indicated that the algorithms had different performance on the different taxonomical levels in the L4All data graph, which is formulated in the two heuristics below.
Heuristic 1: Use the AV and CAC distinctiveness metrics with hierarchical relationships for the categories at the bottom quartile of the class taxonomy.
There were FN entities (e.g. Sales Related and Science and Engineering Technicians ) returned by the AV and CAC homogeneity metrics using the domain-specific relationship Job , because these entities have a low number of instances (e.g. Sales Related has 87 instances and Science and Engineering Technicians has 50 instances; the median of instances per category is 144).
Heuristic 2: Take the majority voting for all other taxonomical levels.
Most of the entities at middle and top taxonomical level are well represented in the graph hierarchy. Each metric represents a voter and provides two lists of votes, each list corresponding to hierarchical or domain-specific relationships. At least half of the voters should vote for an entity for it to be identified as KA DG .
Examples of KA DG identified by applying the above hybridization heuristics for Occupation and Subject class hierarchies are: for Occupation ( Engineering Professionals, Process Operatives, Science and Engineering Technicians), and for Subject ( Business and Administrative Studies, Education ). The full lists of KA DG identified are available hereFootnote 12.
Hybridization increased performance, as follows: for Occupation, Precision = 0.77 and Recall = 0.92; for Subject, Precision = 1 and Recall = 0.53.
7 Discussion
This paper presents a systematic evaluation approach to validate KA DG metrics against basic level objects derived by humans.
Algorithm for identifying BLO.
The BLO algorithm presented in Sect. 4 is generic and can be applied over different application domains represented as data graphs. In this paper, the algorithm is applied in two application domains for data exploration, Music and Careers, using the data graphs from two semantic exploration applications. Applying the BLO algorithm over two domains allows us to illustrate two ways of instantiating the algorithm for obtaining BLO. MusicPinta describes concrete objects - musical instruments - that can have digital representations (e.g. image, audio, video). An image stimulus was used to represent musical instruments, and free-naming tasks included showing image representations of graph entities and asking the users to quickly name the entities they see. In contrast, L4All comprises of abstract career categories, such as Occupation and Subject, which have text representations (i.e. labels of entities) but no clearly distinguishable images. In this case, a category verification task was used to obtain BLO by showing text representations of graph entities and asking the user to identify the matching entity given some answers.
An important component for applying the BLO is to identify appropriate stimuli to be used for representing graph entities and showing them to humans in either a free-naming task or in a category verification task. One of the main factors that affects choosing appropriate stimuli is how well the stimuli cover the entities in the data graph. In other words, the chosen stimuli should have representations for all entities in the graph hierarchies. For instance, the stimuli for MusicPinta were images - taken from an established source (MIMO5). The chosen stimuli have to be close enough to users’ cognitive structures, so the users can understand the representation of entities.
The BLO algorithm over shallow graph hierarchies has some limitations. For instance, most categories (15 categories out of 19) in the Subject class hierarchy of the L4All ontology were identified as BLO. In a category verification task over a shallow hierarchy, finding candidate answers to be presented to users is challenging, especially when the shallow hierarchy does not contain the three levels of abstraction (basic, subordinate and superordinate). Furthermore, the identified BLO in data graphs can have confusing category labelling which reflect insufficiently articulated scope; for instance, vague names (e.g. ‘European Language, Literature and related subject’ ) or combining two categories in one (e.g. ‘ Mathematical and Computer Sciences’ ). Hence, the BLO algorithm is sensitive to the quality of the ontology. This points at another possible application of BLO – peculiarities in the output can indicate deficiencies of the ontology which can provide insights for re-engineering the ontology. An area of future work is to improve the L4All ontology by modifying the class labels and better articulating their scope.
Performance of KA DG metrics.
The identified BLO were used to examine the performance of the KA DG metrics. Our analysis found that hybridization of the metrics notably improved performance. The hybridization heuristics for the upper level of the graph hierarchies tend to be the same – combine the KA DB metrics using majority voting. However, the hybridization heuristics for the bottom level of the hierarchy differed depending on how instances at the bottom of the graph were associated through domain-specific relationships. The performance is sensitive to the appropriateness of the domain-specific relationships captured in the data graph. Examining the FP and FN entities for the hybridization algorithms for KA DG led to the following observations:
Missing basic level entities due to unpopulated areas in the data graph.
We noticed that none of the metrics picked FN entities belonging to the bottom quartile of the taxonomies and having a small number of members (such as Cello in MusicPinta and Construction Operatives in the Occupation class hierarchy in L4All - Cello has only one subclass and Construction Operatives has 10 instances – mean number of instances in Occupation is 184). While these entities belong to the cognitive structures of humans and were therefore added to the BLO sets, one could question whether such entities would be useful knowledge anchors because of their relatively small number of members. These entities could lead the user to ‘dead ends’ within unpopulated areas of the data graph which may be confusing. We therefore see such FN cases as ‘good misses’ by the KA DG metrics.
Selecting entities that are superordinates of entities in BLO.
The FP included entities (such as Reeds in MusicPinta and Secretarial and Related Occupation in the Occupation class hierarchy in L4All) which are well represented in the graph ( Reeds has 36 subclasses linked to 60 DBpedia categories; Secretarial and Related Occupation has 8 subclasses and 800 instances). Although these entities are not close to human cognitive structures, they provide direct links to entities in BLO ( Reeds links to Accordion ; Secretarial and Related Occupation links to Administrative and Secretarial Occupation ). We therefore see such FP as ‘good picks’, as they provide bridges to BLO entities.
8 Conclusion and Future Work
Data graph exploration underpins semantic Web applications, such as browsing and search. Lay users who are not domain experts can face high cognitive load and usability challenges when exploring an unfamiliar domain because the users are unaware of the knowledge structure of the graphs. This brings forth the challenge of building systematic approaches for supporting users’ exploration taking into account the knowledge utility of the exploration paths. To address this challenge, we adopt the subsumption theory for meaningful learning [8] where new knowledge is subsumed under familiar and highly inclusive entities. A core algorithmic component for adopting this theory is the automatic identification of knowledge anchors in a data graph.
The work in this paper adapts Cognitive Science experimental approaches for deriving the BLO, and presents an algorithm to capture the BLO that correspond to human cognitive structures over a data graph. Our work contributes to improving the usability of data graph exploration by presenting a methodology for aligning BLO in human cognitive structures and the corresponding knowledge anchors in a data graph. The obtained sets of BLO and KA DG can have two broad implications: (i) to improve users’ exploration of large data graphs; and (ii) to reengineer the ontology to better align with human cognitive structures. We are focusing on the former, and are devising navigation strategies to expand users’ knowledge while exploring a data graph.
Notes
- 1.
- 2.
- 3.
- 4.
- 5.
- 6.
MIMO provided pictures for most musical instruments. In the rare occasions when an image did not exist in MIMO, Wikipedia images were used instead.
- 7.
The study was conducted with Qualtrics (www.qualtrics.com). Examples from the surveys are available at: https://drive.google.com/drive/folders/0B5ShywKndSLXaVhrSWpiYVZ3WjA.
- 8.
- 9.
The Jaccard similarity metric is widely used, and was used in identifying basic formal concepts in the context of formal concept analysis [28].
- 10.
- 11.
- 12.
References
Marie, N., Gandon, F.: Survey of linked data based exploration systems. In: IESD@ISWC (2014)
Thakker, D., Dimitrova, V., Lau, L., Yang-Turner, F., Despotakis, D.: Assisting user browsing over linked data: requirements elicitation with a user study. In: ICWE 2013 International conference on Web Engineering, pp. 376–383 (2013)
Cheng, G., Zhang, Y., Qu, Y.: Explass: exploring associations between entities via top-k ontological patterns and facets. In: ISWC 2013, pp. 422–437 (2014)
Thellmann, K., Galkin, M., Orlandi, F., Auer, S.: LinkDaViz – automatic binding of linked data to visualizations. In: ISWC 2013, pp. 147–162 (2015)
Lopez, V., Fernández, M., Motta, E., Stieler, N.: PowerAqua: supporting users in querying and exploring the semantic web. Semant. Web. 3, 249–265 (2012)
Cheng, G., Qu, Y.: Searching linked objects with falcons: approach, implementation and evaluation. Int. J. Semant. Web Inf. Syst. 5, 49–70 (2009)
Al-Tawil, M., Thakker, D., Dimitrova, V.: Nudging to expand user’s domain knowledge while exploring linked data. In: IESD@ISWC (2015)
Ausubel, D.P.: A subsumption theory of meaningful verbal learning and retention. J. Gen. Psychol. 66, 213–224 (1962)
Al-Tawil, M., Dimitrova, V., Thakker, D., Bennett, B.: Identifying knowledge anchors in a data graph. In: HT 2016 - 27th ACM Conference on Hypertext and Social Media (2016)
Rosch, E., Mervis, C.B., Gray, W.D., Johnson, D.M., Boyes-Braem, P.: Basic objects in neutral categories. Cogn. Psychol. 8, 382–439 (1976)
Sah, M., Wade, V.: Personalized concept-based search on the linked open data. J. Web Semant. 36, 32–57 (2016)
Zimmer, B., Kerren, A.: Harnessing WebGL and WebSockets for a web-based collaborative graph exploration tool. In: Cimiano, P., Frasincar, F., Houben, G.-J., Schwabe, D. (eds.) ICWE 2015. LNCS, vol. 9114, pp. 583–598. Springer, Cham (2015). doi:10.1007/978-3-319-19890-3_37
Zheng, L., Xu, J., Jiang, J., Qu, Y., Cheng, G.: Iterative entity navigation via co-clustering semantic links and entity classes. In: Sack, H., Blomqvist, E., d’Aquin, M., Ghidini, C., Ponzetto, S.P., Lange, C. (eds.) ESWC 2016. LNCS, vol. 9678, pp. 168–181. Springer, Cham (2016). doi:10.1007/978-3-319-34129-3_11
Troullinou, G., Kondylakis, H., Daskalaki, E., Plexousakis, D.: RDF digest: efficient summarization of RDF/S KBs. In: Gandon, F., Sabou, M., Sack, H., d’Amato, C., Cudré-Mauroux, P., Zimmermann, A. (eds.) ESWC 2015. LNCS, vol. 9088, pp. 119–134. Springer, Cham (2015). doi:10.1007/978-3-319-18818-8_8
Zhang, X., Cheng, G., Qu, Y.: Ontology summarization based on RDF sentence graph. In: Proceedings of the 16th International World Wide Web Conference (2007)
Wille, R.: Formal concept analysis as mathematical theory of concepts and concept hierarchies. In: Formal Concept Analysis, pp. 1–33 (2005)
Li, N., Motta, E.: Evaluations of user-driven ontology summarization. In: Cimiano, P., Pinto, H.S. (eds.) EKAW 2010. LNCS, vol. 6317, pp. 544–553. Springer, Heidelberg (2010). doi:10.1007/978-3-642-16438-5_44
Peroni, S., Motta, E., Aquin, M.: Identifying key concepts in an ontology through the integration of cognitive principles with statistical and topological measures. In: ASWC 2008 (2008)
Belohlavek, R., Trnecka, M.: Basic level in formal concept analysis: Interesting concepts and psychological ramifications. In: International Joint Conference on Artificial Intelligence, pp. 1233–1239 (2013)
Bizer, C., Heath, T., Berners-Lee, T.: Linked data-the story so far. Int. J. Semant. Web Inf. Syst. (2009)
Rosch, E., Lloyd, B.B.: Cognition and Categorization, pp. 27–48. Lloydia Cincinnati (1978)
Henry Kucera, W.N.F.: Computational Analysis of Present-Day American English. Am. Doc. 19, 419 (1968)
Cappiello, C., Noia, T., Marcu, B.A., Matera, M.: A quality model for linked data exploration. In: Bozzon, A., Cudre-Maroux, P., Pautasso, C. (eds.) ICWE 2016. LNCS, vol. 9671, pp. 397–404. Springer, Cham (2016). doi:10.1007/978-3-319-38791-8_25
Heath, T., Bizer, C.: Linked data: Evolving the Web into a Global Data Space, 1st edn. (2011)
Palmer, C.F., Jones, R.K., Hennessy, B.L., Unze, M.G., Pick, A.D.: How Is a Trumpet known? The “Basic Object Level” concept and perception of musical instruments. Am. J. Psychol. 102, 17–37 (1989)
de Freitas, S., Harrison, I., Magoulas, G., Papamarkos, G., Poulovassilis, A., Van Labeke, N., Mee, A., Oliver, M.: L4All, a web-service based system for lifelong learners. In: Learning Grid Handbook: Concepts, Technologies and Applications, vol. 2, pp. 143–155 (2008)
Poulovassilis, A., Al-Tawil, M., Frosini, R., Dimartino, M., Dimitrova, V.: Combining flexible queries and knowledge anchors to facilitate the exploration of knowledge graphs. In: IESD@ISWC (2016)
Belohlavek, R., Trnecka, M.: Basic level of concepts in formal concept analysis. In: Domenach, F., Ignatov, D.I., Poelmans, J. (eds.) ICFCA 2012. LNCS, vol. 7278, pp. 28–44. Springer, Heidelberg (2012). doi:10.1007/978-3-642-29892-9_9
Acknowledgements
This research uses outputs from the EU/FP7 project Dicode and the UK/JISC project L4All. We are grateful to Riccardo Frosini and Mirko Dimartino in helping us prepare the L4All dataset used for the experiments in this paper. We thank all the participants in the experimental studies.
Author information
Authors and Affiliations
Corresponding author
Editor information
Editors and Affiliations
Rights and permissions
Copyright information
© 2017 Springer International Publishing AG
About this paper
Cite this paper
Al-Tawil, M., Dimitrova, V., Thakker, D., Poulovassilis, A. (2017). Evaluating Knowledge Anchors in Data Graphs Against Basic Level Objects. In: Cabot, J., De Virgilio, R., Torlone, R. (eds) Web Engineering. ICWE 2017. Lecture Notes in Computer Science(), vol 10360. Springer, Cham. https://doi.org/10.1007/978-3-319-60131-1_1
Download citation
DOI: https://doi.org/10.1007/978-3-319-60131-1_1
Published:
Publisher Name: Springer, Cham
Print ISBN: 978-3-319-60130-4
Online ISBN: 978-3-319-60131-1
eBook Packages: Computer ScienceComputer Science (R0)