
Abstract
Sometimes the reports of primary studies that are potentially analyzable within the signal detection theory framework do not report sample statistics for its main indexes, especially the sample variance of d'. We describe a procedure for estimating the variance of d' from other sample statistics (specifically, the mean and variance of the observed rates of hit and false alarm). The procedure acknowledges that individuals can be heterogeneous in their sensitivity and/or decision criteria, and it does not adopt unjustifiable or needlessly complex assumptions. In two simulation studies reported here, we show that the procedure produces certain biases, but, when used in meta-analysis, it produces very reasonable results. Specifically, the weighted estimate of the mean sensitivity is very accurate, and the coverage of the confidence interval is very close to the nominal confidence level. We applied the procedure to 20 experimental groups or conditions from seven articles (employing recognition memory or attention tasks) that reported statistics for both the hit and false alarm rates, as well as for d'. In most of these studies the assumption of homogeneity was untenable. The variances estimated by our method, based on the hit and false alarm rates, approximate reasonably to the variances in d' reported in those articles. The method is useful for estimating unreported variances of d', so that the associated studies can be retained for meta-analyses.
Signal detection theory (SDT; Green & Swets, 1966; Macmillan & Creelman, 2005; Wickens, 2001) is a conceptual framework based on the theoretical ability to separate an observer’s sensitivity (typically represented by δ) from the response decision criterion (typically represented by C). These two parameters represent independent psychological processes that determine response proportions in detection or discrimination tasks. Both parameters can be estimated from a sample of data made up of trials that include targets or signals (requiring “yes” responses to be correct) and trials that include distractors or noise alone (requiring “no” responses). These estimators (d' as an estimator of δ; c as an estimator of C) are frequently analyzed as dependent variables in experimental studies, including not only psychophysical detection experiments, but also recognition memory tests (Rotello, 2017).
However, sometimes the reports of primary studies potentially analyzable within the SDT framework do not report sample statistics for these indexes. For example, sample averages of d' or c are sometimes reported, but not their variances. Knowing the sample variance of d' can be crucial for follow-up research that uses the data for theoretical purposes, such as in meta-analytic syntheses of a collection of such primary studies. Some meta-analyses analyze the hit (H) and false alarm (F) rates separately, even though a great virtue of SDT is that it theoretically provides a measure of sensitivity independent of the response criterion. To synthesize estimates of sensitivity indices, such as d', we need to know the sample means and the variances of these indices. Only then can we use an appropriate weighting scheme for studies based on the inverse of the variance, the scheme used most often in meta-analysis and other theoretical methods for summarizing large bodies of research (Borenstein, Hedges, Higgins, & Rothstein, 2009). For example, many primary studies use the continuous-performance test (Nuechterlein & Asarnow, 1992; Rosvold, Mirsky, Sarason, Bransome, & Beck, 1956) but only analyze the results for omissions and commissions separately (e.g., Bora, Yucel, & Pantelis, 2009; Fett, Viechtbauer, Penn, van Os, & Krabbendam, 2011). In a subsequent meta-analysis, it is only possible to calculate the effect sizes for those rates, but not for sensitivities and response criteria. The same happens with some studies of recognition memory (e.g., Aleman, Hijman, de Haan, & Kahn, 1999).
There are also studies in which new models are fitted to data from sets of empirical studies published previously in scientific journals (e.g., Bröder & Schütz, 2009). Knowing the variance of such statistics as d' is important for making the most fruitful use of previous results in later mathematical modeling and meta-analysis.
Especially in the field of meta-analysis, great efforts are made so that no primary study need be excluded, because of a lack of statistical information in the published report, when obtaining combined estimates of an effect size (Cooper, Hedges, & Valentine, 2009). For example, in a meta-analysis, Rhodes and Anastasi (2012) analyzed separately the hit and false alarm rates from 123 and 127 studies, respectively. In contrast, only 87 (71%) and 68 (54%) of these studies, respectively, could be included in the analysis of sensitivity and response criterion. The reason for this difference was that many studies did not report the sample variance of d'. When some critical information is lacking, it is common practice to request it from the authors or to estimate it, if possible, from whatever information is available (e.g., from the t statistic comparing two groups in their average d' values, or from the F statistic calculated in a two-group analysis of variance). Thus, there are theoretically important reasons to develop procedures that allow for inferring additional information from the statistics that published studies do provide, without demanding unjustifiable or needlessly complex assumptions.
The present article describes a procedure for calculating the variance of d' from descriptive sample statistics (specifically, the mean and variance of the observed H and F proportions). To do this, under the normal homoscedastic model of SDT, we will assume that beta distributions are associated with the probabilities of H and F. The procedure also assumes initially that the probabilities of hit and false alarm are linearly independent. With these assumptions, it is possible to define the distributions of \( {\widehat{\boldsymbol{z}}}_{\boldsymbol{H}} \) and \( {\widehat{\boldsymbol{z}}}_{\boldsymbol{F}} \) from which the variance of d' is obtained (see Appendix A). The variance of c is easily derived from that of d'.
Suero, Botella, and Privado (2018) have developed formulas for calculating the variance of d' and c when the individuals are heterogeneous in their parametric values of sensitivity (δ) and/or criterion (C). In their procedure, it is assumed that at the population level the parametric values of δ and C are linearly independent. This is reasonable, since we do not have any expectation that more-sensitive individuals should tend to be more conservative or liberal in their criteria. However, such formulas are useful only for theoretical purposes, since to employ them it is necessary to know the population variances (\( {\sigma}_{\delta}^2 \), \( {\sigma}_C^2 \)), and of course these are unknown. Nevertheless, the formulas can be used in simulation studies in which those variances are set by the researcher.
In the present article we study a more practical problem, different from the problem studied by Suero et al. (2018), although we will profit from their results. Here we assume the more realistic scenario that the parametric variances are unknown and that the information available is only that related to the rates of H and F (means and variances). On the basis of that minimal information, we still want to get reasonable estimates of the variances of d' and c. The rationale of the procedure, the statistical models, and some of the formulas are similar to those given by Suero et al. (2018), but they cannot be identical because the present scenario is different. Here we will assume initially that the probabilities of hit and false alarm are linearly independent. This assumption is the main limitation of the procedure described below, because it looks risky. That is why once the procedure is developed and a practical application of the procedure is presented, two simulation studies will be described. In a practical application of the procedure, the values of the variances imputed with this procedure for a sample of published studies are compared with those actually reported in the studies. The first simulation was aimed at studying the variance of d' as calculated by the proposed procedure, when the assumption of independence between the conditional probabilities of hit and false alarm is not met. The goal of the second simulation was to study the consequences that violation of the independence assumption would have for a meta-analysis. Finally, the main conclusions will be highlighted, as well as the limitations of the procedure, including strategies for managing the independence issue.
Methods for calculating the variance of a single-point estimate of d'
Several procedures have been proposed for calculating the variance of d', given that d' is a point estimate of an individual’s sensitivity (δ). On the one hand, there is the approximate procedure of Gourevitch and Galanter (1967), which provides fairly accurate estimates in a broad range of situations, although in other situations the estimates are not so good (Suero, Privado, & Botella, 2017). In contrast, Miller’s (1996) exact procedure provides very accurate estimates in almost all situations, once the problem of extreme values of the proportions (0.0 or 1.0) is solved. Note that both procedures refer to the variance of a single-point estimator: They provide estimates of the standard error of d'.
None of these procedures should be used blindly to calculate the variance of d' for a sample of individuals. Doing so adopts the risky and arbitrary assumption that all individuals in the sample are homogeneous in their sensitivities and response criteria. Representing the probability of H by πH and that of F by πF for a single individual, the true variances of the empirical proportions of hit and false alarm in N signal trials (Ns) and N nonsignal or noise trials (Nn), respectively, are
The true variances of PH and PF in a sample of observers will also be expressed in these formulas if the observers are homogeneous in their performance—that is, if they all come from a single population of observers who share the same values of πH and πF.
The assumption that all observers are homogeneous is quite risky, however.Footnote 1 It is much more realistic to assume that the values of πH and πF will vary among observers. We can establish that, for a given population, the actual probabilities that individuals will make YES responses on target and noise trials will have means of \( {\mu}_{\pi_H} \) and \( {\mu}_{\pi_F} \), respectively, and variances \( {\sigma}_{\pi_H}^2 \) and \( {\sigma}_{\pi_F}^2 \). In this situation, the variance of the empirical hit rate (and similarly for the false alarm rate) is (Kleinman, 1973; Suero et al., 2018):
Note that if the observers are homogeneous (\( {\sigma}_{\pi_H}^2=0 \)), then Formula 2 is reduced to Formula 1 (i.e., there is a single value for πH and πF for all individuals, and their means are therefore those respective values). Of course, a good procedure to test the assumption of observer homogeneity is to test whether the empirical variances of H and F are statistically greater than those expected under that assumption (Formula 1). If the test yields a statistically significant result, then it will not be appropriate to use Formula 1 to estimate the variances of the proportions, but rather to favor Formula 2. As a consequence, it is not appropriate to use the procedures of either Miller (1996) or Gourevitch and Galanter (1967) to calculate the variance of d'.
Suero et al. (2018) have further developed the methods of Miller (1996) and Gourevitch and Galanter (1967) so that they can be applied to the situation of heterogeneous observers. Their simulation studies showed that, whereas their adaptation of the method of Gourevitch and Galanter provides reasonable estimates only in some situations, their adaptation of Miller’s method works well in practically all of the studied conditions.
Estimating the variance of a sample of d' values from heterogeneous individuals
To use the Suero et al. (2018) procedure (hereafter referred to as the SBP method), it is assumed that the individuals’ parametric sensitivity values follow an unknown distribution with mean and variance (μδ; \( {\sigma}_{\delta}^2 \)), and that response criterion has mean and variance (μC; \( {\sigma}_C^2 \)). It is further assumed that the pairs of individuals’ parametric values are independent (ρδC = 0). Suero et al. (2018) have shown that if there is heterogeneity in the population sensitivity and criterion values (\( {\sigma}_{\delta}^2,{\sigma}_C^2>0 \)), then the population probabilities of hit and false alarm (\( {\pi}_{H_i} \) and \( {\pi}_{F_i} \)) are no longer linearly independent. Notice that for calculating the variances \( {\sigma}_{d^{\prime}}^2 \) and \( {\sigma}_c^2 \) with this procedure, we need to know the variances \( {\sigma}_{\delta}^2 \) and \( {\sigma}_C^2 \).
In what follows, we adapt the SBP method to a different scenario, more suited for some practical purposes. In this scenario, the shapes of the population distributions of δi and Ci and their parameters are unknown. Specifically, in this situation we assume that (a) the values of \( {\pi}_{H_i} \) and \( {\pi}_{F_i} \) are independent and (b) both variables are described by beta distributions (Johnson, Kotz, & Balakrishnan, 1995). Unlike the scenario studied by Suero et al. (2018), independence between parametric probabilities is assumed here, and this means that δi and Ci are not necessarily independent; in general, ρδC ≠ 0, but 0 is a particular case. This new development can be applied to the task of recovering the variance of d' when only the means and variances of the proportions of H and F are known, given the two mentioned assumptions. Let’s see what the procedure for this scenario entails. We will discuss in more depth the issue of dependence in sections 4 and 5.
Recall that in the present work we want to obtain the variance of d' knowing only the means and variances of H and F calculated for a sample of individuals. With only this information, it is not possible to deduce the distributions of πH and πF. Therefore we will assume beta distributions for both πH and πF. The density function of the beta distribution is:
where \( B\left(p,q\right)=\underset{0}{\overset{1}{\int }}{t}^{p-1}\cdot {\left(1-t\right)}^{q-1} dt \)
This distribution has as its domain all values that πH and πF can assume; that is, they are within the interval [0, 1]. It also has the advantage of being very flexible, since it can take different forms and degrees of symmetry, depending on the values of its two parameters, p and q (see Johnson et al., 1995). A final advantage is that it is not necessary to use numerical methods to solve the integrals for the expected values and the variances of \( {\widehat{\boldsymbol{z}}}_{\boldsymbol{H}} \) and \( {\widehat{\boldsymbol{z}}}_{\boldsymbol{F}} \) (Eqs. A2–A5 in Appendix A, taken from Suero et al., 2018), since they can be solved analytically (see below and Appendix B).
A consequence of assuming that the distributions of πH and πF follow beta distributions is that the distribution of the frequencies j of H (or F), and therefore of the proportions j/N of H (or of F) (see Appendix B), follow two beta–binomial distributions (Skellman, 1948). In a theoretical review of such distribution, Johnson, Kemp, and Kotz (2005) included this distribution among the hypergeometric ones. Ennis and Bi (1998) described an application of that distribution in a study of sensorial discrimination and preferences.
Furthermore, since \( {\widehat{\boldsymbol{z}}}_{\boldsymbol{H}} \) and \( {\widehat{\boldsymbol{z}}}_{\boldsymbol{F}} \) are the results of increasing nonlinear transformations (the inverse of the standardized normal distribution) of the proportions of H (and F), then the probability associated with a \( {\widehat{\boldsymbol{z}}}_{\boldsymbol{H}} \) (\( {\widehat{\boldsymbol{z}}}_{\boldsymbol{F}} \)) value is equal to the probability associated with its proportion H (or F).
In addition to assuming a beta distribution, and in the absence of other empirical or theoretical information, we assume independence between πH and πF. A consequence of that assumption is that \( {\widehat{\boldsymbol{z}}}_{\boldsymbol{H}} \) and \( {\widehat{\boldsymbol{z}}}_{\boldsymbol{F}} \) are linearly independent; therefore, the term \( {\boldsymbol{\sigma}}_{{\widehat{\boldsymbol{z}}}_{\boldsymbol{H}}{\widehat{\boldsymbol{z}}}_{\boldsymbol{F}}} \) is null, leaving the expression for the variance of d' equal to (remembering that d' = ẑH– ẑF; MacMillan & Creelman, 2005; Wickens, 2001):
In conclusion, we propose to obtain \( {\boldsymbol{\sigma}}_{{\boldsymbol{d}}^{\prime}}^{\mathbf{2}} \) from \( {\boldsymbol{\sigma}}_{{\widehat{\boldsymbol{z}}}_{\boldsymbol{H}}}^{\mathbf{2}} \) and \( {\boldsymbol{\sigma}}_{{\widehat{\boldsymbol{z}}}_{\boldsymbol{F}}}^{\mathbf{2}} \), assuming that πH and πF are independent random variables and that each of them follows a beta distribution. Thus, by means of Eqs. A2 to A5 in Appendix A and Eq. 4, the variance of d' can be calculated.
To obtain estimates of the expected values and the variances of \( {\widehat{\boldsymbol{z}}}_{\boldsymbol{H}} \) and \( {\widehat{\boldsymbol{z}}}_{\boldsymbol{F}} \), it is necessary to know the parameters p and q of the two beta distributions. To obtain the distribution of the values of πH, it is necessary to know the parameters pH and qH (and likewise, we must know the parameters pF and qF to obtain the values of πF).
It should be remembered, however, that only the means and variances of the proportions of H and F obtained from a sample of observers are known. The next problem is how to obtain an estimate of the pH, qH, pF, and qF values. To achieve this, we must remember that for this distribution the following equalities are fulfilled (Johnson et al., 1995, p. 217):
Following the method of moments, the expected value is replaced in Eq. 5 by its estimator (\( {\widehat{\boldsymbol{\mu}}}_{\boldsymbol{X}} \)), and in Eq. 6, the variance by its own estimator (\( {\widehat{\boldsymbol{\sigma}}}_{\boldsymbol{X}}^{\mathbf{2}} \)). Solving the system of two equations gives the estimates of p and q.
Recall that it is assumed that only the sample mean and variance of the proportions are known. Following Suero et al. (2018), \( {\mu}_{P_H}={\mu}_{\pi_H} \)(and the same is true for F). Therefore, as estimators of \( {\mu}_{\pi_H} \) and \( {\mu}_{\pi_F} \), the respective sample means of the proportions (\( \overline{P_H},\overline{P_F} \)) will be taken. Likewise, the relationship between the variance of the empirical proportions (\( {\sigma}_P^2 \)) and the variance of π (\( {\sigma}_{\pi}^2 \)) is defined by Eq. 2. Assuming as an estimator of \( {\sigma}_P^2 \) (for both PH and PF) the sample variance of the proportions, an estimator of \( {\sigma}_{\pi}^2 \) can be calculated by the expression in Eq. 2, since N (the number of trials) is known, and the sample means of the corresponding proportions can be employed as estimators of \( {\mu}_{\pi_H} \) and \( {\mu}_{\pi_F} \).
It therefore follows that we can obtain the estimators \( {\widehat{\boldsymbol{p}}}_{\boldsymbol{H}} \) and \( {\widehat{\boldsymbol{q}}}_{\boldsymbol{H}} \) for the beta distribution associated with πH, and the estimators \( {\widehat{\boldsymbol{p}}}_{\boldsymbol{F}} \) and \( {\widehat{\boldsymbol{q}}}_{\boldsymbol{F}} \) for the beta distribution associated with πF. Before proceeding, it is necessary to verify that the two estimators take values within the parametric space (p > 0 and q > 0). In this way, all the elements involved in Eqs. A2 to A5 are known. It should also be noted that it is possible to solve the integrals that appear in these equations analytically (see Appendix B). Therefore, these expressions are equivalent to
Notice that the expression \( \left(\underset{j}{N_{\ast }}\right)\cdot \frac{\varGamma \left({p}_{\cdotp }+{q}_{\cdotp}\right)}{\varGamma \left({p}_{\cdotp}\right)\cdot \varGamma \left({q}_{\cdotp}\right)}\cdot \frac{\varGamma \left({p}_{\cdotp }+j\right)\cdot \varGamma \left({q}_{\cdotp }+{N}_{\ast }-j\right)}{\varGamma \left({p}_{\cdotp }+{q}_H+{N}_{\ast}\right)} \) (where * is S or N and • is H or F) is just the probability associated with the frequency j of either H or F (see Appendix B).
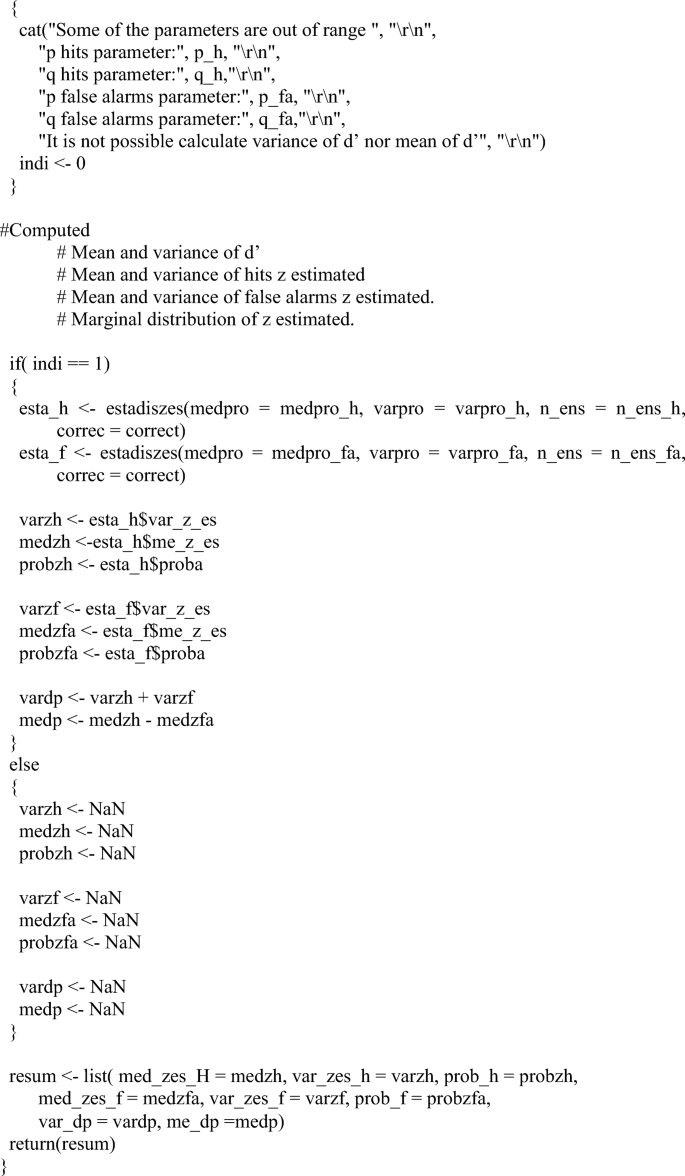
We have implemented Eqs. 7 to 10 in R (R Core Team, 2015; see Appendix C). In this program, the values of pH, qH, pF, and qF can be substituted with their estimates, as we mentioned above.
To obtain both the variance and the expected value of d', it is necessary to solve the problem of extreme values. When PH (or PF) is equal to 0 or 1, the associated value \( {\widehat{\boldsymbol{z}}}_{\boldsymbol{H}} \) (or \( {\widehat{\boldsymbol{z}}}_{\boldsymbol{F}} \)) is – ∞ or + ∞, so it is not possible to calculate the variance and the expected value of d'. Several alternative procedures have been proposed (for a comparison of the different methods, see Brown & White, 2005; Hautus & Lee, 2006). Among them, those employed most often are (a) the log–linear correction (Snodgrass & Corwin, 1988) applied to all frequencies (whatever their values); it is defined as (H + 0.5)/(Ns + 1) for hits and (F + 0.5)/(Nn + 1) for false alarms. (b) The ± 0.5 correction (Murdock & Ogilvie, 1968) is applied only if the frequency is 0 (which is replaced by 0.5) or N (replaced by N – 0.5), where N is the number of signal or noise trials, as appropriate. In many published primary studies, examples of these and other procedures can be found.
In our R script, the correction has been included as an argument of the functions (see Appendix C). This argument takes three possible values: (a) “M&O,” for the Murdock and Ogilve correction; (b) “S&C,” for the Snodgrass and Corwin correction; and (c) a vector of length equal to the number of trials, in which the values of the proportions already corrected are included. The last option gives greater freedom to apply any correction. By default, “M&O” is assumed.
The output of the code includes estimates of (a) the variance of d', (b) the expected value of d', (c) the variances of \( {\widehat{\boldsymbol{z}}}_{\boldsymbol{H}} \) and \( {\widehat{\boldsymbol{z}}}_{\boldsymbol{F}} \), (d) the expected values of \( {\widehat{\boldsymbol{z}}}_{\boldsymbol{H}} \) and \( {\widehat{\boldsymbol{z}}}_{\boldsymbol{F}} \), and (e) the marginal probabilities of \( {\widehat{\boldsymbol{z}}}_{\boldsymbol{H}} \) and \( {\widehat{\boldsymbol{z}}}_{\boldsymbol{F}} \).
If the expected values and variances of the beta distributions are known (for theoretical reasons or because they are set in order to perform simulations), the parametric values will be obtained instead of their estimates. Thus, this same R script enables researchers to perform theoretical studies on the relationship between the parameters of the beta distribution of the πH and πF values and the values of the variances and the expected values of d' and of \( {\widehat{\boldsymbol{z}}}_{\boldsymbol{H}} \) and \( {\widehat{\boldsymbol{z}}}_{\boldsymbol{F}} \). It also allows study of the properties of the marginal distributions of \( {\widehat{\boldsymbol{z}}}_{\boldsymbol{H}} \) and \( {\widehat{\boldsymbol{z}}}_{\boldsymbol{F}} \).
Analysis of empirical studies
The variant of the SBP method just presented has been designed to estimate the variance of d' when it cannot be assumed that the observers are homogeneous and when the sample variance is unknown, but the values of the means and variances of PH and PF are known. Of course, if an experimental report includes the empirical variance of the observers’ sample, an additional method is not necessary to estimate it, since the empirical variance is the best estimator of the population variance. In this section, we demonstrate the usefulness of our method by applying it to the results of some studies that have provided the variance in the sample d'. By applying the method for estimating the variance of d' to a handful of published primary studies in which the sample variance was included, we can compare these empirical variances with those estimated by the SBP procedure.
In each study we will also test the homogeneity assumption by assessing the empirical variances of PH and PF. When the tests of the variances of PH and PF indicate that individuals are heterogeneous, the SBP procedure must provide estimates of the d' variances that are closer to the empirical variance than are those calculated under the assumption of homogeneity. By contrast, when there is evidence that individuals are homogeneous, both the SBP procedure and Formula 1 should provide values close to the empirical variance.
For this study, we selected a casual sample of 20 experimental groups or conditions from seven articles (see Table 1), in which the procedures of analysis followed the SDT framework and in which the studies reported statistics for both the H and F rates and for d'. The studies all used recognition memory or attention tasks. Although the search for example studies was not exhaustive, it was an ad hoc selection of studies that can give a fairly clear picture of the message we intend to convey. From each study, some groups or experimental conditions have been identified, and the following values have been extracted: number of individuals, number of target and noise trials, mean and variance of the H and F rates, and mean and variance of d'.
Calculation procedures
The calculations made with the reported statistics of each study began with a test of the homogeneity hypothesis. Then we estimated the variances of d' under the homogeneity assumption by the methods of Miller (1996) and Gourevitch and Galanter (1967). Next we repeated the estimates by relaxing those assumptions (SBP method). Finally, we compared these three estimates with the reported empirical variances.
The test of the homogeneity hypothesis was based on the probabilities πH and πF. For this, we adopted as the null hypothesis the value provided by Formula 1, since it expresses the variance of the proportion (P) if π is constant. We used the test statistic for normal variables to evaluate the values of the empirical variances of PH and PF. Although the sample distribution of the proportion is not normal (since it is a discrete variable and its sampling distribution is asymmetric unless π is equal to .50), with the large number of trials carried out in these studies, the approximation is sufficient for our purposes (see, e.g., Hays, 1988, p. 226). Since the empirical variance should be greater (not less) than is expected under the null hypothesis of homogeneity, these tests were one-sided in that direction. To highlight the results of these tests, we have marked with an asterisk the cases in the \( {S}_{P_H}^2 \) and \( {S}_{P_F}^2 \) columns of Table 2 in which the test was statistically significant.
The tests on \( {S}_{P_H}^2 \) and \( {S}_{P_F}^2 \) just described lead to the conclusion that the homogeneity assumption is not tenable in most cases. Even so, we have estimated the variance of d' assuming homogeneity, according to the methods of Miller (1996) and Gourevitch and Galanter (1967), in order to assess the effects of adopting that assumption wrongly. The values obtained appear in the \( {\widehat{\sigma}}_{d^{\prime };\mathrm{M}}^2 \) and \( {\widehat{\sigma}}_{d^{\prime };\mathrm{GG}}^2 \) columns in Table 3. We also estimated the variance of d' without the assumption of homogeneity using the SBP method (see Appendix C for the R script used); the values obtained appear in the \( {\widehat{\sigma}}_{d^{\prime };\mathrm{SBP}}^2 \) column of Table 3.
We compared the estimated variances with the empirical variances by obtaining the ratios between the empirical variance and each of the three estimated variances. The numbers of times the empirical variance of d' exceeded the three calculated variances are shown in the last three columns of Table 3. In these columns, the studies in which the empirical variance was statistically greater than the imputed one are marked with asterisks (using tests in which the value of the null hypothesis was the variance estimated with each method; Hays, 1988, p. 328). In the case of \( {\widehat{\sigma}}_{d^{\prime };\mathrm{M}}^2 \) and \( {\widehat{\sigma}}_{d^{\prime };\mathrm{GG}}^2 \), we performed one-tailed tests with the critical region in the higher values. In the case of \( {\widehat{\sigma}}_{d^{\prime };\mathrm{SBP}}^2 \), we did not know whether any discrepancies would appear as higher or lower values; therefore, we performed two-tailed tests.Footnote 2
Results and discussion
In almost all the samples or conditions studied, the assumption of homogeneity for the probabilities πH and πF among observers was rejected. In fact, in only one data set did the results not reject the null hypothesis that π was constant for one of the two probabilities (Case 8 in the table, corresponding to πF in the control sample of Hooks, Milich, & Lorch, 1994). Although we do not know how often heterogeneity occurs in published studies generally, it undoubtedly occurs frequently enough that the issue cannot be ignored. Imputation of the variance of d' with methods based on the homogeneity assumption will generally produce biased estimates of the variance.
As we have already indicated, Miller’s (1996) method provides excellent estimates of the single-point variance of d'; Gourevitch and Galanter (1967) provide reasonably approximate estimates under certain conditions. However, if either of these methods is applied to estimate the variance of a sample of individuals, the homogeneity assumption results in substantial underestimates of the empirical variances. In all the cases studied, this discrepancy was statistically significant (Table 3, second and third columns from the right). In contrast, the procedure described here, a variant of the method developed by Suero et al. (2018), provides much more accurate estimates of the empirical variances. In none of the groups included in this study was the discrepancy statistically significant (Table 3, rightmost column). However, in spite of the lack of statistically significant differences, for some of these studies the discrepancies were not negligible and deserve to be studied in more detail (in the most extreme case, the empirical variance was half that calculated by the SBP method; i.e., the study by Tanner, Haller, & Atkinson, 1967).
Once linear independence between δ and C is assumed, the correlation between the zs (and the πs) is a consequence of the heterogeneity of δ and C. The specific value of \( {\rho}_{z_H{z}_F} \) depends on the ratio between the variances (J). When J > 4, then \( {\rho}_{z_H{z}_F}<0 \). When J < 4, then \( {\rho}_{z_H{z}_F}>0 \). When J = 4 (i.e., when \( {\sigma}_{\delta}^2 \) is four times \( {\sigma}_C^2 \)), then \( {\rho}_{z_H{z}_F}=0 \). We can check this through the six studies in Table 1 that report the empirical variance \( {S}_c^2 \). As is shown in Table 4, in three of them the ratio between the reported variances fulfills the condition \( {S}_{d^{\prime}}^2/{S}_c^2>4 \). In only those three cases, the SBP method underestimated the variance of d' (see the last column in Table 3). In the other three cases, the ratio between the variances was lower than 4, and only in those three cases did the SBP method overestimate the variance of d'. It is important to notice that, when assuming independence between the zs, in seven among the 20 cases selected (35%) the SBP method underestimated the variance, and in 13 (65%) the variance was overestimated. So, in about two thirds of the cases \( {\rho}_{z_H{z}_F} \) was positive, and in about one third it was negative. In any specific sample of studies selected for a meta-analysis, the average correlation will depend of the sample of values of J.
Limitations of the procedure: The independence issue
The main limitation of the present procedure arises from the assumption of linear independence between πH and πF. As we already noted, when heterogeneity is observed between participants, it is quite reasonable to assume that there is independence between the parameters δ and C. Moreover, in the context of SDT, whether there is heterogeneity or not, a key issue is the independence between sensitivity and the response criterion, since they represent different psychological processes. In practical circumstances, the assumption of linear independence between πH and πF cannot generally be true (Suero et al., 2018); zero is only one among all possible values for the correlation.
Following Suero et al. (2018), it was shown that if δ and C are continuous random variables with finite values for μδ, μC, \( {\sigma}_{\delta}^2 \), \( {\sigma}_C^2 \), and ρδC = 0, then the correlation between the zs associated with πH and πF is
From Eq. 11 it can be concluded that in general \( {\rho}_{\pi_H{\pi}_F}\ne 0 \) (see Suero et al., 2018). Although the cited authors do not offer a formula to calculate \( {\rho}_{\pi_H{\pi}_F} \), it can be obtained by numerical methods.
The correlation between πH and πF is obtained through the generation of pairs of values of δi and Ci, where the subscript i refers to the ith individual. From these, the values of zH and zF are obtained through the expressions
With these values, and remembering that the normal homoscedastic SDT model is assumed, we obtain
Thus, with a large number of pairs of δi and Ci, the correlation \( {\rho}_{\pi_H{\pi}_F} \) can be estimated. For this calculation, it is first necessary to give values to the parameters μδ, μC, \( {\sigma}_C^2 \), and \( {\sigma}_{\delta}^2 \). To reduce the number of parameters involved, we can express the parameter \( {\sigma}_{\delta}^2 \) as a function of the parameter \( {\sigma}_C^2 \) through the ratio \( J=\frac{\sigma_{\delta}^2}{\sigma_C^2} \). Hence, Eq. 11 is equivalent to
Note that when J = 0, there is no variability in δ (all participants share the same sensitivity value), but there is in C (\( {\sigma}_C^2>0 \)), and the correlation is 1. When J = 4 (the variance of δ is four times the variance of C), the correlation is 0. Of course, when the variances are equal (J = 1), the correlation is .6.
When J takes on values greater than 4, the correlation is negative. When J tends to infinity, the correlation tends to – 1. A more practical way to consider negative values is to consider the reciprocal ratio, \( \frac{\sigma_C^2}{\sigma_{\delta}^2} \), and apply it in Eq. 16. If the reciprocal ratio takes on values in the range [0, 0.25], the correlation takes on values within the interval [– 1, 0]. It is easy to see that when there is no variability in C, the correlation is – 1. This case would indicate that the participants differed only in sensitivity.
In short, when ρδC = 0, the correlation between the zs (and between the πs) is a consequence of the heterogeneity of δ and/or C. Our formulas in the previous section are accurate only in the particular case that \( {\sigma}_{\delta}^2 \) is four times \( {\sigma}_C^2 \), as only then does \( {\rho}_{z_H{z}_F}={\rho}_{\pi_H{\pi}_F}=0 \).
Table 5 shows the values of the correlation \( {\rho}_{\pi_H{\pi}_F} \) (from combinations of values of the other parameters) that were employed in the simulation study presented in a subsequent section. They have been obtained as follows. It is assumed that variable C follows a normal distribution and that the variable δ follows a single, truncated normal distribution to avoid negative values, with a lower truncated point at δ = 0. Through an R script (written by the authors), 100,000 pairs of independent values of δi and Ci were generated. Applying Eqs. 12 to 15, we had 100,000 pairs of probabilities for hit and false alarm, from which the correlation was obtained. It can be observed in Table 5 that for the chosen values of μδ, μC, J, and \( {\rho}_{z_H{z}_F} \), the correlations \( {\rho}_{\pi_H{\pi}_F} \) are not null, except when \( {\rho}_{z_H{z}_F}=0 \), where they are 0 in practical terms. In the range of situations adopted for the simulations, the assumption of independence of the probabilities of hit and false alarm was not generally met.
From what has been argued previously, it can be concluded that, if a meta-analysis is performed in which the participants in the primary studies are not homogeneous, even though they are independent in their values of δ and C, the assumption of independence between πH and πF does not generally hold. Then, it is necessary to ask, (a) How significant are changes in the variance of d' when applying the procedure described here, if πH and πF are correlated?, and (b) How much do the conclusions change when based on meta-analyses performed using the procedure described in this article? The simulation studies described next will help answer these questions.
Simulation studies
Simulating the variance of d'
The objective was to assess the consequences of violating the assumption of independence between πH and πF for the value of \( {S}_{d^{\prime}}^2 \) when it was calculated from the means and variances of the H and F rates by means of the SBP procedure. The degree to which the assumption is not met depends on the value of the correlation \( {\rho}_{z_H{z}_F} \), expressed as a function of the ratio between \( {\sigma}_{\delta}^2 \) and \( {\sigma}_C^2 \), represented by J (see Table 1).
Procedure
We simulated primary studies performed with samples of individuals of variable size (see below). Each participant in the sample was defined by a pair of values of δ and C. Once this pair of independent values was randomly generated, the values of zH and zF were obtained through Eqs. 12 and 13, and πH and πF were obtained by means of Eqs. 14 and 15. Then the frequency of hits, H, was extracted from a binomial distribution, Binomial(NS; πH), where NS is the number of signal trials. Similarly, the frequency of false alarms, F, was extracted from a binomial distribution, where NN is the number of noise trials. Once the H and F values for each individual had been obtained, the values of PH and PF were calculated. Then, within each study we calculated \( \overline{P_H} \), \( {S}_{P_H}^2 \), \( \overline{P_F} \), and \( {S}_{P_F}^2 \).
For generating the values of δ and C, the following variables were manipulated: μδ, μC, and \( {\rho}_{z_H{z}_F} \). As we indicated above, it is assumed that C follows a normal distribution, whereas δ follows a single truncated normal distribution in order to avoid negative values, with the lower truncated point equal to 0. The value of the correlation \( {\rho}_{z_H{z}_F} \) can be obtained from the value of the ratio J. In this case, the value of σC was kept constant at .30. The values of the correlations were obtained by giving set values to J (or, implicitly, to \( {\sigma}_{\delta}^2 \)).
The sample size of each primary study was variable. To determine its value for each primary study, we employed the distribution suggested by Rubio-Aparicio, Marín-Martínez, Sánchez-Meca, and López-López (2018). Finally, the numbers of signal (NS) and noise (NN) trials were also manipulated. Table 6 shows the values of the manipulated variables. Combining all of them, we had a total of 160 conditions. Each condition was repeated 10,000 times.
First we extracted 100,000 pairs of frequencies, and after calculating their d' values (Macmillan & Creelman, 2005), we obtained the means and variances. Those values were taken as the true parametric values, \( {\mu}_{d^{\prime }} \) and \( {\sigma}_{d^{\prime}}^2 \). We used these two values for comparisons in this and the next simulation study. For each primary simulated study, we estimated the variance with the SBP procedure. Specifically, for the sample of individuals within each primary study, we obtained \( \overline{P_H} \), \( {S}_{P_H}^2 \), \( \overline{P_F} \), and \( {S}_{P_F}^2 \). With those four values plus NS and NN, we applied the procedure described above by means of the R script in Appendix C, obtaining \( {S}_{d^{\prime };\mathrm{SBP}}^2 \). Then, with the 10,000 values of \( {S}_{d^{\prime };\mathrm{SBP}}^2 \) and the parametric value, \( {\sigma}_{d^{\prime}}^2 \), we assessed the performance of the SBP procedure. With the results of the 10,000 replications within each condition, we calculated the bias as follows:
Results and discussion
The main results are shown in Fig. 1. The bias increases as \( {\rho}_{z_H{z}_F} \) increases, but is within an acceptable range when \( {\rho}_{z_H{z}_F} \) is below .333. It also increases as μδ increases and as NS (NN) decreases. Even so, we will see after describing the second simulation study and the final study that the method can still be useful for our goals.

Bias in the conditions employed in Simulation Study 1 (\( \overline{{\widehat{\sigma}}_{d^{\prime };\mathrm{SBP}}^2}-{\sigma}_{d^{\prime}}^2 \))
Meta-analysis simulation
Objective
It must be remembered that one of the main reasons for developing the present version of the SBP procedure was for performing meta-analyses of SDT indexes from primary studies that do not report descriptive statistics for d' and/or c, especially their variances, but that do report the means and variances of the rates of H and F.
However, taking into account the results of the previous simulation, it is worth asking whether, despite the discrepancy between the values of \( {S}_{d^{\prime}}^2 \) and \( {S}_{d^{\prime };\mathrm{SBP}}^2 \), it is reasonable to perform meta-analyses applying the SBP procedure. Specifically, the objective was to study the consequences that such an application would have on the results of a meta-analysis when the assumption of independence between πH and πF in the primary studies included was not fulfilled. The degree to which the assumption is not met will depend on the value of the correlation \( {\rho}_{z_H{z}_F} \), which in turns depends on J (the \( {\sigma}_{\delta}^2/{\sigma}_C^2 \) ratio).
Procedure
In this study, meta-analyses were simulated, by first generating primary studies and then grouping them into sets of K studies that were synthesized using meta-analytical techniques. The primary studies were generated using the same procedure as in the previous study. For the size of the meta-analyses, we set two values of K: 20 and 40 studies. Table 6 shows the values of the manipulated variables, totaling 320 conditions. Again, each condition was repeated 10,000 times. Notice that in this study the unity repeated 10,000 times was the meta-analysis (each composed of 20 or 40 studies). Remember that we had also obtained in the previous study the parametric value of \( {\mu}_{d^{\prime }} \).
Meta-analysis
Each repetition with a condition was formed by the K primary studies with which each meta-analysis was carried out. This was done as follows:
- Step 1:
For each primary study, the R script in Appendix C was applied, taking as input the values \( \overline{P_H} \), \( {S}_{P_H}^2 \), \( \overline{P_F} \), and \( {S}_{P_F}^2 \), obtaining the estimated values \( {\overline{d}}^{\prime } \) and \( {S}_{d^{\prime };\mathrm{SBP}}^2 \) for each study. At the end of this step, we had pairs of the statistics (\( \overline{d_k^{\prime }} \), \( {S}_{k,{d}^{\prime };\mathrm{SBP}}^2 \)), where k takes values from 1 to K.
- Step 2:
We obtained an estimate of \( {\mu}_{d^{\prime }} \) through the following weighted mean (Hedges & Olkin, 1985),
where \( {\widehat{w}}_k \) is the weight associated with the primary study k, which equals \( {\widehat{w}}_k=1/{S}_{k,{d}^{\prime };\mathrm{SBP}}^2 \). Note that both \( \overline{d_k^{\prime }} \) and \( {S}_{k,{d}^{\prime };\mathrm{SBP}}^2 \) were obtained by applying the SBP procedure with the R script in Appendix C.
- Step 3:
We calculated the limits of the confidence interval using the expression
\( {\widehat{\mu}}_{d^{\prime }}\pm \mid {z}_{1-\frac{\alpha }{2}}\mid \cdot \frac{1}{\sqrt{\sum \limits_k{\widehat{w}}_k}} \)
Data analysis
For each condition, the average of the 10,000 values of \( {\widehat{\mu}}_{d^{\prime }} \) was calculated (\( \overline{{\widehat{\mu}}_{d^{\prime }}} \)) and then compared with \( {\mu}_{d^{\prime }} \), the true mean of the individual d' values obtained in the previous study. The relative bias was calculated through the expression
Furthermore, the coverage was obtained for each condition. Given the value of \( {\mu}_{d^{\prime }} \) and the limits of the confidence intervals, coverage was obtained the proportion of times that those limits included the value of the parameter across the 10,000 replicas in that condition. We report the complementary value, (1 – coverage).
Results and discussion
We only present the results for K = 20, since when the number of primary studies was 40 the results were essentially identical. In Fig. 2 the results for estimation bias are presented for the different simulation conditions. In general, it can be observed that the bias takes values lower than 1%, except for the unlikely condition of \( {\rho}_{z_H{z}_F}=1 \). The maximum bias takes a value of – 4.71% in the condition of μδ = 2, μC = 0.5, \( {\rho}_{z_H{z}_F}=1 \), and 100 trials. Although in general the bias is low, it shows a tendency to increase for a value of \( {\rho}_{z_H{z}_F}=1 \), when μδ and μC increase. It does not appear that the number of trials is related to the size of the bias.

Relative bias in the conditions employed in Simulation Study 2: \( \left(\frac{\overline{{\widehat{\mu}}_{d^{\prime };\mathrm{SBP}}}-{\mu}_{d^{\prime }}}{\mu_{d^{\prime }}}\right)\bullet 100 \)
The small amount of bias when estimating \( {\mu}_{d^{\prime }} \) is not surprising. Formula 17 is a weighted mean of the averages of d' in each primary study, and the weights are the reciprocal of the variances. So, if our estimates of the variances of d' in the primary studies are biased, but all are biased in similar proportions, then the relative weights do not change. The mean weighted with the wrong variances will then give rise to a value very similar to the one found if unbiased estimates of the variance had been employed. It is expected that if the set of primary studies in a meta-analysis are homogeneous enough in their J and their \( {\rho}_{z_H{z}_F} \) values, then their biases when assuming J = 4 would tend to be similar.
Related to the coverage, Fig. 3 shows the proportions of times that the parameter fell outside the confidence interval (1 – coverage), for a nominal value of α = .05 (the gray lines). Values of the empirical proportions close to the nominal are observed when \( {\rho}_{z_H{z}_F} \) takes values between zero and .333 (J values between 2 and 4). The empirical proportions grow as the values of μδ and μC increase, being higher when \( {\rho}_{z_H{z}_F}=1 \). On the other hand, the empirical proportions are less than nominal when μδ is less than or equal to 1, for 25 trials; if the number of trials is equal to 50 or more, this value becomes equal to 1.5 or 2. Empirical values close to the nominal value are observed when \( {\rho}_{z_H{z}_F} \) takes values between zero and .333. The coverage rates are only unacceptable when both \( {\rho}_{z_H{z}_F} \) and μδ are high (in fact, when they reach values not credible in practical terms).

Proportions of times that the parameter fell outside the confidence interval, or the complement of the coverage, (1 – COV). The gray horizontal lines reflect the nominal value α = .05, or (1 – .95)
We have already said that the weighted mean estimated with incorrect (biased) variances can yield good results if the bias is proportional across studies. However, the confidence interval could produce odd results. That is because if the bias makes the estimates too large or too small, the confidence interval could also be too long or too narrow, respectively. However, our results showed that in fact the empirical rates of rejections do not deviate dramatically from the nominal 5%. This means that the true correlations between the zs are in general within a range in which the bias is small enough to be insignificant in practical terms.
As a conclusion, the simulation showed that the SBP procedure applied in a meta-analysis allows researchers to obtain reasonable estimates of μδ, even when the assumption of independence between the probabilities of H and F is not met (see Table 5). In most of the conditions studied, the small bias observed was within the range expected as a result of random sampling. With respect to the confidence intervals, it produced acceptable intervals for the range of parametric values that are credible in practical terms.
General discussion
The SBP method has been shown to be a viable solution to the problem of estimating the true variance of d' when measured in a sample of individuals who are heterogeneous in their performance. The same happens for the variance of c, since it is obtained directly from that of d' [since \( {d}^{\prime }={\widehat{z}}_H-{\widehat{z}}_F \) and \( c=-\left(1/2\right)\bullet \left({\widehat{z}}_H+{\widehat{z}}_F\right) \), then \( {\sigma}_c^2={\sigma}_{d^{\prime}}^2/4 \), because \( {\widehat{z}}_H \) and \( {\widehat{z}}_F \) are assumed to be independent]. Suero et al. (2018) showed in simulation studies that the procedure is effective in calculating estimates of the variance under a wide range of analytical scenarios. However, confidence in a method increases when it is also demonstrated, as in the present study, to be valid with real experimental data. In the sample of 20 experimental groups selected, the method proved to yield estimates much closer to the empirical variance than do methods that assume homogeneous individuals.
The results demonstrate the level of risk involved in blindly assuming homogeneity across participants. It is likely that this assumption is false, and failure to account for the existing heterogeneity can result in important errors in the subsequent calculations. Individual differences in the probabilities of responding YES to signal and noise trials are real and should not be ignored.
The original methods of Gourevitch and Galanter (1967) and, especially, of Miller (1996) are appropriate for estimating the variance of d' for a single point or a single individual. However, if the mean sample values of PH and PF are taken to estimate the variance of that sample of individuals and these individuals are not homogeneous, the variance of d' can be seriously underestimated. Until now we have not had a direct method to estimate the variance of d' in a sample of heterogeneous individuals. The method proposed by Suero et al. (2018) and the additional developments reported here essentially follow the ideas of Miller and adapt his method to the realistic situation in which observers do not share the same probability of giving a YES response to signal and/or noise trials.
The main limitations of this research derive from its assumptions. First, the assumed scenario is somewhat restrictive (e.g., it assumes the normal homoscedastic model for the strength of evidence in the calculation of individual values of d'; Wickens, 2001, chap. 2). Second, the method assumes a specific solution to the problem of extreme values of proportions (0.0 or 1.0). Finally, it also assumes that the individual probabilities of H and F (πH and πF) are linearly independent. A fault in one or more of these assumptions might be the cause of the sometimes striking discrepancies between the results obtained with our procedure and the actual empirical variance (e.g., in the Tanner et al., 1967, study the estimated variance was twice the empirical variance). In the next section we discuss in greater depth the last assumption and some suggestions to handle it in practical applications.
Managing the assumption of independence between zH and zF
For anyone familiar with SDT the assumption of independence between the zs, on the one hand, and between the πs, on the other, sounds odd. In the situation we studied here, independence represents something different from what we usually think in the SDT endeavor. Normally, we think in terms of a fixed value of d' and a c value that shifts as a consequence of the experimental manipulations. Of course, when this happens, a large positive correlation is observed between the zs and also between the πs.
But the situation we studied here is different. It does not concern individuals with constant sensitivity and changing criteria. The only assumption of independence that we made was between the true or parametric values of the individuals in sensitivity and criteria (δ and C). A random sample of individuals will include some with high or low sensitivities, and some with high or low criteria, depending on how liberal they are in making YES responses. But there is no theoretical reason or empirical evidence to suggest that these two dimensions would be related. That is, individuals with high sensitivity might in turn be equally conservative or liberal, and the same applies to those with low sensitivity. Therefore, assuming ρδC = 0 does not seem odd.
As we have already explained, once it is assumed that ρδC = 0, the correlations between the zs and the πs are a consequence of the presence of heterogeneity among the observers in δ and/or C, as well as the ratio between their variances. We developed a method to calculate the variance of d' in the specific case in which the ratio between the variances is 4, since that takes us to the concrete value of \( {\rho}_{z_H{z}_F}=0 \), which facilitates the calculations. We should expect \( {\sigma}_{\delta}^2 \) to be (almost) always greater than \( {\sigma}_C^2 \).Footnote 3 Fortunately, the value 4 has been a good guess of what an average value could be.
For example, since \( {d}^{\prime }={\widehat{z}}_H-{\widehat{z}}_F \), the variance of the sensitivity index can be expressed as \( {\sigma}_{d^{\prime}}^2={\sigma}_{{\widehat{z}}_H}^2+{\sigma}_{{\widehat{z}}_F}^2-2{\sigma}_{{\widehat{z}}_H{\widehat{z}}_F} \). If πH and πF were not independent, but there was instead a positive correlation between them, then the SBP procedure would give rise to somewhat larger estimates. In the sample of studies analyzed in section 3, the average value of the ratios between the empirical variance and the one produced by this method was equal to 0.88 (7 above 1 and 13 below 1). If the mean value of the ratio \( J={\sigma}_{\delta}^2/{\sigma}_C^2 \) was approximately 0.88, the mean correlation between the zs in this sample of studies would have been approximately .12. Adding this term to the variances estimated by the SBP method in all these studies, the mean ratio would be equal to 1, so that the mean of the variances obtained by the SBP procedure would be equal to the mean of the empirical variances. We believe that the observed discrepancies between the estimated and empirical variances reported here are most likely due to departures from some of the assumptions involved in the SBP method. The six cases that reported \( {S}_c^2 \) provide evidence that the discrepancies originate in the correlation between the zs, which in turn originates in ratios J other than 4. It is expected that in the sample of studies selected for a meta-analysis, the K values of J would be more homogeneous than in the casual sample in Table 3 (which includes studies in attention, perception, and recognition memory). They would most likely be larger or smaller than 4, depending on the experimental paradigm and the task. If a subset of those studies provided \( {S}_{d^{\prime}}^2 \) (as in the meta-analysis by Rhodes & Anastasi, 2012), then that subsample could be employed to correct the variances estimated with the SBP procedure for the other studies. Specifically, if we were to estimate the variance of d' with the SBP method in that subset of studies and compare them with the empirical variances, we could calculate the mean deviation or the mean ratio between the empirical and the estimated variances. The mean deviation or the mean ratio could be used to correct the estimated variances of the studies that did not report the variance of d'.
In summary, the use of the procedures described here is an interim solution, which should be refined in future work. Of course, the variances in d' predicted by our method in the sample of studies selected here are better than those that would be obtained assuming homogeneity. When our methods are used, the estimated variances may still sometimes differ from the empirical ones, but the discrepancies will seldom if ever be statistically significant. There is also a proportionality between the estimates and the empirical variances: The correlation between the two in our sample of 20 groups or conditions was .84. Therefore, if used to weight the primary studies synthesized in a meta-analysis, the combined estimates will not differ much from what would have been obtained through use of the empirical variances of d'. This is because of the structure of Formula 17, in which if the weights employed are wrong but are proportional to the correct weights, then the formula yields the same value.
Notes
The issue of variability in the parameters can be taken even beyond the differences between individuals, since there is evidence that a given observer can also change within the same session in his or her sensitivity and can, above all, shift his or her response criteria (Treisman, 1987; Treisman & Faulkner, 1984, 1985; Treisman & Williams, 1984). Here we assume unique parametric values for each individual, either because the sensitivity and criteria are stable within the session or because we only consider an average value that in some way represents the whole session.
With one-tailed tests, the results were essentially the same.
One of the reviewers rightly indicated that this relationship could be reversed in some specific fields (\( {\sigma}_C^2>{\sigma}_{\delta}^2 \)). For example, in the study of subliminal perception, variations in delta may be small, whereas almost all experimental variations will usually be associated with the response criterion. In cases in which it is suspected that this circumstance is present, the procedure we propose here should not be applied without adjustments.
References
Aleman, A., Hijman, R., de Haan, E. H., & Kahn, R. S. (1999). Memory impairment in schizophrenia: a meta-analysis. American Journal of Psychiatry, 156, 1358–1366.
Bora, E., Yucel, M., & Pantelis, C. (2009). Cognitive endophenotypes of bipolar disorder: A meta-analysis of neuropsychological deficits in euthymic patients and their first-degree relatives. Journal of Affective Disorders, 113, 1–20.
Borenstein, M., Hedges, L. V., Higgins, J. P. T., & Rothstein, H. R. (2009). Introduction to meta-analysis, Chichester, UK: Wiley.
Brown, G. S., & White, K. G. (2005). The optimal correction for estimating extreme discriminability. Behavior Research Methods, 37, 436–449. https://doi.org/10.3758/BF03192712
Bröder, A., & Schütz, J. (2009). Recognition ROCs are curvilinear—or are they? On premature arguments against the two-high-threshold model of recognition. Journal of Experimental Psychology: Learning, Memory, and Cognition, 35, 587–606. https://doi.org/10.1037/a0015279
Cooper, H. M., Hedges, L. V., & Valentine, J. C. (2009). The handbook of research synthesis and meta-analysis (2nd ed.). New York, NY: Russell Sage Foundation.
Dobbins, I. G., & Kroll, N. E. A. (2005). Distinctiveness and the recognition mirror effect: Evidence for an item-based criterion placement heuristic. Journal of Experimental Psychology: Learning, Memory, and Cognition, 31, 1186–1198. https://doi.org/10.1037/0278-7393.31.6.1186
Ennis, D. M., & Bi, J. (1998). The beta-binomial model: Accounting for inter-trial variation in replicated difference and preference tests. Journal of Sensory Studies, 13, 389–412.
Fett, A. K. J., Viechtbauer, W., Penn, D. L., van Os, J., & Krabbendam, L. (2011). The relationship between neurocognition and social cognition with functional outcomes in schizophrenia: A meta-analysis. Neuroscience & Biobehavioral Reviews, 35, 573–588.
Gourevitch, V., & Galanter, E. (1967). A significance test for one parameter isosensitivity functions. Psychometrika, 32, 25–33.
Green, D. M., & Swets, J. A. (1966). Signal detection theory and psychophysics. New York, NY: Wiley.
Hautus, M. J., & Lee, A. (2006). Estimating sensitivity and bias in a yes/no task. British Journal of Mathematical and Statistical Psychology, 59, 257–273.
Hays, W. L. (1988). Statistics (4th ed.). Philadelphia, PA: Holt, Rinehart & Winston.
Hedges, L. V., & Olkin, I. (1985). Statistical methods for meta-analysis. Orlando, FL: Academic Press.
Higham, P. A., Perfect, T. J., & Bruno, D. (2009). Investigating strength and frequency effects in recognition memory using type-2 signal detection theory. Journal of Experimental Psychology: Learning, Memory, and Cognition, 35, 57–80. https://doi.org/10.1037/a0013865
Hooks, K., Milich, R., & Lorch, E. P. (1994). Sustained and selective attention in boys with attention deficit hyperactivity disorder. Journal of Clinical Child Psychology, 23, 69–77. https://doi.org/10.1207/s15374424jccp2301_9
Johnson, N. L., Kemp, A. W., & Kotz, S. (2005). Univariate discrete distributions (3rd ed.). Hoboken, NJ: Wiley.
Johnson, N. L., Kotz, S., & Balakrishnan, N. (1995). Continuous univariate distributions (2nd ed., Vol. 2). Hoboken, NJ: Wiley.
Kleinman, J. C. (1973). Proportions with extraneous variance: Single and independent samples. Journal of the American Statistical Association, 68, 46–54.
Macmillan, N. A., & Creelman, C. D. (2005). Detection theory: A user’s guide (2nd ed.). Mahwah, NJ: Erlbaum.
Matthews, G., Jones, D. M., & Chamberlain, A. G. (1989). Interactive effects of extraversion and arousal on attentional task performance: Multiple resources or encoding processes. Journal of Personality and Social Psychology, 56, 629–639.
Miller, J. (1996). The sampling distribution of d'. Perception & Psychophysics, 58, 65–72. https://doi.org/10.3758/BF03205476
Murdock, B. B., Jr., & Ogilvie, J. C. (1968). Binomial variability in short-term memory. Psychological Bulletin, 70, 256–260. https://doi.org/10.1037/h0026259
Nuechterlein, K. H., & Asarnow, R. F. (1992). Manual and computer program for the UCLA Continuous Performance Test: Version 4. Los Angeles, CA: University of California, Los Angeles.
R Core Team. (2015). R: A language and environment for statistical computing. Vienna, Austria: R Foundation for Statistical Computing. Retrieved from www.R-project.org
Rhodes, M. G., & Anastasi, J. S. (2012). The own-age bias in face recognition: A meta-analytic and theoretical review. Psychological Bulletin, 138, 146–174. https://doi.org/10.1037/a0025750
Rhodes, M. G., & Jacoby, L. L. (2007). On the dynamic nature of response criterion in recognition memory: Effects of base rate, awareness, and feedback. Journal of Experimental Psychology: Learning, Memory, and Cognition, 33, 305–320. https://doi.org/10.1037/0278-7393.33.2.305
Roitman, S. E., Cornblatt, B. A., Bergman, A., Obuchowski, M., Mitropoulou, V., Keefe, R. S., . . . Siever, L. J. (1997). Attentional functioning in schizotypal personality disorder. American Journal of Psychiatry, 154, 655–660.
Rosvold, H. E., Mirsky, A. F., Sarason, I., Bransome, E. D., Jr., & Beck, L. H. (1956). A continuous performance test of brain damage. Journal of Consulting Psychology, 20, 343–350.
Rotello, C. M. (2017). Signal detection theories of recognition memory. In J. T. Wixted (ed.), Learning and memory: A comprehensive reference (pp. 201–225). Amsterdam: Elsevier. https://doi.org/10.1016/B978-0-12-809324-5.21044-4
Rubio-Aparicio, M., Marín-Martínez, F., Sánchez-Meca, J., & López-López, J. A. (2018). A methodological review of meta-analyses of the effectiveness of clinical psychology treatments. Behavior Research Methods, 50, 2057–2073. https://doi.org/10.3758/s13428-017-0973-8
Skellam, J. G. (1948). A probability distribution derived from the binomial distribution by regarding the probability of success as variable between the sets of trials. Journal of the Royal Statistical Society: Series B, 10, 257–261.
Snodgrass, J. G., & Corwin, J. (1988). Pragmatics of measuring recognition memory: Applications to dementia and amnesia. Journal of Experimental Psychology: General, 117, 34–50. https://doi.org/10.1037/0096-3445.117.1.34
Suero, M., Botella, J., & Privado, J. (2018). Estimating the expected value and variance of SDT indexes with heterogeneous individuals. Journal of Mathematical Psychology, 83, 12–23.
Suero, M., Privado, J., & Botella, J. (2017). Methods to estimate the variance of some indices of the signal detection theory: A simulation study. Psicológica, 18, 149–175.
Tanner, T. A., Jr., Haller, R. W., & Atkinson, R. C. (1967). Signal recognition as influenced by presentation schedules. Perception & Psychophysics, 2, 349–358. https://doi.org/10.3758/BF03210070
Treisman, M. (1987). Effects of the setting and adjustment of decision criteria on psychophysical performance. In E. E. Roskam & R. Suck (Eds.), Progress in mathematical psychology (pp. 253–297). New York, NY: Elsevier Science.
Treisman, M., & Faulkner, A. (1984). The setting and maintenance of criteria representing levels of confidence. Journal of Experimental Psychology: Human Perception and Performance, 10, 119–139. https://doi.org/10.1037/0096-1523.10.1.119
Treisman, M., & Faulkner, A. (1985). Can decision criteria interchange locations? Some positive evidence. Journal of Experimental Psychology: Human Perception and Performance, 11, 187–208. https://doi.org/10.1037/0096-1523.11.2.187
Treisman, M., & Williams, T. C. (1984). A theory of criterion setting with an application to sequential dependencies. Psychological Review, 91, 68–111. https://doi.org/10.1037/0033-295X.91.1.68
Wickens, T. D. (2001). Elementary signal detection theory. New York, NY: Oxford University Press.
Author information
Authors and Affiliations
Corresponding author
Additional information
Author Note
This research was supported by the Ministerio de Economia y Competitividad of Spain (project reference: PSI2013-45513). The paper has greatly benefited from discussions with James F. Juola, who helped to polish the draft, and from two anonymous reviewers of BRM.
.Publisher’s note
Springer Nature remains neutral with regard to jurisdictional claims in published maps and institutional affiliations.
Appendices
Appendix A: Formulas taken from Suero et al. (2018)
Since d' = ẑH – ẑF, the variance of d' is
where \( {\sigma}_{{\widehat{z}}_H}^2 \) is the variance of the estimated z values for hits, \( {\widehat{z}}_H \), while \( {\sigma}_{{\widehat{z}}_F}^2 \) is the variance of the estimated z values for false alarms, \( {\widehat{z}}_F \), and \( {\sigma}_{{\widehat{z}}_H{\widehat{z}}_F} \) is the covariance. Following Suero et al. (2018), both \( {\sigma}_{{\widehat{z}}_H}^2 \) and \( {\sigma}_{{\widehat{z}}_F}^2 \) can be obtained through the equations
where \( E\left({\widehat{z}}_H\right) \) and \( E\left({\widehat{z}}_F\right) \) are the expected values, which are calculated through the equations
Appendix B
We begin with the equation
Note that the expression within the integral is a mixture of two distributions: one binomial distribution with parameters N and π, and the g distribution, associated with the parameter π of the binomial distribution (see Johnson et al., 2005, p. 253). Note also that it is similar to the integrals that appear in Eqs. A2 to A5. If it is assumed that g(π) is a beta density function (see Eq. 3), then Eq. B1 is
Grouping terms with respect to π and extracting the constant values with respect to the integral,
If you multiply and divide by the term B(p + j, q + N − j),
Note that the expression within the integral corresponds to a beta distribution with parameters (p + j) and (q + N – j). Since the integral includes the entire domain of the density function, then the integral is equal to 1, and Eq. B1 is equivalent to
which, in terms of the gamma function Γ, is equal to
Note that Eq. B5 is a beta–binomial distribution.
Appendix C: R code to estimate the expected value and the variance of d' with the SBP method


Rights and permissions
About this article

Cite this article
Botella, J., Suero, M. Recovering the variance of d' from hit and false alarm statistics. Behav Res 52, 1–22 (2020). https://doi.org/10.3758/s13428-018-1181-x
Published:
Issue Date:
DOI: https://doi.org/10.3758/s13428-018-1181-x