
Abstract
Metrics are discussed which are used for the evaluation of bioequivalence of modified-release formulations. In order to ensure the therapeutic equivalence of the compared drug products, it would be important to contrast measures which are additional to area under the curve (AUC) and C max. For delayed-release products, the assessment of lag times is informative. For extended-release dosage forms, comparisons of the half-value duration and the midpoint duration time are useful. For some modified-release formulations with complicated, multiphasic concentration profiles, the comparison of partial AUCs is important. In determinations of the bioequivalence of extended-release dosage forms, investigations performed under steady-state conditions rather than after single dosing can yield enhanced probability of therapeutic equivalence, especially with substantial accumulation of the drug products. In steady-state investigations of bioequivalence, evaluation of the trough concentration and of the peak trough fluctuation is informative.
INTRODUCTION
Investigations of bioequivalence (BE) rely on the statistical comparison of metrics between two drug products. The important, primary metrics are almost always the maximum plasma concentration (C max) and the area under the curve (AUC) contrasting the concentration with time. For both primary metrics, regulators most often require that the 90% confidence interval around the ratio of the estimated geometric means between the contrasted drug formulations be between 0.80 and 1.25.
It is generally assumed that if two drug products are pharmaceutically equivalent, then demonstration of their bioequivalence implies also their therapeutic equivalence (1,2). Application of BE as a surrogate for therapeutic equivalence has been often stated for drug products having simple absorption and elimination kinetics and non-complicated modes of administration.
However, it is not always clear if, under some other conditions, therapeutic equivalence does in fact follow from a statement of bioequivalence. In some cases, differences in therapeutic and/or adverse effects were demonstrated between drug products which had been considered to be bioequivalent by the traditional primary metrics (3–6).
Current North American regulatory requirements for determining the BE of modified-release (MR) (or controlled release) formulations generally expect single-dose studies and the evaluation of the primary metrics, AUC and C max (1,7). Thus, these regulatory expectations are, at present, the same for MR and immediate-release (IR) formulations. However, the currently valid European guideline on the BE of MR products still requires, in some cases, steady-state studies (8).
This is in contrast with the approach in the 1990s when the BE of MR drug products was expected to be assessed, at least under some conditions, in the steady state. Reasonably, investigations of BE metrics to be used for evaluating the BE of MR formulations were undertaken in the same period (9–12). Recently, however, an FDA document (13) as well as a recent paper (14) raised questions whether the primary metrics for determining the BE are sufficient, in a class of MR products, to ensure therapeutic equivalence?
The purpose of the present communication is to ask the same question, generally, about MR metrics and about BE investigations involving MR products. Measures for the assessment of BE will be reviewed and updated, and their suitability and effectiveness for the determination of BE will be presented. Recommendations will be offered for metrics to be used for evaluating the BE of MR formulations.
Only single metrics characterizing various features of the concentration vs. time curves will be discussed. Approaches directly comparing concentration profiles will not be considered.
MODIFIED-RELEASE FORMULATIONS
The goal of MR formulations is to reduce the peak-to-trough fluctuations of drug concentrations and, consequently, enable the less frequent administration of the drug. This is generally accomplished by lowering the rate of drug release and thereby that of drug absorption.
Smaller fluctuations could result in lower peak concentrations and a reduction of the incidence and/or intensity of adverse events (8). Less frequent drug administration could improve patient compliance.
Delayed-release (DR) products release the active drug not immediately but only some time following drug administration. Extended-release (ER) dosage forms release the drug more slowly than the immediate-release product and yield typically a long period of plateau concentration. However, terminologies are not harmonized. ER formulations are also referred to as prolonged-release products.
Figure 1 illustrates schematic concentration profiles of delayed-release and extended-release formulations in comparison with that of an immediate-release product. Carefully controlled delivery of drugs may be accomplished by some products containing combinations of IR, DR, and/or ER components. For instance, some multiphasic modified-release products typically contain an IR component which ensures substantial drug concentrations soon after administration, whereas an ER component maintains the concentration for a long period. Metrics for other forms of oral MR dosage forms, including chrono-release, pulsatile-release, and targeted delivery products, will not be considered.

Typical concentration profiles of modified-release drug products. a Concentrations of delayed- and immediate-release formulations. b Concentrations of extended- and immediate-release formulations
METRICS USED IN ASSESSMENTS OF BIOEQUIVALENCE
Primary Metrics
As noted earlier, AUC and C max are the most important, primary metrics in BE investigations. There are two main reasons for this. First, they are regarded as measures of the extent and rate of drug absorption to the site of action, respectively, not only because of pharmacokinetic considerations (1) but also as required by the laws of the USA (15). The pharmacokinetic considerations are appropriate about AUC but somewhat questionable in regard to C max (16). The second reason for the important roles of AUC and C max is that they relate to the efficacy and toxicity of drugs and, thus, they provide measures of the total and peak exposure to the drug, respectively (17).
Following single-dose administration, AUC can be evaluated, usually by applying the trapezoidal and/or log-trapezoidal rule, until the last measurable observation (AUCTlast) and also extrapolated to a time of infinity (AUCinf). FDA and EMA expect that the regulatory requirements be satisfied for both AUCTlast and AUCinf whereas Health Canada expects the demonstration of BE only with AUCTlast but not with AUCinf (18,19).
In steady-state investigations, AUC is evaluated within a dosing interval (AUCτ). Hereafter, AUCTlast, AUCinf, and AUCτ will be referred to simply as AUC.
Apart of questions of interpreting C max as an index of drug release, its estimate may reflect poorly its true value. This is particularly true in the case of MR formulations with poorly defined or multiple concentration peaks for which C max can be overestimated (20). This calls attention to considering other concentration-related metrics.
Metrics Related to Concentrations in Single-Dose Studies
Additional metrics suggested for the evaluation of the BE of MR products are listed below. First, metrics related to concentrations will be presented. The list is not exhaustive, other proposals have also been offered but not followed up.
-
Partial AUC (pAUC) was proposed for evaluating BE when it was important to compare responses having early onset (21). In other words, pAUC has served as an index of early exposure (17).
FDA recently suggested that pAUC be used also for assessing the BE of some multiphasic MR products (13,14,22,23). The applications of pAUC in determinations of BE will be discussed in greater detail later.
-
The ratio of the primary metrics Cmax and AUC (C max/AUC) was proposed in order to obtain a clearer reflection of the rate of absorption by separating the often correlated effects of C max and AUC (24). Thereby, the variation of the metric is reduced and the sensitivity of discrimination in the BE investigations is enhanced (25). Based on a detailed review and analysis, the metric could be a better rate characteristic in single-dose studies (26,27).
-
The area under the moment curve (AUMC) contrasts the product concentration × time with time. It is generally less stable than AUC (27,28).
-
The apical concentration (C apical) is the arithmetic mean of concentrations at some level (e.g., 25% or 50%) below C max (29). It relies on several concentrations, and consequently is moderately more robust than C max.
-
The concentration at the end of the intended dosing interval (Cτ) was proposed recently (30). It will be discussed further later.
With the exception of the application of partial AUCs for multiphasic MR products, the listed concentration-related metrics can be used for the determination of BE of both immediate- and modified-release formulations.
With immediate-release preparations, the assessment of BE emphasizes the comparison between two drug products, of total and peak exposures and, at times, of early exposure, i.e., the contrasts of AUC, C max, and pAUC. Each of these metrics compares concentrations and their behavior.
However, the concentration profiles of MR formulations are often more complicated. They may not be defined sufficiently by concentration-related features (the vertical aspects in concentration vs. time plots) but may necessitate specifications also in the horizontal time scale. Therefore, greater attention needs to be directed, in determinations of BE of MR products, to time-related metrics. They will be considered in the next section.
Metrics Related to Time in Single-Dose Studies
The following metrics pay particular attention to time, the horizontal axis of concentration profiles:
-
The peak time (T max), i.e., the time required to reach the maximum concentration, has been the most frequently presented time-related metric. Comparison of peak times in BE studies can be performed by nonparametric calculations (31,32).
However, the usefulness of peak times greatly diminishes when trying to characterize some MR formulations. Care must be taken when T max (and C max) is interpreted with concentration profiles having multiple peaks and MR preparations containing multiple components. Furthermore, the uncertainty of the recorded T max renders it practically useless with the wide, almost flat peaks observed with extended-release formulations.
-
The mean residence time (MRT = AUMC/AUC) has the merit of relying on all measurements. However, the measure is not sensitive for the assessment of BE (28). A special case of the metric is the mean absorption time; however, its determination necessitates an additional study with intravenous administration or a solution.
-
The lag time (T lag) is a useful metric for characterizing the concentration behavior of delayed-release formulations. The BE of two drug products can be questioned if they exhibit differing delays in the initial rise of concentrations, i.e., if they have different lag times.
-
The peak occupancy time (POT) or plateau time is the time span during which the concentration is at some, clinically specified level (e.g., 25% or 50%) below C max thereby yielding the metrics T75%C max and T50%C max (33). T50%C max has also been referred to as the half-value duration (HaVD) (34). These metrics are important for characterizing and comparing concentration profiles of MR formulations and will be considered later. (The notation of HVD is used in the literature to represent the half-value duration. However, the same acronym has been applied in recent years to indicate highly variable drugs. Therefore, the notation HaVD is applied here for the half-value duration.)
-
The midpoint duration time (MDT) could be defined as the midpoint of the half-value duration (Fig. 2). Unlike T max, it could robustly identify the time of action even for extended-release drug products and could serve as a tool for nonparametric comparisons.
Fig. 2 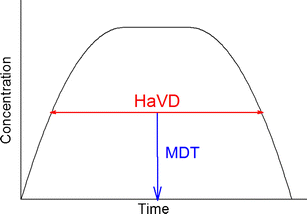
Evaluation of the metrics half-value duration (HaVD) and midpoint of duration time (MDT) after a single drug administration. HaVD is determined, in each subject, as the length between initially rising and finally decreasing concentrations at the level of 0.5 C max. MDT is recorded at the middle of this length. Comparisons of HaVD and MDT can be evaluated by nonparametric calculations

Altogether, time-related metrics have increased importance in the evaluation of BE for MR drug products. For delayed-release formulations, the comparison of lag times could be meaningful. For extended-release formulations, a measure of the duration of the concentration peak such as HaVD should be important. For locating the peak on the time axis, the median duration time could be useful.
Bialer et al. (12) evaluated the performances of several metrics for comparing three MR formulations of carbamazepine. C max/AUC and T75%C max showed good discrimination and, to a lesser extent, so did C apical and MRT. In contrast, C max and Tmax were considered “inaccurate or even irrelevant for rate of absorption assessment”.
Metrics in Steady State
FDA and Health Canada recommend nowadays that BE for MR be generally investigated after a single drug administration (1,7). The rationale for this preference will be discussed and contested below. In any case, investigations performed in multiple-dose studies, in the steady state, are still entertained under some conditions. Therefore, metrics recommended for BE studies in the steady state will be summarized.
Several metrics used in single-administration studies can be applied also in steady-state investigations. They include AUC, C max, T max, C max/AUC, partial AUC, the peak occupancy time (including the half-value duration), and the midpoint duration time. However, the properties and, in some cases, the definitions of these metrics would differ in single-administration and steady-state studies. Some features of C max will be considered in the next section.
For instance, concentration peaks of extended-release products are often even wider and flatter in steady state than after a single drug administration. Consequently, the estimated T max has very large variation (20) and is practically useless. Under these circumstances, the alternative time-related metrics become even more important. For example, AUC, C max, and metrics of fluctuation (see below) were similar for two extended-release preparations of theophylline which had very different concentration profiles (similar to those of the shapes of the “Table” and “Matterhorn” mountains). The metric T75%C max clearly distinguished between the two formulations (35).
As mentioned, in steady-state analyses some of the metrics must be modified from their single-dose applications. AUC should be evaluated during a dosing period (AUCτ). Metrics of the peak occupancy time should take into account that the steady-state concentration peak is between its minimum and maximum. Therefore, the POT metrics need to be adjusted so that the time span is evaluated at the concentration level which is, in terms of the (C max − C trough ) distance, 25% or 50% below the peak of C max. (Here, C trough is the trough concentration, see below.) The procedure for adjusting the HaVD, 50% below C max and 50% above C trough in terms of their difference, is illustrated in Fig. 3.

Evaluation of the half-value duration (HaVD) in steady state. HaVD is determined as in Fig. 2 but at the level of (C max + C trough )/2 (i.e., at C trough + (C max − C trough )/2) and not simply at C max/2
Additional metrics in steady-state analyses include alternative definitions for the smallest concentration within a peak.
-
The concentration preceding dosing is measured just before the commencement of the dosing interval.
-
The trough concentration (C trough or C min+) is measured at the end of the dosing period. The guidance of FDA expects that the trough concentration, denoted in the guidance as C min, be used (1).
-
The minimum concentration (C min or C min,ss) is the smallest concentration measured during the dosing interval.
The minimum concentration, observed within a dosing period, is a clinically important measure of efficacy under steady-state conditions. However, it can be recorded, within and between subjects, at various times after the last drug administration and, consequently, its variation can be high. This could be the reason why some regulators require that the trough concentration be used as a metric for the smallest steady-state concentration in BE studies.
Further metrics in steady-state studies characterize the fluctuation of the concentrations. They include the following:
-
%AUC-fluctuation = 100(AUC[above C av] + AUC[below C av])/AUC (36). Here, the average concentration is C av = AUC/τ with the dosing interval of τ.
-
%Swing = 100(Cmax − C min)/C min (37).
-
%Peak-trough fluctuation (%PTF) (or degree of fluctuation (1)) = 100(C max − C min)/C av. As noted above, FDA recommends that C trough be applied here instead of C min (1).
%Swing was found to be very sensitive to changes and errors in C min and was, therefore, considered to be an awkward metric (38). %AUC-fluctuation was considered to have low power to discriminate between formulations (10,26). Therefore, the metric %PTF was considered to be a useful measure of concentration fluctuation (11,26). However, depending on the accumulation index, the true PTF can be estimated with a substantial upward bias which can even exceed 100% (20).
Altogether, in addition to the two primary metrics, AUC and C max, the determination of BE for MR formulations would benefit from evaluating further measures. For delayed-release products, the determination and comparison of lag times would be useful. For extended-release preparations, the generally flat peaks call for determination of alternative time-related metrics. The length of the peaks can be characterized by the peak occupancy time at the level of 75% or 50% of C max (the latter being the half-value duration). The location of the peak can be identified not by T max but by the midpoint duration time.
After repeated drug administrations, in the steady state, two additional features need to be considered. For the smallest concentration, the minimum concentration recorded during a dosing interval is clinically important. However, for the determination of BE, the trough concentration, determined at the end of the dosing period, is more appropriate. Among measures of concentration fluctuation, PTF (the peak trough fluctuation) appears to be the most reasonable.
SINGLE OR MULTIPLE DRUG ADMINISTRATION
FDA and Health Canada currently recommend that the BE of MR formulations be generally investigated in single-dosing studies (1,7). Only some conditions are excepted as when a single-dose investigation can be ethically not undertaken in healthy subjects and is not feasible in patients, or when the drug substance cannot be adequately analyzed after a single administration.
The reason for expecting single-dose studies is because they are generally more sensitive in assessing release of the drug substance from the drug product into the systemic circulation (1) or, more specifically, they are more sensitive in detecting differences in C max (19). These statements were substantiated by simulations, calculations, and the analysis of many BE studies (16,39–41). However, in Europe both single- and multiple-dose comparisons are required in BE investigations of MR products (8).
Arguments can be offered for stressing the importance of BE for MR products in the steady state. Gerhard Levy, a prominent pharmacokineticist, reasoned forcefully that BE investigations should be conducted, whenever possible, under relevant conditions (42). Consequently, studies should be generally performed in patients to whom the drug is provided, and in steady state.
Indeed, as noted in the “Introduction” section, declarations of BE are considered to be surrogates for statements of therapeutic equivalence. In most cases, this supposition is reasonable and correct (2). A report (43) stated, summarizing a recent workshop on standards for assuring the therapeutic equivalence of MR products, that “the current regulatory approaches and criteria for evaluation of bioequivalence are considered adequate to ensure therapeutic equivalence and interchangeability of drug products in conventional monophasic (or monolithic) MR products.”
A major concern of regulatory scientists is to be satisfied that the assumption is fulfilled. A notable example is the recent change of metrics that are required for determining the BE of some MR products with multiphasic concentration profiles. This condition will be discussed below.
To what extent do then statements of BE established from single-dose studies ensure the therapeutic equivalence of MR products? The question is important for drugs which accumulate following repeated administration and/or have nonlinear kinetics. A recent comparison of tacrolimus products illustrates the risk of extrapolating single-dose results in healthy volunteers to daily clinical settings (44).
Single-dose studies at times do not predict the lowest concentration at steady state which is important for the clinical effectiveness of a drug and the fluctuation of concentrations. It was recently demonstrated that steady-state studies can detect differences between formulations when single doses are not able to do so (45). Consequently, it is unclear whether, for these MR formulations, single-dose BE investigations fully ensure their therapeutic equivalence.
Moreover, the rationale of the regulatory authorities can be questioned at least in some cases. The comparative variation of C max after single and multiple dosings depends on the ratio of the variations of clearance and drug release (41,46). When drug release has higher variability than clearance, then the variation of C max is indeed lower following repeated than after single administration. However, conversely, when the variability of clearance is higher than that of drug release, then the variation of C max is in fact higher after multiple than following single administration (41,46). Moreover, multiple-dose studies for highly variable drugs do not always reduce, in comparison with single-dose investigations, the within-subject variation of either AUC or C max (47). Therefore, the assumption made by major regulatory agencies for recommending single-dosing BE studies for MR formulations is not always satisfied.
It was recently suggested that by evaluating the metric C τ (the concentration at the end of the intended dosing interval), in addition to AUC and C max, in single-dose studies, the need for multiple-dose investigations can be reduced and even avoided (30). However, another recent study found that C τ was, in some cases, not sensitive to detect differences between MR products and that multiple-dose studies rather than single-dose investigations were necessary to ensure therapeutic equivalence (45).
Altogether, a strong case can be made for determining the BE of accumulating MR products in the steady state in order to ensure their therapeutic equivalence. This was the approach followed by Health Canada until recently (48). Overall, steady-state studies could be considered with MR products particularly when they have high accumulation, when the variability is higher for clearance than for drug release, and when differing drug release characteristics of the two products would be amplified in the steady state, notably in differing minimum concentrations.
PARTIAL AUC FOR SOME MULTIPHASIC MR PRODUCTS
The metric partial AUC evaluates the AUC between two time points. Chen et al. (49) recently reviewed the applications of pAUC in investigations of BE. The two main applications involve the determination of pAUC for early-onset responses (21) and for concentrations reaching towards late times of the investigations. In the latter category, AUCs are truncated at a time when concentrations can still be measured instead of being extrapolated to the time of infinity. Truncated AUCs are particularly important for assessing the BE of drug products with long half-lives (50,51).
In applying pAUC for early-onset responses, the initial time point is typically that of the drug administration. The second, closing time point can be set by following various approaches. FDA suggests to use the population median of T max of the reference product (1). Health Canada prefers the cutoff at the T max of the reference formulation calculated for each subject (7,18). Macheras et al. recommended that the cutoff time point be the earlier of the two T max’s (52). Similarly, cutoffs calculated to the earlier of the two T max’s, calculated for each subject, were found to have the most favorable properties (53).
The use of partial AUC has been recently considered for the assessment of BE of some MR formulations which have complicated concentration profiles. For instance, two methylphenidate products, Metadate CD and Concerta, have conspicuously differing shapes of concentration profiles. Nevertheless, the traditional metrics can indicate that the two preparations are bioequivalent (54). However, pAUCs discriminate strongly and sensitively between the two formulations. The same phenomenon was observed, and the same conclusions reached, when two formulations of MR nifedipine (55) and bupropion (56) were compared.
The concern of comparing concentration profiles of multiphasic MR formulations is illustrated in Fig. 4. Two composite concentration curves were constructed which assumed the same immediate-release and extended-release components but which contained differing ratios of these components. Moreover, the curves were adjusted so that both their AUCs and C max’s were the same. Still, the early phases of the concentration profiles are conspicuously different. Partial AUCs recorded in this phase can sensitively discriminate between the two drug products.

Multiphasic MR concentration profiles. Both illustrated “products” have the same immediate-release and extended-release components but in different proportions. The concentrations are adjusted so that both the AUCs and C maxs are the same for the two “drug products”. Nevertheless, the concentration profiles are very different especially in the early phase. The very different partial AUCs in the early phase can discriminate between the two “products”
The FDA has developed proposals to its Advisory Committee for the comparison of certain MR formulations with complicated, multiphasic concentration profiles (13). It considered that the preparations were composites of IR and ER components. It recommended that, in addition to the usual metric of C max, pAUC be determined from the time of zero until the time when most (about 95%) of the IR component was eliminated. Therefore, a cutoff time equaling the average T max of this component plus two standard deviations was suggested. In the case of methylphenidate, this resulted, with a T max of 1.5 h, in a cutoff at 3 and 4 h under fasting and fed conditions, respectively (13). It was further recommended that a complementary pAUC between these cutoff times and that of the last measurable concentration be also determined (13). These recommendations were recently implemented in a draft guidance for Ritalin LA (23).
A corresponding procedure was proposed for comparing multiphasic MR formulations of zolpidem tartrate. In was suggested that, in addition to C max, partial AUC be determined from the time of zero until 1.5 h, and also from 1.5 h to the time of the last measurable concentration (13,14). These recommendations were presented also in a recent guidance (22). The recent FDA investigation demonstrating the appropriateness of new metrics in the case of zolpidem is an outstanding example for establishing new standards for the BE of MR products (14).
The addition of partial AUC as a metric of comparison substantially enhances the probability that determination of the BE of these MR formulations ensures their therapeutic equivalence (57). Thus, partial AUC has been usefully applied as a metric for the evaluation of BE of some multiphasic MR formulations. These developments serve as an excellent example of the effective use of an additional metric for MR products. Applications of further metrics, such as those recommended in this communication, should be considered.
CONCLUSION
For the determination of BE of MR products, the evaluation metrics additional to AUC and C max should be considered. For delayed-release formulations, the comparison of lag times is important. For extended-release formulations, the half-value duration and midpoint duration time are informative. For some multiphasic MR formulations, partial AUCs are relevant. For the assessment of BE of extended-release products, a strong case can be made for conducting multiple- rather than single-dose studies in order to ensure therapeutic equivalence, particularly when drug accumulation can be expected. In steady-state BE investigations, determination of the trough concentration and, as a measure of fluctuation, %PTF is important.
REFERENCES
FDA. Bioavailability and bioequivalence studies for orally administered drug products—general considerations: guidance for industry. Rockville: FDA, Center for Drug Evaluation and Research; 2003.
Nightingale SL (FDA Associate Commissioner for Health Affairs). Therapeutic equivalence of generic drugs—letter to health practitioners. January 28, 1998. http://www.fda.gov/Drugs/DevelopmentApprovalProcess/HowDrugsareDevelopedandApproved/ApprovalApplications/AbbreviatedNewDrugApplicationANDAGenerics/ucm073182.htm. Accessed 15 Feb 2012.
Kluznik JC, Walbek NH, Farnsworth MG, Melstrom K. Clinical effects of a randomized switch of patients from clozaril to generic clozapine. J Clin Psychiatry. 2001;62 Suppl 5:14–7.
Tothfalusi L, Speidl S, Endrenyi L. Exposure-response analysis reveals that clinically important toxicity difference can exist between bioequivalent carbamazepine tablets. Br J Clin Pharmacol. 2007;65:110–22.
Rosenthal J, Kong B, Jacobs L, et al. Did a switch to a generic antidepressant cause relapse? J Fam Pract. 2008;57:109–14.
Vial J, Cohen M, Sassiat P, Thiébaut D. Pharmaceutical quality of docetaxel generics versus originator drug product: a comparative analysis. Curr Med Res Opin. 2008;24:2019–33.
Health Canada. Guidance Document. Conduct and analysis of comparative bioavailability studies. Ottawa, Ontario: Health Canada, 2012. http://hc-sc.gc.ca/dhp-mps/alt_formats/pdf/prodpharma/applic-demande/guide-ld/bio/gd_cbs_ebc_ld-eng.pdf. Accessed 18 Jun 2012.
EMEA. Note for guidance on modified release oral and transdermal dosage forms: section II (pharmacokinetic and clinical evaluation). London: European Agency for the Evaluation of Medicinal Products, Committee for Proprietary Medicinal Products; 1999.
Steinijans VW. Pharmacokinetic characteristics of controlled release products and their biostatistical analysis. In: Gundert-Remy U, Moeller H, editors. Oral controlled release products—therapeutic and biopharmaceutic assessment. Stuttgart: Wissentschaftliche Verlagsgesellschaft; 1989. p. 99–115.
Steinijans VW. Pharmacokinetic characterization of controlled-release formulations. Eur J Drug Metab Pharmacokinet. 1990;15:173–81.
Schulz H-U, Steinijans VW. Striving for standards in bioequivalence assessment: a review. Int J Clin Pharmacol Ther Toxicol. 1991;29:293–8.
Bialer M, Arcavi L, Susann S, Volosov A, Yacobi A, Moros D, et al. Existing and new criteria for bioequivalence evaluation of new controlled release (CR) products of carbamazepine. Epilepsy Res. 1998;32:371–8.
FDA. Background information for the FDA Meeting of the Advisory Committee for Pharmaceutical Science and Clinical Pharmacology. Topic 2: Use of partial area under the curve (AUC) for the evaluation of abbreviated new drug applications (AND As) for products with complex pharmacokinetic profiles. Center for Drug Evaluation and Research. March 18, 2010. http://www.fda.gov/downloads/AdvisoryCommittees/CommitteesMeetingMaterials/Drugs/AdvisoryCommitteeforPharmaceuticalScienceandClinicalPharmacology/UCM207955.pdf. Accessed 15 Feb 2012.
Lionberger RA, Raw AS, Kim SH, Zhang X, Yu LX. Use of partial AUC to demonstrate bioequivalence of zolpidem tartrate extended release formulations. Pharm Res. 2012;29:1110–20.
Code of Federal Regulations. 21 CFR 320.1(e) and 320.23(b). http://www.accessdata.fda.gov/scripts/cdrh/cfdocs/cfcfr/CFRsearch.cfm?CFRPart=320. Accessed 15 Feb 2012.
Zha J, Tothfalusi L, Endrenyi L. Properties of metrics applied for the evaluation of bioequivalence. Drug Inf J. 1994;29:989–96.
Chen M-L, Lesko L, Williams RL. Measures of exposure versus measures of rate and extent of absorption. Clin Pharmacokinet. 2001;40:565–72.
Health Canada. Guidance for industry: conduct and analysis of bioavailability and bioequivalence studies—part A: oral dosage formulations used for systemic effects. Ottawa: Health Canada; 1992.
Health Canada. Guidance Document. Comparative bioavailability standards: formulations used for systemic effects. Ottawa, Ontario: Health Canada, 2012. http://hc-sc.gc.ca/dhp-mps/alt_formats/pdf/prodpharma/applic-demande/guide-ld/bio/gd_standards_ld_normes-eng.pdf. Accessed 18 Jun 2012.
Tothfalusi L, Endrenyi L. Estimation of Cmax and Tmax in populations after single and multiple drug administrations. J Pharmacokinet Pharmacodyn. 2003;30:363–85.
Chen M-L. An alternative approach for assessment of rate of absorption in bioequivalence studies. Pharm Res. 1992;9:1380–5.
FDA. Guidance on Zolpidem. Food and Drug Administration, Center for Drug Evaluation and Research (CDER) Rockville, MD. October, 2011. http://www.fda.gov/Drugs/GuidanceComplianceRegulatoryInformation/Guidances/ucm175029.pdf. Accessed 15 Feb 2012.
FDA. Draft Guidance on methylphenidate hydrochloride. Food and Drug Administration, Center for Drug Evaluation and Research (CDER) Rockville, MD. November, 2011. http://www.fda.gov/downloads/Drugs/GuidanceComplianceRegulatoryInformation/Guidances/UCM281454.pdf Accessed 15 Feb 2012.
Endrenyi L, Fritsch S, Wei Y. Cmax/AUC is a clearer measure than Cmax for absorption rates in investigations of bioequivalence. Int J Clin Pharmacol Ther Toxicol. 1991;29:394–9.
Endrenyi L, Yan W. Variation of Cmax and Cmax/AUC in investigations of bioequivalence. Int J Clin Pharmacol Ther Toxicol. 1993;31:184–9.
Steinijans VW, Hauschke D. Statistical analysis of bioequivalence studies. Int J Clin Pharmacol Ther Toxicol. 1992;30 Suppl 1:S45–50.
Hauschke D, Steinijans V, Pigeot I. Bioequivalence studies in drug development. London: Wiley; 2007.
Khoo KC, Gibaldi M, Brazzell RK. Comparison of statistical moment parameters to Cmax and Tmax for detecting in vivo dissolution rates. J Pharm Sci. 1985;74:1340–2.
Pollack PT, Freeman DJ, Carruthers SG. Mean apical concentration and duration in the comparative bioavailability of slowly absorbed and eliminated drug preparations. J Pharm Sci. 1988;77:477–80.
Paixao P, Gouveia LF, Morais JAG. An alternative single dose parameter to avoid the need for steady-state studies on oral extended-release drug products. Eur J Pharm Biopharm. 2012;80:410–7.
Hauschke D, Steinijans VW, Diletti E. A distribution-free procedure for the statistical analysis of bioequivalence studies. Int J Clin Pharmacol Ther Toxicol. 1990;28:72–8.
Basson RP, Cerimele HJ, DeSante KA, Howey DC. Tmax: an unconfounded metric for rate of absorption in single dose bioequivalence studies. Pharm Res. 1996;13:324–8.
Jonkman JHG, Berg WC, De Vries K, De Zeeuw RA, Schoenmaker R, Grimberg N. Disposition and clinical pharmacology of theophylline after administration of a new sustained release tablet. Eur J Clin Pharmacol. 1981;21:39–44.
Meier J, Nuesch E, Schmidt R. Pharmacokinetic criteria for the evaluation of retard formulations. Eur J Clin Pharmacol. 1974;7:429–32.
Steinijans VW, Sauter R, Diletti E. Shape analysis in single- and multiple-dose studies of modified-release products. In: Midha KK, Blume HH, editors. BioInternational 2: bioavailability, bioequivalence and pharmacokinetic studies. Stuttgart: Medpharm; 1995. p. 193–206.
Boxenbaum H. Pharmacokinetic determinants in the design and evaluation of sustained-release dosage forms. Pharm Res. 1984;2:82–8.
Skelly JP. Guidance for conducting studies on theophylline controlled release products. Rockville: Food and Drug Administration, Division of Biopharmaceutics (0928X-4/84); 1984.
Steinijans VW, Trautmann H, Johnson E, Beier W. Theophylline steady-state pharmacokinetics: recent concepts and their application in chronotherapy of reactive airway diseases. Chronobiol Int. 1987;4:331–47.
Jackson AJ. Prediction of steady-state bioequivalence relationships using single dose data I-linear kinetics. Biopharm Drug Dispos. 1987;8:483–96.
El-Tahtawy AA, Jackson AJ, Ludden TM. Comparison of single and multiple dose pharmacokinetics using clinical bioequivalence data and Monte Carlo simulations. Pharm Res. 1994;11:1330–6.
Zha J, Endrenyi L. Variation of the peak concentration following single and repeated drug administrations in investigations of bioavailability and bioequivalence. J Biopharm Stat. 1997;7:191–204.
Levy G. The clay feet of bioequivalence. J Pharm Pharmacol. 1995;47:975–7.
Chen M-L, Shah VP, Ganes D, Midha KK, Caro J, Nambiar P, et al. Challenges and opportunities in establishing scientific and regulatory standards for assuring therapeutic equivalence of modified-release products: workshop summary report. Eur J Pharm Sci. 2010;40:148–53.
Hougardy JM, de Jonge H, Kuypers D, Abramovicz D. The once-daily formulation of tacrolimus: a step forward in kidney transplantation? Transplantation. 2012;93:241–3.
Garcia-Arieta A, Morales-Alcelay S, Herranz M, de la Torre JM, Blazquez A, Suarez L, et al. Investigation on the need of multiple dose bioequivalence studies for prolonged-release generic products. Int J Pharm. 2012;423:321–5.
El-Tahtawy AA, Jackson AJ, Ludden TM. Evaluation of bioequivalence of highly variable drugs using Monte Carlo simulations. I. Estimation of rate of absorption for single and multiple dose trials using Cmax. Pharm Res. 1995;12:1635–41.
El-Tahtawy AA, Tozer TN, Harrison F, Lesko L, Williams R. Evaluation of bioequivalence of highly variable drugs using clinical trial simulations. II. Comparison of single and multiple dose trials using AUC and Cmax. Pharm Res. 1998;15:98–104.
Health Canada. Guidance for industry: conduct and analysis of bioavailability and bioequivalence studies—part B: oral modified release formulations. Ottawa: Health Canada; 1996.
Chen M-L, Davit B, Lionberger R, Wahba Z, Ahn H-Y, Yu LX. Using partial area for the evaluation of bioavailability and bioequivalence. Pharm Res. 2011;28:1939–47.
Endrenyi L, Tothfalusi L. Truncated AUC evaluates effectively the bioequivalence of drugs with long half-lives. Int J Clin Pharmacol Ther. 1997;35:142–50. 51.
Gaudreault J, Potvin D, Lavigne J, Lalonde RL. Truncated area under the curve as a measure of relative extent of bioavailability: evaluation using experimental data and Monte Carlo simulations. Pharm Res. 1998;15:1621–9.
Macheras P, Symillides M, Reppas C. The cutoff time point of the partial area method for assessment of rate absorption in bioequivalence studies. Pharm Res. 1994;11:831–4.
Endrenyi L, Csizmadia F, Tothfalusi L, Balch AH, Chen M-L. The duration of measuring partial AUCs for the assessment of bioequivalence. Pharm Res. 1998;15:399–404.
Gonzalez MA, Pentikis HS, Anderl N, Benedict MF, DeCory HH, Hirshey Dirksen SJ, et al. Methylphenidate bioavailability from two extended release formulations. Int J Clin Pharmacol Ther. 2002;40:175–84.
Anschütz M, Wonnemann M, Schug B, Toal C, Donath F, Pontius A, et al. Differences in bioavailability between 60 mg of nifedipine osmotic push–pull systems after fasting and fed administrations. Int J Clin Pharmacol Ther. 2010;48:158–70.
Midha KK, Rawson MJ, McKay G, Hubbard JW. Exposure measures applied to the bioequivalence of two sustained release formulations of bupropion. Int J Clin Pharmacol Ther. 2005;43:244–54.
Endrenyi L, Tothfalusi L. Do regulatory bioequivalence requirements adequately reflect the therapeutic equivalence of modified-release drug products? J Pharm Pharm Sci. 2010;13:107–13.
Open Access
This article is distributed under the terms of the Creative Commons Attribution License which permits any use, distribution, and reproduction in any medium, provided the original author(s) and the source are credited.
Author information
Authors and Affiliations
Corresponding author
Additional information
Guest Editors: James Polli, Jack Cook, Barbara Davit, and Paul Dickinson
Rights and permissions
Open Access This article is distributed under the terms of the Creative Commons Attribution 2.0 International License (https://creativecommons.org/licenses/by/2.0), which permits unrestricted use, distribution, and reproduction in any medium, provided the original work is properly cited.
About this article
Cite this article
Endrenyi, L., Tothfalusi, L. Metrics for the Evaluation of Bioequivalence of Modified-Release Formulations. AAPS J 14, 813–819 (2012). https://doi.org/10.1208/s12248-012-9396-8
Received:
Accepted:
Published:
Issue Date:
DOI: https://doi.org/10.1208/s12248-012-9396-8