
Abstract
Background
The number of dialysis patients with diabetes is currently increasing in Japan and a similar proportion worldwide. It was suggested that approximately 20% of these patients had hypoglycemia after dialysis session and most of these hypoglycemia were unconscious. Furthermore, it was suggested that glucose variabilities induced by hemodialysis may be related to insulin and insulin-counter hormones, such as glucagon, adrenocorticotropic hormone (ACTH), and cortisol and growth hormone, but conclusive evidence has not still been obtained.
Methods
We investigated in detail the glucose and hormonal profiles in 7 patients with type 2 diabetes on hemodialysis (all male, HbA1c 6.8 ± 2.1%, glycated albumin 24.7 ± 10.2%). All participants were attached continuous glucose monitoring (iPro2®). Blood glucose level, C-peptide immunoreactivity, plasma glucagon, ACTH, cortisol and growth hormone were measured by 7 points blood tests at before breakfast, after breakfast (predialysis), 2 h and 4 h after starting dialysis, after lunch and before/after dinner on the dialysis day and 6 points at before/after each meal on the non-dialysis day, and these relationship with blood glucose dynamics were examined. The meal contents were set to the indicated energy amount, and the same menu was served daily for breakfast, lunch, and dinner on dialysis and non-dialysis days of this study period. In addition, the start time of lunch on non-dialysis day was the same as the start time of lunch on the dialysis day.
Results
Serum C-peptide level was significantly increased by taking breakfast and lunch on the hemodialysis day, significantly decreased during hemodialysis, and was significantly lower before and after lunch on the hemodialysis day than on the non-hemodialysis day. Plasma glucagon level significantly decreased during hemodialysis and that before lunch on hemodialysis day was significantly lower than on non-hemodialysis day. ACTH, cortisol, and growth hormone did not show any changes related to hemodialysis.
Conclusions
It was suggested that C-peptide and glucagon play an important role in hemodialysis-related glycemic variabilities in patients with type 2 diabetic hemodialysis.
Trial registration UMIN Clinical Trial Registry (Registration Number UMIN000018707). Registered 18 August 2015, https://center6.umin.ac.jp/cgi-open-bin/ctr/ctr.cgi?function=brows&action=brows&type=summary&language=J&recptno=R000021647.
Background
Chronic kidney disease and type 2 diabetes are long-term conditions that are recognized as major public health concern in not only Japan but also worldwide. Furthermore, diabetes is currently the leading cause of end-stage kidney disease (ESKD) accounting for over 40% of new dialysis cases in Japan and a similar proportion worldwide. On the other hand, advances in hemodialysis (HD) medical treatments, interventions, and equipment surrounding HD patients extend the average age of chronic HD patients and it may be seen occasionally that HD patients whose primary kidney disease is not diabetic nephropathy also newly develop glucose metabolism abnormalities after HD initiation. The mortality of patients with diabetes with ESKD is worse than non-complicated patients with diabetes [1]. Although previous studies showed that strict glycemic control improved survival of patients with diabetes with ESKD [2, 3], however, because due to strict glycemic control is also a risk of macroangiopathy and fatal arrhythmia, it is necessary to control glycemic profiles with an understanding of glycemic and hormonal dynamics in patients with ESKD [4]. Cardiovascular disease and cerebral arterial disease are reported not only in hyperglycemic condition, but postprandial hyperglycemia, glycemic fluctuation, and hypoglycemia also contribute to onset/progression of arteriosclerosis diseases and mortality [5,6,7,8]. There is a U-shaped relationship between HbA1c and mortality, suggesting that hypoglycemia may be a reason for higher mortality in those with HbA1c levels < 6.5% [9,10,11,12]. Thus in patients with diabetes undergoing HD, simply reducing average blood glucose is not enough, suggesting that it is mandatory to control blood glucose according to the individual’s glycemic dynamics including reducing glycemic fluctuation and hypoglycemia avoidance. We reported the glycemic profiles using continuous glucose monitoring (CGM) in Japanese diabetic patients undergoing HD, and as a feature of glycemic dynamics, hypoglycemia after HD was approximately 20% and all of hypoglycemia were unconscious and that their glucose levels rise sharply due to dietary intake after HD. Furthermore, we reported that HbA1c and glycated albumin (GA) are reliable indicators for average glucose level and glycemic variability in type 2 diabetic patients on HD, respectively [13]. However, with these glycemic markers, it was difficult to detect the presence of hypoglycemia after HD and glycemic excursion after them. In other words, there is still unclear about the factors affecting specific blood glucose profile in patients with diabetes on HD. Previous studies have suggested that blood glucose elevation after HD may be related to decreased insulin secretion and insulin-counter hormones such as glucagon and cortisol, but conclusive evidence has not still been obtained [14, 15].
For these reasons, the aim of this study was to accurately determine the glycemic profile of patients with diabetes on HD using with CGM and to identify the endocrine hormone profiles, such insulin, glucan, and other insulin-counter hormones, which contribute to glycemic profiles.
Methods
Study design and patients
This study was registered with the UMIN Clinical Trial Registry (Registration Number UMIN000018707) and this study’s protocols were approved by Kitasato University Medical School Ethics Committee (B14-72), and informed consent was obtained from all participants. All study methods were performed in accordance with the relevant guidelines and regulations of Kitasato University Hospital as well as the Ethical Guidelines for Medical and Health Research Involving Human Subjects in Japan and under the Code of Ethics of the Helsinki Declaration. We performed power analysis based on the study data of glucagon measured by the new assay in participants with diabetes and normal glucose tolerance [16]. Since this power analysis was not appropriate for the other glucose-regulating hormone, we roughly estimated the sample size reviewing the previous studies of glucoregulatory peptide or gastrointestinal hormones [16,17,18,19] and using CGM [20, 21] in HD patients. Finally, for a pilot study, a minimum sample size of 7–10 cases was set based on previous studies. However, due to the small number of inpatients on HD and the termination of the CGM supplies and service used in this study, the study was terminated when 8 cases were recruited and one was excluded due to insufficient data. The participants were admitted type 2 diabetes mellitus patients, who received 4 h HD thrice weekly, and were enrolled at Kitasato University Hospital. Type 2 diabetes was defined by the American Diabetes Association criteria. Participants were confirmed to be free from any of the following excluding criteria: any infectious diseases, any accompanying conditions affecting hemoglobin and albumin metabolism/turnover, such as malignancy, liver cirrhosis, hematological disease, thyroid dysfunction, and pregnancy. All HD participants underwent dialysis thrice weekly of the admission. All participants agreed to perform at least 72 h CGM using Medtronic iPro2® CGM (Medtronic Minimed, Northridge, CA, USA) with ENLiTE sensor® (Medtronic Minimed, Northridge, CA, USA). Self-monitoring of capillary blood glucose using Medisafe FIT® (Terumo Corporation, Tokyo, Japan), accuracy requirements met ISO 15197, was performed at least four times a day, and these values were used to calibrate the CGM data. The CGM was attached after the dialysis conditions were stabilized and glycemic control was clinically judged stabilization by intermittent blood glucose measurement, and the CGM was attached in the morning of the day before HD day and was desorbed after about 72 h. Hypoglycemia was defined as below 63 mg/dL (3.5 mmol/L) of sensor glucose level (SGL) of CGM in accordance with previous studies [22, 23] and a valid hypoglycemia episode as a period of SGL below threshold for over 20 min [24]. The meal contents were set to the indicated energy amount (30–35 kcal/ideal body weight (kg)/day). Since we avoided the second meal effect [25], the same menu was served daily for breakfast, lunch, and dinner on HD and non-HD days of this study period. In addition, the start time of lunch on non-HD day was the same as the start time of lunch on the HD day. Information on family history, medical history, smoking history, physical history, other blood test findings, and clinical findings was extracted by interviews or medical records.
Biochemical measurement
Blood glucose level, C-peptide immunoreactivity (CPR), plasma glucagon, adrenocorticotropic hormone (ACTH), cortisol, growth hormone (GH) were measured by 7 points blood tests at before breakfast, after breakfast (predialysis), 2 h after starting HD, 4 h after starting HD (end of HD and before lunch), after lunch and before/after dinner on the HD day and 6 points at before/after each meal on the non-HD day, and these relationships with blood glucose dynamics were examined. Blood tests were performed in advance by placing a catheter for blood sampling on the contralateral upper extremity of the vascular access. CPR was measured with chemiluminescent enzyme immunoassay (CLEIA) method (Presto II, FUJIREBIO INC, Tokyo, Japan). Plasma glucagon was measured by glucagon enzyme-linked immunosorbent assay (ELISA) kit (Mercodia AB, Uppsala, Sweden). ACTH and cortisol were measured by eclusys ACTH Electro-chemiluminescence immunoassay (ECLIA) method (Roche Diagnostics K.K., Tokyo, Japan) and eclusys cortisol II ECLIA method (Roche Diagnostics K.K., Tokyo, Japan) with Cobas8000 (Roche Diagnostics K.K., Tokyo, Japan). GH was measured by ECLIA method (Roche Diagnostics K.K., Tokyo, Japan) with Cobas8000 (Roche Diagnostics K.K., Tokyo, Japan). GA was measured by enzymatic synthesis using automated system Lucica™ glycated albumin-L assay kit (Asahi Kasei Pharma, Japan, total analytic error [TAE] of intra-assay < 0.51).
Statistical analysis
Statistical analyses were carried out with GraphPad Prism 5.02 software (GraphPad Software Inc., San Diego, CA, USA) and JMP ver. 14 (SAS Institute, Cary, NC, USA). Data are presented as the mean ± standard deviation (SD) or median (minimum–maximum), unless otherwise indicated. The Wilcoxon signed-rank test was used to evaluate differences in ordinal data between 2 groups. p < 0.05 was considered to show statistical significance.
Results
Demography of the participants and clinical data
The demography of the participants is shown in Table 1. All participants were males. Average age was 62 ± 13 years, dry weight 69.6 ± 17.8 kg, duration of diabetes 23 ± 10 years, duration of HD 1.0 (0.5–30.0) months, HbA1c 6.8 ± 2.1%, and GA 24.7 ± 10.2%. Five patients took insulin therapy with or without oral hypoglycemic agents. Dipeptidyl peptidase-4 (DPP-4) inhibitor was prescribed in 3 patients (2 linagliptin and 1 teneligliptin) and glucagon-like peptide-1 (GLP-1) analog in 1 patients (dulaglutide). The dialysis mode for all participants is HD. The dialysate glucose concentration was 150 mg/dL in 2 and 125 mg/dL in 5 participants. Blood flow was 200 mL/min in 5, 230 mL/min in 1, and 250 mL/min in 1, dialysis fluid flow was 400 mL/min in 6 and 500 mL/min in 1, and dialysis membrane area was 1.8 m2 in 2, 1.9 m2 in 1, and 2.1 m2 in 4 participants.
The average sensor glucose level (SGL) and SD of SGL in 48 h CGM data, including HD day and non-HD day, were 156.1 ± 28.6 mg/dL and 41.9 ± 11.2 mg/dL, respectively. The average SGL and SD of SGL were 153.8 ± 27.1 mg/dL and 35.5 ± 13.4 mg/dL in HD day, respectively, and 158.4 ± 32.7 mg/dL and 48.2 ± 20.8 mg/dL in non-HD day, respectively. Two of them had hypoglycemic episodes in 48 h CGM data, and only 1 patient had hypoglycemic episode in the period from the end of HD to the next dietary intake (SGL < 40 mg/dL).
Glucose profile and various hormone profiles in HD day and non-HD day
Plasma glucose profile and various hormone profiles in each HD day and non-HD day are shown in Fig. 1. On comparing plasma glucose on HD day, we observed postprandial glucose excursions at breakfast (from 100.9 ± 8.5 to 173.9 ± 21.8 mg/dL [mean ± SE], p = 0.0223) and lunch (from 142.4 ± 13.7 mg/dL to 196.7 ± 18.5 mg/dL [mean ± SE], p = 0.0156) but not at dinner (from 179.0 ± 19.6 to 178.0 ± 23.9 mg/dL [mean ± SE]). There is no significant glucose change during HD time, but glucose level tended to decrease. On non-HD day, plasma glucose level after breakfast was significantly higher than before breakfast (219.1 ± 40.5 mg/dL, 110.9 ± 22.0 mg/dL [mean ± SE], p = 0.0313) and plasma glucose level before lunch was significant lower than after breakfast and after lunch (p = 0.0313 and p = 0.0313). Furthermore, on comparing between on HD day and non-HD day there is no significant difference at each time point (Fig. 1A). On comparing CPR level, postprandial CPR level increased by taking breakfast (from 4.50 ± 1.31 ng/mL to 7.92 ± 1.80 ng/dL [mean ± SE], p = 0.0156) and lunch (from 3.09 ± 0.80 to 5.07 ± 1.24 ng/mL [mean ± SE], p = 0.0156) but not by taking dinner (from 7.68 ± 2.16 to 8.67 ± 2.38 ng/dL [mean ± SE]). During HD, CPR level at 2 h and 4 h after starting HD was significantly lower than at predialysis (from 7.92 ± 1.80 ng/mL to 4.53 ± 1.09 ng/dL [mean ± SE], p = 0.0156, to 3.09 ± 0.80 ng/dL [mean ± SE], p = 0.0156) and CPR level at 4 h after starting HD was significantly lower than at 2 h after starting HD (p = 0.0156). On non-HD day, serum CPR level significantly increased from before breakfast to after breakfast (from 3.47 ± 0.81 to 8.03 ± 2.26 ng/dL [mean ± SE], p = 0.0313) and from after lunch to before dinner (from 8.39 ± 2.31 to 12.97 ± 4.54 ng/dL [mean ± SE], p = 0.0313). On comparing between on HD day and non-HD day, CPR level before and after lunch on HD day was significantly lower than that on non-HD day (p = 0.0156, p = 0.0156, respectively) (Fig. 1B). In plasma glucagon profile, on HD day plasma glucagon levels at 2 h and 4 h after starting HD were significantly lower than at predialysis (from 19.09 ± 3.53 pg/mL to 10.06 ± 1.61 pg/dL [mean ± SE], p = 0.0313, to 11.71 ± 1.71 pg/dL [mean ± SE], p = 0.0469), but there was no difference between 2 h and 4 h after starting HD. Furthermore, there was no difference between before and after each meal (Fig. 1C). Plasma glucagon level before lunch on HD day was significantly lower than on non-HD day (11.71 ± 1.71 pg/dL vs 18.33 ± 3.27 pg/dL, p = 0.0223) (Fig. 1C). ACTH, cortisol, and GH profiles are shown in Fig. 1D, E, respectively. ACTH level before dinner was lower than after lunch (p = 0.0469) on before dinner non-HD day. ACTH level before dinner on HD day was higher than on non-HD day (p = 0.0469). Cortisol level at 2 h after starting HD significantly decreased than at predialysis (p = 0.0469). ACTH level after dinner on HD day was higher than after dinner on non-HD day (p = 0.0156). GH level before lunch on HD day was lower than before lunch on non-HD day (p = 0.0469).
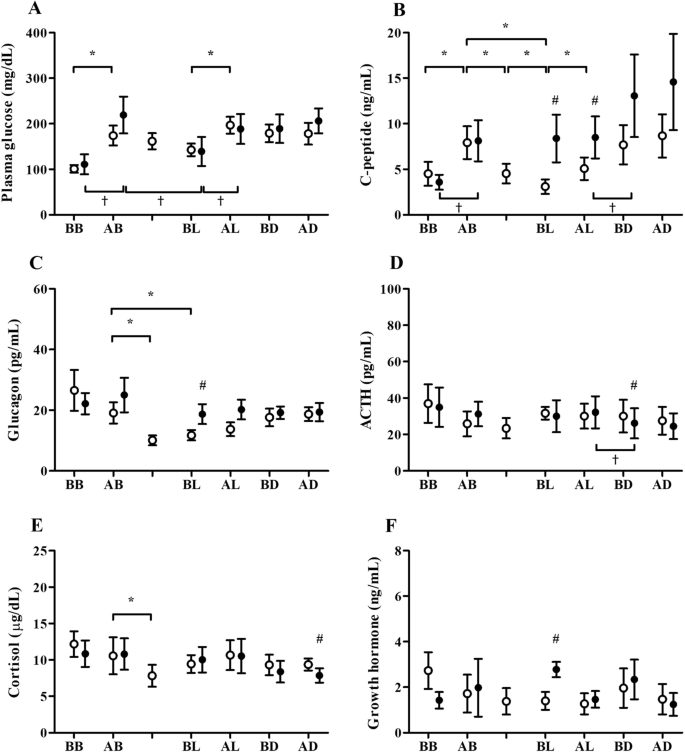
The daily profiles of plasma glucose (A), serum C-peptide (B), plasma glucagon (C), ACTH (D), cortisol (E) and growth hormone (F) in 7 patients with type 2 diabetes undergoing hemodialysis on hemodialysis day (open circle) and non-hemodialysis day (filled circle). *p < 0.05 on hemodialysis day by Wilcoxon signed-rank test; †p < 0.05 on non-hemodialysis day by Wilcoxon signed-rank test; #p < 0.05 derived from the comparison between hemodialysis day and non-hemodialysis day
Discussion
This is the first study in which a newly constructed and currently most accurate plasma glucagon assay system was used to clarify the hormonal profiles affected the blood glucose dynamics in HD patients, as well as to elucidate the relationship between HD-related hypoglycemia and the hormone kinetics by detailed blood glucose monitoring using CGM. In this study, we evaluated some endocrinological hormonal profiles contributing to the glucose dynamics in patients with type 2 diabetes undergoing HD. Although the number of patients with diabetes on HD has increased worldwide, HD-related glycemic variability and hormonal profiles in them remain unappreciated. This present study has revealed that HD-related glycemic disarrays are suggested not to depend on ACTH, cortisol, and GH but on endogenous insulin and glucagon.
Previous studies showed that HD-related hypoglycemia was caused by glucose-free dialysate [26, 27]. Presence of dialysate glucose, containing 100–150 mg/dL glucose, is believed to prevent intradialytic hypoglycemia [28]. Theoretically, plasma glucose level during HD is determined from the concentration gradient on the blood side and the dialysate side, and never lower than the glucose concentration added to the dialysate. However, in clinical situation, plasma glucose levels fall below the dialysate glucose levels during and after HD session, and some patients complain of hypoglycemic symptoms. Our previous study in diabetic patients undergoing HD showed that about 20% of them presented with hypoglycemia after HD and all of them revealed asymptomatic [29, 30]. The cause of this HD-related hypoglycemia has suggested abnormal response of insulin secretion and the reaction disorder of insulin-counter hormones such as glucagon, ACTH, and cortisol, but there was not sufficient evidence. In addition, until recently, it has been difficult to construct an accurate measurement system, especially for plasma glucagon, and it was difficult to determine how truly plasma glucagon affects the blood glucose profile in diabetic patients on HD.
During HD, CPR level and accurate measuring plasma glucagon level decrease but ACTH, cortisol, and GH levels did not change. As some previous studies showed [31,32,33], the lack of reciprocal elevation in plasma glucagon level relative to changes in plasma glucose and endogenous insulin concentration may suggest failing of the feedback system, related to the chronic low responsibility of insulin-counter hormones including plasma glucagon. In the glucose profiles in these patients, there was no significant glycemic daily variability in non-HD day, but there was a significant glycemic excursion before and after breakfast and before and after lunch (Fig. 1A). In addition, as reported in previous studies [29], blood glucose levels during HD gradually decreased from pre- to intermediate- and post-HD, although there was no significant difference in this study. Serum CPR reflected with insulin kinetics on HD day was significantly elevated from before to after breakfast and significantly decreased from pre- to intermediate-HD and from intermediate- to post-HD and significantly decreased before and after HD (Fig. 1B). This C-peptide kinetics suggests the removal of insulin and C-peptide by HD and a decrease in endogenous insulin secretion, negative feedback, due to the aforementioned hypoglycemia during HD. It may be able to be distinguished by conducting a glucagon load test and measuring CPR in dialysate [34]. However, glucagon kinetics tended to decrease from pre- to intermediate-HD and significantly decreased before and after HD. This is because, as mentioned above, under conditions where blood glucose tends to fall during HD, it was not the suppression of endogenous glucagon secretion but the removal of plasma glucagon by the dialysis membrane. In the daily variation of plasma glucagon on the HD day (Fig. 1C), it decreased significantly during HD. Furthermore, comparing the HD day and the non-HD day, plasma glucagon concentration before lunch, this point on HD day was after HD, was significantly lower on the HD day than the non-HD day. However, there are no fluctuations related to HD session or obvious differences between HD and non-HD days in the levels of ACTH, cortisol, and GH. Therefore, it was suggested that the dynamics of insulin/CPR and glucagon induced to the onset of HD-related hypoglycemia. That is, the blood glucose level tended to decrease during HD, insulin and CPR are removed and decreased during HD, and endogenous insulin secretion is also suppressed. On the other hand, it was suggested that plasma glucagon is also removed and decreases during HD, but it shows a low value after the end of HD, and plasma glucagon does not respond well to hypoglycemia, which causes blood glucose to further decrease in some cases. And although insulin was secreted by dietary intake after HD, glucagon was also secreted, which is considered to be the cause of a glucose excursion due to dietary intake after HD. On the other hand, it has been reported that patients with diabetes on HD are prone to glycemic excursion, HD-related hyperglycemia, due to food intake after dialysis and that HD-associated hyperglycemia may be associated with an increase in glucagon levels in response to HD-induced hypoglycemia [35]. HD-associated hyperglycemia was not found in the present study, but this may be because the patients were treated with incretin modulators. The number of cases was reduced, but when the two groups were divided into two groups by whether incretin modulators were used (N = 4) or not (N = 3), the group treated with incretin modulators had a smaller decrease in blood glucose before and after HD, 14.0 ± 23.8 mg/dL [mean ± SE], than the group not treated with incretin modulators, 54.7 ± 27.5 mg/dL [mean ± SE], and a smaller glucose excursion by meal after HD (52.3 ± 40.3 mg/dL [mean ± SE] vs 57.0 ± 15.1 mg/dL [mean ± SE]). In addition, the changes in CPR and glucagon by meal after HD were 8.84 ± 2.53 ng/mL [mean ± SE] and 0.73 ± 1.99 pg/mL [mean ± SE], respectively, in the group treated with incretin modulators and 6.69 ± 2.92 ng/mL [mean ± SE] and 3.77 ± 2.29 pg/mL [mean ± SE], respectively, in the group without incretin modulators, and it was suggested that insulin secretion by food intake after HD may be stimulated and glucagon secretion may be suppressed in the group treated with incretin modulators.
In this study, hypoglycemia after HD was observed by CGM in 1 of 7 cases. In this case with hypoglycemia after HD, the glucose level at the end of HD was 68 mg/dL and SGL by CGM at the same time was 42 mg/dL (the lowest glucose level during HD was 40 mg/dL, which is lower limit of measurement) (Fig. 2A). CPR level gradually decreased during HD and increased by lunch intake after HD, but the increase in CPR level was not enough compared to the degree of increase in blood glucose (Fig. 2B). Glucagon level also decreased during HD, slightly increased after lunch after HD, and continued to increase (Fig. 2C). It is suggested that such fluctuations in insulin/C-peptide and glucagon contribute to HD-related hypoglycemia and glucose excursion due to dietary intake after HD. Previous several studies showed that incretin modulators, such as DPP-4 inhibitors and GLP-1 analogs, improve the HD-related hypoglycemia and glycemic variability in patients with diabetes undergoing HD [36,37,38]. Our result could prove that the efficacy of using incretin modulators which intervene in the glucagon secretion response may be expected to improve the specific hemodynamics of diabetic patients on HD.

The profiles of glucose by CGM (curve line) and by blood samples (plots) (A), serum C-peptide (B), and plasma glucagon (C) in the case with hypoglycemia after HD
The limitations of the present study are that the sample size was small and some patients were in the introduction phase of HD. As previous studies suggest [39], glucose tolerance and insulin sensitivity may differ between patients on dialysis induction and those on chronic HD. Furthermore, this is an observation study using a univariate analysis without adjusting confounders and it may limit generalizability. Additionally, because this study included participants who had a short dialysis duration and had residual renal function, and it has been reported that plasma CPR was cleared by HD [40], their plasma CPR levels, measured as insulin secretion capacity, may be lower than those of anuric patients. In addition, we examined C-peptide, glucagon, ACTH, cortisol, and GH in this study, but other hormones involved in glucose hemodynamics, such as glucose-dependent insulinotropic polypeptide (GIP) and glucagon-like peptide-1 (GLP-1), have not been investigated. A further investigation involving a larger sample size including GIP and GLP-1 should be taken to establish the overall effectiveness in the incretin modulators for type 2 diabetes patients on HD.
Conclusion
In patients with type 2 diabetes on HD, it was suggested that ACTH, cortisol, and GH were not involved in HD-related glycemic fluctuations, including HD-related hypoglycemia, but that C-peptide and glucagon were involved.
Availability of data and materials
The datasets used and/or analyzed during the current study are available from the corresponding author on reasonable request.
References
de Jager DJ, Grootendorst DC, Jager KJ, van Dijk PC, Tomas LM, Ansell D, Collart F, Finne P, Heaf JG, De Meester J, Wetzels JF, Rosendaal FR, Dekker FW. Cardiovascular and noncardiovascular mortality among patients starting dialysis. JAMA. 2009;302:1782–9.
Morioka T, Emoto M, Tabata T, Shoji T, Tahara H, Kishimoto H, Ishimura E, Nishizawa Y. Glycemic control is a predictor of survival for diabetic patients on hemodialysis. Diabetes Care. 2001;24:909–13.
Villar E, Polkinghorne KR, Chang SH, Chadban SJ, McDonald SP. Effect of type 2 diabetes on mortality risk associated with end-stage kidney disease. Diabetologia. 2009;52:2536–41.
Desouza CV, Bolli GB, Fonseca V. Hypoglycemia, diabetes, and cardiovascular events. Diabetes Care. 2010;33:1389–94.
Glucose tolerance and mortality: comparison of WHO and American Diabetes Association diagnostic criteria. The DECODE study group. European Diabetes Epidemiology Group. Diabetes epidemiology: collaborative analysis of diagnostic criteria in Europe. Lancet. 1999;354:617–21.
Muggeo M, Zoppini G, Bonora E, Brun E, Bonadonna RC, Moghetti P, Verlato G. Fasting plasma glucose variability predicts 10-year survival of type 2 diabetic patients: the Verona Diabetes Study. Diabetes Care. 2000;23:45–50.
Zoungas S, Patel A, Chalmers J, de Galan BE, Li Q, Billot L, Woodward M, Ninomiya T, Neal B, MacMahon S, Grobbee DE, Kengne AP, Marre M, Heller S. Severe hypoglycemia and risks of vascular events and death. N Engl J Med. 2010;363:1410–8.
Su G, Mi SH, Li Z, Tao H, Yang HX, Zheng H. Prognostic value of early in-hospital glycemic excursion in elderly patients with acute myocardial infarction. Cardiovasc Diabetol. 2013;12:33.
Kalantar-Zadeh K. A critical evaluation of glycated protein parameters in advanced nephropathy: a matter of life or death: A1C remains the gold standard outcome predictor in diabetic dialysis patients. Counterpoint Diabetes Care. 2012;35:1625–8.
Ramirez SP, McCullough KP, Thumma JR, Nelson RG, Morgenstern H, Gillespie BW, Inaba M, Jacobson SH, Vanholder R, Pisoni RL, Port FK, Robinson BM. Hemoglobin A(1c) levels and mortality in the diabetic hemodialysis population: findings from the dialysis outcomes and practice patterns study (DOPPS). Diabetes Care. 2012;35:2527–32.
Ricks J, Molnar MZ, Kovesdy CP, Shah A, Nissenson AR, Williams M, Kalantar-Zadeh K. Glycemic control and cardiovascular mortality in hemodialysis patients with diabetes: a 6-year cohort study. Diabetes. 2012;61:708–15.
Shurraw S, Hemmelgarn B, Lin M, Majumdar SR, Klarenbach S, Manns B, Bello A, James M, Turin TC, Tonelli M. Association between glycemic control and adverse outcomes in people with diabetes mellitus and chronic kidney disease: a population-based cohort study. Arch Intern Med. 2011;171:1920–7.
Hayashi A, Takano K, Masaki T, Yoshino S, Ogawa A, Shichiri M. Distinct biomarker roles for HbA1c and glycated albumin in patients with type 2 diabetes on hemodialysis. J Diabetes Complicat. 2016;30:1494–9.
Abe M, Kaizu K, Matsumoto K. Evaluation of the hemodialysis-induced changes in plasma glucose and insulin concentrations in diabetic patients: comparison between the hemodialysis and non-hemodialysis days. Ther Apher Dial. 2007;11:288–95.
Abe M, Kaizu K, Matsumoto K. Plasma insulin is removed by hemodialysis: evaluation of the relation between plasma insulin and glucose by using a dialysate with or without glucose. Ther Apher Dial. 2007;11:280–7.
Ichikawa R, Takano K, Fujimoto K, Motomiya T, Kobayashi M, Kitamura T, Shichiri M. Basal glucagon hypersecretion and response to oral glucose load in prediabetes and mild type 2 diabetes. Endocr J. 2019;66:663–75.
Bailey T, Bode BW, Christiansen MP, Klaff LJ, Alva S. The performance and usability of a factory-calibrated flash glucose monitoring system. Diabetes Technol Ther. 2015;17:787–94.
Fernandez-Reyes MJ, Sanchez R, Garcia L, Grande C, Codoceo R, Heras M, Iglesias P, Velasco S, Molina A, Gutierrez C, Alvarez-Ude F. Acute responses of gastrointestinal hormones to both oral and parenteral intradialytic nutrition. Am J Nephrol. 2010;32:272–8.
Jorgensen MB, Idorn T, Knop FK, Holst JJ, Hornum M, Feldt-Rasmussen B. Clearance of glucoregulatory peptide hormones during haemodialysis and haemodiafiltration in non-diabetic end-stage renal disease patients. Nephrol Dial Transpl. 2015;30:513–20.
Kazempour-Ardebili S, Lecamwasam VL, Dassanyake T, Frankel AH, Tam FW, Dornhorst A, Frost G, Turner JJ. Assessing glycemic control in maintenance hemodialysis patients with type 2 diabetes. Diabetes Care. 2009;32:1137–42.
Riveline JP, Teynie J, Belmouaz S, Franc S, Dardari D, Bauwens M, Caudwell V, Ragot S, Bridoux F, Charpentier G, Marechaud R, Hadjadj S. Glycaemic control in type 2 diabetic patients on chronic haemodialysis: use of a continuous glucose monitoring system. Nephrol Dial Transpl. 2009;24:2866–71.
Gill GV, Woodward A, Casson IF, Weston PJ. Cardiac arrhythmia and nocturnal hypoglycaemia in type 1 diabetes–the “dead in bed” syndrome revisited. Diabetologia. 2009;52:42–5.
Chow E, Bernjak A, Williams S, Fawdry RA, Hibbert S, Freeman J, Sheridan PJ, Heller SR. Risk of cardiac arrhythmias during hypoglycemia in patients with type 2 diabetes and cardiovascular risk. Diabetes. 2014;63:1738–47.
UK Hypoglycaemia Study Group. Risk of hypoglycaemia in types 1 and 2 diabetes: effects of treatment modalities and their duration. Diabetologia. 2007;50:1140–7.
Nakamura Y, Sanematsu K, Ohta R, Shirosaki S, Koyano K, Nonaka K, Shigemura N, Ninomiya Y. Diurnal variation of human sweet taste recognition thresholds is correlated with plasma leptin levels. Diabetes. 2008;57:2661–5.
Jackson MA, Holland MR, Nicholas J, Talbot M, Spencer H, Lodwick R, Fuhrmann C, Forster D, Macdonald IA. Occult hypoglycemia caused by hemodialysis. Clin Nephrol. 1999;51:242–7.
Jackson MA, Holland MR, Nicholas J, Lodwick R, Forster D, Macdonald IA. Hemodialysis-induced hypoglycemia in diabetic patients. Clin Nephrol. 2000;54:30–4.
Burmeister JE, Scapini A, da Rosa MD, da Costa MG, Campos BM. Glucose-added dialysis fluid prevents asymptomatic hypoglycaemia in regular haemodialysis. Nephrol Dial Transpl. 2007;22:1184–9.
Hayashi A, Moriya T, Ogawa A, Yoshino S, Kishihara E, Ogawa J, Yamagishi T, Shichiri M. Glycemic profiles in japanese diabetic patinetes on hemodialysis assessed by continuous glucose monitoring. J Jpn Diab Soc. 2012;55:681–7.
Hayashi A, Shimizu N, Suzuki A, Matoba K, Momozono A, Masaki T, Ogawa A, Moriguchi I, Takano K, Kobayashi N, Shichiri M. Hemodialysis-related glycemic disarray proven by continuous glucose monitoring: glycemic markers and hypoglycemia. Diabetes Care. 2021;44:1647–56.
Johannsson G, Ahlmen J. End-stage renal disease: endocrine aspects of treatment. Growth Hormone IGF Res. 2003;13 Suppl A:S94–101.
Kokot F, Wiecek A, Grzeszczak W, Klepacka J, Klin M, Lao M. Endocrine abnormalities in patients with endstage renal failure. Adv Exp Med Biol. 1989;260:61–7.
Luger A, Lang I, Kovarik J, Stummvoll HK, Templ H. Abnormalities in the hypothalamic-pituitary-adrenocortical axis in patients with chronic renal failure. Am J Kidney Dis. 1987;9:51–4.
Tuttle KR, Bakris GL, Bilous RW, Chiang JL, de Boer IH, Goldstein-Fuchs J, Hirsch IB, Kalantar-Zadeh K, Narva AS, Navaneethan SD, Neumiller JJ, Patel UD, Ratner RE, Whaley-Connell AT, Molitch ME. Diabetic kidney disease: a report from an ADA consensus conference. Diabetes Care. 2014;37:2864–83.
Abe M, Kalantar-Zadeh K. Haemodialysis-induced hypoglycaemia and glycaemic disarrays. Nat Rev Nephrol. 2015;11:302–13.
Ishikawa-Tanaka T, Hosojima M, Kabasawa H, Kaseda R, Yasukawa R, Yata Y, Kuwahara S, Kono E, Takata T, Iino N, Tanaka T, Kitamura N, Suzuki Y, Saito A, Narita I. Effects of DPP-4 inhibitors on blood glucose variability in Japanese patients with type 2 diabetes on maintenance hemodialysis: a prospective observational exploratory study. Diabetes Ther. 2020;11:2845.
Osonoi T, Saito M, Tamasawa A, Ishida H, Tsujino D, Nishimura R, Utsunomiya K. Effect of hemodialysis on plasma glucose profile and plasma level of liraglutide in patients with type 2 diabetes mellitus and end-stage renal disease: a pilot study. PLoS ONE. 2014;9:e113468.
Yajima T, Yajima K, Hayashi M, Takahashi H, Yasuda K. Improved glycemic control with once-weekly dulaglutide in addition to insulin therapy in type 2 diabetes mellitus patients on hemodialysis evaluated by continuous glucose monitoring. J Diabetes Complicat. 2018;32:310–5.
Mak RH. Impact of end-stage renal disease and dialysis on glycemic control. Semin Dial. 2000;13:4–8.
Abe M, Okada K, Matsumoto K. Plasma insulin and C-peptide concentrations in diabetic patients undergoing hemodialysis: comparison with five types of high-flux dialyzer membranes. Diabetes Res Clin Pract. 2008;82:e17–9.
Acknowledgements
We would like to thank registered dietitians of Department of Nutrition, Kitasato University Hospital, for serving the special meals in this study.
Funding
This work was supported in part by a grant from Japanese Association of Dialysis Physicians (JADP Grant No. 30014) and a grant from Terumo Life Science Foundation (21-III5030). The funding body had no role in the study design, data collection/analysis, decision to publish, or preparation of the manuscript.
Author information
Authors and Affiliations
Contributions
AH and MS designed this study. AH, KM, YO, NS, AS, SF, and MS collected the clinical information and blood sampling. AH, KT, and MS analyzed the data and drafted the manuscript. All authors revised the paper, and all authors approved the final version of the manuscript.
Corresponding author
Ethics declarations
Ethics approval and consent to participate
This study was registered with the UMIN Clinical Trial Registry (Registration Number UMIN000018707) and this study’s protocols were approved by Kitasato University Medical School Ethics Committee (B14-72), and informed consent was obtained from all participants. All study methods were performed in accordance with the relevant guidelines and regulations of Kitasato University Hospital as well as the Ethical Guidelines for Medical and Health Research Involving Human Subjects in Japan and under the Code of Ethics of the Helsinki Declaration.
Consent for publication
Not applicable.
Competing interests
A.H. reports speaker honoraria from Medtronic, Abbott, Terumo, Roche; research grants from Abbott and Roche outside of the submitted work. N.S. reports speaker honoraria from Medtronic. The authors report no other potential conflicts of interest relevant to this article.
Additional information
Publisher's Note
Springer Nature remains neutral with regard to jurisdictional claims in published maps and institutional affiliations.
Rights and permissions
Open Access This article is licensed under a Creative Commons Attribution 4.0 International License, which permits use, sharing, adaptation, distribution and reproduction in any medium or format, as long as you give appropriate credit to the original author(s) and the source, provide a link to the Creative Commons licence, and indicate if changes were made. The images or other third party material in this article are included in the article's Creative Commons licence, unless indicated otherwise in a credit line to the material. If material is not included in the article's Creative Commons licence and your intended use is not permitted by statutory regulation or exceeds the permitted use, you will need to obtain permission directly from the copyright holder. To view a copy of this licence, visit http://creativecommons.org/licenses/by/4.0/. The Creative Commons Public Domain Dedication waiver (http://creativecommons.org/publicdomain/zero/1.0/) applies to the data made available in this article, unless otherwise stated in a credit line to the data.
About this article

Cite this article
Hayashi, A., Matoba, K., Ohata, Y. et al. Evaluation of the relationship between hemodialysis-related glycemic variability and hormonal profiles in patients with type 2 diabetes on hemodialysis: a pilot study. Ren Replace Ther 8, 43 (2022). https://doi.org/10.1186/s41100-022-00429-0
Received:
Accepted:
Published:
DOI: https://doi.org/10.1186/s41100-022-00429-0