
Abstract
Background
With the development of emergency and intensive medical technologies, the survival rate of traumatic brain injury has greatly increased. More and more patients have been converted from severe coma to alleviated state of consciousness, which can be subsequently classified within the framework of disorders of consciousness (DOC). We investigated the clinical application and characteristics of imaging indicators of diffusion tensor imaging (DTI) for the DOC patients.
Methods
DTI was performed on a total of 75 cases with a clinical diagnosis of DOC from January 2014 to December 2015 in Beijing Tiantan Hospital and PLA Army General Hospital (including 66 cases of unresponsive wakefulness state (UWS) patients and 9 cases of minimally conscious state (MCS) patients). The data for the imaging indicators, such as fractional anisotropy (FA) and mean diffusivity (MD), were separately collected from three relevant regions of interest (ROIs): brainstem, thalamus, and subcortex. The indicators of two groups with different conscious states were statistically analyzed, and correlation analyses were conducted for the mean values of FA and MD in the ROIs evaluated through clinical Coma Recovery Scale-Revised (CRS-R) scores.
Results
The FA value of the UWS group was evidentially lower than that of the MCS group (P < 0.05), while the MD value of the UWS group was higher than that of the MCS group (P < 0.05); the difference was statistically significant. The FA and MD values in the ROIs (locations: brainstem, thalamus, and subcortex) correlated with CRS-R scores, particularly in the thalamus.
Conclusion
DTI has a certain clinical reference value for DOC imaging grading. The more severe the DOC, the higher the MD value and the lower the FA value.
Background
With the development of emergency and intensive medical technologies, the survival rate of craniocerebral injury has greatly improved. Accordingly, much more patients with severe coma have been converted from severe coma to alleviated state of consciousness, which can be subsequently classified within the framework of disorders of consciousness (DOC) in variety of degrees [1]. The morbidity of DOC patients in China is over than 100,000 per year, associated an expenditure up to 30-50 billion yuan in health care. It leads to conflict social controversy related to economic and ethical issues [2].
DOC can be classified into different levels including unresponsive wakefulness syndrome (UWS) and Minimally conscious state (MCS). UWS refers to a patient who is unresponsive to external stimuli with wakefulness state (with open eyes) [3]. MCS refers to the patient with detectable signs of fluctuation in consciousness and repeatable non-reflex behavior [4]. Until now, the clinical diagnosis of DOC mainly depends on grading scales, such as Coma Recovery Scale-Revised (CRS-R) and Glasgow Coma Scale (GCS). Studies have shown that the misdiagnosis rate is as high as 43% between UWS and MCS relying on those diagnostic and evaluating methods [5]. This is mainly due to common concealment behaviors of DOC patients and the impact of the subjectivity of factors in the evaluation, which in turn results in inter-observer variability. Luaute et al [6] showed that the long-term recovery of MCS patients was better than that of UWS patients. Therefore, it is very important to select an appropriate and sensitive evaluating method for the early identification of these two status.
Diffusion tensor imaging (DTI) technology is an practical method for detecting subtle changes in brain structure; it is also a non-invasive method to observe the integrity of the tissue structure in vivo and obtain the information of fiber track, such as morphology, directions and myelin changes, in cerebral white matter [7, 8]. The present study had applied DTI technology to scan the selected regions of interest (ROIs) (brainstem, subcortex, and thalamus) in UWS and MCS patients individually, in the purpose of obtaining the values of FA and MD, as an indicator of conscious level evaluation. The differences between the two groups were compared to investigate the variations in mean values of various indicators for patients in different consciousness levels. The correlation between the parameters in different ROIs and the CRS scores is expected to have a further exploration of the clinical applications of DTI technology in the diagnosis and grading of DOC.
Methods
-
1.
Study participants
A total of 75 patients with a clinical diagnosis of DOC in Beijing Tiantan Hospital and PLA Army General Hospital were selected. The inclusive criteria consist of: ① meeting the diagnostic criteria for DOC (The multi-society Task Force on PVS. N Engl J Med 1994, Giacino JT, et al. Neurology. 2002); ② age of 18-60 years old, male or female; ③ sudden DOC for 2-4 weeks in a stable condition, with no history of epilepsy; ④ showing essentially intact brain structure, with no hemorrhages >3 cm, infarction and surgical lacuna; and ⑤ showing no contraindications for magnetic resonance (MR) scans. The exclusive criteria includes: ①patients with contraindication of MRI scan; ②patients with intolerance of MRI scan; ③dysphoria patient who might cause MRI artifacts.
Sixty six cases were enrolled in the UWS group, including 38 males and 28 females, with an age range of 23-58 years and a mean age of 35.2 ± 2.1 years; 9 cases were enrolled in the MCS group, including 7 males and 2 females, with an age range of 20-55 years and a mean age of 30.1 ± 1.6 years (shown in Table 1). Comparison of the two groups revealed no statistically significant differences in gender (χ2 = 0.031, P > 0.05) and age (t = 0.836, P > 0.05). All patients underwent DTI examination. We obtained approval of this study by the ethics committee of the hospital, and all participants and their families signed the informed consent form.
Table 1 Detailed demographic and clinical characteristics of the 9 MCS patients
-
2.
Assessment scale
CRS-R scale was used to assess the consciousness level of patients, containing six subscales on auditory, visual, motor, oromotor, communication (language) and arousal processes. Three physicians conducted the assessment of each patient in the awakening state separately. The average of the two scores in the smallest difference was used as the patient’s final score. If any one of the six subscales reached the minimally conscious state, the patient was assigned to the MCS group.
-
3.
Scanning method
A GE HD750 3.0 T superconductive MR scanner (GE Co., USA) was used for conventional magnetic resonance imaging (MRI): axial T1WI [repetition time (TR)/echo time (TE) = 2000 ms/20 ms], T2WI (TR/TE = 3000 ms/80 ms), Flair (TR/TE = 11000 ms/120 ms) sequence, and coronal T2WI (TR/TE = 3000 ms/80 ms) turbo spin-echo sequence (TSE sequence) scanning; sagittal T1WI (TR/TE = 2000 ms/20 ms); sagittal thickness of 6.0 mm, axial thickness of 7.0 mm, coronal slice thickness of 6.0 mm, and layer spacing of 0; and matrix 512 × 512 and scanning field of view (FOV) = 220 mm × 220 mm. The DTI scan was performed as follows: the scanning level was parallel to the connection line before and after scanning, with single-shot spin echo-echo planar imaging (SE-EPI); TR/TE = 10000 ms/90 ms, and FOV = 256 mm × 256 mm × 120 mm; matrix = 128 × 128, and SENSE factor = 2; number of layers = 70, layer thickness of 2 mm, and layer spacing of 0; and 15 non-linear directions, b value of 0, 800 s/mm2, and a scanning time of 5 min.
-
4.
Data processing
FiberTrak software was used for the DTI parameter processing. The FA and MD values were measured in the color tensor and B0 images at different layers. The ROIs were selected to be the brainstem, subcortex, and thalamus. An area corresponding to each selected ROI was measured (ROI areas in the range of 9-20 pixels), and the mean statistical value was applied for the f test. The examination was performed by two radiologists with more than five years of experience. Averages were obtained for continuous measurements of three adjacent layers.
-
5.
Statistical methods
We used SPSS 19.0 software for the statistical analysis. The measurement data are presented as x̅±s. Analysis of variance (ANOVA) and t-tests were performed to evaluate the average FA and MD values between the two groups. Pearson linear correlation analysis was performed to compare the FA and MD values with the CRS-R scores. Differences with P < 0.05 were considered significant results.
Results
-
1.
Differences in the feature values of ROIs in different consciousness levels.
The FA and MD values of ROI in brainstem, subcortex, and thalamus were compared between UWS and MCS groups. In UWS group, the FA value in the subcortex was the highest, followed by those in the thalamus and the brainstem, and the difference was statistically significant (F = 7.050, P = 0.0011); the MD value in the thalamus was the highest, with a statistically significant difference between the subcortex and the thalamus (t = 2.425, P = 0.026). In the MCS group, the FA value in the subcortex was the highest, followed by those in the thalamus and the brainstem, and the difference was statistically significant (F = 9.523, P = 0.0105); the MD value in the thalamus was the highest (F = 8.379, P = 0.0017), with a statistically significant difference between the brainstem and the thalamus (t = 2.306, P = 0.309). Compared to the UWS group, the FA values of the MCS group in all three ROIs were significantly higher, especially in the brainstem, with a statistically significant difference (Fig. 1). The comparison of the MD values in the ROIs between the UWS group and the MCS group (Fig. 2) revealed that the MD value of the UWS group was higher than that of the MCS group, especially in the thalamus. These results are shown in Table 2.
Fig. 1 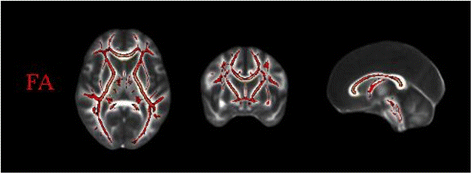
Extraction skeleton calculated by FA values of participants
Fig. 2 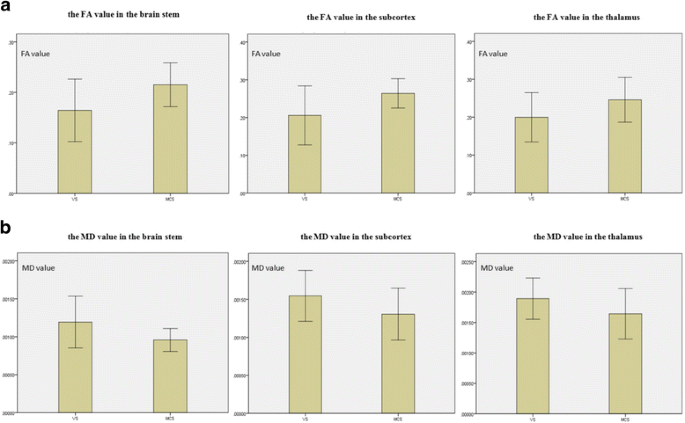
Comparison of the characteristic values in different ROIs for the UWS and MCS groups. a Comparison of the FA values in different ROIs between the UWS and MCS groups; b Comparison of the MD values in different ROIs between the UWS and MCS groups
Table 2 Comparison of FA and MD in the ROIs between the UWS and MCS groups (x̅±s)


-
2.
Correlation of the characteristic values of the key regions and the CRS-R scores
The relationship coefficients of the FA and MD values in the ROIs and the CRS-R scores were calculated (Table 3) to prepare the scatter plots and line graphs for the FA and MD values in the corresponding regions with the CRS-R scores. The FA value and the CRS-R score were positively correlated; the CRS-R score increased with an increasing FA value, and had an inverse correlation with MD (Fig. 3).
Table 3 Correlations between the DTI parameters in ROIs and CRS-R scores Fig. 3 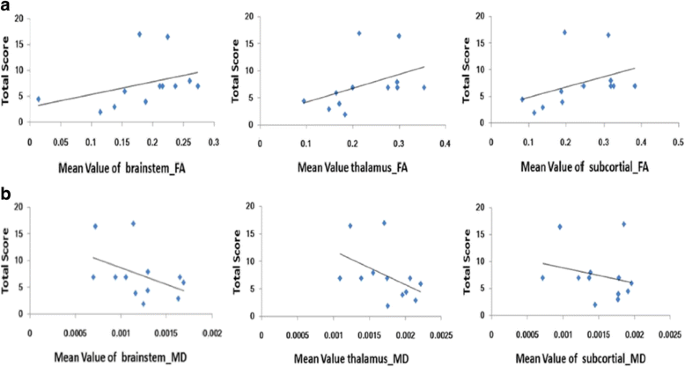
Correlations between CRS-R scores and the feature values of each ROI. a Correlations of the average FA values in the brainstem, thalamus, and subcortex with the CRS-R scores; b Correlations of the average MD values in the brainstem, thalamus, and subcortex with the CRS-R scores

Discussion
The morbidity of long-term UWS and MCS after serious brain injury have increased significantly in recent decades [9]. However, the existing grading scale showed up some disadvantages in identifying the consciousness levels of DOC patients [10]. Accurate assessment strategies are urgently needed. In this circumstance, MRI with different sequences is imported as a novel technique for DOC patients, with a purpose of overcome the shortage of traditional sequences in evaluating the consciousness level. In our study, FA and MD were discovered as potential indicators of DOC patients’ assessment.
The reticular formations of the brainstem, thalamus, and subcortex are all related to consciousness in different degrees [11–13]. Therefore, this study selected these three regions as the ROIs to investigate the application value of DTI in imaging grading for DOC patients.
DTI can detect the diffusion direction of water molecules and the diffusion degree in each direction. This imaging technology is a special form of MR imaging, which was developed and established based on diffusion-weighted imaging (DWI). DTI has been widely used in multiple studies on neurological diseases, such as brain tumors, cerebral infarctions, and Alzheimer's disease. In particular, DTI can detect the damage in white matter fiber tracts caused by a variety of diseases [14].
The common indicators of DTI are FA, ADC (apparent diffusion coefficient), and MD [15]. FA refers to the ratio of the anisotropy of water molecules to the gross diffusion tensor, which ranges from 0 to 1. The closer the value is to 1, the higher degree of density of axon myelination, suggesting higher white matter integrity and less damage present in neurons and nerve fibers [16]. Yi et al [6] found that while computed tomography (CT) and MRI examinations for some patients with early diffuse axonal injury (DAI) revealed no hemorrhage or edema lesions, a DTI scan showed a decreased FA value at the damage site, reflecting the sensitivity of DTI to the changes in nerve fibers. In 2011, DTI began to be used in DOC research. Studies have found that the FA values in the thalamus of DOC patients were decreased to varying degrees, suggesting that DTI was specific in identifying the two states of UWS and MCS [17, 18]. We have now recognized the DTI's values in many brain pathologies, including DOC. An interesting case report on one 76-year-old man with UWS. He was examined with DTI reported an early FA reduction in 11 white matter regions that preceded macroscopic MRI and postmortem neuropathological findings. Some other researches focused on the similar ROIs, investigated diffusion alterations in the coma survivors of cardiac arrest. Abnormally dynamic FA values could be found after injury and predict unfavorable outcome with 94% sensitivity and 100% specificity.
Another study found that DTI could potentially distinguish UWS and MCS patients. Diffusion in MCS and UWS patients appeared to differ significantly in subcortical white matter and thalamic regions but appeared not to differ that much in the brainstem. Compared with the MCS group, the FA values of the UWS group were decreased, which may be due to increased permeability of the cell membranes at the injury sites of the patients. This increased permeability could lead to destruction of the integrity of the nerve fiber myelin so that the movement of water molecules was decreased in the axons and enhanced in the vertical direction. The change is less severe in MCS patients. Alternatively, the extent of the damage in the white matter fiber tracts might have improved in patients after recovering from UWS to MCS.
MD is another commonly used indicator in DTI, reflecting the diffusion capacity of water molecules. MD decreases in aging patients and therefore is a potential surrogate measurement for white matter maturation [19]. In this study, two groups of patients with different levels of DOC showed statistically significant differences in their ROIs. As an explanation for this difference, in comparison with the MCS group, the damage to the ROIs of the brain tissue of the UWS patients was more severe, and the patients were in deeper comas. This minor difference cannot be distinguished via conventional imaging examinations.
The DTI value of assessment were also found in some recent multi-centric studies in traumatic and anoxic patients regarding 1-year outcome. Furthermore, the combination of DTI and MRI spectroscopy has shown the potential ability to predict long-term outcome of DOC patients. Person correlation analysis also found that the FA values and the clinical CRS-R scores were positively correlated, especially in the thalamus, which may be due to the importance of the non-projection system in these regions for the arousal and consciousness state of the brain, which shows the closest relationship with the CRS-R score. The MD values and CRS-R scores in the ROIs showed a negative correlation; that is, the smaller the MD value was, the lower the severity of brain damage. Thus, to some extent, the changes in DTI indicators can reflect the consciousness level of DOC patients and whether the consciousness level improves.
Conclusion
In conclusion, using DTI technology, in DOC patients, the degrees of damage to the nerves and the white matter can be detected at a high level of sensitivity, and the recovery of the nerve fibers can be determined early [20]. By measuring each indicator, the extent of damage can be quantified. Therefore, as an important supplement technique and assessment tool, DTI technology can provide an objective and accurate evaluation of the state of consciousness for the patients to reduce the rates of misdiagnosis and delayed diagnosis with a certain clinical reference value and can add significance to further research. However, it should be noted that the number of patients in the MCS group in this study was relatively small. The correlations between the indicators and the state of consciousness and the CRS-R need to be further investigated using a larger sample size.
Abbreviations
- ADC:
-
Apparent diffusion coefficient
- ANOVA:
-
Analysis of variance
- CRS:
-
Coma recovery scale
- CRS-R:
-
Coma recovery scale-revised
- CT:
-
Computed tomography
- DAI:
-
Diffuse axonal injury
- DOC:
-
Disorders of consciousness
- DTI:
-
Diffusion tensor imaging
- FA:
-
Fractional anisotropy
- FOV:
-
Field of view
- GCS:
-
Glasgow Coma Scale
- HIE:
-
Hypoxic ischemic encephalopathy
- ICH:
-
Intracerebral hemorrhage
- MCS:
-
Minimally conscious state
- MD:
-
Mean diffusivity
- MR:
-
Magnetic resonance
- MRI:
-
Magnetic resonance imaging
- ROI:
-
Region of interest
- SE-EPI:
-
Spin echo-echo planar imaging
- TBI:
-
Traumatic brain injury
- TE:
-
Echo time
- TR:
-
Repetition time
- TSE:
-
Turbo spin-echo
- UWS:
-
Unresponsive wakefulness state
- VS:
-
Vegetative state
References
Gerdes JS, Walther EU, Jaganjac S, et al. Early detection of wide spread progressive brain injury after cardiac arrest: a single case DTI and post-mortem histology study [J]. PloS One. 2014;9(3):e92103.
Edlow BL, Haynes RL, Takahashi E, et al. Disconnection of the ascending arousal system in traumatic coma [J]. J Neuropathol Exp Neurol. 2013;72(6):505–23.
Arfanakis K, Haughton VM, Carew JD, et al. Diffusion tensor MR imaging in diffuse axonal injury [J]. AJNR Am J Neuroradiol. 2002;23(5):794–802.
Dell’ Acqua F, Catani M. Structural human brain networks: hot topics in diffusion tractography [J]. Curr Opin Neurol. 2012;25(4):375–83.
Bruno MA, Majerus S, Boly M, et al. Functional neuroanatomy underlying the clinical subcategorization of minimally conscious state patients [J]. J Neurol. 2012;259(6):1087–98.
Cercignani M, Bozzali M, Iannucci G, et al. Magnetisation transfer ratio and mean diffusivity of normal appearing white and grey matter from patients with multiple sclerosis [J]. J Neurol Neurosurg Psychiatry. 2001;70(3):311–7.
Dell’ Acqua F, Simmons A, Williams SC, et al. Can spherical deconvolution provide more information than fiber orientations? Hindrance modulated orientational anisotropy, a true-tract specific index to characterize white matter diffusion [J]. Hum Brain Mapp. 2013;34(10):2464–83.
Dinkel J, Drier A, Khalilzadeh O, et al. Long-Term white matter changes after severe traumatic brain injury: a 5-year prospective cohort [J]. AJNR Am J Neuroradiol. 2014;35(1):23–9.
Fernández-Espejo D, Bekinschtein T, Monti MM, et al. Diffusion weighted imaging distinguishes the vegetative state from the minimally conscious state [J]. Neuroimage. 2011;54(1):103–12.
Newcombe V, Chatfield D, Outtrim J, et al. Mapping traumatic axonal injury using diffusion tensor imaging: correlations with functional outcome [J]. PloS One. 2011;6(5):e19214.
Perlbarg V, Puybasset L, Tollard E, et al. Relation between brain lesion location and clinical outcome in patients with severe traumatic brain injury: a diffusion tensor imaging study using voxel-based approaches [J]. Hum Brain Mapp. 2009;30(12):3924–33.
Okada T, Miki Y, Fushimi Y, et al. Diffusion-tensor fiber tractography: intraindividual comparison of 3.0-T and 1.5-T MR imaging [J]. Radiology. 2006;238(2):668–78.
Lin CP, VJ W e, Chen JH, et al. Validation of diffusion spectrum magnetic resonance imaging with manganese-enhance drat optic tract sand ex vivo phantoms [J]. Neuroimage. 2003;19(3):482–95.
Soddu A, Vanhaudenhuyse A, Demertzi A, et al. Resting state activity in patients with disorders of consciousness [J]. Funct Neurol. 2011;26(1):37–43.
Wang JW, Bakhadirov K, Devous Sr MD, et al. Diffusion tensor tractography of traumatic diffuse axonal injury [J]. Arch Neurol. 2008;65(5):619–26.
Smith SM, Jenkinson M, Johansen-Berg H, et al. Tract-based spatial statistics: voxelwise analysis of multi-subject diffusion data [J]. Neuroimage. 2006;31(4):1487–505.
Tshibanda L, Vanhaudenhuyse A, Galanaud D, et al. Magnetic resonance spectroscopy and diffusion tensor imaging in coma survivors: promises and pitfalls [J]. Prog Brain Res. 2009;177:215–29.
Fernández-Espejo D, Junque C, Cruse D, et al. A role for the default mode network in the bases of disorders of consciousness [J]. Ann Neurol. 2012;72(3):335–43.
Filler AG. The history, development and impact of computed imaging in neurological diagnosis and neurosurgery: CT, MRI, and DTI [M]. Internet J Neurosurg. 2009;7(1):69.
Wu O, Batista LM, Lima FO, et al. Predicting clinical outcome in comatose cardiac arrest patients using early non-contrast computed tomography [J]. Stroke. 2011;42(4):985–92.
Acknowledgements
The authors thank all the patients who trusted them and all the physicians and staff who helped them in this study. The following individuals helped a lot with data collection: neurosurgeons Dezhi Li, Jiayi Qiu, Yinyan Wang, Yang Zhang and Peng Kang.
Funding
Ministry of Science and Technology of China grant (2012CB825505)
Natural Science Foundation of China (81600919).
Availability of data and materials
The datasets used and analyzed during the current study available from the corresponding author on reasonable request.
Authors’ contributions
LX: designing the study, analyzing and interpreting the data and writing the manuscript; YY: collecting the data and analyzing and interpreting the data; EG: collecting the data and analyzing and interpreting the data; XT: conceiving and designing the study; TL: conceiving and designing the study, interpreting the data; ZC: collecting the data and analyzing the data; XX: collecting the data and analyzing the data; QT: collecting the data and analyzing the data; MG: collecting the data and analyzing the data; JH: providing critical revisions and designing the study; JL: approving the final version of the manuscript and obtaining funding; JZ: approving the final version of the manuscript and obtaining funding. All authors read and approved the final manuscript.
Competing interests
The authors declare that they have no competing interests.
Consent for publication
All patients in this research have formally agreed to publish their clinical information and clinical data.
Ethics approval and consent to participate
All procedures performed in studies involving human participants were in accordance with the ethical standards of the institutional and/or national research committee and with the 1964 Helsinki declaration and its later amendments or comparable ethical standards. This article does not contain any studies with animals performed by any of the authors. Informed consent was obtained from all individual participants included in the study.
Author information
Authors and Affiliations
Corresponding authors
Rights and permissions
Open Access This article is distributed under the terms of the Creative Commons Attribution 4.0 International License (http://creativecommons.org/licenses/by/4.0/), which permits unrestricted use, distribution, and reproduction in any medium, provided you give appropriate credit to the original author(s) and the source, provide a link to the Creative Commons license, and indicate if changes were made. The Creative Commons Public Domain Dedication waiver (http://creativecommons.org/publicdomain/zero/1.0/) applies to the data made available in this article, unless otherwise stated.
About this article

Cite this article
Xu, L., Yang, Y., Guo, E. et al. Diagnostic evaluation of patients with disorders of consciousness with diffusion tensor imaging. Chin Neurosurg Jl 3, 17 (2017). https://doi.org/10.1186/s41016-017-0079-2
Received:
Accepted:
Published:
DOI: https://doi.org/10.1186/s41016-017-0079-2