
Abstract
The present work deals with helical piles that extensively used in foundations for structures subjected to both compressive and tensile forces. The behavior of square helical piles models (5 × 5) mm, embedded in expansive soil overlaying a layer of well compacted sandy soil, (single and group of helical piles) were investigated and compared with ordinary piles. Model tests are performed with helical pile length 150, 200, and 300 mm and helix diameters 15 and 20 mm. Helical piles with one helix and double helix were considered. The pattern of helical piles group models consists of four piles in a square arrangement. Thirty-six models of helical pile groups embedded into the expansive soil were performed. It is found that the pile length, number of helix, and helix diameter have a great effect on the amount and rate of uplift movement of helical piles embedded in expansive soil. The deeper helical piles with higher L/D ratios showed greater pullout capacity comparing to the shallower piles. The maximum upward movement of helical piles group is less than that of single pile.
Introduction
Expansive soil exhibit significant volume changes due to soil moisture content changes. Foundations constructed on this soil are subjected to considerable damage due to swelling [8]. Soils with high plasticity properties experienced large volume changes during swelling and shrinkage strain characterizations. Helical piles are an effective foundation system in expansive soil and bedrock. Helical pile foundations are used for both new construction and repair of existing foundation in areas with expansive soils [4]. Screw piles show good promise as a one of type anchor requiring very simple installation techniques [6].
The square shaft helical pile is a deep foundation used for new foundations and underpins existing foundations. Favorable performance history and economic viability have made it a standard of practice in many parts of the United States where it is considered a long side its deep foundation cousins: the drilled cast in place concrete pier, the driven pile and the micro piles. In addition to underpinning light structures, today it is used for new foundations and to underpin multiple stories heavily loaded commercial and industrial structures. Problem soil sites with expansive clays, collapsible soils or high ground water conditions are especially well suited for the square shaft helical screw pile [7]. The use of square shaft helical pile foundations in swelling soils is a standard of practice in Colorado. Since 1986 it is estimated approximately 130,000 square shaft helical piles have been installed for both remedial repair and foundations for new construction in swelling soils, including the high expansive steeply dipping bedrock areas. There are no documented failures or adverse performance of correctly specified and installed square shaft helical piles [1]. Helical piles represent an efficient deep foundation system used in a wide range applications varying from anchors for transmission towers to foundations for bridges and large industrial installations. Helical piles are made of a steel shaft either a solid square shaft or circular pipe with one or multiple helices attached to it. They are installed by employing rotational force applied through a drive head. The piles could be installed to any depth and at any angle provided that the soil conditions are tolerable and the pile is designed to withstand the applied torque from a suitable drive head [2].
For the helical pile group systems under similar conditions, the average efficiency factor close to unity, indicating that detrimental effects given by the superposition of individual stress and displacement bulbs are reliable. It also means, and confirms, that individual pile failures rather than block failures are the main shearing mechanism that takes place underneath the systems during soil plasticization [5]. Hanna and Ghaly [3] examined the shape of the group (square, triangular, rectangular), spacing, depth, sand density and angle of shearing resistance. They introduced the concept of a transition anchor which is a phase of behavior where the anchor neither behaves as a shallow or deep one. They have shown that this concept is applicable to both single and groups of anchors. The present work aims to investigate the behavior of model single helical piles embedded in expansive soil overlaying a layer of sandy soil. The parameters considered in this study are the length of helical pile, number of helix and helix diameter. Also, the present work aims to study the behavior of model of group of helical piles embedded in expansive soil overlaying a layer of sandy soil considering the length of helical pile, spacing between piles, number of helix and helix diameter.
Material properties
Expansive clay
The disturbed expansive soil used in this study was brought from Al-Anbar city/Bushayrah Valley, 35 km southern Al-Waleed Military Base from a depth of three and a half meters from natural ground level. In order to increase the permeability of the soil and to facilitate and accelerate saturation process, several trial mixes of expansive soil-sand were performed. A ratio of expansive soil to sand of (4/1) was selected. At this ratio, the soil remains highly expansive and its permeability is increased. The results of laboratory tests are shown in Table 1.
Model piles
Large number of steel helical piles models with length ranging from 150 to 300 mm and square solid section with dimension (5 × 5) mm was manufactured from high resisting steel as shown in Fig. 1. Helices are spaced on the shaft at a minimum distance of three times the diameter of the lower helix. The soil disturbance is minimized when each helix tracks through the same continuous helical groove cut into the soil. When spacing between helices is more than three times diameter of helices, the helices work as individually and the failure may be bearing. On the contrary, if distance between helix plates less than three times helix diameter the cylindrical failure will be occur.

Different types of helical piles used in the models
The experiment program is carried out on single pile with different length, helix diameter and number of helix. While, the pattern of helical piles group models consists of four piles in a square arrangement with a square pile cap. A gap separated the pile cap from the surface of the bed of the soil as shown in Fig. 2. Thirty-six models of helical pile groups embedded into the expansive soil with different lengths, helix diameters, pile spacing and number of helix plates to investigate the effect of these parameters on the upward movement of both pile and soil.

Installation of four helical piles in the expansive soil inside container. a Before putting the cap, b after putting the cap
Soil container
Steel container for soil was manufactured using a 4 mm thickness plate with internal diameter 40 cm and height 60 cm. The base of container is supported by four steel rigid legs and contains a hole with diameter 2.5 cm connected to control valve. This valve is connected to the tank base to perform the saturation process of soil from bottom to top of soil. The water level in the tank must be usually kept 10 cm more than the surface of soil. Figure 3 shows the containers used in models tests.

a Soil mixing process. b Storing the soil in two plastic bags
Methodology
The soil bed was prepared on a dry density of 1.335 gm/cm3 which corresponds to a water content of 2% dry of optimum, from the compaction curve of 3/4 Standard Proctor for the expansive soil. Four sand drains were formed around the pile using thin walled steel tube (10 mm diameter and 300 mm length). The sand drains were spaced 50 mm from the pile (center to center). A group of four helical piles in a square pattern and three different spacing (3, 4, 5 dh) where dh is diameter of helix plate. The caps of helical piles are square shape and their dimensions are changed according to spacing between helical piles. After installation of helical piles group in expansive soil, each helical pile is connected with cap tightly. Also, as in single helical pile, there is a gap of (10) cm between cap and surface of expansive soil.
The following procedure was followed to prepare the soil bed in the container to be ready for performing model tests:
-
1.
The soil bed was prepared on a dry density of 13.10 kN/m3 which corresponds to a water content of 2% dry of optimum, from the compaction curve of 3/4 effort of Standard Proctor for the expansive soil. A soil dry weight corresponding to the dry density of 13.10 kN/m3 was prepared by mixing thoroughly the required amount of the dry sand passing sieve No. 40 with the required amount of oven dry soil. After that the water corresponding to 2% dry of optimum (18.62%) was added gradually to the soil, care was taken to distribute the water evenly and to prevent the development of clay lumps.
-
2.
The mixture was kept in completely sealed plastic bags for 1 day to insure homogeneous water migration within the soil as shown in Fig. 3.
-
3.
Representative water content samples were taken for water content measurements.
-
4.
The inside of the soil containers was coated with lubricating oil to minimize the friction effect between the soil and the inner surface of container.
-
5.
After thorough mixing with water, the soil lumps are spread inside the model container at maximum dry unit weight of (13.1 kN/m3) in form of six layers. Each layer has a compacted thickness of (5 cm) and contain (9.95 kg) of soil to give the total depth and weight of expansive soil inside the model container of (30 cm) and (59.7 kg). Special compaction technique is proposed to obtain desired unit weight of soil (15.54 kN/m3) in specified thickness (5 cm). This need to make simulation between the method of soil compaction in standard Proctor test and method of soil compaction inside the model container of experimental work, since; same compaction energy must be used to keep the maximum dry unit weight the same value and prevent any change in soil properties which may causes missing in test results.
New manual metal rammer manufactured with predetermined weight and dropping height to compact the expansive soil inside the model container and new compaction elements proposed in order to give the same compaction energy of standard proctor compaction test. Table 2 shows the elements of standard compaction test and compaction method that followed in this study. The soil is compacted using new manufactured rammer and the thickness of each layer is checked carefully after compaction. The process of compaction is continued until the expansive soil bed reached the desired thickness of (30 cm).
Table 2 Compaction elements for standard and proposed method -
6.
Each layer was scratched by a spatula in order to provide a good contact with the compacted layers (Fig 4a).
Fig. 4 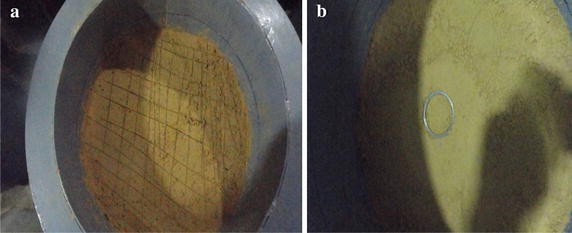
a Scratching each layer after compaction. b Measurement of soil density
-
7.
The density of each layer was checked by using an oedometer ring which has constant dimension of 50 mm diameter and 19 mm height. The water content of each layer was checked also (Fig. 4b).
-
8.
At the end of compaction, the final thickness of soil bed was 300 mm corresponding to a dry density of (1.335 gm/cm3) and water content of (18.62%) which is 2% less than the optimum moisture content9-four sand drains were formed around the pile using thin walled steel tube (10 mm diameter and 300 mm length) as shown in Fig. 5. The sand drains were spaced 50 mm from the pile (center to center). The sand used was passing sieve No. 40 and prepared at a relative density equal to 80% to decrease soil saturation period.
Fig. 5 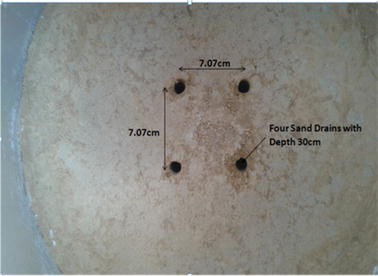
Sand drains around helical pile before and after filling with sand


The following steps were followed for pile installation after the completion of the soil bed compaction in the container:
-
1.
Two types of T shaped and circular plate (pile cap) were manufactured from galvanized steel. By fitting these tools on each other on the upper part of helical pile and apply torque to install the pile into soil to the required depth. Enough care and control should be taken to keep the helical pile in vertical line as shown in Fig. 6.
Fig. 6 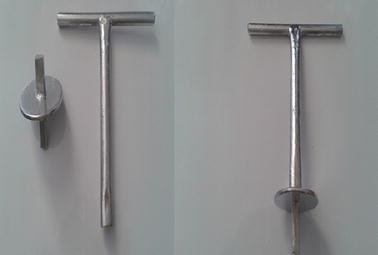
Tools of helical pile installation in the soil
-
2.
A circular plate (cap) was then fixed on the upper part of helical pile. After that, a dial gage was fixed vertically for measuring uplift movement of helical pile as demonstrated in Fig. 7.
Fig. 7 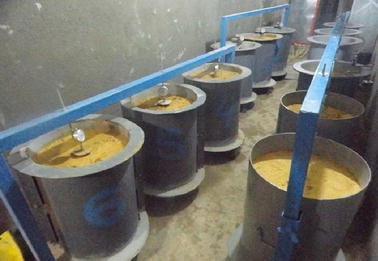
Manufactured frames of uplift movement measurement of helical piles
-
3.
The valve of water tank is opened and the water seeping from bottom to top of expansive layer. This stage represents the beginning of test. Recording the dial gage reading is started too. The water level in the tank must be 10 cm greater than the top surface of expansive soil at the starting stage. This level of water was controlled during the test as it must not be greater than the soil surface at the end of saturation.
-
4.
The reading of dial gage was recorded with time until equilibrium state was reached.
-
5.
The same procedure mentioned above is used for single pile and pile group models tests (Fig. 8).
Fig. 8 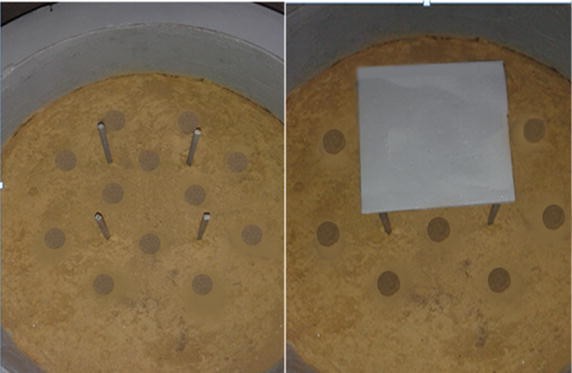
Group helical piles after driving and fixing square cap


Special pull-out loading frame was manufactured for measuring pile pull-out capacity as illustrated in Fig. 9. A load cell with its indicator was attached to measure the applied tension force on the pile, and two dial gauges were fixed above the pile cap using two magnetic holders to indicate the upward displacement of the pile due to applied force. Pullout load test is carried out on single helical pile embedded in expansive soil and sandy soil bed at different lengths and helix plates diameters. After conforming saturation and completing uplift movement test, the loading system instrument is prepared and pullout load test is carried out by the following procedure:

Model pile pullout test system during testing
-
1.
The pullout load test system is prepared by equipping mechanical jack, connected from the top with steel support in testing frame and connected from the bottom with load cell system. The load cell system is equipped with helical pile head by special instrumentation and attached to a digital load indicator.
-
2.
The pullout load is applied and controlled by equipping mechanical jack and load cell. This jack has the ability to move upward and apply pullout load on the load cell, which is connected to the helical pile head and digital load indicator. The load indicator displays the load values on a screen indicate the pullout load.
-
3.
The pullout load is applied gradually and incrementally. The load increments are ranged as (3–10) N and the average upward movement of the helical pile under each increment is measured by using the two dial gauges which were attached to the loading frame.
-
4.
The test is continued up to the point of failure is observed. At this point, the helical pile is completely pulled out from the expansive soil.
Results and discussion
The results of this study can be divided into two parts:
Results of single helical pile
Three different L/D ratios were used 27, 35 and 53, also single and double helix with helix diameters 15 and 20 mm were used. In general, the amount and rate of helical pile upward movement due to soil swelling were reduced when increasing L/D ratios, decreasing helix diameter and number of helix. The uplift movement of soil surface is preceded the uplift movement of helical piles and more than 80% of its value take place during the first 10 days of saturation. The ordinary and helical piles movement is happened after soil surface movement which represents time lag relation and more than 80% took place during period (20–30) days of saturation. There was a time lag between the upward movement of helical piles and the soil surface. The results of three models tests of ordinary pile and 12 models tests of helical piles are presented in Table 3.
As shown in Figs. 10 and 11, increasing L/D ratio for ordinary and helical piles reduces the pile uplift movement which results from swelling soil. This is occurs due to anchorage of long piles in deep soil layer even if this layer is within the active zone of the soil. The obtained reduction percentages in ordinary piles upward movement 67% when increasing L/D from 27 to 53 while, for helical piles with single helix and double helix plates was (82–84%) and (77%) respectively when increasing L/D ratio from 27 to 53. The ordinary pile showed more resistance than double helix of helical piles for all L/D ratios. In general, for a given a diameter (D) and expansive soil bed thickness (H), the maximum uplift movement decreases with increasing of (L/H) ratio due to increasing in its length and anchorage action of helical pile. A considerable decrease was observed at (L/H = 1), i.e., the helical pile embedded at full depth. This behavior can be understood as in the following: the effect of swelling pressure of expansive soil decreases with increasing (L/H) ratio. More mobilized pullout resistance of helical pile when the length become equal the thickness of expansive soil layer where the helical pile becomes instrumental in reducing uplift movement. The active zone is defined as that zone or depth of seasonal moisture change, sometimes also called the “depth of wetting”. It is the depth or zone where soil expansion or shrinkage forces adversely affect deep foundation performance. Swelling soils expand when the moisture content increases and contract or shrink when moisture content decreases. If the deep foundation is not sufficiently installed below the active zone, as moisture content changes, heave or shrinkage forces will be applied to the deep foundation which may cause it and the structure above to move. The presence of helix plates in active zone help to increase upward movement of helical piles. As shown in Fig. 12, the maximum upward movement decreases with increasing of L/H ratio due to increase in its length and anchorage action of helical pile. In general, the uplift movement of the helical piles increases with increasing helix diameter especially when lower values of L/D ratios of helical piles. It is obvious that the presence of more than one helix in helical pile result in increased helical piles movement. This is due to forces generated around helix plates which lead to uplift them. These forces increase with increasing number of helix. The results of all the models tests performed on ordinary and helical piles were plotted together in Fig. 13. A relationship between the dimensionless term (L2/De * H) and (Sp/Ss) where: L = pile embedment length, De = equivalent pile diameter, H = expansive soil depth and (Sp, Ss) = pile and soil surface upward movement respectively. This relationship was plotted to produce a practical relationship which provides the required L/D ratio for ordinary and helical piles to give an allowable or zero upward movement for the pile due to swelling. A relationship takes into account the effect of pile length, diameter of pile and helix, number of helix and the thickness of the swelling soil. The proposed relationship provides values for unloaded piles fully embedded in a very expansive soil. Therefore; in the case of loaded piles the relationship will be on the safe conservative side.

Variation of maximum uplift movement of helical pile with different lengths and helix diameters

Variation of ratio (Spmax/H) with (L/D) ratio of helical pile with different lengths and helix diameters

Variation of ratio (Spmax/H) with (L/H) ratio of helical pile with different lengths and helix diameters

Proposed relationship for determining helical pile dimensions in expansive soil
Fifteen model tests were conducted to determine the pullout capacity of steel and helical piles with single and double helix after complete saturation of expansive soil. Three different L/D ratios were used 27, 35 and 53 for these piles models. Figures 14, 15, 16, 17, and 18 show the model tests results for piles pullout load-upward movement behavior. It was noticed that the deeper piles with higher L/D ratios showed greater pullout capacity. Also, helical piles showed more resistance to the applied uplift forces than ordinary piles because of the presence of the helix plates which provides extra anchorage in deep soil layers. The pullout force increase with increasing diameters and number of helix plates.

Pullout load-upward movement curves for steel pile without helix

Pullout load-upward movement curves for helical pile with single helix (dh = 15)

Pullout load-upward movement curves for helical pile with single helix (dh = 20)

Pullout load-upward movement curves for helical pile with double helix (dh = 15)

Pullout load-upward movement curves for helical pile with double helix (dh = 20)
Table 4 summarizes the results of the pullout capacity tests and type of failure for ordinary and helical piles. The failure mode of helical piles is examine by cutting the expansive soil after failing helical pile under the pullout load as shown in Fig. 19. The results showed that the helical piles with two helix principally failed by cylindrical surface occurred in the region between two helix plates. Another failure mode is bearing which occurred at the base of helical piles which has one helix plate. An increase percentages in pullout capacity of ordinary, single helix with diameters 15 and 20 mm and double helix with diameters 15 and 20 mm were 100, 662, 652, 554 and 560% respectively when increasing L/D ratio from 27 to 53. As shown in Figs. 20 and 21, the rate of increase in pullout capacity of helical piles is more than ordinary piles with increasing L, L/D and L/H.

Failure modes types of helical piles in expansive soil

Variation of failure pullout load with length and helix diameter of helical pile

a Variation of failure pullout load with L/D ratio of helical pile. b Variation of failure pullout load with L/H ratio of helical pile
Results of helical piles group
The experimental program is carried out on single and group of helical piles with different lengths and square cross section is (0.5 × 0.5) cm. The length of helical pile (L) is varied as (15, 20 and 30) cm; these lengths of helical piles are taken depending on (L/H) where (H) denoted that the thickness of expansive soil bed (H = 30 cm), since, the ratio of (L/H) is ranged as (0.5, 0.67 and 1). Hence, the range of the length to diameter ratio (L/D) of helical pile varied from 27 to 53. Typical results of the variation of upward movement with time for different pile spacing and L/D ratios 27, 35 and 53 are shown in Figs. 22, 23, 24, 25, 26, 27, 28, 29, 30, 31, 32 and 33. The relation of upward movement of helical piles with time is approximately similar to all models except that helical piles with L/D (27) reached 80% of maximum uplift movement during first 20 days while that of L/D (35) and (53) reached during (20–30) days and (25–35) days respectively. This is due to the saturation of the upper part of the soil before the lower part that caused to generate forces about helix plates. Similar to single helical piles, the increase in L/D ratio for helical piles group reduces the pile uplift movement which result from swelling soil. This is occurs due to anchorage of long piles in deep soil layer even if this layer is within the active zone of the soil. The obtained reduction percentages in upward movement of helical piles group with single helix plate was (87–91%) for spacing (S = 3 dh) when increasing L/D from 27 to 53. Also, for helical piles group with double helix plates and spacing (S = 3 dh) was (70–79%) when increasing L/D ratio from 27 to 53. The helical piles group with single helix showed more resistance than double helix of helical piles group for all L/D ratios. The presence of helix plates in active zone help to increase upward movement of helical piles. The results indicate that the amount and rate of upward movement increases with increasing piles spacing. This behavior may be attributed to the fact that the small spacing between helical piles group (S = 3 dh) will restrain the tendency for expansion of the confined soil between them leading to a smaller amount of upward movement of the helical piles. On the contrary, as the spacing between helical piles is increased (S = 5 dh) the confined soil between helical piles will have more freedom to expand, thus a large amount of upward movement was observed in this case. The effect of the helical piles spacing may also be explained in terms of the block action, the tendency for the pile group to act as a unit block increases at small spacing. On the other hand, as the pile spacing increases the behavior of each pile in a group of piles will be as an individual pile. It can be noticed that the effect of pile spacing is more pronounced in deeper lengths rather than in shallower depths. The failure mechanism of helical piles group is complex. The uplift movement may be resisted by the cylindrical shear between helices of helical pile or bearing capacity of the single helices in the vicinity of the base and by shaft resistance mobilized along the helical pile.

Variation of uplift movement with time for pile group of L/D = 27 and single helix (dh = 15 mm)

Variation of uplift movement with time for pile group of L/D = 27 and single helix (dh = 20 mm)

Variation of uplift movement with time for pile group of L/D = 27 and double helix (dh = 15 mm)

Variation of uplift movement with time for pile group of L/D = 27 and double helix (dh = 20 mm)

Variation of uplift movement with time for pile group of L/D = 35 and single helix (dh = 15 mm)

Variation of uplift movement with time for pile group of L/D = 35 and single helix (dh = 20 mm)

Variation of uplift movement with time for pile group of L/D = 35 and double helix (dh = 15 mm)

Variation of uplift movement with time for pile group of L/D = 35 and double helix (dh = 20 mm)

Variation of uplift movement with time for pile group of L/D = 53 and single helix (dh = 15 mm)

Variation of uplift movement with time for pile group of L/D = 53 and single helix (dh = 20 mm)

Variation of uplift movement with time for pile group of L/D = 53 and double helix (dh = 15 mm)

Variation of uplift movement with time for pile group of L/D = 53 and double helix (dh = 20 mm)
Figure 34 relates the maximum upward movement of model pile groups to the maximum heave of soil surface (Spmax/Ssmax), plotted against the parameter (De2/H * L) for the specified tested soil taking into account the effect of pile spacing, pile lengths and diameters and the thickness of the expansive soil layer for helical piles with single and double helix plates. This relation can provide the safe dimensions and spacing of group of four piles with a gap separating the pile cap from the top surface of the soil.

Design charts for a group of four helical piles with single and double helix plates
Conclusions
-
1.
The amount and rate of uplift movement of helical piles embedded in expansive soil decreases with increasing length and increases with increasing helix diameter and number of helix if helix plates lie in active zone.
-
2.
The deeper helical piles with higher L/D ratios showed greater pullout capacity and helical piles showed more resistance to the applied uplift forces than ordinary piles because of the presence of the helix plates which provides extra anchorage in deep soil layers.
-
3.
The pullout force increase with increasing diameters and number of helix plate.
-
4.
A relationship is obtained for the helical piles upward movement that provides the required dimensions of any unloaded pile fully embedded in high expansive soil for zero upward movement or any recommended tolerable movements. For loaded piles, the results obtained from this relationship will be on the safe conservative side.
-
5.
The amount of the upward movement of model of four helical piles group embedded in expansive soil increases with the increase of pile spacing, helix diameter and number of helix for shallower depths, but decreases with increasing the lengths of the helical piles.
-
6.
The maximum upward movement of helical piles group is less than that of single helical pile. As helical piles spacing increased, the maximum upward movement is approximated to that of single piles.
-
7.
The design charts presented in this study for single and group of four helical piles embedded in high expansive soil can provide the required dimensions and spacing for any unload groups of four helical piles for zero upward movement or any recommended tolerable relative movements. For loaded helical piles groups, the results obtained from this design chart will be on the conservative side.
References
Black DR, Pack JS (2001) Design and performance of helical piles in collapsible and expansive soil in arid regions. In: Proceedings of 36th symposium, engineering geology and geotechnical engineering. University of Nevada, Nevada
Elsherbiny Z, El Naggar MH (2013) The performance of helical pile groups under compressive loads: a numerical investigation. In: Proceedings of the 18th international conference on soil mechanics and geotechnical engineering, Paris
Hanna A, Ghaly AM (1994) Ultimate pullout resistance on groups of vertical anchors. Can Geotech J 31(5):673–682
Howard AP (2009) Helical piles. John Wiley and Sons, Berlin
Mendoza CC, Cunha R, Lizcano A (2014) Mechanical and numerical behavior of groups of screw (type) piles founded in a tropical soil of the Midwestern Brazil. Comput Geotech 30(67):187
Narasimha SR, Dinakar MS, Shetty MD (1991) The behaviour of model screw piles in cohesive soils. Jpn Soc Soil Mech Found 31(2):35–50
Pack JS (2006) Performance of square shaft helical pier foundations in swelling soils. Geo-Volution 4:76–85
Sudha R (2013) Prediction of swelling pressure of expansive soils using composional and environmental factors. Int J Civil Eng Technol 4(3):134–142
Ethics approval and consent to participate
Not applicable.
Publisher’s Note
Springer Nature remains neutral with regard to jurisdictional claims in published maps and institutional affiliations.
Author information
Authors and Affiliations
Corresponding author
Rights and permissions
Open Access This article is distributed under the terms of the Creative Commons Attribution 4.0 International License (http://creativecommons.org/licenses/by/4.0/), which permits unrestricted use, distribution, and reproduction in any medium, provided you give appropriate credit to the original author(s) and the source, provide a link to the Creative Commons license, and indicate if changes were made.
About this article

Cite this article
Albusoda, B.S., Abbase, H.O. Performance assessment of single and group of helical piles embedded in expansive soil. Geo-Engineering 8, 25 (2017). https://doi.org/10.1186/s40703-017-0063-x
Received:
Accepted:
Published:
DOI: https://doi.org/10.1186/s40703-017-0063-x