
Abstract
Background
When you make a forex transaction, you sell one currency and buy another. If the currency you buy increases against the currency you sell, you profit, and you do this through a broker as a retail trader on the internet using a platform known as meta trader. Only 2% of retail traders can successfully predict currency movement in the forex market, making it one of the most challenging tasks. Machine learning and its derivatives or hybrid models are becoming increasingly popular in market forecasting, which is a rapidly developing field.
Objective
While the research community has looked into the methodologies used by researchers to forecast the forex market, there is still a need to look into how machine learning and artificial intelligence approaches have been used to predict the forex market and whether there are any areas that can be improved to allow for better predictions. Our objective is to give an overview of machine learning models and their application in the FX market.
Method
This study provides a Systematic Literature Review (SLR) of machine learning algorithms for FX market forecasting. Our research looks at publications that were published between 2010 and 2021. A total of 60 papers are taken into consideration. We looked at them from two angles: I the design of the evaluation techniques, and (ii) a meta-analysis of the performance of machine learning models utilizing evaluation metrics thus far.
Results
The results of the analysis suggest that the most commonly utilized assessment metrics are MAE, RMSE, MAPE, and MSE, with EURUSD being the most traded pair on the planet. LSTM and Artificial Neural Network are the most commonly used machine learning algorithms for FX market prediction. The findings also point to many unresolved concerns and difficulties that the scientific community should address in the future.
Conclusion
Based on our findings, we believe that machine learning approaches in the area of currency prediction still have room for development. Researchers interested in creating more advanced strategies might use the open concerns raised in this work as input.
Introduction
The foreign exchange or forex market is the largest financial market in the world where currencies are bought and sold simultaneously. It is even larger than the stock market; According to the 2019 Triennial Central Bank Survey of FX and Over-the-Counter (OTC) derivatives markets, it has a daily volume of $6.6 trillion [7]. It is a non-centralized market that operates 24 h a day except the weekend, which makes it unique from other financial markets. Because of its high volatility, nonlinearity, and irregularity, the forex market, unlike stocks, is one of the most complex markets [1]. The traits of Forex show differences compared to the stock, bond, and other financial markets. These differences make forex traders have more trading opportunities and advantages for profitable trades. Some of these advantages include no commissions, no middlemen, no fixed lot size, low transaction costs, high liquidity, almost instantaneous transactions, low margins/high leverage, 24-h operations, no insider trading, limited regulation, and online trading opportunities [73]. In the forex market, currency pairs are traded, with the base currency being the first listed currency and the quote currency being the second. Currency pairs compare the value of one currency to another (the base currency to the quote currency). When the prices depreciate, a quote currency is bought against the base currency, which leads to profit, and when the prices elevate, the base currency is bought against the quote currency [1]. Two main types of techniques are used to forecast future values for a typical financial time series, which are fundamental analysis and technical analysis. Fundamental analysis is a method of examining economic, social, and political issues that may influence currency prices in the forex market. In contrast, technical analysis involves using historical data price chart, which provides a roadmap for past price behavior. To forecast the future, a technical analyst looks to the past. Predicting the direction of a currency pair's movement is the most important choice in Forex. Predicting currency movement correctly can bring many benefits to traders and vice versa. In past and recent years, the research community has been highly active in predicting the forex market using machine-learning models. On one hand, many verifiable types of research have been conducted with the aim of understanding and predicting currency trends in the forex market using machine-learning models. According to Zhelev and Avresky [77], the cited literature in the field of deep learning is a basic foundation for solving the challenging problem of prediction of forex price. While the research community has spent a lot of time studying the methodologies used by researchers and practitioners in the context of predictive models in the forex market, there isn't much information on how to forecast currency pair movement in the forex market using machine-learning models and Meta-Analysis. To address this gap in knowledge, we conducted a Systematic Literature Review (SLR) on the use of machine learning (ML) techniques for forex market forecasting, with the goal of (i) understanding and summarizing current algorithms and models, and (ii) analyzing its evaluation metrics and open challenges to guide future research. Our SLR is to provide a complete examination of I machine learning as it has been considered in previous research, and (ii) the training processes used to train and assess machine learning algorithms. We also give a meta-analysis of the performance of the machine learning models that have been developed so far, as judged by their assessment criteria. In addition to examining the state of the art, we critically examined the approaches that have been applied thus far.
Research questions posed for our systematic literature review
Research Question | Motivation |
|---|---|
1. For forecasting, what machine learning algorithm was used? | To look into the most up-to-date machine learning approaches for forecasting the FX market that has been considered so far |
2. What dataset was used to train the model, the period and timeframe considered in the literature | In terms of machine learning algorithms, examine the machine learning parameters employed in previous studies. The answers to these questions will help practitioners and researchers figure out the best machine learning configuration for FX market forecasting: which training technique will produce the greatest forecasting results |
3. Evaluation setup i. What types of validation techniques were exploited? ii. What evaluation measures were employed to get access to the prediction models? | |
3. Performance Meta-Analysis: using evaluation metrics of the selected studies | Examine the approaches studied to (i) validate and (ii) assess the proposed forex market forecasting models |
Related research
Our objective is to conduct a systematic literature review to comprehend and summarize studies on machine learning prediction models in the forex market. It's worth noting, however, that some secondary research on machine learning algorithms and deep learning has been proposed. [18, 27, 44, 54, 59].
According to Fletcher [18] when including advanced exogenous financial information to estimate daily FX carry basket returns, committees of discriminative techniques such as Support Vector Machines (SVM), Relevance Vector Machines (RVM), and Neural Networks) perform well.
Panda et al. [44] conducted a second SLR on Exchange Rate Prediction utilizing ANN and Deep Learning Methodologies, and offered novel approaches that were distinct according to them from 2000 to 2019, for predicted exchange rate projection the effects observed during the protected period within examined are displayed using newly proposed models such as Artificial Neural Network (ANN), Functional Link Artificial Neural Network (FLANN), Hidden Markov Model (HMM),
Support Vector Regression (SVR), an Auto-Regressive (AR) model. Some of the suggested novel neural network models for forecasting, on the other hand, took into account theoretical support and a methodical approach in model creation. This results in the transmission of new deep neural network models.
Islam et al. [27] conducted a SLR, which looked at recent advances in FOREX currency prediction using machine-learning algorithms. They utilized a keyword-based search approach to filter out popular and relevant research from papers published between 2017 and 2019. They also used a selection algorithm to decide which papers should be included in the review. They analyzed 39 research articles published on "Elsevier," "Springer," and "IEEE Xplore" that forecasted future FOREX prices within the specified time frame based on the selection criteria. According to their findings, in recent years, academics have been particularly interested in neural network models, pattern-based approaches, and optimization methodologies. Many deep learning algorithms, like the gated recurrent unit (GRU) and long short-term memory (LSTM), have been thoroughly investigated and show great promise in time series prediction.
Evaluating the Performance of Machine Learning Algorithms in Financial Market Forecasting was the subject of Ryll & Seidens [54] study, more than 150 related publications on utilizing machine learning in financial market forecasting were reviewed in this study. They created a table across seven primary factors outlining the experiments done in the studies based on a thorough literature review. They provide a simple, standardized syntax for textually describing machine-learning algorithms by listing and classifying distinct algorithms. They conducted rank analyses to analyze the comparative performance of different algorithm classes based on performance criteria acquired from publications included in the survey. In financial market forecasting, machine-learning algorithms beat most classic stochastic methods, according to their findings. They also discovered evidence that recurrent neural networks outperform feed-forward neural networks and support vector machines on average, implying that there are exploitable temporal relationships in financial time series across asset classes and countries. The same is true when comparing the benefits of different machine learning architectures.
Sezer et al. [59] did a thorough evaluation of DL studies for financial time series forecasting implementations. Convolutional Neural Networks (CNNs), Deep Belief Networks (DBNs), and Long-Short Term Memory (LSTM) were used to categorize the papers. Their findings show that, despite the fact that financial forecasting has a lengthy study history, overall interest in the DL community is increasing as a result of the use of new DL models,thus, there are numerous chances for researchers. They also attempted to predict the field's future by highlighting potential bottlenecks and opportunities in order to aid interested scholars.
Berradi et al. [6] suggested that giving the latest research of deep learning techniques applied to the financial market field can help investors to make an accurate decision. They gathered all the recent articles related to deep learning techniques applied to forecasting the financial market, which includes the stock market, stock index, commodity forecasting, and Forex. Their main goal was to find the most models used recently to solve the prediction problem using RNN, their characteristics, and their novelty. They gave all aspects that involve the process of forecasting beginning with preprocessing, the input features, the deep learning techniques, and the evaluation metrics employed. Their finding is that the hybrid model outperforms the traditional machine learning techniques, which leads to the conclusion that there is a very strong relationship between the combination of all the approaches and better prediction performance.
The goal of Henrique et al. [23] is to present methods for selecting the most important advances in machine learning applied to financial market prediction to present a review of the articles chosen, clarify the knowledge flow that the literature follows, and propose a classification for the articles. In addition, their study provides an overview of the best approaches for applying machine learning to financial time series forecasting as determined by the literature. The publications were then objectively assessed and categorized into the following categories: markets utilized as test data sources, predictive variables, predicted variables, methodologies or models, and performance metrics used in comparisons. In all, 57 papers from 1991 to 2017 were examined and categorized, spanning the specialist literature. Based on searches of connected article databases, no reviews employing such objective methodologies as main route analysis on the topic provided here were discovered according to them. The most cited articles, those with the highest bibliometric coupling and co-citation frequencies, the most recently published articles, and those that are part of the primary path of the literature studied knowledge flow were all discussed in the study. It should be highlighted that they were objective and straightforward survey methodologies, independent of the researcher's expertise, that could be used not just for preliminary research but also as knowledge validation for seasoned experts. In addition, the prediction algorithms and key performance measures for each article were presented. In addition to using neural and SVM networks, the authors used data from the North American market extensively. Similarly, the majority of the forecasts are based on stock indexes. New suggested models will likely be compared to neural and SVM network benchmarks, using data from the North American market, as one of the probable findings regarding the categorization presented in the research. The examination of the behavior of forecasts in developing markets, such as those of the BRICS, as well as the application of novel models in financial market prediction, continues to provide research opportunities.
Kaushik [32] presents a comprehensive review of contemporary research on Machine Learning and Deep Learning for exchange rate forecasting, based on peer-reviewed publications and books. The paper examines how Machine Learning and Deep Learning algorithms vary in projecting exchange rates in the FOREX market. SVM, Deep learning approaches such as Feedforward Neural networks, and hybrid ensembles have superior prediction accuracy than standard time series models, according to research. Future research should be conducted to assess the performance of these models, according to the authors,however, no single forecasting model consistently stands out as the best when evaluated using different criteria and on different currency pairs, and decisions based on the models' predictions should be used with caution.
Regarding the publications mentioned above, it's worth noting that none of them focused specifically on machine-learning methods for the FX market from 2010 to 2021. Fletcher [18] concentrated on discriminative approaches (Support Vector Machines (SVM), Relevance Vector Machines (RVM), and Neural Networks) without examining other machine learning algorithms critically.
Islam et al. [27] took into account machine learning in the context of forex trading, highlighting Regression Methods, Optimization Techniques, SVM Method, Neural Network Chaos Theory, Pattern-based Methods, and Other Methods, but the period under consideration was from 2017 to 2019, but there has been a lot of work in this area over the last two decades. Panda et al. [44] concentrated on deep learning and hybrid techniques, as well as a few other machine learning algorithms, but the number of publications chosen was insufficient for the period under evaluation.
The research published by Sezer et al. [59] focused on deep learning research by looking at Convolutional Neural Networks (CNNs), Deep Belief Networks (DBNs), and Long-Short Term Memory (LSTM): however, there are other deep learning models such as Radial Basis Function, Multi-layer Perceptron, and many more deep learning methods that have been used in forex market prediction that were not looked at by the article.
Contributions
The following are the contributions by this SLR:
-
1.
We took a critical look at 60 primary articles or studies that present machine learning forecasting models in the forex market. Researchers can use them as a beginning stage to expand the knowledge on the topic.
-
2.
We give a comprehensive summary of the primary studies found. This section is divided into three sections: I machine learning methodologies, (ii) evaluation strategies, and (iii) performance analysis of the presented models.
-
3.
Based on our findings, we offer guidance and recommendations to help further research in the field.
Research methodology
In this study, a systematic literature review was employed as a research approach since it is a defined and methodical way of discovering, evaluating, and studying existing material in order to investigate a certain research issue or phenomenon Barbara [5].
We followed the SLR rules that were proposed by Barbara [5]. In addition, we incorporated the process of systematic reference inclusion, often known as "snowballing," as outlined by [71].
We adopted the SLR guidelines proposed by [71].
The following subsections describe the process followed.
Search strategy
A technique was proffered to retrieve all published articles/papers/literature associated with the topic. Our primary studies retrieval techniques involve search terms and phrase identification, databases to be searched, search and paper picking strategy adopted for the study.
Identifying search terms and phrases
To find the relevant search terms and phrases we followed five steps outlined by Barbara [5]:
-
a.
We found alternative spellings and/or synonyms for all major terms and phrases;
-
b.
We double-checked the keywords in any important paper;
-
c.
In cases where a database supports it, we employed Boolean operators for conjunction, such as the OR, AND operator for concatenation of major phrases and operator for concatenation of alternative spellings and synonyms If necessary, we combined the search string into a summary form.
Results for a). To better tailor our search keywords, we first defined the population, intervention, and outcome. Specifically:
Results for b). The alternative spellings and synonyms identified are:
-
Forex: (“forex “OR “foreign exchange”).
-
Market: (“Market “OR “trading”).
-
forecasting: (“forecasting” OR “predicting”)
-
Machine Learning: (“machine learning” OR “supervised learning” OR “classification” OR “regression” OR “unsupervised learning”);
Results for c). We searched through the keywords in the relevant papers/articles and couldn't come up with any further spellings or synonyms to add to the list of terms to consider.
Results for d). The following search query was created using Boolean operators:
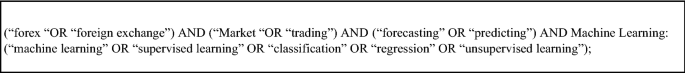
Results for e). We also defined the short search string reported below, due to the IEEE Xplore digital library's search term limitation:

Resources searched
In an SLR, selecting appropriate resources to search for germane material is critical. All available literature relevant to our study topics was selected and searched using the following resources:
-
Google Scholar (https://scholar.google.com)
-
IEEE Xplore digital library ( https://ieeexplore.ieee.org)
-
ScienceDirect ( https://www.sciencedirect.com)
-
Microsoft Academic (https://academic.microsoft.com)
-
ACM digital library ( https://www.acm.org)
Our decision to use these databases was based on our desire to collect as many publications as possible in order to adequately conduct our systematic literature review.
Because they contain a massive amount of literature related to our research questions, such as journal articles, conference proceedings, books, and other materials, the chosen sources or databases are recognized as one of the most representative for Forex market forecasting research and are used in many other SLRs.
Article selection process
Figures 1, 2 and 3 depicts the article selection procedure used in this study. The selection procedure is described in depth in the subsections that follow.
-
a.
We gathered the main research in the digital libraries specified in “Resources searched” section using the search strings given in “Identifying search terms and phrases” section. The search technique was restricted by a chronological range, therefore publications from 2010 to 2021 were examined. Table 1 second column displays the search results generated by the digital libraries: As you can see, we downloaded a total of 120 documents related to the query.
-
b.
We started by removing non-relevant publications from the complete list of retrieved sources using the exclusion criteria (detailed reported in “Resources searched” section). The exclusion criteria were applied after reading the title, abstract, and keywords of the 120 publications discovered. Table 1 shows data source and search results with 120 initial papers and 20 removed, leaving 100 for the second step of screening, which included the inclusion criteria. This approach yields our final search string, which consists of 60 articles (60 percent of the papers discovered in the previous stage).
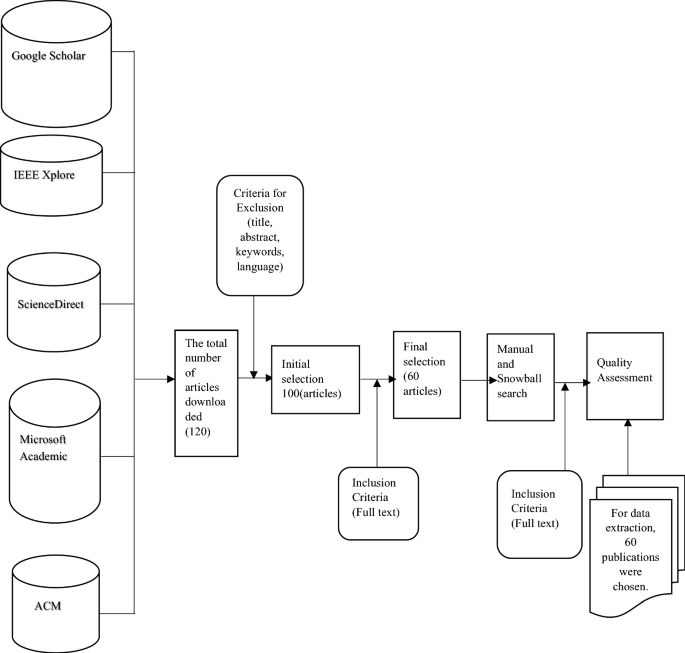
Article selection process

Showing conceptual framework for data extraction from the primary studies

VOSviewer (http://www.vosviewer.com/) was used to undertake a bibliographic coupling analysis. The number of references that are common across the publications evaluated is represented by the size and color of the nodes. The number of referenced references that two publications have in common is indicated by the link's strength
Point c should be critically looked at.
-
c.
We employed a snowballing strategy to seek for possible missing papers [71]. The technique of identifying more sources using a paper's reference list or citations is known as snowballing [71]. In our context, we employed both forward and backward snowballing: with the former, we included articles that were referred to in the initially selected papers, and with the latter, we included publications that were referenced in the initially selected papers. We followed the same method as before, scanning the titles, abstracts, and keywords of the snowballed papers and applying the exclusion/inclusion criteria again: as a consequence, several publications were recognized as requiring further examination.
-
d.
Given a collection of 60 sources identified using search string and then supplemented with those collected via snowballing. As a result, 60 papers made it through all of the stages.
-
e.
We used the last filtering, i.e., the quality assessment step, after we had determined the set of final articles to evaluate in the SLR, to ensure that all of the final articles provided the data required to answer our research questions (see “Evaluation of the study's quality” section). As a result of this phase, we were able to compile the final list of articles for our study. Until this point, all 60 sources found had passed the quality check. As a result, our SLR is based on 60 studies. “Extraction of data” section details the data extraction procedure. The next subsections include (i) inclusion/exclusion criteria, (ii) the procedure's quality evaluation method, and (iii) the data extraction process.
Inclusion and exclusion criteria
An article has to meet the following criteria to be useful in answering our research questions.
A. Exclusion criteria: We omitted sources that satisfied the following limits from our research:
-
Articles about predicting methods other than machine learning.
-
Articles written in a language besides English.
-
Articles that aren't available in their whole.
B. Sources that complied with the following restrictions were considered for inclusion in our research:
-
All the articles, written in English, report machine learning techniques for forex market forecasting;
-
Articles that provide new strategies for improving the performance of existing machine learning algorithms for forecasting FX markets. It's worth noting that we included a wide range of publications (for example, journal, conference, workshop, and short papers) in order to compile a comprehensive collection of relevant resources.
Evaluation of the study's quality
After the final selection process, the quality of the publications was assessed. The legitimacy and completeness of the selected publications were assessed using the checklist below.
-
Q1: Does the machine learner classifier have a well-defined definition?
-
Q2: Can you tell me about the evaluation methodologies.
Consider the scenario in which research uses MAE, RMSE as an assessment statistic.
Extraction of data
We began extracting the data needed to address our study questions once we had chosen the final publications to be utilized for the SLR. We depended on the data in particular.
Table 2 shows the extraction form used in the selected publications, such as the machine learning algorithm.
Extraction of data form
Once we'd decided on the final papers for the SLR, we started extracting the data we'd need to answer our research questions. We used the data extraction form shown in Table 2 in particular. In addition to information on the specific aspects under examination, such as the machine learning approach employed in the selected publications, we have left aside a section for characterizing baseline models of the analyzed study. This made it easy to find a baseline model of prior research as well as future research direction.
Conceptual framework for data extraction
Result
In this part, we offer a brief description of the demographics of the articles that passed the inclusion/exclusion criteria and the quality evaluation before providing the findings of the SLR with regard to the examined research topics.
Characteristics of the population
The final list of relevant primary studies evaluated in this SLR is presented in Tables 3 and 4, with columns 'Year' and 'Book/Book Chapter/ Conf./Article/Thesis' indicating the year of publication and the periodicals in which the study was published. As can be seen, all of the articles evaluated were published between 2010 and 2021; 80% of this primary research were published after 2014, perhaps indicating a developing tendency that is now establishing itself as a more established subject. In conclusion We determined that the application of machine learning techniques for FX market prediction still poses open difficulties based on the quantity and types of papers released by the research community.
RQ1—Algorithm for machine learning
The first research question of our SLR was connected to the machine learners utilized in the literature, as identified in the primary papers. We wanted to know I whose machine learning method was used, (ii) what deep learning (Neural Network and related algorithms) was used, and (iii) what additional machine learning strategies were used. The outcomes of our analyses are detailed in the subsections below.
Beyond the 60 primary considered from 2010 to 2021, some papers published in 2022 as shown in Table 5 used machine learning algorithms including the authors publication were also looked at but did not affect the analysis of the initial 60 papers.
RQ2.3 Machine Learning algorithms
Our investigation revealed that a wide range of machine learning methods were applied. The bar chart in Fig. 4 displays the algorithms utilized in the primary investigations, as well as their frequency of presence. The machine learning method, the primary research in which it was utilized, and the number of primary studies that employed it are all listed in Table 6. It's worth noting that many or hybrid algorithms may have been utilized in single primary research.

Bar chart reporting the number of primary studies and the machine learning algorithm adopted in each
LONG SHORT MEMORY NEURAL NETWORK (LSTM) as it is possible to these was investigated and used by 19 primary studies. A possible reason lies into the output of this type of models, which has shown a great performance and to properly analyze non-linear data, its ability to overcome the varnishing gradient problem pose by other neural networks.
ARTIFICIAL NEURAL NETWORK (ANN) as a deep learning model was also used by 19 primary studies indicating a growing trend in the use of it in the forex market prediction.
CONVOLUTIONAL NEURAL NETWORK is one of the deep learning algorithms that has not receive massive usage in the forex market, this model was use by 6 of our primary studies but can be further exploited in the foreign exchange market.
SUPPORT VECTOR MACHINE (SVA) was also used a number of times, 11 primary studies used this algorithm which is the third most used algorithm according to Figs. 4, 5, 6 and 7. This classifier, as previously described by Farhat [17] can attain very high performance.

Validation approaches used in primary investigations are depicted in a pie chart
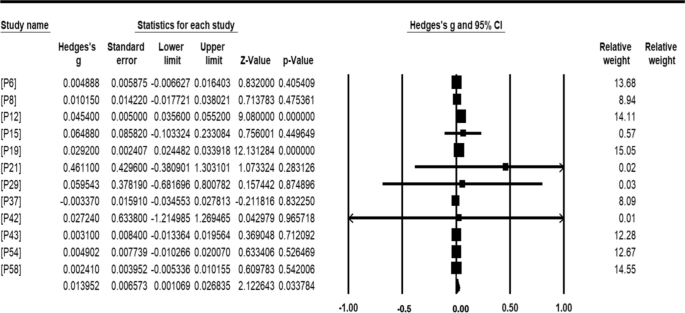
Results of meta-analysis based on MAE as Hedge's g and RMSE as Standard error
Results of meta-analysis based on MAE as Hedge's g and RMSE as Standard error
GRU stands for GATED RECURRENT UNIT and is a type of RNN with a gating mechanism. Compared to LSTMs, GRUs do not contain an output gate [57], four primary studies exploited this algorithm for their work.
REINFORCEMENT LEARNING (RL) this algorithm has not been exploited much as only two of our primary studies made use of it showing more opportunity in the use of this algorithm in the forex market.
MULTILAYER PERCEPTRON (MLP) is a feedforward artificial neural network (ANN) with three layers of nodes: input, hidden layer, and output layer. Except for the input nodes, each node in our selection is a neuron with a nonlinear activation function. Four key papers used this approach in their research.
LOGISTIC/LINEAR REGRESSION this machine learning algorithm was used by 4 of our primary studies, not popular in forex prediction.
RECURRENT NEURAL NETWORK Unlike traditional feedforward neural networks, RNNs have memory. Information fed into them persists, and the network can draw on this to make inferences. 8 papers from our primary studies used RNN for forex prediction.
DECISION TREE As may be seen, three key research studied Decision Trees. The output of these types of models, which consists of a rule describing the requirements for making a choice, could be one reason.
FUNCTION ON A RADIAL BASE NEURAL NETWORK (RBF) is a real-valued function whose value is solely determined by the distance between the input and a fixed point, such as the origin or another fixed point known as the center. This neural network was used by two of our key studies for their prediction models since any function that satisfies the property is a radial function.
EXTREME LEARNING MACHINES, BAYESIAN COMPRESSED VECTOR, K-NEAREST NEIGHBOR, NAÏVE BAYE AND RANDOM FOREST these are the least use algorithms according to our primary studies, from our studies we noticed that these algorithms were used in only one paper each showing the unpopularity in forex prediction.
FUZZY RELATIONAL MODEL was combined with other machine learning algorithms in predicting the forex market, 6 papers adopted this model in our primary studies.
The GENETIC ALGORITHM is a search heuristic based on Charles Darwin's natural selection hypothesis. This algorithm mimics the natural selection process, in which the most fit individuals are chosen for reproduction in order to create offspring for the following generation. It was combined with other machine learning models in predicting currency direction. 2 of our primary studies made us of this algorithm.
RQ2-dataset
Currency pairs are grouped into two thus the major and the minor, the major pairs are the four most heavily traded currency pairs in the forex (FX) market. The EUR/USD, USD/JPY, GBP/USD, and USD/CHF are the four major pairs at the moment. The EUR/USD is the most widely traded currency pair in the world, accounting for more than 20% of all forex transactions. The USD/JPY is a distant second, followed by the GBP/USD and, with a minor part of the global currency market, the USD/CHF. 75 percent of all forex trades are made on the big pairings. Minor currency pairs are ones which leave out the United States dollar, and they are normally less liquid. Examples include the euro and Swiss franc (EUR/CHF), Canadian dollar and Japanese yen (CAD/JPY), or pound sterling and Australian dollar (GBP/AUD etc.
Table 7 show the major currency pairs and corresponding primary papers/ articles that made use of dataset of them. From the table 42 papers made use of the EUR/USD currency pair and we can clearly say that according to our finding, it is the most traded and used currency pair. 18 papers made use of datasets of USD/GBP which is the next most traded pair after EUR/USD from our primary studies. USD/JPY came third as the next most used dataset from our study with 13 papers making use of its dataset. Last is USD/CHF dataset with 10 papers making use of it. From our study, we found out that some papers/articles made use of more than one dataset of the major currency pair. Some papers combined both minor and major pairs.
RQ3—evaluation setup
Our third research question revolves around the machine learning forecasting model evaluation strategies. It refers to:
-
i.
validation techniques,
-
ii.
evaluation metrics adopted, and
-
iii.
datasets exploited.
RQ3.1—validation techniques
70% of the pie chart which is made up of 42 primary studies used percentage split only as a validation technique which is the most used validation technique in the 60 primary studies. 3 of the primary studies made use of percentage split and cross-validation representing 5% of the total primary studies. Articles that used cross-validation only represent 5% of the total primary studies which is just 3 articles. Some primary studies were designed as systems that did not make use of any validation techniques and that took 18% of the primary studies representing 11 papers or studies, one validation technique.
that came up only is Random sub-sampling validation that is just 2% of the total primary studies. Papers that used percentage split divided the dataset into two parts (Training and Test dataset) with the large part for training with the other part for the test. K-Fold cross-validation was used with K being set to 10. In this approach, the technique divides the original data set into ten equal-sized subsets at random. One of the ten subsets is kept as a test set, while the other nine are utilized as training sets. The cross-validation is then done ten times, with each of the ten subsets serving as the test set exactly once [26].
Table 8 shows evaluation metrics adopted by the primary studies, the most widely used are Mean Absolute Error (MAE), Mean Absolute Percentage Error (MAPE), Root Mean Square Error (RMSE), and Mean Square Error (MSE). Studies [P20], [P27], [P28], [P29], [P31], [P33], [P34], [36], [P37], [P43], [P44] adopted evaluations metrics that didn’t appear in any other primary paper aside them.
RQ4—meta-analysis of performance
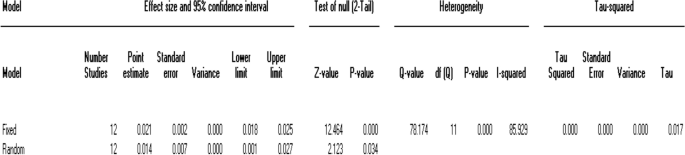
The last research topic of our study was a statistical meta-analysis of machine learning algorithm performance in Forex market forecasting. A complete re-execution of the prediction models on a shared dataset with common assessment criteria would have been perfect for this sort of investigation, allowing them to be benchmarked. This, however, is not covered by a Systematic Literature Review; the purpose is to combine the findings of the major investigations. We looked at the effects of I the machine learning algorithm and (ii) the validation approach in this research. A statistical meta-analysis seeks to combine several studies to improve the estimates of impact sizes and clarify uncertainty when separate research disagrees. While individual studies are frequently insufficient to establish solid generalizable results, their combination may result in a lower random error and smaller confidence ranges. Meta-analyses have another significant flaw: they are unable to compensate for poor study design and bias in the individual research. If the studies are carried out and evaluated appropriately, the benefits vastly outweigh the minor drawbacks. We used the recommendations provided in the book to conduct the meta-analysis. In a meta-analysis, the first step is to calculate the result of interest and summary statistics from each of the individual studies. Not all prior research evaluated the performance of the presented models in the same way, as described in the evaluation metrics. To have a common baseline, we utilized Mean Square Error, Root Mean Square Error, and other metrics that were used in most of the other sources. To make a fair comparison, we looked at all of the publications and the metrics used. Papers that evaluated the effectiveness of machine learning model prediction in terms of Mean Absolute Error (MAE), Mean Absolute Percentage Error (MAPE), Root Mean Square Error (RMSE), and so on.
The analysis is based on twelve studies. The standardized difference in means (d) is the effect size index. The results of this analysis will be generalized to comparable studies. Therefore, the random-effects model was employed for the analysis. If we assume that the true effects are normally distributed (in d units), we can estimate the prediction interval. For all of the values in the primary studies, we utilized Comprehensive Meta-Analysis v3 to derive effect size estimates. It's worth mentioning that effect sizes must be normalized in order to be comparable across research. We used Hedges' g as the standardized measure of effect magnitude to achieve this goal. There are three main statistics recorded here which are the Q-value with its degrees and P-value, the I-square statistics, and finally Tau-square however these statistics don’t tell us how much the effect size varies. In our case the Q-value is 78.174, the degree of freedom is 12 and P-value is 0.0. The next statistic recorded is I-square which is 85.929 in our analysis. Finally, the last statistic recorded is Tau-square which is the variance of true effects in our case Tau-squared is 0.017. The prediction interval tells how much the test size varies here we will report that the true effect size is 0.05 and 0.95. In our meta-analysis, the mean effect size using the Hedge's g is 0.013952 with the Mean Absolute Error of each selected study using the Hedges g value. A 0.5 effect size indicates that the treatment group's mean is half a standard deviation higher than the control group's mean, the effect sizes imply that the mean of the treatment group is half a standard deviation higher than the mean of the control group (Table 9).
Conclusion
The application of machine learning techniques for forex market forecasting was the subject of a systematic literature review in this research. It focused on three particular features of how prior research performed experiments on forex forecasting models, namely I which machine learning model was used, (ii) which sorts of assessment procedures were used, and (iii) what validation approaches were used. Our research was based on publications that were published between 2010 and 2021. We looked at 60 publications out of a total of 120 that proposed machine learning algorithms for FX market forecasting. Existing studies were examined, as well as unresolved topics that need to be addressed in a future study. The research shows that deep learning models like ANN, LSTM, MLP-Neural Networks, and Radial Basis Function are more suited for forecasting the forex market than other machine learning algorithms like KNN and Nave Baye. The results are encouraging. To make the research field more precise, we have offered a list of steps to take. As a result, we conclude that the conclusions on the use of percentage split are suspect, and that the dataset should be divided into three parts: training, test, and validation test. In this regard, we hope that our findings may serve as a springboard for further investigation.
Availability of data and materials
The datasets used and/or analyzed which are the primary studies have been referenced in Table 2 column citation during the current study and are available from the corresponding author on reasonable request.
Abbreviations
- MAE:
-
Mean Absolute Error
- MASE:
-
Mean Absolute Scaled Error
- MSFE:
-
Mean square forecasting error
- MAPE:
-
Mean absolute percentage error
- AIC:
-
Akaike Information Criterion
- SEM:
-
Standard Error of the Mean
- RMSE:
-
Root Mean Square Error
- BIC:
-
Bayesian Information Criterion
- ME:
-
Mean Error
- MSE:
-
Mean Square Error
- NN1:
-
Neural Network 1
- ARV:
-
Average relative variance
- R2:
-
R-Square
- NN2:
-
Neural Network 2
- MAFE:
-
Mean absolute forecasting error
- AUC:
-
Area Under Curve
- NN3:
-
Neural Network 3
- MPE:
-
Mean Percentage Error
- RBI:
-
Reserve Bank of India
- BCVAR-MS:
-
Bayesian Compressed Vector Autoregression Mean Square
- MAD:
-
Mean absolute deviation
- NA:
-
Not applicable
- ETS:
-
Exponential smoothing
- PF:
-
Profit factor
- ELM:
-
Extreme Learning Machine
- NSGA-II:
-
Non dominated sorting genetic algorithm II
- CGP:
-
Cartesian Genetic Programming
- ARIMA:
-
Autoregressive integrated moving average
- ReLU:
-
Rectified linear unit
- H1:
-
One Hour Time frame
- H4:
-
Four Hour Time frame
- 1d:
-
Daily Time frame
References
Ahmed S, Hassan SU, Aljohani NR, Nawaz R. FLF-LSTM: a novel prediction system using Forex Loss Function. Appl Soft Comput J. 2020;97:106780. https://doi.org/10.1016/j.asoc.2020.106780.
Amo Baffour A, Feng J, Taylor EK. A hybrid artificial neural network-GJR modeling approach to forecasting currency exchange rate volatility. Neurocomputing. 2019;365:285–301. https://doi.org/10.1016/j.neucom.2019.07.088.
Baasher AA, Fakhr MW. Forex trend classification using machine learning techniques. Proceedings of the 11th WSEAS International Conference on Applied Computer Science, January 2011, 2011; pp. 41–47. http://www.wseas.us/e-library/conferences/2011/Penang/ACRE/ACRE-05.pdf
Bagheri A, Mohammadi Peyhani H, Akbari M. Financial forecasting using ANFIS networks with quantum-behaved particle swarm optimization. Expert Syst Appl. 2014;41(14):6235–50. https://doi.org/10.1016/j.eswa.2014.04.003.
Barbara K, Charters S. Meтoди зa aвтoмaтичнo yпpaвлeниe нa пoдeмни ycтpoйcтвa пpи Jack-up cиcтeмитe. 2007. https://doi.org/10.1145/1134285.1134500
Berradi Z, Lazaar M, Mahboub O, Omara H. A comprehensive review of artificial intelligence techniques in financial. CIST. 2020. https://doi.org/10.1109/CiSt49399.2021.9357175.
BIS. Foreign exchange turnover in April 2019: Preliminary Global Result. Triennial Central Bank Survey, September, 24. 2019. https://www.bis.org/statistics/rpfx19_fx.pdf. Accessed 18 Oct 2021.
Carapuço J, Neves R, Horta N. Reinforcement learning applied to Forex trading. Appl Soft Comput J. 2018;73:783–94. https://doi.org/10.1016/j.asoc.2018.09.017.
Contreras AV, Llanes A, Pérez-Bernabeu A, Navarro S, Pérez-Sánchez H, López-Espín JJ, Cecilia JM. ENMX: An elastic network model to predict the FOREX market evolution. Simul Model Pract Theory. 2018;86:1–10. https://doi.org/10.1016/j.simpat.2018.04.008.
Czarnowski I, Caballero AM, Howlett RJ, Jain LC. Preface. Smart Innov Syst Technol. 2016;56:v. https://doi.org/10.1007/978-3-319-39627-9.
D’Lima N, Khan SS. FOREX rate prediction using a Hybrid System. 2015;3(October):4–8.
Das SR, Mishra D, Rout M. A hybridized ELM-Jaya forecasting model for currency exchange prediction. J King Saud Univ Comp Info Sci. 2020;32(3):345–66. https://doi.org/10.1016/j.jksuci.2017.09.006.
Dautel AJ, Härdle WK, Lessmann S, Seow H-V. Forex exchange rate forecasting using deep recurrent neural networks. Digital Finance. 2020;2(1–2):69–96. https://doi.org/10.1007/s42521-020-00019-x.
Dobrovolny M, Soukal I, Lim KC, Selamat A, Krejcar O. Forecasting of FOREX price trend using recurrent neural network—long short-term memory. Proceedings of the International Scientific Conference Hradec Economic Days 2020, 10(Rundo 2019), 2020; pp. 95–103. https://doi.org/10.36689/uhk/hed/2020-01-011
Dymova L, Sevastjanov P, Kaczmarek K. A Forex trading expert system based on a new approach to the rule-base evidential reasoning. Expert Syst Appl. 2016;51:1–13. https://doi.org/10.1016/j.eswa.2015.12.028.
Escudero P, Alcocer W, Paredes J. Recurrent neural networks and ARIMA models for euro/dollar exchange rate forecasting. Appl Sci. 2021. https://doi.org/10.3390/app11125658.
Farhat NH. Photonit neural networks and learning mathines the role of electron-trapping materials. IEEE Expert Intell Syst App. 1992;7(5):63–72. https://doi.org/10.1109/64.163674.
Fletcher TSB. Machine learning for financial market prediction. 2012; p. 207. http://discovery.ucl.ac.uk/1338146/. Accessed 18 Oct 2021.
Galeshchuk S. Deep networks for predicting direction of change in foreign exchange rates, April 2016. 2017. https://doi.org/10.1002/isaf.1404
Galeshchuk S, Mukherjee S. Deep learning for predictions in emerging currency markets. ICAART 2017—Proceedings of the 9th International Conference on Agents and Artificial Intelligence, 2(Icaart), 2017; pp. 681–686. https://doi.org/10.5220/0006250506810686
Gonz C, Herman M. Foreign exchange forecasting via machine learning. 2018.
Hernandez-Aguila A, Garcia-Valdez M, Merelo-Guervos JJ, Castanon-Puga M, Lopez OC. Using Fuzzy inference systems for the creation of forex market predictive models. IEEE Access. 2021;9:69391–404. https://doi.org/10.1109/ACCESS.2021.3077910.
Henrique BM, Sobreiro VA, Kimura H . Literature review: Machine learning techniques applied to financial market prediction. Expert Syst Appl. 2019;124:226–51. https://doi.org/10.1016/j.eswa.2019.01.012
Huang SC, Chuang PJ, Wu CF, Lai HJ. Chaos-based support vector regressions for exchange rate forecasting. Expert Syst Appl. 2010;37(12):8590–8. https://doi.org/10.1016/j.eswa.2010.06.001.
Ignaccolo M, Inturri G. A Fuzzy approach to overbooking in air transportation. 2000;5(2):27–28.
Ilyas M, Palomba F, Shi L, Wang Q. Machine learning techniques for code smell detection: a systematic literature review and meta-analysis. Inf Softw Technol. 2019;108(4):115–38. https://doi.org/10.1016/j.infsof.2018.12.009.
Islam MS, Hossain E, Rahman A, Hossain MS, Andersson K. A review on recent advancements in FOREX currency prediction. Algorithms. 2020;13(8):1–23. https://doi.org/10.3390/A13080186.
Jena PR, Majhi R, Majhi B. Development and performance evaluation of a novel knowledge guided artificial neural network (KGANN) model for exchange rate prediction. J King Saud Univ Comp Info Sci. 2015;27(4):450–7. https://doi.org/10.1016/j.jksuci.2015.01.002.
Jubert de Almeida B, Ferreira Neves R, Horta N. Combining support vector machine with genetic algorithms to optimize investments in Forex markets with high leverage. Appl Soft Comput J. 2018;64:596–613. https://doi.org/10.1016/j.asoc.2017.12.047.
Jung G, Choi S. Autoencoder-LSTM Techniques. 2021.
Junior MA, Appiahene P, Appiah O. Forex market forecasting with two - layer stacked Long Short—Term Memory neural network (LSTM) and correlation analysis. J Electr Syst Info Technol. 2022;1:1–24. https://doi.org/10.1186/s43067-022-00054-1.
Kaushik OAA. Exchange rates prediction via deep learning and machine learning: a literature survey on currency forecasting. IJSR. 2018;7(12):1252–62.
Khoa BT, Huynh TT. Predicting exchange rate under uirp framework with support vector regression. 2022;6(3):619–630.
Kia A, SamanHaratizadeh, HadiZare. Prediction of USD/JPY exchange rate time series directional status by knn with dynamic time. Bonfring Int J Data Mining 2013:3(2):12–16. https://doi.org/10.9756/BIJDM.4658
Kondratenko VV, Kuperin YA. Using recurrent neural networks to forecasting of Forex. April 2003. 2013. http://arxiv.org/abs/cond-mat/0304469
Kumar Sarangi P, Chawla M, Ghosh P, Singh S, Singh PK. FOREX trend analysis using machine learning techniques: INR vs USD currency exchange rate using ANN-GA hybrid approach. Materials Today: Proceedings. 2021. https://doi.org/10.1016/j.matpr.2020.10.960
Lee CI, Chang CH, Hwang FN. Currency exchange rate prediction with long short-term memory networks based on attention and news sentiment analysis. Proceedings—2019 International Conference on Technologies and Applications of Artificial Intelligence, TAAI 2019, March. 2019. https://doi.org/10.1109/TAAI48200.2019.8959884
Mabrouk N, Chihab M. Intraday trading strategy based on gated recurrent unit and convolutional neural network : forecasting daily price direction. 2022. https://doi.org/10.14569/IJACSA.2022.0130369
Nagpure AR. Prediction of multi-currency exchange rates using deep learning. Int J Innov Technol Explor Eng. 2019;8(6):316–22.
Neves R, Horta N. Currency exchange prediction using machine learning , genetic algorithms and technical analysis. n.d.; pp. 1–23.
Nguyen T, Thu T. Using support vector machine in forex predicting. 2018 IEEE International Conference on Innovative Research and Development (ICIRD), May, 2018; pp. 1–5.
Nguyen T, Thu T, Xuan VD. FoRex trading using supervised. Mach Learn. 2018;7:400–4.
Ni L, Li Y, Wang X, Zhang J, Yu J, Qi C. Forecasting of Forex time series data based on deep learning. Procedia Comp Sci. 2019;147:647–52. https://doi.org/10.1016/j.procs.2019.01.189.
Panda MM, Panda SN, Pattnaik PK. Exchange rate prediction using ANN and deep learning methodologies: a systematic review. Indo-Taiwan 2nd International Conference on Computing, Analytics and Networks, Indo-Taiwan ICAN 2020—Proceedings, 2020; pp. 86–90. https://doi.org/10.1109/Indo-TaiwanICAN48429.2020.9181351
Pradeepkumar D, Ravi V. Forex rate prediction using chaos, neural network and particle swarm optimization. Lect Notes Comp Sci. 2014;8795:363–75. https://doi.org/10.1007/978-3-319-11897-0_42.
Putri KS, Halim S. Currency movement forecasting using time series analysis and long short-term memory. Int J Ind Optim. 2020;1(2):71. https://doi.org/10.12928/ijio.v1i2.2490.
Qi L, Khushi M, Poon J. Event-driven LSTM for forex price prediction. 1935.
Qu Y, Zhao X. Application of LSTM neural network in forecasting foreign exchange price. J Phys Conf Ser. 2019. https://doi.org/10.1088/1742-6596/1237/4/042036.
Raimundo MS. SVR-wavelet adaptive model for forecasting financial time series. 2018; pp. 111–114.
Reddy SK. Exchange rate forecasting using ARIMA neural network and fuzzy neuron. J Stock Forex Trading. 2015. https://doi.org/10.4172/2168-9458.1000155.
Rehman M, Khan GM, Mahmud SA. Foreign currency exchange rates prediction using CGP and recurrent neural network. IERI Procedia. 2014;10:239–44. https://doi.org/10.1016/j.ieri.2014.09.083.
Rundo F. Applied sciences deep LSTM with reinforcement learning layer for financial trend prediction in fx high frequency trading systems. 2019.
Rupasinghe M, Halgamuge MN, Tran Quoc Vinh N. Forecasting trading-time based profit-making strategies in forex industry: Using australian forex data. Proceedings of 2019 11th International Conference on Knowledge and Systems Engineering, KSE 2019, 2019; p. 1–9. https://doi.org/10.1109/KSE.2019.8919432
Ryll L, Seidens S. Evaluating the performance of machine learning algorithms in financial market forecasting: a comprehensive survey. 2019. http://arxiv.org/abs/1906.07786
Sadeghi A, Daneshvar A, MadanchiZaj M. Combined ensemble multi-class SVM and fuzzy NSGA-II for trend forecasting and trading in Forex markets. Expert Syst App. 2021;185:115566. https://doi.org/10.1016/j.eswa.2021.115566.
Saiful Islam M, Hossain E. Foreign exchange currency rate prediction using a GRU-LSTM hybrid network. Soft Comput Lett. 2020. https://doi.org/10.1016/j.socl.2020.100009.
Samarawickrama AJP, Fernando TGI. Multi-step-ahead prediction of exchange rates using artificial neural networks: a study on selected sri lankan foreign exchange rates. 2019 IEEE 14th International Conference on Industrial and Information Systems: Engineering for Innovations for Industry 4.0, ICIIS 2019—Proceedings, 2019; pp. 488–493. https://doi.org/10.1109/ICIIS47346.2019.9063310
Satapathy SC, Bhateja V, Udgata SK, Pattnaik PK. Preface. Adv Intell Syst Comput. 2017;515:v–vii. https://doi.org/10.1007/978-981-10-3153-3.
Sezer OB, Gudelek MU, Ozbayoglu AM. Financial time series forecasting with deep learning: a systematic literature review: 2005–2019. Appl Soft Comput J. 2020;90:2005–19. https://doi.org/10.1016/j.asoc.2020.106181.
Shahbazi N, Memarzadeh M, Gryz J. Forex market prediction using NARX neural network with bagging. MATEC Web Conf. 2016;68:6–10. https://doi.org/10.1051/matecconf/20166819001.
Sharma DK, Hota HS, Handa R. Prediction of foreign exchange rate using regression techniques. Rev Bus Technol Res. 2017;14(1):29–33.
Sher GI. DXNN Platform: The shedding of biological inefficiencies. 2010; pp. 1533–1534. http://arxiv.org/abs/1011.6022
Sidehabi SW. Statistical and machine learning approach in. 2016.
Taveeapiradeecharoen P, Chamnongthai K, Aunsri N. Bayesian compressed vector autoregression for financial time-series analysis and forecasting. IEEE Access. 2019;7:16777–86. https://doi.org/10.1109/ACCESS.2019.2895022.
The 7 Major Forex Currency Pairs in Trading|CMC Markets. (n.d.). https://www.cmcmarkets.com/en-gb/trading-guides/forex-currency-pairs. Accessed 18 Oct 2021.
Tiong LCO, Ngo DCL, Lee Y. Forex prediction engine: Framework, modelling techniques and implementations. Int J Comput Sci Eng. 2016;13(4):364–77. https://doi.org/10.1504/IJCSE.2016.080213.
Tiong LCO, Ngo DCL, Lee Y. Forex trading prediction using linear regression line, artificial neural network and dynamic time warping algorithms. Proceedings of the Fourth International Conference on Computing and Informatics (ICOCI ’13), 092, 2013, pp. 71–77. http://www.icoci.cms.net.my/proceedings/2013/PDF/PID92.pdf
Ulina M, Purba R, Halim A. Foreign exchange prediction using CEEMDAN and improved FA-LSTM. 2020 5th International Conference on Informatics and Computing, ICIC 2020. 2020. https://doi.org/10.1109/ICIC50835.2020.9288615
Vyklyuk Y, Vukovic D, Jovanovic A. FOREX prediction with neural network: USD/EUR currency pair. Actual Probl Econ. 2013;148(10):261–73.
Wei W, Li P. Multi-channel LSTM with different time scales for foreign exchange rate prediction. ACM International Conference Proceeding Series, 2019; 0–6. https://doi.org/10.1145/3373477.3373693
Wohlin C. Guidelines for snowballing in systematic literature studies and a replication in software engineering. ACM International Conference Proceeding Series. 2014. https://doi.org/10.1145/2601248.2601268
Vyklyuk Y, Darko Vuković AJ. Forex predicton with neural network: USD/EUR. Actual Probl Econ. 2013;10(10):251–61.
Yıldırım DC, Toroslu IH, Fiore U. Forecasting directional movement of Forex data using LSTM with technical and macroeconomic indicators. FIN. 2021;7(1):1–36. https://doi.org/10.1186/s40854-020-00220-2.
Zafeiriou T, Kalles D. Short-term trend prediction of foreign exchange rates with a neural-network based ensemble of financial technical indicators. Int J Artif Intell Tools. 2013;22(3):1–14. https://doi.org/10.1142/S0218213013500164.
Zhang B. Foreign exchange rates forecasting with an EMD-LSTM neural networks model. J Phys Conf Ser. 2018. https://doi.org/10.1088/1742-6596/1053/1/012005.
Zhao Y, Khushi M. Wavelet Denoised-ResNet CNN and LightGBM method to predict forex rate of change. IEEE International Conference on Data Mining Workshops, ICDMW, 2020-November, 2020; pp. 385–391. https://doi.org/10.1109/ICDMW51313.2020.00060
Zhelev S, Avresky DR. Using LSTM neural network for time series predictions in financial markets. 2019 IEEE 18th International Symposium on Network Computing and Applications, NCA 2019, 2019; p. 1–5. https://doi.org/10.1109/NCA.2019.8935009
Acknowledgements
Grateful to the department of computer science and informatics university of energy and natural resources, to all individuals who assisted in one way or the other to see this work through to completion God bless you.
Funding
This research did not receive funding from any source.
Author information
Authors and Affiliations
Contributions
MAJ searched through publication databases for the primary studies and also use inclusion and exclusion criteria to select the final studies for the research and assisted in performing the meta-analysis. PA played a supervisory role and assisted in designing data extraction form for retrieving interested information from the primary studies. OA analyzed and performed the bibliometric coupling for knowing the relationship that exists between the individual authors of each primary studies. CNB performed the meta-analysis of the twelve selected primary studies and reported the results. All authors read and approved the final manuscript.
Authors' information
MAJ is a master of philosophy in computer science student at the department of computer science and informatics at university of energy and natural resources at Sunyani Ghana. PA is the head of department for computer science and informatics at the university of energy and natural resources at Sunyani Ghana and direct supervisor to the corresponding author. OA co-supervisor to the main supervisor of the corresponding author and also coordinator for graduate studies of the department of computer science and informatics at university of energy and natural resources at Sunyani Ghana. CNB an assistant lecturer and a PHD candidate.
Corresponding author
Ethics declarations
Ethics approval and consent to participate
Not applicable.
Consent for publication
Not applicable.
Competing interests
The authors declare that they have no competing interests.
Additional information
Publisher's Note
Springer Nature remains neutral with regard to jurisdictional claims in published maps and institutional affiliations.
Rights and permissions
Open Access This article is licensed under a Creative Commons Attribution 4.0 International License, which permits use, sharing, adaptation, distribution and reproduction in any medium or format, as long as you give appropriate credit to the original author(s) and the source, provide a link to the Creative Commons licence, and indicate if changes were made. The images or other third party material in this article are included in the article's Creative Commons licence, unless indicated otherwise in a credit line to the material. If material is not included in the article's Creative Commons licence and your intended use is not permitted by statutory regulation or exceeds the permitted use, you will need to obtain permission directly from the copyright holder. To view a copy of this licence, visit http://creativecommons.org/licenses/by/4.0/.
About this article

Cite this article
Ayitey Junior, M., Appiahene, P., Appiah, O. et al. Forex market forecasting using machine learning: Systematic Literature Review and meta-analysis. J Big Data 10, 9 (2023). https://doi.org/10.1186/s40537-022-00676-2
Received:
Accepted:
Published:
DOI: https://doi.org/10.1186/s40537-022-00676-2