
Abstract
Deep learning has substantially advanced the state of the art in computer vision, natural language processing, and other fields. The paper examines the potential of deep learning for exchange rate forecasting. We systematically compare long short-term memory networks and gated recurrent units to traditional recurrent network architectures as well as feedforward networks in terms of their directional forecasting accuracy and the profitability of trading model predictions. Empirical results indicate the suitability of deep networks for exchange rate forecasting in general but also evidence the difficulty of implementing and tuning corresponding architectures. Especially with regard to trading profit, a simpler neural network may perform as well as if not better than a more complex deep neural network.
1 Introduction
Deep learning has revitalized research into artificial neural networks. Substantial methodological advancements associated with the optimization and regularization of large neural networks, the availability of large data sets together with the computational power to train large networks, and development of powerful, easy-to-use software libraries, deep neural networks (DNNs) have achieved breakthrough performance in computer vision, natural language processing, and other domains (LeCun et al. 2015). A feature that sets deep learning apart from conventional machine learning is the ability automatically extract discriminative features from raw data (Nielsen 2015). Reducing the need for manual feature engineering, this ability decreases the costs of applying a learning algorithm in industry, simplifies tasks associated with model maintenance, and, more generally, broadens the scope of deep learning applications.
Convolutional neural networks and recurrent neural networks (RNNs) have been particularly successful. The former represent the model of choice for computer vision tasks. RNNs are designed for processing sequential data including natural language, audio, and generally, any type of time series. The paper focuses on RNNs and examines their potential for financial time series forecasting.
Deep-learning-based forecasting models and their applications in finance have attracted considerable attention in recent research (Fischer and Krauss 2018; Huck 2019; Kim et al. 2019). However, only a small number of studies examine the foreign exchange (FX) market. This is surprising for several reasons. On the one hand, examining the degree to which market developments can be forecast with high accuracy is of academic and practical relevance. Moreover, exchange rates have been characterized as non-linear, stochastic, and highly non-stationary financial time series (Kayacan et al. 2010), which makes them particularly difficult to predict and an interesting subject for forecasting research (Wu and Chen 1998; Czech and Waszkowski 2012). Finally, the FX market differs notably from other financial markets so that research results from other markets such as stock markets may not generalize to the FX market.
The distinct characteristics of the FX market have been discussed in several studies. For example, most participants of the FX market are professional traders (Sager and Taylor 2006). The FX market also has a higher share of short-term interdealer trading compared to stock markets (Lyons 2001). Moreover, exchange rates fluctuate enormously leading to doubtful decision-making whether to buy or sell for traders (Bagheri et al. 2014). Because of this, models of fair value are less convincing for FX traders compared to stock market traders (Taylor 1995; Campbell et al. 1998). Given that the peculiarities question the generalizability of empirical results from other financial markets and the fact that research into state-of-the-art deep learning approaches for exchange rate forecasting is scarce motivate the focal study. The goal of the paper is to contribute to the empirical literature on FX forecasting by re-introducing deep machine learning-based forecasting methodology to the community and assessing the accuracy of corresponding models when forecasting exchange rate movements.
In particular, the paper reports original results from a comparative analysis of Long Short-Term Memory (LSTM) and Gated Recurrent Unit (GRU) neural networks versus benchmark models. Considering four exchange rates, we assess forecasting models in terms of their directional accuracy and the profitability of trading on model predictions. Our analysis of related literature (see Sect. 3) indicates that the last attempts to model price movements in the FX market using RNNs have been published more than a decade ago (Kiani and Kastens 2008; Hussain et al. 2008) and did not make use of advanced, gated RNNs, which have important advantages over traditional RNNs for temporal data processing. Therefore, we consider the empirical results reported in the paper a valuable and needed update of the state of affairs at the interface of deep learning and FX rate forecasting. Given the scarcity of deep learning-based approaches in the FX modeling literature, a secondary contribution of the paper may be seen in the fact that it provides a thorough explanation of the operating principles of RNNs vis-a-vis conventional feedforward neural networks (FNNs) and re-introduces recent RNN representatives in the form of LSTM and GRU to the FX modeling literature. In this scope, we also elaborate on the ways in which these recent RNNs overcome the vanishing gradient problem, which rendered previous attempts to train deep RNNs less effective.
The paper is organized as follows: the next section elaborates on neural network-based forecasting and introduces LSTM and GRU. Thereafter, we review related work and show how the paper contributes to closing gaps in research. Subsequently, we describe the experimental design of the forecasting comparison and report empirical results. We then conclude the paper with a summary and discussion of findings and an outlook to future research.
2 Neural network architectures
2.1 Feedforward neural networks
Neural networks consist of multiple connected layers of computational units called neurons. The network receives input signals and computes an output through a concatenation of matrix operations and non-linear transformations. In this paper, the input represents time series data and the output a (price) forecast. Every neural network consists of one input and one output layer, and one or multiple hidden layers, whereby each layer consists of several neurons. The connections between the neurons of different layers carry a weight. Network training refers to the tuning of these weights in such a way that network output (i.e., forecast) matches the target variable as accurately as possible. The training of a neural network through adjusting connection weights is equivalent to the task of estimating a statistical model through empirical risk minimization (Härdle and Leopold 2015).
The layer of a FNN comprises fully connected neurons without shortcuts or feedback loops. When processing sequential data, the activation of a hidden layer unit in an FNN at time t can be described as follows:
where the hidden activation function \(g_h\) is a function of the hidden weight matrix \(W_h\), an input vector \(x_t\), and a bias \(b_h\). It produces the hidden activation \(h_t\). A prediction \({\hat{y}}_t\) is the result of applying a suitable output activation function to the weighted sum of the activations received in the output layer. As such, the prediction is again only a function of inputs, weights, and biases.
The weights and biases determine the mapping from \(x_t\) to \({\hat{y}}_t\) and will be learned during training. A FNN will treat input sequences as time-invariant data and thus be agnostic of inherent features of time series. At any given point in time, t, a FNN takes an input \(x_t\) and maps it to a hidden activation \(h_t\). This is repeated at the time of the next observation, \(t+1\), while the two mappings are not interconnected.
2.2 Recurrent neural networks
RNNs are designed for sequential data processing. To this end, they include feedback loops and feed the output signal of a neuron back into the neuron. This way, information from previous time steps is preserved as hidden state \(h_t\) and can be discounted in network predictions. When viewed over time, RNNs resemble a chain-like sequence of copies of neural networks, each passing on information to its successor. More formally, a RNN takes as additional argument the previous time step’s hidden state \(h_{t-1}\):
The objective of training a neural network is to minimize the value of a loss function, which represents the cumulative difference between the model’s outputs and the true labels. Since the output of a neural network is a function of the weights and biases of all its connections, the loss function value can be changed by modifying the network’s weights and biases. Therefore, computing the gradient of the loss function with respect to the network’s weights obtains the information needed to train the network. The backpropagation algorithm uses the insight that the gradient with respect to each weight can be found by starting at the gradient with respect to the output and then propagating the derivatives backwards through the network using the chain rule (Rumelhart et al. 1986). In RNNs, the gradient descent-based training of the network is called backpropagation through time, as the error derivatives are not only backpropagated through the network itself but also back through time via the recurrent connections (Werbos 1990).
RNNs often use activation functions such as the hyperbolic tangent (\(\tanh\)) or the logistic sigmoid (\(\sigma\)). The derivative of both lies in the interval [0, 1] and thus any gradient with respect to a weight that feeds into such an activation function is bound to be squeezed smaller (Hochreiter 1998b). Given that we are successively computing the derivative of an activation function by use of the chain rule, the gradient gets smaller and smaller the further away a weight is from the output layer (see Fig. 1). In RNNs, this problem, routinely called the problem of gradient vanishing, is amplified by the sequential data processing of the network. Specifically, the gradient signal vanishes not only across layers but also across time steps. In consequence, RNNs face difficulties in modeling long-term dependencies, and much research has sought ways to overcome this issue (Schaefer et al. 2008). The problem of gradient vanishing also implies that the magnitude of weight adjustments during training decreases for those weights. Effectively, weights in early layers learn much slower than those in late hidden layers (closer to the output) (Nielsen 2015). For large networks or many time steps, this can keep a neural network from learning and prevent it from storing information, to a point where “the vanishing error problem casts doubt on whether standard RNNs can indeed exhibit significant practical advantages over time window-based feedforward networks” (Gers et al. 1999).
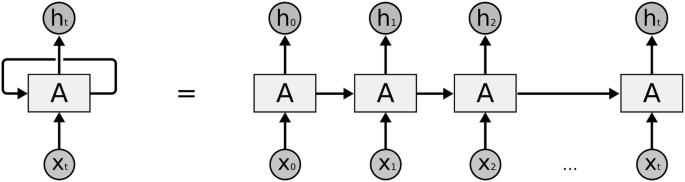
A recurrent neural network architecture (Olah 2015): the RNN feeds learned information back into the network via the output \(h_t\)
Note that the recursive application of the chain rule in neural network training may also cause a problem closely related to that of gradient vanishing. This problem is called gradient explosion and it occurs when recursively multiplying weight matrices with several entries above one in the backward pass of network training. Remedies of this problem, which help to stabilize and accelerate neural network training, include gradient clipping and batch normalization (Goodfellow et al. 2016).
2.3 Long short-term memory
One solution to the vanishing gradient problem was proposed by Hochreiter and Schmidhuber (1997) in the form of LSTM. Twenty years after its invention, LSTM and its variants have turned out to become a state-of-the-art neural network architecture for sequential data. The following discussion of the LSTM cell follows Graves (2013) as it seems to be one of the most popular LSTM architectures in recent research and is also available in the widely used Python library Keras (Chollet et al. 2018b).
2.3.1 The cell state
The central feature that allows LSTM to overcome the vanishing gradient problem is an additional pathway called the cell state. The cell state is a stream of information that is passed on through time. Its gradient does not vanish and enforces a constant error flow through time (Hochreiter 1998a). The cell state allows the LSTM to remember dependencies through time and facilitates bridging long time lags (Hochreiter and Schmidhuber 1997).
Figure 2 depicts a single LSTM cell with all but the cell state pathway grayed out. Note that the cell state contains no activation functions but only linear operations. In that way, it is “immune” to the vanishing gradient. The following discussion details how the cell state is maintained, updated, or read.
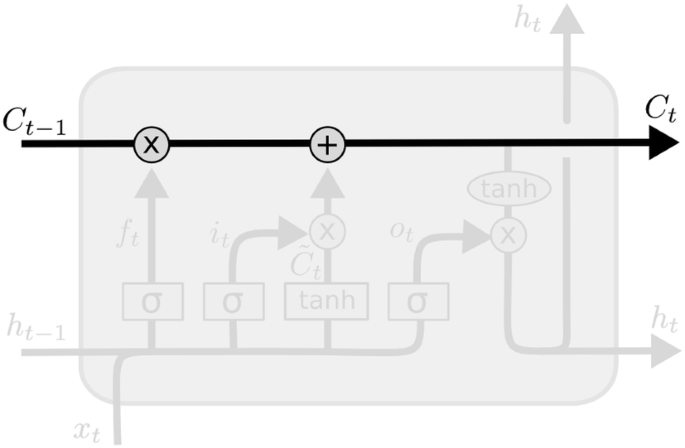
A single LSTM unit (a memory block) according to Olah (2015) with all but the cell state pathway grayed out
2.3.2 Gate units
The LSTM cell contains a number of gate structures that allow accessing the cell. A typical LSTM cell receives two inputs: the current input \(x_t\) and the recurrent input, which is the previous time step’s hidden state \(h_{t-1}\). Gating units control how these inputs change the cell state in order to produce an updated cell state, \(C_t\), or read from it to make use of the information that the cell state embodies.
The logistic sigmoid function, defined as \(\sigma (x) = \frac{\mathrm {1} }{\mathrm {1} + e^{-x} }\), plays an important role in the gating mechanisms of the LSTM cell. It takes the weighted current and recurrent inputs and maps them to the interval [0, 1]. This enables the network to control the information flow through the gates, which also explains the term “gate.” The values of 0 and 1 can be interpreted as allowing no information and all information to pass through a specific gate, respectively. In addition to the “gatekeeper” sigmoid, two of the three LSTM gates make use of the hyperbolic tangent function, defined as \(\tanh (x) = \frac{e^x-e^{-x}}{e^x+e^{-x}}\). The \(\tanh\) is the usual activation function for input and output gates in the LSTM (Greff et al. 2017) and pushes its inputs into the interval \([-1,1]\).
The logistic sigmoid and the hyperbolic tangent have relatively simple derivatives, \(\frac{d}{d(x)}\sigma (x) = \sigma (x) (1-\sigma (x))\) and \(\frac{{\text{d}}}{{{\text{d}}(x)}}\tanh (x) = 1 - \tanh ^{2} (x)\), which makes them a suitable choice for network training (e.g., backpropagation).
2.3.3 The forget gate
The forget gate \(f_t\) determines the parts of \(C_{t-1}\), which the cell state passed on from the previous time step, that are worth remembering. As shown in Fig. 3, this is achieved by means of a sigmoid gatekeeper function:
\(f_t\) is then multiplied with \(C_{t-1}\) to selectively allow information to remain in memory. Values of \(f_t=1\) and \(f_t=0\) imply that all information from \(C_{t-1}\) are kept and erased, respectively.
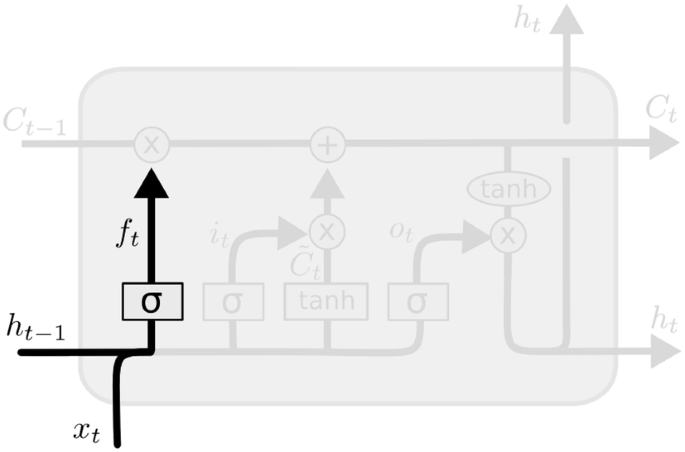
The forget gate \(f_t\) is multiplied with the previous cell state \(C_{t-1}\) to selectively forget information (Olah 2015)
2.3.4 The input gate
The input gate \(i_t\), highlighted in Fig. 4, employs a sigmoid to control information flow:
The objective of this gate is to protect the information of the cell state, which has accumulated over previous time steps, from irrelevant updates. Therefore, the input gate selectively updates the cell state with new information (Hochreiter and Schmidhuber 1997). To this end, a new set of candidate values \({\widetilde{C}}_t\) is generated by an activation function; typically a hyperbolic tangent:
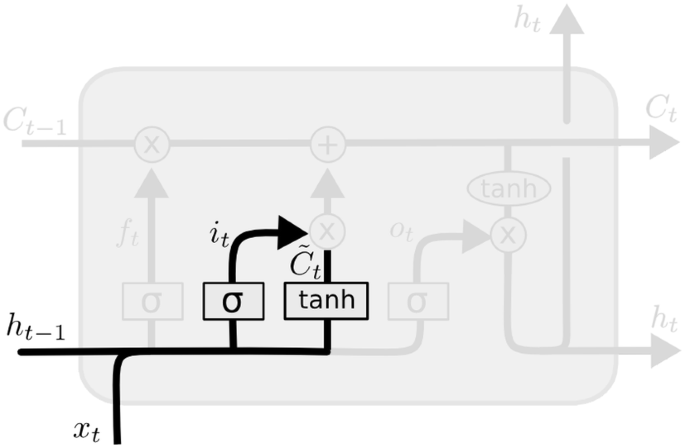
The input gate \(i_t\) directs where to update the cell state with new candidate values \({\widetilde{C}}_t\) (Olah 2015)
2.3.5 The updated cell state
Based on the mechanisms of the input and forget gate, the new cell state \(C_t\) is obtained in two ways: a part of the old cell state \(C_{t-1}\) has been remembered (via \(f_t\)) and has been updated with the new candidate values from \({\widetilde{C}}_t\) where needed (via \(i_t\)). This updated cell state will be relayed to the next time step, \(t+1\):
Note that \(i_t = f_t\) does not necessarily hold, and neither does \(i_t = 1 - f_t\). It is not exactly the parts that got remembered that get updated, and not exactly the ones that were forgotten either. While both the forget gate and the input gate make use of a sigmoid as their activation function and take the same arguments (\(h_{t-1}\) and \(x_t\)), in general their weights and biases will differ (Olah 2015).
2.3.6 The output gate
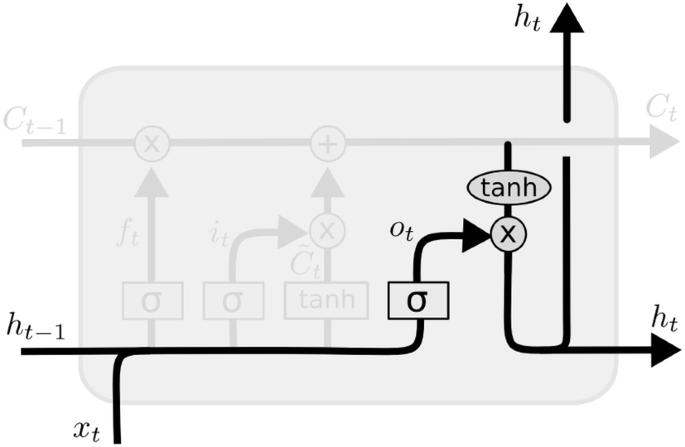
The output gate steers the actual prediction of the LSTM, which is determined by both, the current input \(x_t\) and the cell state \(C_t\). A hyperbolic tangent is applied to the values of the current cell state to produce a version of the cell state that is scaled to the interval \([-1, 1]\):
The output gate \(o_t\) consists of a sigmoid with arguments \(h_{t-1}\) and \(x_t\), and determines which information to pass on to the output layer and subsequent time steps in the new hidden state \(h_t\).
As shown in Fig. 5,
\(o_t\) and \(C^*_t\) are then multiplied to construct the hidden output, \(h_t\), of the current time step:
This output represents the recurrent input at time \(t+1\) and the basis for the prediction at time t. As in a FNN, predictions are computed from the hidden state by applying an output activation in the final layer.
The output gate \(o_t\) controls the network’s predictions (Olah 2015)
2.3.7 The LSTM cell
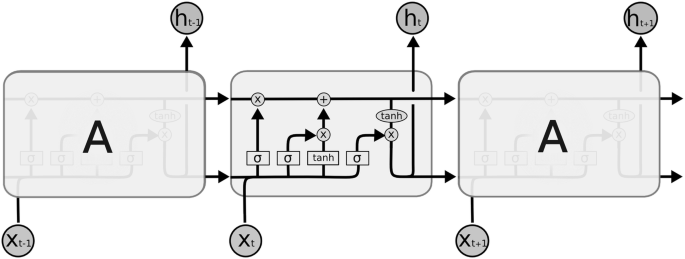
A typical LSTM cell with forget gate, input gate, and output gate is depicted in Fig. 6. The different gates and activations work together to save, keep, and produce information for the task at hand.
A sequence of LSTM units through time (Olah 2015)
When considering the gates and cell state together as \(h_t = o_t \,\circ \tanh (f_t \circ C_{t-1} + i_t \circ {\widetilde{C}}_t)\), it can be seen that \(h_t\) is essentially a sophisticated activation function:
This architecture is an augmented version of the original LSTM architecture and the setup most common in the literature (Greff et al. 2017). Figure 7, which depicts a sequence of LSTM cells through time, conveys how information can be propagated through time via the cell state. The three gates \(f_t\) to the left of \(i_t\) under and \(o_t\) above the hidden layer unit (“—” for closed and “O” for open) control which parts of the cell state are forgotten, updated, and output at each time step.
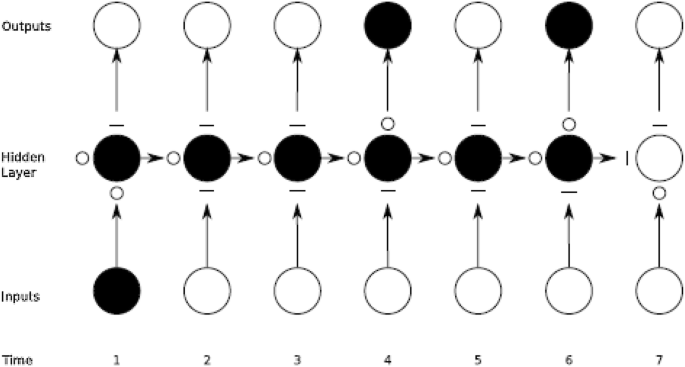
Preservation of gradient information by LSTM (Graves 2012)
There exist a few variants of the LSTM cell with fewer or additional components. For example, one modification concerns the use of peephole connections, which allow the cell state to control the gates and have been shown to increase LSTM resilience toward spikes in time series (Gers and Schmidhuber 2000). Greff et al. (2017) perform a comprehensive evaluation of the LSTM and the marginal efficacy of individual components including several recent adaptations such as peephole connection. They start from an LSTM cell with all gates and all possible peephole connections and selectively remove one component, always testing the resulting architecture on data from several domains. The empirical results suggest that the forget gate and the output activation function seem particularly important, while none out of the investigated modifications of the above LSTM cell significantly improves performance (Greff et al. 2017). In view of these findings, we focus on the LSTM as described above.
2.4 Gated recurrent units
A second approach to overcome the vanishing gradient problem in RNNs is GRUs (Cho et al. 2014). They also use gates but simplify the handling of the cell state. The hidden state in a GRU is controlled by two sigmoid gates: an update gate couples the tasks of LSTM’s forget and input gates. It decides how much of the recurrent information is kept:
A reset gate controls to which extent the recurrent hidden state is allowed to feed into the current activation:
A closed reset gate (\(r_t = 0\)) allows the memory cell to disregard the recurrent state and act as if it were reading the first observation in a sequence (Chung et al. 2014). The new activation can be computed as
and the new hidden state is
Again, the GRU cell can be seen as a sophisticated activation function:
There is no output activation function like in the LSTM, but the hidden cell state is bounded because of the coupling of input and forget gate in the GRU’s update gate (Greff et al. 2017). Figure 8 illustrates that GRUs have less parameters than LSTMs, which should make them computationally more efficient. In terms of forecasting performance, previous results on GRUs versus LSTMs are inconclusive (see, e.g., Chung et al. 2014 versus Jozefowicz et al. 2015). Therefore, we consider both types of RNNs in our empirical evaluation.
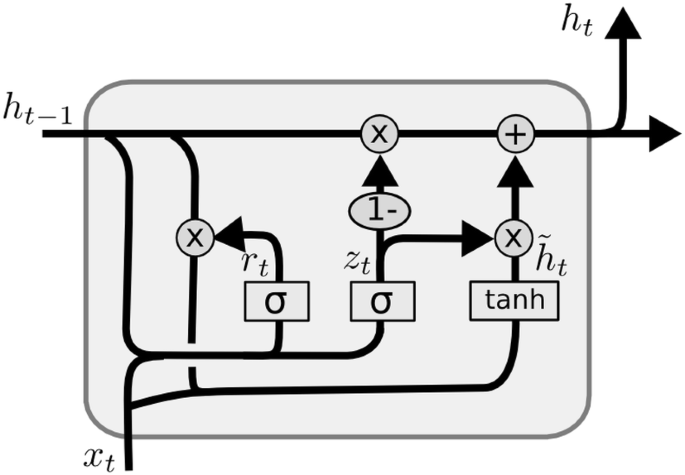
A GRU cell in detail with the recurrent hidden state \(h_{t-1}\), update gate \(z_t\), reset gate \(r_t\), a hidden state candidate vector \({\tilde{h}}_t\), and the new hidden state \(h_t\) (Olah 2015)
3 Related work
Financial markets are a well-studied subject. Starting with seminal work of Fama (1970), a large body of literature has examined the informational efficiency of financial markets. Empirical findings do not offer a clear result. Considering the FX market, Wu and Chen (1998) investigate seven currency pairs and find the efficient market hypothesis (EMH) to hold, while Hakkio and Rush (1989) and Czech and Waszkowski (2012) reject the EMH for at least some of the exchange rates tested by Wu and Chen (1998). It might be because of such contradictions that a statistical modeling of market prices, volatility, and other characteristics continues to be a popular topic in the forecasting and machine learning literature.
The range of forecasting methods that has been considered is very broad and comprises econometric models such as ARIMA, GARCH, and their derivatives, and various machine learning and computational intelligence approaches such as support vector machines, ensemble models and fuzzy system. Survey papers such as Cavalcante et al. (2016) and Bahrammirzaee (2010) offer a comprehensive overview of the field. Past price movements and transformation of these methods, for example, in the form a technical indicators (Lo et al. 2000), represent the main input to such forecasting models. More recently, research has started to examine auxiliary data sources such as financial news (Feuerriegel and Prendinger 2016; Zhang et al. 2015), tweets (Oliveira et al. 2017), and, more generally textual data (Junqué de Fortuny et al. 2014; Khadjeh Nassirtoussi et al. 2014).
In this paper, we focus on artificial neural networks. Neural networks have been a popular instrument for financial forecasting for decades and represent the backbone of modern modeling approaches in the scope of deep learning. With regard to their applications in finance, feedforward neural networks (FNN) have received much recognition and have been used by several studies to predict price movements (Hsu et al. 2016). From a methodological point of view, RNNs are better suited to process sequential data (i.e., temporal financial data) than other network architectures. Therefore, we focus the reminder of the literature review to studies that employed RNNs for financial forecasting and summarize corresponding studies in Table 1. To depict the state of the art in the field, we consider the type of RNN as well as benchmark methods, the type of features used for forecasting, the target variable, and whether a study employed a trading strategy. In addition to reporting statistical measures of forecast accuracy such as the mean-squared error, a trading strategy facilitates examining the monetary implications of trading model forecasts. The last column of Table 1 sketches the main focus of a paper such as testing the EMH or the merit of a specific modeling approach such as ensemble forecasting.
Table 1 suggests that there is no unified experimental framework. Notable differences across the financial time series considered in previous work exemplify this variation. About half of the studies adopt a univariate approach and use either historic prices, returns, or transformations of these as input to forecasting models. Other studies derive additional features from the time series, for example, in the form of a technical indicator, or consider external sources such as prices from other financial instruments. Evaluation practices display a similar variance with roughly 50 percent of papers performing a trading evaluation and the rest focusing exclusively on forecast accuracy.
In terms of neural network architectures, studies examining RNNs in the 1990s can be seen as forerunners, with comparatively little research on the applications of RNNs available at that time. One of the earliest studies includes Kamijo and Tanigawa (1990) who use an RNN in the scope of technical stock analysis. Interestingly, Table 1 also identifies some earlier studies that examine the foreign exchange market. For example, Tenti (1996) constructs three different RNNs to predict the returns of exchange rate futures with encouraging results, while Kuan and Liu (1995) assess RNNs compared to FNNs and an ARMA model to obtain mixed results as to the superiority of the former. Giles et al. (2001) further expand these studies through examining directional currency movement forecasts in a RNN framework.
These studies predate the publication of the seminal LSTM paper by Hochreiter and Schmidhuber (1997) and use relatively short input sequences (of length smaller than 10) as features. More recent studies consider longer input sequences using memory networks like LSTM and GRU. Xiong et al. (2015) predict the volatility of the S&P 500 and find that LSTM outperforms econometric benchmarks in the form of L1- and L2-regression as well as GARCH. Fischer and Krauss (2018) compare the performance of a single-layer LSTM against several benchmark algorithms, namely random forests, a FNN, and a logistic regression, and find that LSTM “beat[s] the standard deep networks and the logistic regression by a very clear margin” and outperforms a random forest in most periods. Shen et al. (2018) test GRUs against a FNN and a support vector machine on three financial indices, with the GRUs producing the best results.
An interesting finding of Table 1 concerns the foreign exchange market. While many earlier studies consider this market, we find no study that examines the ability of recent RNN architectures in the form of LSTM and GRU to forecast exchange rates. To the best of our knowledge, the 2008 studies of Kiani and Kastens (2008) and Hussain et al. (2008) represent the latest attempts to model foreign exchange markets using a RNN framework. This observation inspires the focal paper. We contribute original empirical evidence through comparing different types of RNNs—a simple RNN, a LSTM, and a GRU—in terms of their ability to forecast exchange rate returns. To set observed results into context, we contrast the performance of RNNs with that of a FNN and a naive benchmark model.
4 Experimental design
4.1 Data
The empirical evaluation grounds on data of four major foreign exchange rates: the Euro (EUR), the British Pound (GBP), the Japanese Yen (JPY), and the Swiss Franc (CHF), each of which we measure against the U.S. Dollar (USD). The selection of data follows previous work in the field (Kuan and Liu 1995; Tenti 1996; Giles et al. 2001; Kiani and Kastens 2008; Hussain et al. 2008). The data set consists of 12,710 rows representing daily bilateral exchange rates from January 4, 1971 until August 25, 2017. However, the time series are not of the same length. For example, the EUR was first reported in 1999 so that the EUR/USD exchange rate time series only contains 4688 non-null observations compared to the 11,715 observations for the longest time series in the data set.
Table 2 provides an overview of the characteristics of the time series’ 1-day percentage returns. The exchange rates and the corresponding daily returns are also plotted in Fig. 9, together with a combination of a histogram (gray bars), a kernel density estimation (black line), and a rug plot (black bars along the x-axis). From the return plots in the middle column, we observe that the transformation from prices to returns removes trends, but the return series still exhibit non-stationarity. In particular, the histograms, kernel density estimators, and rug plots indicate leptokurtic distributions, and the large kurtosis values in Table 2 support this observation.
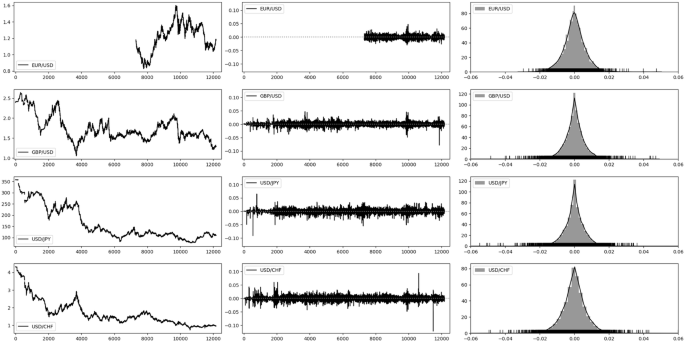
Prices, 1-day returns, and a combination of histograms, KDE, and rug plots of the one-day percentage returns for the four foreign exchange rate time series
4.2 Data preprocessing
In order to prepare the data for analysis, we divide each time series into study periods, scale the training data, and create input sequences and target variable values.
4.2.1 Features
Exchange rates represent the price of one unit of currency denominated in another currency, whereby we consider the USD as denominator.
Let \(P^c_t\) denote the price of a currency c at time t in USD. The one-day percentage return can then be calculated as the percentage change of the price from time t to the following trading day:
Before model training, we scale the returns to the interval [l, u] using min-max scaling.
To avoid data leakage, we perform the scaling for each study period individually, which ensures that the scaler is fitted to the training data and has no access to the trading (or test) data.
We use the time series of scaled returns as the sole feature, with the input at time t consisting of the sequence of returns of the previous \(\tau\) trading days:
The approach of using lagged returns, and more generally past realizations of the price signal, as input for a RNN follows the recent work of Fischer and Krauss (2018), who find it to deliver highly accurate forecasts. We acknowledge that different ways to set up the forecasting tasks are possible and could consist of using technical indicators as additional signal and/or incorporating price signals from other financial instruments (e.g., other exchange rates than the one being forecast), among others. Using multiple features would also facilitate the constructions of more advanced network designs. One could, for example, envision crafting time point embeddings that mimic the word embeddings, which are employed in natural language processing.Footnote 1. We leave the design of corresponding deep learning-based forecasting models and their empirical evaluation for future research.
4.2.2 Targets
We formulate the prediction task as a binary classification problem. The focus on directional forecasts is motivated by recent literature (Takeuchi 2013; Fischer and Krauss 2018). We then define the target variable \(Y^c_t\) such that values of one and zero indicate non-negative and negative returns, respectively.
4.2.3 Length of the input sequences
Previous studies found foreign exchange rates to exhibit long-term memory (van de Gucht et al. 1996). This suggests the suitability of GRUs and LSTMs with their ability to store long-term information, provided they receive input sequences of sufficient length. We chose an input sequence length of \(\tau =\)240, which follows from two of the most recent studies (Fischer and Krauss 2018; Shen et al. 2018). The LSTM, GRU, and simple RNN (SRNN) that we consider as benchmark model regard each sequence of 240 observations as one single feature and make use of the relative order of data points. On the contrary, a FNN, which we also consider as benchmark, regards the 240 observations as distinct features.
4.2.4 Training and trading window
To test the predictive performance of different forecasting models, we employ a sliding-window evaluation, which is commonly used in previous literature (Krauss et al. 2017; Tomasini and Jaekle 2011; Dixon et al. 2016). This approach forms several overlapping study periods, each of which contains a training and a test window. In each study period, models are estimated on the training data and generate predictions for the test data, which facilitate model assessment. Subsequently, the study period is shifted by the length of one test period as depicted in Fig. 10. Such evaluation is efficient in the sense that much data are used for model training while at the same time predictions can be generated for nearly the whole time series. Only the observations in the first training window cannot be used for prediction.
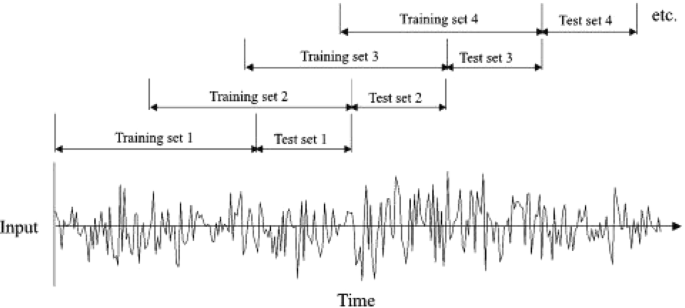
Sliding window evaluation: Models are trained in isolation inside each study period, which consists of a training set and a trading (test) set. The models are trained only on the training set, predictions are made on the test set, which is out of sample for each study period. Then, all windows are shifted by the length of the test set to create a new study period with training set and out-of-sample test set (from Giles et al. 2001)
4.2.5 Loss function
The models are trained to minimize the cross-entropy between predictions and actual target values. In the binary case, the cross-entropy for an individual prediction and the corresponding target value is given by \(-( y_{t} \log ({\hat{y}}_{t}) + (1-y_{t}) \log (1 - {\hat{y}}_{t}))\), and the overall training loss is the average of the individual cross-entropy values. That way, the training process can be interpreted as a maximum likelihood optimization, since the binary cross-entropy is equal to the negative log-likelihood of the targets given the data. The loss function for study period S including trading set \(T_S\) (with cardinality \(|T_S|\)) is represented by \(L_S\)Footnote 2:
4.2.6 Activation functions
We train the FNN using a rectified linear unit (relu) activation function: \(relu(x) = \max (0, x)\) Using relu activations improves gradient flow, reduces the training time (Glorot et al. 2011), and has become the state of the art in deep learning (LeCun et al. 2015; Clevert et al. 2016; Ramachandran et al. 2017).
For the recurrent neural networks, activation functions in the recurrent layers are applied as described in Sect. 2: the SRNN uses hyperbolic tangent activations, while the LSTM and the GRU use sigmoid gates and hyperbolic tangent activations as input and output activations. More precisely, we follow Chollet et al. (2018a) and use a segment-wise linear approximation of the sigmoid function to enhance computational efficiency.
All networks use a sigmoid function as their output activation to model the conditional probability of non-negative returns given the training data, \({\mathbb {P}}(Y^c_t = 1 | X^c_t = \{r^c_{t-\tau }, \dots , r^c_{t-1}\})\) (Goodfellow et al. 2016).
4.2.7 Regularization
One drawback of neural networks is their vulnerability to overfitting (Srivastava et al. 2014). Regularization is a way to protect against overfitting, and can be implemented in several ways including penalizing model complexity or monitoring the model’s performance on unseen data. We employ two regularization techniques:
-
Dropout:
helps the network’s neurons to generalize and avoid large co-dependence between different neurons (Hinton et al. 2012). To that end, a dropout layer randomly masks the connections between some neurons during model training. We use dropout on the non-recurrent connections after all hidden layers as in Zaremba et al. (2014) with various dropout rates. For example, a dropout rate of 25 percent implies that each neuron in the previous layer is dropped with probability 25 percent; on average, a quarter of the neurons of that layer are masked.
-
Early stopping:
refers to holding back a certain part of the training data to trace the forecasting error of a network during training (e.g., after each epoch). The validation set error enables us to stop network training conditional on the validation loss.
4.3 Hyperparameter tuning
Neural networks and their underlying training algorithms exhibit several hyperparameters that affect model quality and forecast accuracy. Examples include the number of hidden layers and their number of neurons, the dropout rate or other regularization parameters, as well as algorithmic hyperparameters such as the learning rate, the number of epochs, the size of mini-batches, etc. (Goodfellow et al. 2016).
Hyperparameter tuning is typically performed by means of empirical experimentation, which incurs a high computational cost because of the large space of candidate hyperparameter settings. We employ random search (Bengio 2012) for hyperparameter tuning considering the following search space:
-
Number of hidden layers: 1, 2, 3, 4.
-
Number of neurons per hidden layer: 25, 50, 100, 200, 400, 800, 1600.
-
Dropout: 0 to 60%, in steps of 10%.
-
Optimizer and learning rate: Adam and RMSprop with various learning rates.
-
Batch size: 16, 32, 64, 128, 256
4.4 Model architecture
We set up a supervised training experiment in accordance with Fischer and Krauss (2018) and Shen et al. (2018) who applied LSTM to stock and GRUs to index data, respectively. This meant constructing overlapping study periods consisting of 750 training observations and 250 trading observations as depicted in Fig. 10 and an input sequence length of 240 observations. The input data were scaled to the bounds of the hyperbolic tangent (\([l, u] = [-1, 1]\)). We then built models with fixed hyperparameters for all time series with the insights from manual tuning. All models had the following topology:
The other models use different layers but possess the same structure—with the exception that the FNN layers do not pass on sequences and thus the data dimensions between the first and third hidden layers in the FNN are (1, 50) rather than (240, 50) like in the three recurrent networks. All models were trained using minibatch sizes of 32 samples and the Adam Kingma and Ba (2014) optimizer with default parameters, training for a maximum of 100 epochs with early stopping after 10 periods without improvement in validation loss. 20% of the training set was held out of training for validation.
-
3 hidden layers
-
50 neurons per hidden layer
-
Dropout layers with dropout rate of 25 percent after each hidden layer
5 Evaluation
We consider three measures of forecast accuracy: logarithmic loss (Log loss) as this loss function is minimized during network training; predictive accuracy (Acc.) as the most intuitive interpretation of classification performance; and the area under the receiver operator characteristic curve (AUC).
In addition to assessing classification performance, we employ a basic trading model to shed light on the economic implications of trading on model forecasts. The trading strategy is as follows: for each observation t in the test period, buy the currency in the numerator of the currency pair if a non-negative return is predicted with probability of at least 50 percent (and realize that day’s net profit); sell that currency otherwise (and realize that day’s net profit multiplied by \(-1\)). The position is held for one day. This would yield the following realized daily return \({\tilde{r}}^c_t\) of the basic trading model:
As each test set consist of 240 trading days (roughly one year), the annualized net returns of this strategy in study period S are approximated by
As a measure of risk, the standard deviation (SD) of the series of realized trading strategy returns is considered, and the Sharpe ratio (SR) is computed as a measure of risk-adjusted returns. These three metrics are used to compare the different models’ predictions economically.
6 Empirical Results
In order to set results of different neural networks models into context, we compute a naive benchmark forecast the prediction of which at time t simply equals the true target at time \(t-1\):
The results of this benchmark can be found in Table 3, both per time series as well as aggregated across time series. Note that we cannot compute the log loss for this benchmark since \(\log (0)\) is undefined and the naive benchmark predicts 0 whenever the previous day’s true returns are negative.
The naive benchmarks give accurate direction predictions about half of the time. If the trading strategy defined in Sect. 5 were applied, it would result in small positive net returns.
Results from training the FNN, SRNN, LSTM, and GRU on the four selected foreign exchange rate time series are displayed in Table 4 and visualized in Fig. 11 by means of violin plots. Recall that the empirical results are obtained from the window-based cross-validation approach depicted in Fig. 10. Hence, accuracy/profit figures in Table 4 represent averages, which we compute across the multiple test windows.
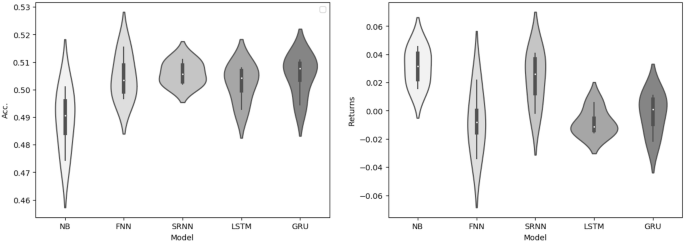
Accuracy and trading strategy returns of the naive benchmark and the four deep learning models
Table 4 suggests three conclusions. First, in terms of the training loss (Log Loss), the gated recurrent networks LSTM and GRUs perform slightly better than the FNN and SRNN for each time series. This general observation also holds roughly true for the accuracy for three of the four time series, but not for the EUR/USD exchange rate. Second, economic measures of forecast performance paint a different picture. None of the models is able to produce a large positive return. Both in terms of returns and risk-adjusted returns, the SRNN performs competitive and not inferior to more advanced network architectures in the form of GRU and LSTM. This is an interesting result in that several previous forecast comparisons observe a different result. We discuss the ramifications of our results in Sect. 5. Third, the deep learning models perform better than the benchmark in terms of accuracy and area under the ROC curve. However, the net returns resulting from applying the selected trading strategy are smaller in most cases.
7 Conclusion
The paper has reported results from an empirical comparison of different deep learning frameworks for exchange rate prediction. We have found further support for previous findings that exchange rates are highly non-stationary (Kayacan et al. 2010). Even training in a rolling window setting cannot always ensure that training and trading set follow the same distribution. Another observation concerns the leptokurtic distribution of returns. For example, the average kurtosis of the exchange rate returns examined in this study is 8.60 compared to 2.01 for the stock returns in Fischer and Krauss (2018). This resulted in many instances of returns close to zero and few, but relatively large deviations and could have lead to the models exhibiting low confidence in their predictions.
The results, in term of predictive accuracy, are in line with previous work on LSTMs for financial time series forecasting (Fischer and Krauss 2018). However, our results exhibit a large discrepancy between the training loss performance and economic performance of the models. This becomes especially apparent in Fig. 11. The observed gap between statistical and economic results agrees with Leitch and Tanner (1991) who find that only a weak relationship exists between statistical and economic measures of forecasting performance. A similar problem might exist between the log loss minimized during training and the trading strategy returns in this study.
One implication of our study is that the conceptual advantages of recent, gated RNN architectures such as LSTM and GRU translate into superior forecasting performance compared to more traditional RNNs. Arguably, this finding was to be expected and might not come as surprise. However, evidence of the merit of deep learning in the scope of exchange rate forecasting was sparse so that expanding the knowledge base with original empirical results is useful. At the same time, we observe traditional FNNs to be a competitive benchmark to deep RNN architectures. One may take this finding as evidence for the adequacy of using FNNs as benchmark in this study and, more generally, paying much attention to FNNs in previous work on FX markets and financial markets as a whole.
As any empirical study, the paper exhibits limitations which could be addressed in future research. One way of addressing the issue of low confidence predictions could be to use scaled prices as inputs, either with the same targets as in this experiment or to predict price levels in a regression and then transform the outputs to binary predictions by comparing them to the previous day’s price. Hussain et al. (2008) find scaled prices as inputs slightly outperform scaled returns, but the majority of the literature uses returns. Augmenting the input structure of RNN-based forecasting model by incorporating additional predictors might be another way to overcome the low confidence issue. Moreover, the focus of this study was on (deep) neural networks. Many other powerful machine learning algorithms exist. Comparing RNN-based approaches to alternatives such as, e.g., random forest and gradient boosting (Krauss et al. 2017) is an interesting field of future study in its own right and could clarify whether other algorithms also exhibit low confidence when applied to the exchange rates considered in this study.
Another avenue for future research concerns the employed trading strategy. Employing a more advanced trading rule might help to overcome the discrepancy between statistical and economic results. One example of such a trading strategy is the work of Fischer and Krauss (2018) who construct a strategy only trading a number of top and bottom pairs from a large set of 500 binary predictions on stock performance. This particular strategy would, of course, require training on many more time series. A possible solution for better interaction between model and economic performance is furthermore to develop a combination of a custom loss function and suitable output activation function instead of using binary cross-entropy with a sigmoid output activation function. That way, the model could directly optimize for either returns or risk-adjusted returns.
Furthermore, hyperparameter tuning turned out to be cumbersome. The window-based training approach described in Sect. 4 and depicted in Fig. 10 has one huge drawback: it requires training several individual models. Applying the same hyperparameters to the whole time series constrains the models’ capacity. Isolated hyperparameter tuning for each study period would be desirable but is not feasible in this setting as it included 144 such study periods (15 study periods for the EUR/USD series and 43 each for the GBP/EUR, USD/JPY, and USD/CHF series). Efforts to automate large deep learning processes are under way (Feurer et al. 2015), but tuning a large number of individual models remains computationally costly. An orthogonal approach to improve the tuning of the model to the data at hand involves revisiting the search strategy. We have used random search to configure deep neural networks, which can be considered standard practice. However, the search space of hyperparameters is very large and random search does not advocate narrowing down the space after the initial inspection of the wide space. Successive executions of the hyperparameter search have been employed in conjunction with grid search (Van Gestel et al. 2004) and could also be considered when tuning deep neural networks with random search. Especially if reusing the same hyperparameter setting across study periods, as done here, finding a strong configuration of the network is crucial and could benefit from repeating random search while zooming in more promising regions of the parameter space.
Finally, LSTM and GRUs have become the state of the art in many fields (Vaswani et al. 2017) and are still developed further to improve certain aspects. A number of recent proposals for prediction of sequential data augments or even aims to supplant RNNs. Such expansions include combining RNNs with CNNs when the data are both spatial and temporal (Karpathy and Li 2014) or even applying image classification to plots of time series data; giving models access to an external memory bank (Neural Turing Machine(s) Graves et al. 2014); employing recurrent encoder-decoder structures, or modeling time dependencies in a non-recurrent way (Vaswani et al. 2017). Machine learning research is moving increasingly fast and new ideas for improvements or augmentations of algorithms keep appearing. On the other hand, some technologies become practical only many years after their emergence. The best example of this is LSTM, an algorithm that was little appreciated in the first decade of its life but is one of the cornerstones of machine learning another ten years later. It is intriguing to imagine what might be possible in another decade.
Notes
We are grateful to an anonymous reviewer who suggested this interesting approach for future studies.
\(L_S\) simplifies to \(L_S(y_{T_S}, {\hat{y}}_{T_S}) = -\frac{1}{|T_S|} \sum _{t \in T_S} \log ({\hat{y}}_{t})\) in the binary classification task with labels (0, 1).
References
Bagheri, A., Mohammadi Peyhani, H., & Akbari, M. (2014). Financial forecasting using anfis networks with quantum-behaved particle swarm optimization. Expert Systems with Applications, 41(14), 6235–6250.
Bahrammirzaee, A. (2010). A comparative survey of artificial intelligence applications in finance: Artificial neural networks, expert system and hybrid intelligent systems. Neural Computing & Applications, 19(8), 1165–1195.
Bengio, Y. (2012). Practical recommendations for gradient-based training of deep architectures. In G. Montavon, G. B. Orr, & K. R. Mueller (Eds.), Neural networks: Tricks of the trade (2nd ed., pp. 437–478). Berlin: Springer. Lecture notes in computer science.
Campbell, J. Y., Lo, A. W., MacKinlay, A. C., & Whitelaw, R. F. (1998). The econometrics of financial markets. Macroeconomic Dynamics, 2(4), 559–562.
Cavalcante, R. C., Brasileiro, R. C., Souza, V. L. F., Nobrega, J. P., & Oliveira, A. L. I. (2016). Computational intelligence and financial markets: A survey and future directions. Expert Systems with Applications, 55, 194–211.
Chen, K., Zhou, Y., & Dai, F. (2015). A LSTM-based method for stock returns prediction: A case study of China stock market. In 2015 IEEE international conference on big data (pp. 2823–2824).
Cho, K., van Merrienboer, B., Gulcehre, C., Bahdanau, D., Bougares, F., Schwenk, H., & Bengio, Y. (2014). Learning phrase representations using RNN Encoder-Decoder for statistical machine translation. arXiv: 1406.1078.
Chollet, F. et al, (2018a). Keras TensorFlow Backend. https://github.com/keras-team/keras/blob/master/keras/backend/tensorflow_backend.py#L1487.
Chollet, F. et al. (2018b). Keras: The Python Deep Learning library. Astrophysics Source Code Library p ascl:1806.022. http://adsabs.harvard.edu/abs/2018ascl.soft06022C.
Chung, J., Gulcehre, C., Cho, K., & Bengio, Y. (2014). Empirical evaluation of gated recurrent neural networks on sequence modeling. arXiv: 1412.3555
Clevert, D. A., Unterthiner, T., & Hochreiter, S. (2016). Fast and accurate deep network learning by exponential linear units (ELUS). Archive pre-print p 15.
Czech, K. A., & Waszkowski, A. (2012). Foreign exchange market efficiency: Empirical results for the USD/EUR market. e-Finanse: Financial Internet Quarterly 8(3):1–9. https://www.econstor.eu/handle/10419/147044
Di Persio, L., & Honchar, O. (2017). Recurrent neural networks approach to the financial forecast of Google assets. International Journal of Mathematics and Computers in Simulation, 11, 7–13.
Dixon, M. F., Klabjan, D., & Bang, J. (2016). Classification-based financial markets prediction using deep neural networks. SSRN Scholarly Paper ID 2756331, Social Science Research Network, Rochester, NY. https://papers.ssrn.com/abstract=2756331.
Fama, E. F. (1970). Efficient capital markets: A review of theory and empirical work*. The Journal of Finance, 25(2), 383–417.
Feuerriegel, S., & Prendinger, H. (2016). News-based trading strategies. Decision Support Systems, 90, 65–74.
Feurer, M., Klein, A., Eggensperger, K., Springenberg, J., Blum, M., & Hutter, F. (2015). Efficient and robust automated machine learning. In C. Cortes, N. D. Lawrence, D. D. Lee, M. Sugiyama & R. Garnett (Eds.), Advances in neural information processing systems (Vol. 28, pp. 2962–2970). Curran Associates, Inc.
Fischer, T., & Krauss, C. (2018). Deep learning with long short-term memory networks for financial market predictions. European Journal of Operational Research, 270(2), 654–669.
Junqu de Fortuny, E., De Smedt, T., Martens, D., & Daelemans, W. (2014). Evaluating and understanding text-based stock price prediction models. Information Processing & Management, 50(2), 426–441.
Gers, F., & Schmidhuber, J. (2000). Recurrent nets that time and count. In Proceedings of the IEEE-INNS-ENNS international joint conference on neural networks. IJCNN 2000. Neural computing: New challenges and perspectives for the new millennium (Vol. 3, pp. 189–194 ). IEEE, Como, Italy.
Gers, F. A., Schmidhuber, J., & Cummins, F. (1999). Learning to forget: Continual prediction with LSTM. Neural Computation, 12, 2451–2471.
Giles, C. L., Lawrence, S., & Tsoi, A. C. (2001). Noisy time series prediction using recurrent neural networks and grammatical inference. Machine Learning, 44(1), 161–183.
Glorot, X., Bordes, A., & Bengio, Y. (2011). Deep sparse rectifier neural networks. In Proceedings of the fourteenth international conference on artificial intelligence and statistics (pp. 315–323).
Goodfellow, I., Bengio, Y., & Courville, A. (2016). Deep learning. Cambridge: MIT Press. http://www.deeplearningbook.org.
Graves, A. (2012). Supervised sequence labelling. In A. Graves (Ed.), Supervised sequence labelling with recurrent neural networks (pp. 5–13)., Studies in computational intelligence Berlin: Springer.
Graves, A. (2013). Generating sequences with recurrent neural networks. arXiv preprint arXiv:1308.0850.
Graves, A., Wayne, G., & Danihelka, I. (2014). Neural turing machines. arXiv:1410.5401.
Greff, K., Srivastava, R. K., Koutník, J., Steunebrink, B. R., & Schmidhuber, J. (2017). LSTM: A search space odyssey. IEEE Transactions on Neural Networks and Learning Systems, 28(10), 2222–2232. arXiv: 1503.04069.
Hakkio, C. S., & Rush, M. (1989). Market efficiency and cointegration: an application to the sterling and deutschemark exchange markets. Journal of International Money and Finance, 8(1), 75–88.
Härdle, W. K., & Leopold, S. (2015). Applied multivariate statistical analysis (4th ed.). Cham: Springer.
Hinton, G. E., Srivastava, N., Krizhevsky, A., Sutskever, I., & Salakhutdinov, R. R. (2012). Improving neural networks by preventing co-adaptation of feature detectors. arXiv:1207.0580
Hochreiter, S. (1998a). Recurrent neural net learning and vanishing gradient. International Journal of Uncertainty, Fuzziness and Knowledge-Based Systems, 6(2), 107–116.
Hochreiter, S. (1998b). The vanishing gradient problem during learning recurrent neural nets and problem solutions. International Journal of Uncertainty, Fuzziness and Knowledge-Based Systems, 06(02), 107–116.
Hochreiter, S., & Schmidhuber, J. (1997). Long short-term memory. Neural Computation, 9(8), 1735–1780.
Hsu, M. W., Lessmann, S., Sung, M. C., Ma, T., & Johnson, J. E. (2016). Bridging the divide in financial market forecasting: Machine learners vs. financial economists. Expert Systems with Applications, 61, 215–234.
Huck, N. (2009). Pairs selection and outranking: An application to the S&P 100 index. European Journal of Operational Research, 196(2), 819–825.
Huck, N. (2019). Large data sets and machine learning: Applications to statistical arbitrage. European Journal of Operational Research, 278(1), 330–342.
Hussain, A. J., Knowles, A., Lisboa, P. J. G., & El-Deredy, W. (2008). Financial time series prediction using polynomial pipelined neural networks. Expert Systems with Applications, 35(3), 1186–1199.
Jozefowicz, R., Zaremba, W., & Sutskever, I. (2015). An empirical exploration of recurrent network architectures. In Proceedings of the 32nd international conference on international conference on machine learning (Vol. 37, pp. 2342–2350). JMLR.org, ICML’15.
Kamijo, K., & Tanigawa, T. (1990). Stock price pattern recognition-a recurrent neural network approach. In 1990 IJCNN international joint conference on neural networks (Vol.1, pp. 215–221). San Diego, CA: IEEE.
Karpathy, A., & Li, F. F. (2014). Deep visual-semantic alignments for generating image descriptions. arXiv:1412.2306
Kayacan, E., Ulutas, B., & Kaynak, O. (2010). Grey system theory-based models in time series prediction. Expert Systems with Applications, 37(2), 1784–1789.
Khadjeh Nassirtoussi, A., Aghabozorgi, S., Ying Wah, T., & Ngo, D. C. L. (2014). Text mining for market prediction: A systematic review. Expert Systems with Applications, 41(16), 7653–7670.
Kiani, K. M., & Kastens, T. L. (2008). Testing forecast accuracy of foreign exchange rates: Predictions from feed forward and various recurrent neural network architectures. Computational Economics, 32(4), 383–406.
Kim, A., Yang, Y., Lessmann, S., Ma, T., Sung, M. C., & Johnson, J. E. V. (2019). Can deep learning predict risky retail investors? A case study in financial risk behavior forecasting. European Journal of Operational Research,. https://doi.org/10.1016/j.ejor.2019.11.007.
Kingma, D. P., & Ba, J. (2014). Adam: A method for stochastic optimization. arXiv:1412.6980
Krauss, C., Do, X. A., & Huck, N. (2017). Deep neural networks, gradient-boosted trees, random forests: Statistical arbitrage on the S&P 500. European Journal of Operational Research, 259, 689–702.
Kuan, C. M., & Liu, T. (1995). Forecasting exchange rates using feedforward and recurrent neural networks. Journal of Applied Econometrics, 10(4), 347–364.
LeCun, Y., Bengio, Y., & Hinton, G. (2015). Deep learning. Nature, 521(7553), 436–444.
Leitch, G., & Tanner, J. E. (1991). Economic forecast evaluation: Profits versus the conventional error measures. The American Economic Review, 81(3), 580–590.
Lo, A. W., Mamaysky, H., & Wang, J. (2000). Foundations of technical analysis: Computational algorithms, statistical inference, and empirical implementation. The Journal of Finance, 55(4), 1705–1770.
Lyons, R. K. (2001). New perspective on fx markets: Order-flow analysis. International Finance, 4(2), 303–320.
Nielsen, M. A. (2015). Neural networks and deep learning. Determination Press. http://neuralnetworksanddeeplearning.com.
Olah, C. (2015). Understanding LSTM networks. http://colah.github.io/posts/2015-08-Understanding-LSTMs/.
Oliveira, N., Cortez, P., & Areal, N. (2017). The impact of microblogging data for stock market prediction: Using twitter to predict returns, volatility, trading volume and survey sentiment indices. Expert Systems with Applications, 73, 125–144.
Ramachandran, P., Zoph, B., & Le, QV. (2017). Searching for activation functions. arXiv:1710.05941
Rather, A. M., Agarwal, A., & Sastry, V. N. (2015). Recurrent neural network and a hybrid model for prediction of stock returns. Expert Systems with Applications, 42(6), 3234–3241.
Rumelhart, D. E., Hinton, G. E., & Williams, R. J. (1986). Learning representations by back-propagating errors. Nature, 323(6088), 533–536.
Saad, E., Prokhorov, D., & Wunsch, D. (1998). Comparative study of stock trend prediction using time delay, recurrent and probabilistic neural networks. IEEE Transactions on Neural Networks, 9(6), 1456–1470.
Sager, M. J., & Taylor, M. P. (2006). Under the microscope: The structure of the foreign exchange market. International Journal of Finance & Economics, 11(1), 81–95.
Schaefer, A. M., Udluft, S., & Zimmermann, H. G. (2008). Learning long-term dependencies with recurrent neural networks. Neurocomputing, 71(13–15), 2481–2488.
Shen, G., Tan, Q., Zhang, H., Zeng, P., & Xu, J. (2018). Deep learning with gated recurrent unit networks for financial sequence predictions. Procedia Computer Science, 131, 895–903.
Srivastava, N., Hinton, G., Krizhevsky, A., Sutskever, I., & Salakhutdinov, R. (2014). Dropout: A simple way to prevent neural networks from overfitting. The Journal of Machine Learning Research, 15(1), 1929–1958.
Takeuchi, L. (2013). Applying deep learning to enhance momentum trading strategies in stocks. Technical Report, Stanford University.
Taylor, M. P. (1995). The economics of exchange rates. Journal of Economic Literature, 33(1), 13–47.
Tenti, P. (1996). Forecasting foreign exchange rates using recurrent neural networks. Applied Artificial Intelligence, 10(6), 567–582.
Tomasini, E., & Jaekle, U. (2011). Trading systems: A new approach to system development and portfolio optimisation, reprinted edn. Harriman House, Petersfield, oCLC: 934736951.
van de Gucht, L. M., Dekimpe, M. G., & Kwok, C. C. Y. (1996). Persistence in foreign exchange rates. Journal of International Money and Finance, 15(2), 191–220.
Van Gestel, T., Suykens, J. A., Baesens, B., Viaene, S., Vanthienen, J., Dedene, G., et al. (2004). Benchmarking least squares support vector machine classifiers. Machine Learning, 54(1), 5–32.
Vaswani, A., Shazeer, N., Parmar, N., Uszkoreit, J., Jones, L., Gomez, A. N., et al. (2017). Attention is all you need. In: I. Guyon, U. V. Luxburg, S. Bengio, H. Wallach, R. Fergus, S. Vishwanathan & R. Garnett (Eds.), Advances in neural information processing systems (Vol. 30, pp. 5998–6008). Curran Associates, Inc.
Werbos, P. J. (1990). Backpropagation through time: What it does and how to do it. Proceedings of the IEEE, 78(10), 1550–1560.
Wu, J. L., & Chen, S. L. (1998). Foreign exchange market efficiency revisited. Journal of International Money and Finance, 17(5), 831–838.
Xiong, R., Nichols, E. P., & Shen, Y. (2015). Deep learning stock volatility with Google Domestic Trends. arXiv:1512.04916.
Zaremba, W., Sutskever, I., & Vinyals, O. (2014). Recurrent neural network regularization. arXiv:1409.2329.
Zhang, J. L., Härdle, W. K., Chen, C. Y., & Bommes, E. (2015). Distillation of news flow into analysis of stock reactions. Journal of Business & Economic Statistics. https://doi.org/10.1080/07350015.2015.1110525
Zhao, Z., Rao, R., Tu, S., & Shi, J. (2018). Time-weighted LSTM model with redefined labeling for stock trend prediction. In 2017 IEEE 29th international conference on tools with artificial intelligence (ICTAI) (pp. 1210–1217).
Acknowledgements
Open Access funding provided by Projekt DEAL.
Funding
Funding was provided by DFG - Deutsche Forschungsgemeinschaft (Grant No. IIRTG 1972).
Author information
Authors and Affiliations
Corresponding author
Additional information
Publisher's Note
Springer Nature remains neutral with regard to jurisdictional claims in published maps and institutional affiliations.
Rights and permissions
Open Access This article is licensed under a Creative Commons Attribution 4.0 International License, which permits use, sharing, adaptation, distribution and reproduction in any medium or format, as long as you give appropriate credit to the original author(s) and the source, provide a link to the Creative Commons licence, and indicate if changes were made. The images or other third party material in this article are included in the article's Creative Commons licence, unless indicated otherwise in a credit line to the material. If material is not included in the article's Creative Commons licence and your intended use is not permitted by statutory regulation or exceeds the permitted use, you will need to obtain permission directly from the copyright holder. To view a copy of this licence, visit http://creativecommons.org/licenses/by/4.0/.
About this article

Cite this article
Dautel, A.J., Härdle, W.K., Lessmann, S. et al. Forex exchange rate forecasting using deep recurrent neural networks. Digit Finance 2, 69–96 (2020). https://doi.org/10.1007/s42521-020-00019-x
Received:
Accepted:
Published:
Issue Date:
DOI: https://doi.org/10.1007/s42521-020-00019-x