
Abstract
Background
Ecological research now deals increasingly with the effects of noise pollution on biodiversity. Indeed, many studies have shown the impacts of anthropogenic noise and concluded that it is potentially a threat to the persistence of many species. The present work is a systematic map of the evidence of the impacts of all anthropogenic noises (industrial, urban, transportation, etc.) on biodiversity. This report describes the mapping process and the evidence base with summary figures and tables presenting the characteristics of the selected articles.
Methods
The method used was published in an a priori protocol. Searches included peer-reviewed and grey literature published in English and French. Two online databases were searched using English terms and search consistency was assessed with a test list. Supplementary searches were also performed (using search engines, a call for literature and searching relevant reviews). Articles were screened through three stages (titles, abstracts, full-texts). No geographical restrictions were applied. The subject population included all wild species (plants and animals excluding humans) and ecosystems. Exposures comprised all types of man-made sounds in terrestrial and aquatic media, including all contexts and sound origins (spontaneous or recorded sounds, in situ or laboratory studies, etc.). All relevant outcomes were considered (space use, reproduction, communication, etc.). Then, for each article selected after full-text screening, metadata were extracted on key variables of interest (species, types of sound, outcomes, etc.).
Review findings
Our main result is a database that includes all retrieved literature on the impacts of anthropogenic noise on species and ecosystems, coded with several markers (sources of noise, species concerned, types of impacts, etc.). Our search produced more than 29,000 articles and 1794 were selected after the three screening stages (1340 studies (i.e. primary research), 379 reviews, 16 meta-analyses). Some articles (n = 19) are written in French and all others are in English. This database is available as an additional file of this report. It provides an overview of the current state of knowledge. It can be used for primary research by identifying knowledge gaps or in view of further analysis, such as systematic reviews. It can also be helpful for scientists and researchers as well as for practitioners, such as managers of transportation infrastructure.
Conclusion
The systematic map reveals that the impacts of anthropogenic noises on species and ecosystems have been researched for many years. In particular, some taxonomic groups (mammals, birds, fishes), types of noise (transportation, industrial, abstract) and outcomes (behavioural, biophysiological, communication) have been studied more than others. Conversely, less knowledge is available on certain species (amphibians, reptiles, invertebrates), noises (recreational, military, urban) and impacts (space use, reproduction, ecosystems). The map does not assess the impacts of anthropogenic noise, but it can be the starting point for more thorough synthesis of evidence. After a critical appraisal, the included reviews and meta-analyses could be exploited, if reliable, to transfer the already synthesized knowledge into operational decisions to reduce noise pollution and protect biodiversity.
Background
For decades, biodiversity has suffered massive losses worldwide. Species are disappearing [1], populations are collapsing [2], species’ ranges are changing (both shrinking and expanding) at unprecedented rates [3] and communities are being displaced by invasive alien species [4]. All of the above is caused by human activities and scientists regularly alert the international community to our responsibility [5]. In particular, urban growth is one of the major reasons for biodiversity loss [6, 7] in that it destroys natural habitats, fragments the remaining ecosystems [8] and causes different types of pollution, for example, run-off, waste and artificial light impacting plants and animals [9, 10]. Similarly, man-made sounds are omnipresent in cities, stemming from traffic and other activities (industrial, commercial, etc.) [11] and they can reach uninhabited places [12]. Anthropogenic noise can also be generated far from cities (e.g. tourism in a national park, military sonar in an ocean, civil aircraft in the sky).
Many studies have shown that such sounds may have considerable impact on animals. However, sound is not a problem in itself. A majority of species hear and emit sounds [13]. Sounds are often used to communicate between partners or conspecifics, or to detect prey or predators. The problem arises when sounds turn into “noise”, which depends on each species (sensitivity threshold) and on the type of impact generated (e.g. disturbances, avoidance, damage). In this case, we may speak of “noise pollution”. For instance, man-made sounds can mask and inhibit animal sounds and/or animal audition and it has been shown to affect communication [14], use of space [15] and reproduction [16]. This problem affects many biological groups such as birds [17], amphibians [18], reptiles [19], fishes [20], mammals [21] and invertebrates [22]. It spans several types of ecosystems including terrestrial [23], aquatic [24] and coastal ecosystems [25]. Many types of sounds produced by human activities can represent a form of noise pollution for biodiversity, including traffic [26], ships [27], aircraft [28] and industrial activities [29]. Noise pollution can also act in synergy with other disturbances, for example light pollution [30].
Despite this rich literature, a preliminary search did not identify any existing systematic maps pertaining to this issue. Some reviews or meta-analyses have been published, but most concern only one biological group, such as Morley et al. [31] on invertebrates, Patricelli and Blickley [32] on birds and Popper and Hastings [33] on fishes. Other syntheses are more general and resemble somewhat a systematic map, but their strategies seem to be incomplete. For instance, Shannon et al. [34] performed their literature search on only one database (ISI Web of Science within selected subject areas) and did not include grey literature. As another example, we can cite Rocca et al. in 2016, a meta-analysis that limited its population to birds and amphibians and its outcome to vocalization adjustment [35]. As a consequence, a more comprehensive map, covering all species and ecosystems, all sources of man-made sounds and all outcomes, and implementing a deeper search strategy (e.g. several databases, grey literature included) is needed to provide a complete overview for policy and practice.
This report presents a systematic map of evidence of the impact of noise pollution on biodiversity based on an a priori method published in a peer-reviewed protocol [36]. It describes the mapping process and the evidence base. It includes aggregate data and tables presenting the characteristics of the selected articles to highlight gaps in the literature concerning the issue. A database was produced in conjunction with this report, containing metadata for each selected article including key variables (species, types of sound, effects, etc.).
Stakeholder engagement
The current systematic map is managed by the UMS Patrimoine Naturel joint research unit funded by the French Biodiversity Agency (OFB), the National Scientific Research Center (CNRS) and the National Museum of Natural History (MNHN), in a partnership with INRAE. Our institutions act on behalf of the French Ecology Ministry and provide technical and scientific expertise to support public policies on biodiversity.
We identified noise pollution as an emergent threat for species and ecosystems that public authorities and practitioners will have to mitigate in the coming years. Indeed, for decades, noise regulations have focused primarily on the disturbances for humans, but we expect that public policies for biodiversity conservation will start to pay more attention to this threat. Already, in 1996, for the first time, the European Commission’s Green Paper on Future Noise Control Policy dealt with noise pollution from the point of view of environmental protection. Quiet areas are also recommended to guarantee the tranquility of fauna in Europe [37]. Since 2000 in France, an article in the Environmental Code (art. L571-1) has contained the terms “harms the environment” with respect to disturbances due to noise. To achieve these objectives, a knowledge transfer from research to stakeholders is needed for evidence-based decisions. We expect that concern for the impacts of noise pollution on biodiversity will develop along the same lines that it did for light pollution, which is now widely acknowledged by society. Anticipating this progress, we proposed to the French Ecology Ministry that we produce a systematic map of the impacts of noise on biodiversity in view of drafting a report on current knowledge and identifying sectors where research is needed to fill in knowledge gaps.
Objective of the review
The objective of the systematic map is to provide a comprehensive overview of the available knowledge on the impacts of noise pollution on species and ecosystems and to quantify the existing research in terms of the taxonomic groups, sources of noise and impact types studied.
The systematic map covers all species and ecosystems. In that we are currently not able to say exactly when a sound becomes a noise pollution for species (which is precisely why a systematic map and reviews are needed on this topic), this map covers all man-made sounds, regardless of their characteristics (e.g. frequency, speed, intensity), their origin (road traffic, industrial machines, boats, planes, etc.), their environment or media (terrestrial, aquatic, aerial) and their type (infrasound, ultrasound, white noise, etc.), and in most cases here uses the term “noise” or “noise pollution”. It does not include sounds made by other animals (e.g. chorus frogs) or natural events (e.g. thunder, waterfalls). The systematic map deals with all kinds of impacts, from biological to ecological impacts (use of space, reproduction, communication, abundance, etc.). It encompasses in situ studies as well as ex situ studies (aquariums, laboratories, cages, etc.). The components of the systematic map are detailed in Table 1.
The primary question is: what is the evidence that man-made noise impacts biodiversity?
The secondary question is: which species, types of impacts and types of noise are most studied?
Methods
The method used to produce this map was published in an a priori peer-reviewed protocol by Sordello et al. [36]. Deviations are listed below. The method follows the Collaboration for Environmental Evidence (CEE) Guidelines and Standards for Evidence Synthesis in Environmental Management [38] unless noted otherwise, and this paper conforms to ROSES reporting standards [39] (see Additional file 1).
Deviation from the a priori protocol published by Sordello et al. [36]
Method enhancements
We reinforced the search strategy with:
-
a search performed on both CORE and BASE, whereas the protocol was limited to a search on only one of these two search engines,
-
export of the first 1000 hits for each search string run on Google Scholar, whereas the protocol foresaw the export of the first 300 hits,
-
extraction of the entire bibliography of 37 key reviews selected from the previously provided corpus whereas the protocol did not foresee this option.
Method downgrades
Because of our resource limitations:
-
we could not extract the design comparator (e.g. CE, BAE, BACE),
-
we could not split each article included in the map into several entries (i.e. a book with several chapters, a proceeding with multiple abstracts, a study with several species, sources of noise or outcomes). Consequently, we coded the multiple aspects of these articles on one line in the map database.
Search for articles
Languages
Searches were performed using exclusively English search terms. The list of search terms is presented below (see “Search string”).
Only studies published in English and in French were included in this systematic map, due to limited resources and the languages understood by the map team.
Search string
The following search string was built (see Additional file 2, section I for more details on this process):
((TI = (noise OR sound$) OR TS = (“masking auditory” OR “man-made noise” OR “anthropogenic noise” OR “man-made sound$” OR “music festival$” OR ((pollution OR transportation OR road$ OR highway$ OR motorway$ OR railway$ OR traffic OR urban OR city OR cities OR construction OR ship$ OR boat$ OR port$ OR aircraft$ OR airplane$ OR airport$ OR industr* OR machinery OR “gas extraction” OR mining OR drilling OR pile-driving OR “communication network$” OR “wind farm$” OR agric* OR farming OR military OR gun$ OR visitor$) AND noise))) AND TS = (ecolog* OR biodiversity OR ecosystem$ OR “natural habitat$” OR species OR vertebrate$ OR mammal$ OR reptile$ OR amphibian$ OR bird$ OR fish* OR invertebrate$ OR arthropod$ OR insect$ OR arachnid$ OR crustacean$ OR centipede$)).
Comprehensiveness of the search
A test list of 65 scientific articles was established (see Additional file 2, section II) to assess the comprehensiveness of the search string. The test list was composed of the three groups listed below.
-
1.
Forty relevant scientific articles identified by the map team prior to the review.
-
2.
Eight key articles identified using three relevant reviews: Brumm, 2010 (two articles) [40], Cerema, 2007 (three articles) [41] and Dutilleux and Fontaine, 2015 (three articles) [42].
-
3.
Seventeen studies not readily accessible or indexed by the most common academic databases, submitted by subject experts contacted prior to the review (29 subject experts were contacted, 7 responded).
Bibliographic databases
The two databases below were searched (see Additional file 2, section III for more details on database selection):
-
“Web of Science Core Collection” on the Web of Science platform (Clarivate) using the access rights of the French National Museum of Natural History, using the search string described above. The search covered SCI-EXPANDED, SSCI, A&HCI, CPCI-S, CPCI-SSH, BKCI-S, BKCI-SSH, ESCI and CCR-EXPANDED (see Additional file 2, section III for the complete list of citation indexes). A first request was run on 14 December 2018, without any timespan restriction, and returned 7859 citations. Secondly, an update request, restricted to 2019, was performed, using the same search string and citation indexes, on 6 May 2020, to collect the documents published in 2019. 685 citations were exported.
-
Scopus (Elsevier). The search string described above was adapted to take into account differences in the search syntax (see Additional file 2, section IV). A first search was run on 14 December 2018, without any timespan restriction, using the access rights of the University of Bordeaux and returned 11,186 citations. Secondly, a new request restricted to 2019 was performed on 6 May 2020, using the same search string, using the access rights of the CNRS, to collect the documents published in 2019. 859 citations were exported.
Web-based search engines
Additional searches were undertaken using the three following search engines (see Additional file 2, section V for more details):
-
Google Scholar (https://scholar.google.com/). Due to the limitations of Google Scholar, four search strings were constructed with English terms to translate the search string used for the bibliographic databases described above in a suitable form for Google Scholar. The first searches were performed on 11 June 2019 and the first 1000 citations (as a maximum, when available), sorted by citation frequency, were exported to a .csv file for each of the four search strings. Secondly, an update search was performed on 6 May 2020 with the same four search strings to collect the documents published in 2019; all hits (110) were exported;
-
BASE (https://www.base-search.net). Searches were performed on 12 April 2019. Given certain limitations of this search engine (maximum number of string characters), the search string built for the bibliographic databases described above was split into two search strings. Searches were performed on the titles of the articles, with no restriction to open access articles, on all types of documents and without any timespan restriction. The first 300 citations, sorted by relevance, were exported for each of the two search strings to a .csv file;
-
CORE (https://core.ac.uk/). Searches were performed on 12 February 2019. The search engine allowed the use of the original search string used for the bibliographic databases. Searches were performed on the title of the articles and without any timespan restriction. The first 327 articles were manually downloaded, excepting the duplicates and the dead links.
Specialist websites
The following websites were manually searched for relevant articles, including grey literature:
-
Achieve QUieter Oceans by shipping noise footprint reduction website: http://www.aquo.eu/.
-
Association for biodiversity conservation: http://www.objectifs-biodiversites.com.
-
Document portal of the French Ecology Ministry: http://www.portail.documentation.developpement-durable.gouv.fr/.
-
Document database of the French General commission for sustainable development: http://temis.documentation.developpement-durable.gouv.fr/.
-
European Commission websites: http://ec.europa.eu/ and http://publications.jrc.ec.europa.eu/.
-
European parliament website: http://www.europarl.europa.eu/.
-
French forum against noise: https://assises.bruit.fr/.
-
Information and Documentation Center on Noise: http://www.bruit.fr.
We collected nine articles from these specialist websites that we included in the mapping process.
Supplementary searches
A call for literature was conducted via different channels from January 2019 to April 2019 to find supplementary literature, in particular non peer-reviewed articles, published in French or in English.
Specialized organizations were contacted via their networks, their web forums or their mailing lists:
-
the “IENE—Infra Eco Network Europe” (http://www.iene.info/),
-
the French program on transportation infrastructure ITTECOP “Infrastructures de Transports Terrestres, ECOsystèmes et Paysages” (http://www.ittecop.fr/),
-
the French national council for the protection of nature “Conseil national de protection de la nature (CNPN)”,
-
the Green and blue infrastructure policy, a French public policy (http://www.trameverteetbleue.fr),
-
the “Société Française d’Ecologie” (https://www.sfecologie.org/),
-
the French national mailing list EvolFrance managed by INRAE on biological evolution and biodiversity (https://www6.inra.fr/reid_eng/News/Evolfrance).
The following social media were also used to alert the research community to the systematic map and to request non peer-reviewed articles: ResearchGate (http://www.researchgate.net), Twitter (http://www.twitter.com), LinkedIn (http://www.linkedin.com).
A total of 83 articles were sent to us in response to the call for literature.
Bibliographies from relevant reviews
After having collected the literature from the different sources described above, we selected 37 relevant reviews from our corpus. Then, we extracted all their bibliographic references, resulting in 4025 citations (see the list of the 37 reviews and their corresponding number of extracted citations in Additional File 3). Among these citations we excluded all duplicates (intra-duplicates and duplicates between these bibliographies and our previous literature collection). We screened the titles of the remaining citations, we retrieved the pdf file of the selected titles and then we screened their full-texts.
Testing the comprehensiveness of the search results
Among the 65 articles included in the test list, the number of articles retrieved from the main sources are (see Additional file 4 for more details on the comprehensiveness values): WOS CC 55, Scopus 56, Google Scholar 41, CORE 5, BASE 3, Relevant reviews 43.
The low comprehensiveness levels reached with CORE and BASE can be explained by the fact that these two search engines index mostly grey literature (they were included in the search strategy for this reason) such as reports, theses or books, whereas this type of literature is absent from the test list that mainly contains journal articles.
The overall comprehensiveness of the map search strategy is 95% (62 articles out of the 65 articles in the test list were retrieved by the different bibliographic sources, see in Additional file 4 the 3 unretrieved articles).
Manually added articles
Finally, some articles were added manually to the corpus:
-
the 3 articles included in the test list that were not retrieved by the search strategy,
-
36 relevant articles identified by the team that were found in other publications, but not retrieved by the search strategy. For example, these articles were detected in proceedings or books from which other articles had already been added to the map and that we discovered during the screening process or the full-text collection.
Duplicate removal
Duplicate removal was carried out throughout the mapping process using Excel (duplicate conditional formatting and visual identification line by line). Duplicates were removed from each corpus (e.g. intra Scopus duplicates) and between bibliographic sources (e.g. duplicates between Scopus and Google Scholar). The selected citation was systematically the one from Web of Science Core Collection because the metadata linked to the citations extracted from this database are more complete compared to the Scopus database and supplementary literature sources (BASE, CORE, Google Scholar, call for literature).
Article screening and study-eligibility criteria
Screening process
Using the predefined inclusion/exclusion criteria detailed below, all articles were screened using Excel, first on titles, then on abstracts and finally on the full-texts.
When there was any doubt regarding the presence of a relevant inclusion criterion or if there was insufficient information to make an informed decision, articles were retained for assessment at a later stage. In particular, articles retained after title screening, but that did not have an abstract were immediately transferred to full-text screening. Given that titles and abstracts in grey literature do not conform to scientific standards, assessment of grey literature was performed during the full-text screening phase. Care was taken to ensure that reviewers never screened their own articles.
The three screening stages were conducted by three reviewers (RS, SV, AD). To assess the consistency of the inclusion/exclusion decisions, a Randolph’s Kappa coefficient was computed before screening the full search results. To that end, a set of articles was randomly selected (respectively composed of 200 articles for title screening, 20 articles for abstract screening and 15 articles for full-text screening) and screened by each reviewer independently. The process was repeated until reaching a Kappa coefficient value higher than 0.6. But even after reaching the necessary Kappa value, all disagreements were discussed and resolved before beginning the screening process.
During calibration of the map protocol, a scoping stage was conducted in the “Web of Science Core Collection” and the three stages of the screening process were tested by one reviewer (RS) in order to refine the eligibility criteria. For these articles, a second reviewer (SV) examined all the rejected articles. Disagreements were discussed and, in some cases, articles were re-included. At the title screening stage, 4692 titles rejected by RS were checked by SV and 156 (3%) were re-included. At the abstract screening stage, 180 abstracts rejected by RS were checked by SV and none were re-included. At the full-text screening stage, 95 full-texts rejected by RS were checked by SV and none were re-included.
Eligibility criteria
Article eligibility was based on the list of criteria detailed in Table 2, with no deviation from the a priori protocol.
The language was considered as an eligibility criteria only at the full-text screening stage. This means that if an article had an abstract written in another language than French or English, it was not excluded for this reason and it was transferred to the full-text screening stage.
During the three screening stages, rejected articles were systematically classified into four categories (see Table 3 for examples). When an article topic obviously lay outside the scope of this map, it was marked “D” (for Diverse); otherwise it was marked P for irrelevant Population, E for irrelevant Exposure or O for irrelevant Outcome.
Study-validity assessment
No study validity assessment was performed because the intention of the map was not to examine the robustness of the study designs. Critical appraisals of study validity are usually conducted in the case of systematic reviews, not for systematic maps.Footnote 1
Data-coding strategy
All the articles passing the three screening stages were included in the mapping database, apart from those published in 2019 or 2020. This is because some literature searches did not cover 2019 and others covered only a part of it. Consequently, we decided not to include articles published in 2019 (or in 2020) to maintain consistency in the map statistics. Accepted full-texts published in 2019 or 2020 were not coded and were grouped in an additional file for a possible later update of the map.
Each article included in the map was coded based on the full-text using keywords and expanded comment fields describing various aspects. The key variables are:
Article description:
-
Article source (WOS research, Scopus research, Google Scholar research, etc.);
-
Basic bibliographic information (authors, title, article date, journal, DOI, etc.);
-
Language (English/French);
-
Article type (journal article, book, thesis, conference object, etc.);
-
Article content (four possibilities: study, review, meta-analysis, other). A study consists of an experiment or an observation, it can be field based (in situ or ex situ) or model based. A review is a collection of studies, based or not on a standardized method. A meta-analysis is a statistical analysis based on several previously published studies or data;
Article characteristics:
-
Type of population (taxonomic groups). First, we classified the articles according to four taxa: prokaryotes, vertebrates, invertebrates and plants. Then, for vertebrates and invertebrates, we classified the articles as concerning respectively amphibians/birds/fishes/mammals/reptiles/others or arachnids/crustaceans/insects/mollusks/others. This classification is based on different prior evidence syntheses on noise pollution [34, 53, 54], including more details concerning invertebrates. In addition, it is usual in biodiversity documentation and facilitates understanding by stakeholders;
-
Type of exposure (sources of noise, see Fig. 1 for more details);
Fig. 1 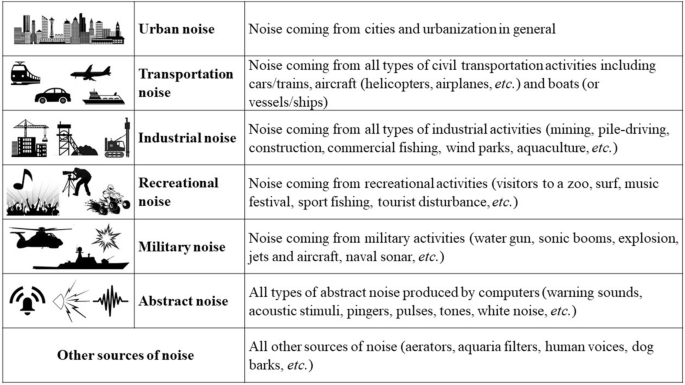
Categories to code the sources of noise (exposure)
-
Type of outcomes (types of impacts, see Fig. 2 for more details).
Fig. 2 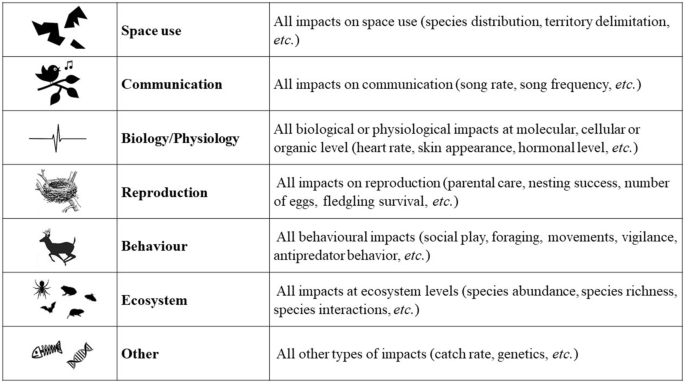
Categories to code the impacts of noise (outcomes)


Here again, to categorize the exposure (sources of noise) and the outcomes (types of impacts), we used previously published evidence syntheses on noise pollution and biodiversity, in particular the review by Shannon et al. (2016) (see in this publication Table 2, page 988 on the sources of noise and Table 3, page 989 on the impacts of noise) [34].
For studies only:
-
Country where the study was conducted;
-
Type of habitat (terrestrial or aquatic);
-
Study context: in situ (field)/ex situ (laboratory, aquariums, etc.);
-
Experimental (causal)/observational (correlative) study;
-
Origin of noise (artificial, real, recorded).
These metadata were coded according to an a priori codebook (see Additional file 6 in Sordello et al. [36]) that was marginally adjusted. The final version of this codebook is included as a sheet in the provided database file (see below the corresponding Additional file 9).
As far as possible, controlled vocabularies were used to code the variables (e.g. article type, dates, country, etc.), using thesauri or ISO standards (e.g. ISO 639-1 for the language variable and the ISO 3166-1 alpha 3 code for the country).
Coding was performed by three coders (OR, AD and RS). Because of time and resource limitations in our project, we could not undertake double coding and not all the articles could be coded by a single coder. Coding was carried out by three persons who successively coded a part of the articles. RS began, AD continued and OR finished. One coder coded all variables for the articles included in his/her group of articles (i.e. an article was not coded by several coders). There was no overlap in article coding. To understand the coding rules, explanation was given by RS to AD and OR before they started to code their group of articles. Also, to better understand the coding rules, AD could use the articles previously coded by RS and OR could use the articles previously coded by RS and AD. The three coding steps were monitored by RS who discussed with the two other coders in case of doubt. Finally, when the three groups of articles had been coded, RS reviewed the entire database to identify any errors and homogenize the terminology.
Data-mapping method
By cross-tabulating key meta-data variables (e.g. population and outcomes), summary figures and tables of the article characteristics were produced for this map report to identify knowledge gaps (un- or under-represented subtopics that warrant further primary research) and knowledge clusters (well-represented subtopics that are amenable to full synthesis by a systematic review). Based on these results, recommendations were made on priorities for policy makers, practitioners and research.
Results
Literature searches and screening stages
During the screening process, reviewers did not screen articles that they had authored themselves, except the protocol of this systematic map and it was excluded during the title-screening stage.
The ROSES flow diagram below (Fig. 3) provides an overview of the screening process and shows the volumes of articles at the different stages. Detailed screening results are explained in Additional file 5 and illustrated with a full flow diagram in Additional file 6. The list of all collated and screened articles is provided as an Excel sheet attached to this map report (Additional file 7). It contains information on the three screening stages (names of screeners, date of screening, inclusion/exclusion decisions, reason for exclusion, etc.). This file was drafted according to a codebook that describes each variable and the available values and that is included as a sheet in the provided file. In a separate sheet, it also contains the list of excluded full-texts and the reason for exclusion.

Among the 29,027 articles initially collected, 9482 were deleted because they were duplicates, 14,503 were excluded on titles, 947 on abstracts and 1262 on full-texts. A total of 1887 articles were definitively selected after the three screening stages. Among them, 1746 were included in the map to be coded (with 48 more articles manually added or coming from specialist websites) and 141 were grouped in a separate additional file because they were published in 2019–2020 (Additional file 8). The systematic-map database contains 1794 relevant articles on the impacts of anthropogenic noises on species and ecosystems (Additional file 9), of which 19 are written in French and 1775 in English.
General bibliometrics on the database
Article sources
The systematic-map database is composed of 1794 articles that come (see Table 4):
-
mainly from bibliographic databases: 65% (48% from WOS CC and 17% from Scopus);
-
from the bibliography of relevant reviews in a significant proportion: 19%;
-
from web-based search engines: 12% (in particular 8% from Google Scholar).
Articles coming from the call for literature or the specialist websites and manually added articles represent less than 5% of the map.
Regarding the efficiency of the searches, the call for literature, CORE search engine and Web of Science CC database stand out as the most relevant sources of bibliography for this map (Table 4). For instance, 27% of the literature received from the call was included in the map as was 15% from CORE, however these two sources represent a very small part of the final map (1% and 3%, respectively). On the contrary, articles collected from Scopus represent 17% of the final map whereas only 3% of the total number of articles collected from this database were actually relevant. Concerning the key reviews from which citations were extracted, some of these reviews proved to be very useful for the map. For instance, 30% of the bibliography (47 articles) from Gomez et al. [55] were included in the map (see Additional file 3 for the percentage of extracted/included citations for each key review).
Article types and contents
Figure 4a shows the distribution of article types. The systematic-map database is mainly composed of journal articles (1333, which represent more than 74%). The second highest proportions of article types in the map are book chapters and reports that each represent 8% of the map.

Types (a) and contents (b) of articles included in the systematic-map database
Figure 4b shows the distribution of article contents. The systematic-map database is mainly composed of studies (1340, which represent more than 75% of the map), then, reviews (379, 21%) and meta-analyses (16, 1% with one article that is a mixed review/meta-analysis).
Not surprisingly, the majority of studies (1096/1340, 82%) and meta-analyses (13/16, 81%) were published as journal articles. Reviews are more spread over the different types of bibliographic sources even if they are also mainly published as journal articles (186/379, 49%).
Chronological distribution
The systematic-map database contains articles from 1932 to 2018 included. Figure 5 shows that production truely started around 1970 and then strongly increased starting around 2000 (Fig. 5).

Chronologic number of articles since 1950
Map characteristics on the population, exposure and outcomes
Taxonomic groups
The systematic map contains articles almost exclusively on vertebrates (1641/1794, 91%). Invertebrates represent 9% of the map and plants and prokaryotes together form less than 1% (however, it should be noted here that our search string did not include “plant” nor “prokaryote” which may partly explain these results).
Mammals, birds and fishes are the three most studied taxonomic groups in the map (see Fig. 6), with respectively 778/1794 (43%), 524/1794 (29%) and 437/1794 documents (24%) (the sum of mammals, birds and fishes exceeds the number of vertebrates because one article counted as “vertebrates” can include several vertebrate sub-groups).

Number of articles for each type of taxonomic group (population), with details for studies and reviews/meta-analyses
These observed patterns regarding the population for the whole map are the same for studies and for reviews/meta-analyses. Mammals, birds and fishes are also the three taxonomic groups most considered in the studies (respectively 40%, 28% and 22%) and in the reviews/meta-analyses (respectively 52%, 33%, 30%).
Among invertebrates, crustaceans represent the most examined group (4% of the map, 3% of the studies, 6% of the reviews/meta-analyses) followed closely by mollusks.
Sources of noise
For 69 articles (4%), we could not precisely code the source of noise in any exposure class. Indeed, these articles use imprecise expressions such as “anthropogenic noise”. Among the others, 619 articles (35% of the map, see Fig. 7) deal with transportation noise, followed by industrial noise (27%) and abstract noises (25%). Few articles deal with recreational noise (5% of the map).

Number of articles for each source of noise (exposure) with details for studies and reviews/meta-analyses
Focusing on the 1340 studies, transportation noise (32%), abstract noise (30%) and industrial noise (23%) are also the three sources of noise most considered, but the ranking was different from that found for all articles. Regarding the reviews/meta-analyses, transportation (43%) and industry (40%) are the two first sources of noise most considered and military noise (27%) comes in as the third source instead of abstract noises.
Types of impacts
The articles included in the map mainly deal with behavioural impacts of noise (985/1794, 55% of the map, see Fig. 8). Biophysiology is also frequently considered in the articles (704/1794, 39%) and then communication (424/1794, 24%). For 19 articles (1% of the map) we could not code the outcome because it was not detailed by the authors.

Number of articles for each type of impact (outcomes), with details for studies and reviews/meta-analyses
With a focus on the 1340 studies, impacts of noise on behaviour (51%), on biophysiology (34%) and on communication (22%) are the most considered, similar to the situation for reviews/meta-analyses (respectively 66%, 56% and 31%). On the contrary, space use is the least studied outcome.
Knowledge gaps and knowledge clusters
We combined the results (number of studies) between two of the three characteristics (population, exposure and outcome), resulting in Figs. 9, 10 and 11.

Taxonomic groups (P) and sources of noise (E) in studies

Taxonomic groups (P) and types of impacts (O) in studies

Sources of noise (E) and types of impacts (O) in studies
For each of the three combinations of data, we extracted the top four results (those with the highest number of studies), resulting in 12 knowledge clusters presented in Table 5. This analysis confirms the knowledge clusters previously noted in the results on population (in Fig. 6, namely mammals, birds, fishes), exposure (in Fig. 7, transportation, industrial, abstract noises) and outcomes (in Fig. 8, behaviour, biophysiology and communication).
Concerning knowledge gaps, the analysis between population, exposure and outcomes reveals that many combinations have never been studied and it is difficult to identify any knowledge gaps in particular. We can refer to separate results on population, exposure and outcomes that show that few studies were conducted on amphibians (61), reptiles (18), all invertebrates (in particular arachnids: 3) and plants (8) in terms of population (see Fig. 6); recreational (57), military (106) and urban noises (131) in terms of exposure (see Fig. 7); space use (94), reproduction (149) and ecosystems (167) in terms of outcomes (see Fig. 8).
Study characteristics
Study location
Almost one third of all studies (441/1340, 33%) were carried out in the USA (Fig. 12). A substantial proportion of the studies were also conducted in Canada (121/1340, 9%), Great Britain (84/1340, 6%), the Netherlands (70/1340, 5%) and even Australia (698/1340, 5%). The country is unknown in 135 studies (10%).

Tree-map representation of the countries where at least 10 studies were included in the map. Values: USA: 441; CAN (Canada): 121; GBR (Great Britain): 84; NLD (Netherlands): 70; AUS (Australia): 69; DEU (Germany): 41; NOR (Norway): 37; FRA (France): 27; ITA (Italia): 27; BRA (Brazil): 26; ESP (Spain): 24; CHN (China): 22; DNK (Denmark): 20; SWE (Sweden): 17; NZL (New-Zealand): 15; MEX (Mexico): 14; POL (Poland): 11; RUS (Russia): 10
Noise source and media
Studies mainly deal with real noise (632/1340, 47%). Around a third of the studies (378/1340, 28%) are based on artificial noise and 16% of the studies (221/1340) use real recorded noise (Fig. 13a top). The distribution between terrestrial or aquatic media through which noise is broadcast is virtually equivalent (see Fig. 13b bottom, respectively 47% and 51%).

Number of studies included in the map in terms of the noise generated (a; top) and noise media (b; bottom)
Study context and design
Figure 14 shows that 95% of studies (1274/1340) are field based whereas only 3% (40/1340) are model based and less than 1% (9/1340) are combined (field and model based studies). Among the 1283 studies that are totally or partially field based, 56% (720) are in situ whereas 42% (537) are ex situ (zoos, aquarium, cages, etc.) and 2% (26) are combined (Fig. 14 left). Also, a majority are experimental (856/1283, 67%), 32% (411/1283) are observational and less than 1% (12/1283) are combined (experimental and observational) (Fig. 14 right).

Number of studies included in the map in terms of the context and design protocol
Reviews and meta-analyses
The high number of reviews included in the systematic map (379) can be explained by our methodology. Indeed, some articles were retrieved by our search strategy because they contain only one chapter or one paragraph that reviews the bibliography on impacts of anthropogenic noise on biodiversity. As a consequence, they were included in the map during the screening process even if the document as a whole does not deal with our map’s main issues. Nevertheless, the map does include many reviews that fully address the impacts of noise pollution on species and ecosystems. This means that, contrary to what was assumed beforehand, a huge amount of synthesis work has in fact already been invested in this topic. However, our results confirm that, for the moment, no prior systematic map—as broad and comprehensive as the present one—has been published yet, even if after the date of our literature search, a systematic-map protocol has been published on the impact of noise, focusing on acoustic communication in animals [56].
Some of the collected reviews are general syntheses and provide an overview of the impacts of anthropogenic noise on species (i.e. Kight and Swaddle [57]; Dufour [58]). However, most of reviews are focused on one or more population(s), exposure(s) and outcomes(s) or even a combination of these three parameters. For instance:
-
concerning taxonomic groups (population): some reviews deal with specific taxa—such as fishes [59], marine mammals [60] or crustaceans [61]—or with wider groups—such as invertebrates [31] or even terrestrial organisms [62];
-
concerning types of noise (exposure): Pepper et al. [63] address aircraft noise, Patricelli and Blickley [32] urban noise and Larkin [64] military noise;
-
concerning types of impacts (outcomes): De Soto et al. [65] (which is a proceeding) focus on physiological effects, Brumm and Slabbekoorn [66] target communication and Tidau and Briffa [67] (which is also a proceeding) deal with behavioural impacts.
Five reviews are presented as “systematic reviews” by their authors. One of them is Shannon et al. [34], which is indeed a wide synthesis of the effects of noise on wildlife. Another is dedicated to behavioural responses of wild marine mammals and includes a meta-analysis (quantitative synthesis) [55]. Two other systematic reviews include noise effects in a wider investigation of the impacts of some human activities, respectively seismic surveys [68] and wind energy [69]. The fifth is more specific and deals with the impact of prenatal music and noise exposure on post-natal auditory cortex development for several animals such as chickens, rats, mice, monkeys, cats and pigs [70]. Two other reviews—Radford [54] and Williams et al. [71]—could be qualified as “systematic” because their method is standardized (e.g. search string, screening process), but their authors have not done so.
Among the meta-analyses included in the map, we can cite in particular Cox et al. [72, 73] on fishes, Roca et al. [35] on birds and anurans and Gomez et al. [55] on marine mammals. Birds are particularly considered since two more meta-analyses deal with this taxonomic group [74, 75]. We can also note Cardoso et al. [76] on the impact of urban noise on several species.
Finally, regarding books, five of them are particularly relevant to the map topic, chronologically:
-
“Effects of Noise on Wildlife” [77];
-
“Marine Mammals and Noise” [78];
-
“Animal Communication and Noise” [79];
-
“The Effects of Noise on Aquatic Life” (Popper and Hawkins), published in two volumes 2012 and 2016 [80, 81];
-
“Effects of Anthropogenic Noise on Animals” [82] which is the newest book on noise pollution and wildlife with syntheses for taxonomic groups such as fishes [83], reptiles and amphibians [84], birds [85] and marine mammals [86].
Some other books can be very general in discussing noise pollution, for instance “Railway ecology” [87]. Lastly, some other books can contain entire chapters specifically on noise pollution, e.g. “Avian Urban Ecology: Behavioural and Physiological Adaptations” [88, 89] or “The Handbook of Road Ecology” [90, 91]. We can also cite the “Ornithological Monographs” N°74 which is dedicated to noise pollution and contains one review [92] and several studies that are all included in the map [93, 94].
Recently, some relevant syntheses were published in 2019 (not included in the map; see Additional file 8). A meta-analysis was performed on the effects of anthropogenic noise on animals [53] and a systematic review was published on intraspecific variation in animal responses to anthropogenic noise [95]. In addition, one review on the impact of ship noise on marine mammals includes a systematic literature search [96]. Two non-systematic reviews can also be cited, one about invertebrates [97] and the other about fishes [98].
Among all these bibliographic syntheses (including those from 2019), we selected those whose literature collection is based on a standardized approach (e.g. search string, database request, screening process)—which includes meta-analyses and systematic reviews/maps or similar—and whose topic is as close as possible to our systematic map (e.g. focused on noise and not on wider human pressures). We summarized the main features (topic delimitation, search strategy, number of citations) for the 12 selected evidence syntheses in Table 6 with more details in Additional file 10.
In most cases, these reviews and meta-analyses contain far fewer articles than what we collected, which can be explained by their topic restrictions (P, E, O) as well as their search strategy (e.g. number of databases, complementary searches or not, screening criteria). In terms of topics, Shannon et al. [34] would appear to be the only standardized evidence synthesis as wide as ours (all wildlife, all sources of noise, all impacts), but the authors gathered 242 articles from 1990 to 2013. The synthesis published by Radford [54]—which, as a report, is grey literature—also provides an overview of the state of knowledge with descriptive statistics, according to a standardized method, although it focuses on non-marine organisms and it is based on 86 articles. In 2019, Kunc and Schmidt published a meta-analysis that covers all impacts of noise on animals and they collected 108 articles [53].
Discussion
General comments
This map reveals that the literature on the impact of anthropogenic noise on species and ecosystems is already extensive, in that 1794 relevant articles were collected, including 1340 studies, 379 reviews and 16 meta-analyses. Studies are mainly located in North America, in particular in the United States and Canada. In Europe, the United Kingdom and the Netherlands have produced the largest numbers of articles. Australia is also active in this field.
This high volume of bibliography highlights the fact that this issue is already widely studied by scientists. The production on this topic started many years ago, around 1970, and has surged considerably since 2000. More than one hundred articles a year since 2012 are listed in our map.
This chronological pattern is quite usual and can be encountered for other topics such as light pollution [99]. It can be due to practical reasons such as better dissemination and accessibility of articles (e.g. database development), but it also certainly reflects a real increase in research activity on the topic of “noise pollution” in response to social concern for environmental issues.
The articles are mainly provided through academic sources (i.e. journal articles), but grey literature is also substantial. 461 articles included in the map (i.e. around a fourth of the map) can be grouped as ‘‘grey literature’’ (books and book chapters, reports, theses, conference objects). In particular, 36 theses from all over the world address this issue.
Regarding the population, the systematic map confirms that a very broad range of species is the topic of literature on the effects of noise pollution. Indeed, all of the 11 population classes of our coding strategy contain articles. Nevertheless, a high proportion of the map concerns mammals and, to a lesser extent birds and fishes. Among the 778 articles targeting mammals, many infrataxa are concerned (e.g. Cetacea [100], Carnivora [101], Cervidae [102], Chiroptera [103], Rodentia [104]), but the highest proportion of the articles on mammals deals with aquatic noise (500/778, 64%), which suggests that many may concern Cetacea (e.g. dolphins, whales, beluga).
The other taxonomic groups receive far less attention. Amphibians, crustaceans, mollusks, insects, reptiles and arachnids each represent 5% or less of the whole map. However, comparing these knowledge gaps to contemporary biodiversity issues, we can say, for instance, that amphibians, reptiles and invertebrates are highly threatened species [105, 106] and noise pollution around the world is probably part of the threats [31, 84]. These taxonomic groups are likely impacted by noise depending on the sense used. In particular, amphibians communicate extensively using sounds (i.e. chorus frogs) [107], insects demonstrate hyperacuity in directional hearing [108], reptiles (in particular snakes) and spiders can feel vibrations [109,110,111,112].
In terms of exposure, the map confirms that a very wide variety of anthropogenic activities generate noise and that the effects of these emissions have already been studied.
Transportation (that includes terrestrial infrastructure as well as civil aircraft and boats) is the source of noise most considered. It is closely followed by industrial sources among which high diversity is observed (e.g. pile-driving [113], seismic surveys [114], wind turbines [115], mining [116], constructions [117]). Abstract noises are in third position. This category does not necessary correspond to any precise human activities but comprises a large set of computer or machinery sounds (e.g. alarms [118], pingers [119], tones [120], pulses [121], bells [122]). Often, articles in this category do not contain many details about the source of noise. Military noise is especially studied for mammals and urban noise is significantly considered for birds (but not otherwise). Recreational noise is the least studied, however a certain diversity of sources is observable (e.g. zoo visitors [123], music festivals [124], sporst activities [125], tourists in natural habitats [126], Formula one Grand Prix racing [127], whale-watching [128]). However, urban and recreational sources of noise are important and will increase in the future because, on the one hand, urbanization is spreading all over the word and, on the other, human presence in natural habitats is also becoming more and more frequent (e.g. recreational activities in nature). For example, the expansion of Unmanned Aircraft could be a serious threat for biodiversity [129].
In terms of outcomes, the map also confirms a very wide range of impacts of noise on species and ecosystems. The most studied are the behavioural impacts involving measurements on movement [130], foraging [131], hunting [132], social behaviour [133], aversive reaction [134], etc. Biophysiology and communication are also well covered, especially the impacts on the biophysiology of mammals and fishes and on the communication birds. Biophysiological outcomes can be very diverse (e.g. hormonal response [135], heart rate [136], blood parameters [137], organ development [138]). On the other hand, the lack of literature on ecosystems, reproduction and space use is of concern. Ecosystems are a very significant aspect of biodiversity and will be increasingly integrated in public policies and scientific research, notably concerning ecosystem services in the context of global changes [139, 140]. Reproduction and mobility of species are essential for the sustainability of their population and we already know that noise can impair them [141, 142].
Concerning the systematic map, at the moment, we are not able to conclude whether this very rich literature provides strong evidence on impacts of anthropogenic noise on animals. Indeed, we do not know if the studies and other articles confirm or invalidate such impacts and if the studies are sufficiently robust for that purpose. However, our database highlights that a majority of studies are experimental field-based studies. This is a very good point in planning further meta-analyses or systematic reviews with the prospect of quantifying the level of impacts because these studies would probably be selected following critical analysis. For future systematic reviews/meta-analyses, we identified that the three outcomes comprising the highest number of experimental studies (which are the type of content that systematic reviews or meta-analyses would use) are: behaviour (453), biophysiology (391), communication (145).
Given the scope of our map resulting in a high number of population (P), exposure (E) and outcome (O) classes, there is a wide range of possible PEO combinations. Therefore, it is difficult to go further in this report in terms of identifying knowledge gaps and clusters and possible specific questions for future systematic reviews. At the same time, this large number of PEO combinations offers stakeholders (e.g. researchers, practitioners, decision-makers) an opportunity to gain information on the combination of interest to them.
Comparison to other evidence syntheses
It is interesting to check whether other evidence syntheses previously published have arrived at the same results, knowledge clusters and knowledge gaps as those highlighted by our map. However, given the differences in terms of methodology, topic delimitation and volume of the existing reviews, exposed in the results section, it is difficult to make such comparisons for all reviews. But we can compare our results to those from two other reviews, namely Shannon et al. [34] and Radford [54] (see Fig. 15).

Concerning population (Fig. 15a), mammals are the most studied species in Shannon et al. [34] (39%) as they are in our map (40%). In Radford [54], birds greatly surpass mammals (65% vs. 9%), but that can be explained by the exclusion of marine species (among which there are many mammals) in the synthesis. Fishes are more represented in our map (22%) than in the two other reviews (Shannon et al.: 15%, Radford: 10%).
Regarding exposure (Fig. 15b), transportation is the greatest source of noise in Shannon et al. [34] for terrestrial activities (30%), similar to our map (15%). For aquatic activities, industrial noise is the exposure most frequent in our map (20%) as in Shannon et al. [34] (28%). In Radford [54], transportation noise is by far the foremost exposure (more than 75% exclusively for road and aircraft noise). These results seem to be quite consistent.
Concerning outcomes, in Shannon et al. [34], vocalization is the most frequent for terrestrial studies (44%) whereas behavioural outcomes come first in our map (19%). Behavioural is the most frequent outcome for aquatic studies in Shannon et al. [34] (more than 40%) whereas biophysiology comes first in our map (24%). Here, our results are more consistent with Radford [54], where behavioural outcomes are the most frequent (approximately 65%, compared to approximately 54% in our database).
Limitations of the systematic map
Search strategy
We are aware that two academic databases (WOS CC and Scopus) in our search strategy is a minimum according to the CEE guidelines [38]. Nevertheless, WOS CC is the most used database in Ecology and Scopus is probably the second. Furthermore, our overall strategy includes eight bibliographic sources (see Table 4) and in particular three search engines. In addition, a large number of hits were exported from each of the search engines (e.g. 1000 citations for each search string on Google Scholar instead of the 300 initially expected). We also completed our search strategy with the extraction of all the bibliographic references from 37 relevant reviews. Finally, when a reference was a part of a more comprehensive article (i.e. a meeting abstract inside a proceeding with multiple abstracts), we checked whether other parts of the article could be also interesting for the map (i.e. other meeting abstracts from the same conference proceeding). We could not check systematically due to our limited resources but, nevertheless, this verification produced 36 articles that were added manually to the map.
In conclusion, although our search strategy is robust for journal articles/studies, we may have missed some relevant articles in other formats (e.g. conference papers, books, chapters). That being said, studies are the most important documentation for conducting further systematic reviews.
In addition, in light of the considerations exposed in “Results” and “Discussion” sections), our systematic map would seem to be wide-ranging and complete because it does not restrict the population, the exposure or the outcomes, contrary to the majority of reviews included in the map. The number of articles collected in the 12 systematic reviews/meta-analyses described in Table 6 shows that our map (1794 articles) constitute a very important dataset.
Full-text searching
In order to facilitate a possible additional full-text research, we have compiled a list of the unretrieved full-text texts in a dedicated Additional file 11 (Sheet 1). We could retrieve 90% of the searched full-texts which means that we had to exclude 376 articles from the map process because we could not get their full-texts. We are aware that this volume of unretrievable full-texts is not a satisfactory result, however there is no standard minimum in the CEE guidelines [38] and we did everything we could to find the full-texts. First, we benefited from different institutional accesses thanks to our map team (MNHN, CNRS, INRAE). We even performed an additional search during the Covid period when some publishers suspended their paywall. Secondly, we also asked for French and even international interlibrary loans and, when necessary, we went to the libraries to collect them. We also asked for the missing full-texts on ResearchGate. A large number of unretrieved full-texts come from the extracted relevant reviews, from Scopus and from Google Scholar (see Additional file 11, Sheet 2 for more details on retrieved/not retrieved full-texts depending on the bibliographic sources). In the end, we could obtain some explanations for a majority of the unretrieved full-texts, i.e. 25 (7%) are available online but behind an embargo, a paywall or another access restriction, 124 (33%) are not accessible to the map team (unpublished thesis or report, unlocatable conference proceedings, only available in a print journal, etc.), 47 (13%) would be excluded during screening because of their language (according to Scopus information), 19 (5%) were requested on ResearchGate without any response.
Languages accepted at full-text screening stage
We are aware that we accepted only two languages, English and French. Nevertheless, among the 3219 screened pdf files, only 54 articles were rejected at the full-text stage because of their language. This represents less than 2%. In the end, to facilitate a possible additional screening of these full-texts, we listed them in Additional file 12. It should also be noted that when a title or an abstract was not in English or in French, it was not rejected for this reason during the title/abstract screening, it was sent directly to abstract and/or full-text screening to check its effective language.
Coding strategy
Due to resource limitations, we were not able to perform double coding of each article by two reviewers, as requested by the CEE guidelines. We are aware that this is not a totally rigorous approach, but we anticipated it in our a priori protocol [36] because we knew that time and resources would be limited. We think that our approach did not affect coding consistency because the three coders (RS, AD, OR) followed the same coding rules and one person (RS) was present throughout the coding process to explain the rules to the other coders and to help them if necessary. In addition, at the end of the coding procedure, RS reviewed the entire map for analysis purposes.
Regarding the coding strategy, we are aware that our classification (in particular for exposure and outcome classes) is not perfect, but it is difficult to achieve a perfect solution. We decided to use published reviews such as Shannon et al. [34] or Radford [54], but different strategies exist. For example, Radford [54] split the transportation sources of noise (e.g. road, rail, boat), whereas Shannon et al. [34] grouped them in a “transportation” class. Such classes may appear too broad, but this strategy produces an initial overview of the available literature, which is certainly one of the objectives of a systematic map. As another example, the outcome class “Reproduction” was also difficult to delimit because it can include reproduction in the strictest sense (e.g. number of eggs) as well as other impacts that can influence reproduction (e.g. physiological impacts on adults in a breeding colony). In such cases, we coded the article for the different outcomes (i.e. biophysiology/reproduction).
Conclusion
This systematic map collated and catalogued literature dealing with the impacts of anthropogenic noise on species (excluding humans) and ecosystems. It resulted in a database composed of 1794 articles, including 1340 studies, 379 reviews and 16 meta-analyses published worldwide. Some systematic reviews and meta-analyses have already been published and were collected, however, no systematic map has yet been produced with so few topic restrictions (all wildlife, all sources of noise, all kinds of impacts) and using such a large search strategy (two databases, three search engines, etc.).
This map can be used to inform policy, provide the evidence for systematic reviews and demonstrate where more primary research is needed. It confirms that a broad range of anthropogenic activities can generate noises which may produce highly diverse impacts on a wide array of taxa. To date, some taxonomic groups (mammals, birds, fishes), types of noise (transportation, industrial, abstract) and outcomes (behavioural, biophysiological, communication) have undergone greater studies than others. Less knowledge is available on certain species (invertebrates, reptiles, amphibians), noises (recreational, urban, military) and impacts (space use, reproduction, ecosystems). Currently, this map cannot be used to determine whether the included studies demonstrate that noise does indeed produce impacts. However, it can be the starting point for more thorough syntheses of evidence. Included reviews and meta-analyses should be exploited to transfer this synthesized knowledge into operational decisions to reduce noise pollution and protect biodiversity.
Implications for policy/management
Given the volume of bibliographic data, we obviously do not face to a totally unexplored topic. But surprisingly, this rich literature on the impacts of noise pollution on biodiversity does not seem to be exploited by practitioners and decision-makers. Indeed, to date, noise pollution has been considered in terms of impacts on human health, but very little or no consideration has been given to impacts on other species and ecosystems. Two key implications emerge from this map.
First, the high volume of reviews and meta-analyses collected in this map can facilitate the immediate integration of these evidence syntheses into public policies on the national and international levels. Some reviews and the meta-analyses have quantified the level of impacts concerning the species, sources of noise and outcomes they considered. A strategy should be defined to assess the quality of these syntheses (critical appraisal) and, if reliable, transfer this already synthesized knowledge to institutional texts (e.g. regulations, guidelines, frameworks). Thanks to the exposure categorization undertaken in this map, many stakeholders and practitioners (urban planners, transport infrastructure owners, airlines and airports, military authorities, tour operators, manufacturing companies, etc.) will be able to directly identify the articles that concern their activities/structures. Such knowledge may also be useful for the European Commission, which intends to produce indicators to monitor the reduction of submarine noise pollution, as part of a new strategy for biodiversity [143].
Secondly, several knowledge clusters identified in this map may be used for new systematic reviews and meta-analyses to assess the evidence of impacts. Resources should be invested in evidence syntheses capable of exploiting the full range of the mapped literature. In particular, these analyses could determine sensitivity thresholds for guilds of species representing several natural habitats. These thresholds are essential in taking noise pollution into account for green and blue infrastructures in view of preserving and restoring quiet ecological networks. Practitioners (e.g. nature reserves and local governments) in France have started to implement this type of environmental policy and this will increase in the future [144].
Implications for research
New research programs should initiate studies on knowledge gaps, using robust experimental protocols (such as CE—Control/Exposure, BAE—Before/After/Exposure, B(D)ACE—Before(/During)/After/Control/Exposure) [145,146,147,148] and taking into account different types of bias [149,150,151]. In particular, studies should be started on some taxonomic groups (amphibians, reptiles and invertebrates), on certain sources of noise (recreational, military and urban) and to assess particular impacts (space use, reproduction, ecosystems) because these populations, exposures and outcomes have received little study to date. Many PEO combinations have never been studied. In addition, the findings of the current map show that research is not evenly spread worldwide, with main areas of research being in North America (United States, Canada). This finding may have an operational impact because some results may not be transposable to other contexts. Articles on further studies could also be more detailed by the authors. Indeed, some meta-data were unavailable in a significant percentage of the mapped literature. For example, the study location was unknown for 10% of the studies and approximately 1% of the articles did not indicate the source of noise or the outcome that they studied.
The map findings show that research in ecology has already addressed the issue of noise pollution. Deeper analysis is needed to assess the validity of the literature collected in this map, whether primary studies or reviews, in order to produce new syntheses and to transfer this knowledge to the applied field.
Availability of data and materials
All data, generated or analyzed during this study, are included in this published article and its addition information files.
References
Dirzo R, Young HS, Galetti M, Ceballos G, Isaac NJB, Collen B. Defaunation in the anthropocene. Science. 2014;345(6195):401–6. https://doi.org/10.1126/science.1251817.
Hallmann CA, Sorg M, Jongejans E, Siepel H, Hofland N, Schwan H, et al. More than 75 percent decline over 27 years in total flying insect biomass in protected areas. PLoS ONE. 2017;12(10): e0185809. https://doi.org/10.1371/journal.pone.0185809.
Ceballos G, Ehrlich PR, Dirzo R. Biological annihilation via the ongoing sixth mass extinction signaled by vertebrate population losses and declines. Proc Natl Acad Sci USA. 2017;114(30):E6089–96. https://doi.org/10.1073/pnas.1704949114.
Menon M, Mohanraj R. Temporal and spatial assemblages of invasive birds occupying the urban landscape and its gradient in a southern city of India. J Asia-Pac Biodivers. 2016;9(1):74–84. https://doi.org/10.1016/j.japb.2015.12.005.
Ripple WJ, Wolf C, Newsome TM, Galetti M, Alamgir M, Crist E, et al. World scientists’ warning to humanity: a second notice. Bioscience. 2017;67(12):1026–8. https://doi.org/10.1093/biosci/bix125.
Mcdonald RI, Kareiva P, Forman RTT. The implications of current and future urbanization for global protected areas and biodiversity conservation. Biol Conserv. 2008;141(6):1695–703. https://doi.org/10.1016/j.biocon.2008.04.025.
Reis E, López-Iborra GM, Pinheiro RT. Changes in bird species richness through different levels of urbanization: implications for biodiversity conservation and garden design in Central Brazil. Landsc Urban Plann. 2012;107(1):31–42. https://doi.org/10.1016/j.landurbplan.2012.04.009.
Xu X, Xie Y, Qi K, Luo Z, Wang X. Detecting the response of bird communities and biodiversity to habitat loss and fragmentation due to urbanization. Sci Total Environ. 2018;624:1561–76. https://doi.org/10.1016/j.scitotenv.2017.12.143.
Bennie J, Davies TW, Cruse D, Gaston KJ. Ecological effects of artificial light at night on wild plants. J Ecol. 2016;104(3):611–20. https://doi.org/10.1111/1365-2745.12551.
Gaston KJ, Bennie J, Davies TW, Hopkins J. The ecological impacts of nighttime light pollution: a mechanistic appraisal. Biol Rev. 2013;88(4):912–27. https://doi.org/10.1111/brv.12036.
Warren P, Katti M, Ermann M, Brazel A. Urban bioacoustics: it’s not just noise. Anim Behav. 2006;71(3):491–502. https://doi.org/10.1016/j.anbehav.2005.07.014.
Hempton G, Grossmann J. One square inch of silence: one man’s quest to preserve quiet. New York: Atria Books; 2010 (Reprint).
Romer H, Bailey WJ. Insect hearing in the field. Camp Biochem Physiol. 1990;97A(4):443–7. https://doi.org/10.1016/0300-9629(90)90110-E.
Sun JWC, Narins PM. Anthropogenic sounds differentially affect amphibian call rate. Biol Conserv. 2005;121(3):419–27. https://doi.org/10.1016/j.biocon.2004.05.017.
Drolet A, Dussault C, Côté SD. Simulated drilling noise affects the space use of a large terrestrial mammal. Wildl Biol. 2016;22(6):284–93. https://doi.org/10.2981/wlb.00225.
Bernath-Plaisted J, Koper N. Physical footprint of oil and gas infrastructure, not anthropogenic noise, reduces nesting success of some grassland songbirds. Biol Conserv. 2016;204(B):434–41. https://doi.org/10.1016/j.biocon.2016.11.002.
Lazerte SE, Slabbekoorn H, Otter KA. Learning to cope: vocal adjustment to urban noise is correlated with prior experience in black-capped chickadees. Proc R Soc B: Biol Sci. 2016;283(1833). https://doi.org/10.1098/rspb.2016.1058.
Cunnington GM, Fahrig L. Plasticity in the vocalizations of anurans in response to traffic noise. Acta Oecol. 2010;36(5):463–70. https://doi.org/10.1016/j.actao.2010.06.002.
Mancera KF, Murray PJ, Lisle A, Dupont C, Faucheux F, Phillips CJC. The effects of acute exposure to mining machinery noise on the behaviour of eastern blue-tongued lizards (Tiliqua scincoides). Anim Welf. 2017;26(1):11–24. https://doi.org/10.7120/09627286.26.1.011.
Amoser S, Wysocki LE, Ladich F. Noise emission during the first powerboat race in an Alpine lake and potential impact on fish communities. J Acoust Soc Am. 2004;116(6):3789–97. https://doi.org/10.1121/1.1808219.
Shannon G, Crooks KR, Wittemyer G, Fristrup KM, Angeloni LM. Road noise causes earlier predator detection and flight response in a free-ranging mammal. Behav Ecol. 2016;27(5):1370–5. https://doi.org/10.1093/beheco/arw058.
Bunkley JP, McClure CJW, Kawahara AY, Francis CD, Barber JR. Anthropogenic noise changes arthropod abundances. Ecol Evol. 2017;7(9):2977–85. https://doi.org/10.1002/ece3.2698.
Koper RP, Erbe C, du Preez DR, Plön S. Comparison of soundscape contributors between two neighboring southern right whale nursing areas along the South African coast. In: Fourth international conference on the effects of noise on aquatic life Dublin, Ireland, 10–16 July 2016. Proc. Mtgs. Acoust. 2016, vol. 27, 070014. https://doi.org/10.1121/2.0000303.
Jacobsen L, Baktoft H, Jepsen N, Aarestrup K, Berg S, Skov C. Effect of boat noise and angling on lake fish behaviour: disturbance and lake fish behaviour. J Fish Biol. 2014;84(6):1768–80. https://doi.org/10.1111/jfb.12395.
Thompson PM, Lusseau D, Barton T, Simmons D, Rusin J, Bailey H. Assessing the responses of coastal cetaceans to the construction of offshore wind turbines. Mar Pollut Bull. 2010;60(8):1200–8. https://doi.org/10.1016/j.marpolbul.2010.03.030.
Lengagne T. Traffic noise affects communication behaviour in a breeding anuran, Hyla arborea. Biol Conserv. 2008;141(8):2023–31. https://doi.org/10.1016/j.biocon.2008.05.017.
Vasconcelos RO, Amorim MCP, Ladich F. Effects of ship noise on the detectability of communication signals in the Lusitanian toadfish. J Exp Biol. 2007;210:2104–12. https://doi.org/10.1242/jeb.004317.
Brown AL. Measuring the effect of aircraft noise on sea birds. Environ Int. 1990;16(4–6):587–92. https://doi.org/10.1016/0160-4120(90)90029-6.
Mason JT, McClure CJW, Barber JR. Anthropogenic noise impairs owl hunting behavior. Biol Conserv. 2016;199:29–32. https://doi.org/10.1016/j.biocon.2016.04.009.
Newport J, Shorthouse DJ, Manning AD. The effects of light and noise from urban development on biodiversity: implications for protected areas in Australia. Ecol Manag Restor. 2014;15(3):204–14. https://doi.org/10.1111/emr.12120.
Morley EL, Jones G, Radford AN. The importance of invertebrates when considering the impacts of anthropogenic noise. Proc R Soc B. 2014;281(1776):20132683. https://doi.org/10.1098/rspb.2013.2683.
Patricelli GL, Blickley JL. Avian communication in urban noise: causes and consequences of vocal adjustment. The Auk. 2006;123(3):639-649. https://doi.org/10.1642/0004-8038(2006)123[639:ACIUNC]2.0.CO;2.
Popper AN, Hastings MC. The effects of anthropogenic sources of sound on fishes. J Fish Biol. 2009;75(3):455–89. https://doi.org/10.1111/j.1095-8649.2009.02319.x.
Shannon G, McKenna MF, Angeloni LM, Crooks KR, Fristrup KM, Brown E, et al. A synthesis of two decades of research documenting the effects of noise on wildlife: effects of anthropogenic noise on wildlife. Biol Rev. 2016;91(4):982–1005. https://doi.org/10.1111/brv.12207.
Roca IT, Desrochers L, Giacomazzo M, Bertolo A, Bolduc P, Deschesnes R, et al. Shifting song frequencies in response to anthropogenic noise: a meta-analysis on birds and anurans. BEHECO. 2016;27(5):1269–74. https://doi.org/10.1093/beheco/arw060.
Sordello R, Flamerie De Lachapelle F, Livoreil B, Vanpeene S. Evidence of the environmental impact of noise pollution on biodiversity: a systematic map protocol. Environ Evid. 2019;8:8. https://doi.org/10.1186/s13750-019-0146-6.
Nugent C, Paviotti M, Bloomfield A, Kephalopoulos S, Rasmussen S, Blanes N, et al. Good practice guide on quiet areas. Luxembourg: Publications Office; 2014.
Guidelines for Authors | Environmental Evidence. http://www.environmentalevidence.org/information-for-authors. Accessed 8 June 2020.
Haddaway N, Macura B, Whaley P, Pullin A. ROSES flow diagram for systematic reviews. Version 1.0. 2018. https://figshare.com/articles/ROSES_Flow_Diagram_Version_1_0/5897389. Accessed 8 June 2020.
Brumm H. Anthropogenic noise: implications for conservation. In: Breed MD, Moore J, editors. Encyclopedia of animal behavior. Academic Press; 2010. p. 89–93. https://doi.org/10.1016/B978-0-08-045337-8.00289-8.
Dutilleux G, Guillard Y. Bruit urbain et faune sauvage - Synthèse bibliographique. CETE de l’Est; 2007. p. 24.
Dutilleux G, Fontaine A. Bruit routier et faune sauvage. 2015. p. 32.
Keil P, Herben T, Rosindell J, Storch D. Predictions of Taylor’s power law, density dependence and pink noise from a neutrally modeled time series. J Theor Biol. 2010;265(1):78–86. https://doi.org/10.1016/j.jtbi.2010.04.014.
Calderone GJ, Butler RF. The effects of noise due to random undetected tilts and paleosecular variation on regional paleomagnetic directions. J Geophys Res. 1991;96(B3):3973–7. https://doi.org/10.1029/90JB02457.
Rhud JL, Meagher MW. Noise stress and human pain thresholds: divergent effects in men and women. J Pain. 2001;2(1):57–64. https://doi.org/10.1054/jpai.2000.19947.
Lipscomb DM, Son AA, Vertes D, Roettger R, Carroll J. The effect of high level sound on hearing sensitivity, cochlear sensorineuroepithelium and vasculature of the chinchilla. Acta Otolaryngol. 1977;84(1–6):44–56. https://doi.org/10.3109/00016487709123941.
Krebs H, Macht M, Weyers P, Weijers H-G, Janke W. Effects of stressful noise on eating and non-eating behavior in rats. Appetite. 1996;26(2):193–202. https://doi.org/10.1006/appe.1996.0015.
Kuang X. Study on environment effect of construction in Huairou District. In: Proceedings of the international conference on education, management, commerce and society, Shenyang, China. Atlantis Press; 2015. https://doi.org/10.2991/emcs-15.2015.90.
Bee MA. Sound source segregation in grey treefrogs: spatial release from masking by the sound of a chorus. Anim Behav. 2007;74(3):549–58. https://doi.org/10.1016/j.anbehav.2006.12.012.
Dunlop R, Noad M, Cato DH. Modification of humpback whale social sound repertoire and vocal source levels with increased noise. In: Proc. Mtgs. Acoust. 2013. ICA 2013, Montreal, Canada, 2–7 June 2013, vol. 19, 010058. https://doi.org/10.1121/1.4799213.
Castellote M. General review of protocols and guidelines for minimizing acoustic disturbance to marine mammals from seismic surveys. J Int Wildl Law Policy. 2007;10(3–4):273–88. https://doi.org/10.1080/13880290701769262.
Karbalaei SS, Karimi E, Naji HR, Ghasempoori SM, Hosseini SM, Abdollahi M. Investigation of the traffic noise attenuation provided by roadside green belts. Fluct Noise Lett. 2015;14(4):1550036. https://doi.org/10.1142/S0219477515500364.
Kunc HP, Schmidt R. The effects of anthropogenic noise on animals: a meta-analysis. Biol Lett. 2019;15(11):20190649. https://doi.org/10.1098/rsbl.2019.0649.
Radford A. The effects of noise on biodiversity (no0235)—final report for defra. 2012. p. 27.
Gomez C, Lawson JW, Wright AJ, Buren AD, Tollit D, Lesage V. A systematic review on the behavioural responses of wild marine mammals to noise: the disparity between science and policy. Can J Zool. 2016;94(12):801–19. https://doi.org/10.1139/cjz-2016-0098.
Berger-Tal O, Wong BBM, Candolin U, Barber J. What evidence exists on the effects of anthropogenic noise on acoustic communication in animals? A systematic map protocol. Environ Evid. 2019;8:18. https://doi.org/10.1186/s13750-019-0165-3.
Kight CR, Swaddle JP. How and why environmental noise impacts animals: an integrative, mechanistic review: environmental noise and animals. Ecol Lett. 2011;14(10):1052–61. https://doi.org/10.1111/j.1461-0248.2011.01664.x.
Dufour PA. Effects of noise on wildlife and other animals—review of research since 1971. Washington: U.S. Environmental Protection Agency; 1980. p. 102.
Mickle MF, Higgs DM. Integrating techniques: a review of the effects of anthropogenic noise on freshwater fish. Can J Fish Aquat Sci. 2018;75(9):1534–41. https://doi.org/10.1139/cjfas-2017-0245.
Nowacek DP, Thorne LH, Johnston DW, Tyack PL. Responses of cetaceans to anthropogenic noise. Mammal Rev. 2007;37(2):81–115. https://doi.org/10.1111/j.1365-2907.2007.00104.x.
Edmonds NJ, Firmin CJ, Goldsmith D, Faulkner RC, Wood DT. A review of crustacean sensitivity to high amplitude underwater noise: data needs for effective risk assessment in relation to UK commercial species. Mar Pollut Bull. 2016;108(1–2):5–11. https://doi.org/10.1016/j.marpolbul.2016.05.006.
Barber JR, Crooks KR, Fristrup KM. The costs of chronic noise exposure for terrestrial organisms. Trends Ecol Evol. 2010;25(3):180–9. https://doi.org/10.1016/j.tree.2009.08.002.
Pepper CB, Nascarella MA, Kendall RJ. A review of the effects of aircraft noise on wildlife and humans, current control mechanisms, and the need for further study. Environ Manag. 2003;32(4):418–32. https://doi.org/10.1007/s00267-003-3024-4.
Larkin RP, Pater LL, Tazik DJ. Effects of military noise on wildlife: a literature review. Report no.: USACERL Technical Report 96/21. 1996. p. 111.
Aguilar de Soto N, Gkikopoulou K, Hooker S, Isojunno S, Johnson M, Miller P, et al. From physiology to policy: a review of physiological noise effects on marine fauna with implications for mitigation. In: Fourth international conference on the effects of noise on aquatic life Dublin, Ireland 10–16 July 2016. Proc. Mtgs. Acoust. 2016, vol. 27, 040008. https://doi.org/10.1121/2.0000299.
Brumm H, Slabbekoorn H. Acoustic communication in noise. In: Advances in the study of behavior, vol. 35. Academic Press. 2005. p. 151–209. https://doi.org/10.1016/S0065-3454(05)35004-2.
Tidau S, Briffa M. Review on behavioral impacts of aquatic noise on crustaceans. In: Fourth international conference on the effects of noise on aquatic life Dublin, Ireland 10–16 July 2016. Proc. Mtgs. Acoust. 2016, vol. 27, 010028. https://doi.org/10.1121/2.0000302.
Nelms SE, Piniak WED, Weir CR, Godley BJ. Seismic surveys and marine turtles: an underestimated global threat? Biol Conserv. 2016;193:49–65. https://doi.org/10.1016/j.biocon.2015.10.020.
Wang S, Wang S. Impacts of wind energy on environment: a review. Renew Sustain Energy Rev. 2015;49:437–43. https://doi.org/10.1016/j.rser.2015.04.137.
Khairunnisa Z, Jusuf AA, Furqanita D. Differential effects of prenatal music versus noise exposure on posnatal auditory cortex development: a systematic review. J Phys: Conf Ser. 2018;1073(4):042048. https://doi.org/10.1088/1742-6596/1073/4/042048.
Williams R, Wright AJ, Ashe E, Blight LK, Bruintjes R, Canessa R, et al. Impacts of anthropogenic noise on marine life: publication patterns, new discoveries, and future directions in research and management. Ocean Coast Manag. 2015;115:17–24. https://doi.org/10.1016/j.ocecoaman.2015.05.021.
Cox KD, Brennan LP, Dudas SE, Juanes F. Assessing the effect of aquatic noise on fish behavior and physiology: a meta-analysis approach. In: Fourth international conference on the effects of noise on aquatic life Dublin, Ireland 10–16 July 2016. Proc. Mtgs. Acoust. 2016, vol. 27, 010024. https://doi.org/10.1121/2.0000291.
Cox K, Brennan LP, Gerwing TG, Dudas SE, Juanes F. Sound the alarm: a meta-analysis on the effect of aquatic noise on fish behavior and physiology. Glob Change Biol. 2018;24(7):3105–16. https://doi.org/10.1111/gcb.14106.
Cardoso GC. Nesting and acoustic ecology, but not phylogeny, influence passerine urban tolerance. Glob Change Biol. 2014;20(3):803–10. https://doi.org/10.1111/gcb.12410.
Francis CD. Vocal traits and diet explain avian sensitivities to anthropogenic noise. Glob Change Biol. 2015;21(5):1809–20. https://doi.org/10.1111/gcb.12862.
Cardoso GC, Hu Y, Francis CD. The comparative evidence for urban species sorting by anthropogenic noise. R Soc Open Sci. 2018;5(2):172059. https://doi.org/10.1098/rsos.172059.
Fletcher JL, Busnel RG. Effects of noise on wildlife. Academic Press; 1978. https://doi.org/10.1016/B978-0-12-260550-5.X5001-9.
Richardson WJ, Greene JCR, Malme CI, Thomson DH. Marine mammals and noise. Cambridge: Academic Press; 2013. ISBN 978-0-12-588441-9.
Brumm H, editor. Animal communication and noise. Berlin, Heidelberg: Springer; 2013. https://doi.org/10.1007/978-3-642-41494-7.
Popper AN, Hawkins A, editors. The effects of noise on aquatic life. New York: Springer; 2012. https://doi.org/10.1007/978-1-4419-7311-5.
Popper AN, Hawkins A, editors. The effects of noise on aquatic life II. New York: Springer; 2016. https://doi.org/10.1007/978-1-4939-2981-8.
Slabbekoorn H, Dooling RJ, Popper AN, Fay RR, editors. Effects of anthropogenic noise on animals. New York: Springer; 2018. https://doi.org/10.1007/978-1-4939-8574-6.
Hawkins AD, Popper AN. Effects of man-made sound on fishes. In: Slabbekoorn H, Dooling RJ, Popper AN, Fay RR, editors. Effects of anthropogenic noise on animals. New York: Springer; 2018. p. 145–77. https://doi.org/10.1007/978-1-4939-8574-6_6.
Simmons AM, Narins PM. Effects of anthropogenic noise on amphibians and reptiles. In: Slabbekoorn H, Dooling RJ, Popper AN, Fay RR, editors. Effects of anthropogenic noise on animals. New York: Springer; 2018. p. 179–208. https://doi.org/10.1007/978-1-4939-8574-6_7.
Halfwerk W, Lohr B, Slabbekoorn H. Impact of man-made sound on birds and their songs. In: Slabbekoorn H, Dooling RJ, Popper AN, Fay RR, editors. Effects of anthropogenic noise on animals. New York: Springer; 2018. p. 209–42. https://doi.org/10.1007/978-1-4939-8574-6_8.
Erbe C, Dunlop R, Dolman S. Effects of noise on marine mammals. In: Slabbekoorn H, Dooling RJ, Popper AN, Fay RR, editors. Effects of anthropogenic noise on animals. New York: Springer; 2018. p. 277–309. https://doi.org/10.1007/978-1-4939-8574-6_10.
Borda-de-Água L, Barrientos R, Beja P, Pereira HM, editors. Railway ecology. Cham: Springer; 2017. https://doi.org/10.1007/978-3-319-57496-7.
Gil D, Brumm H. Acoustic communication in the urban environment: patterns, mechanisms, and potential consequences of avian song adjustments. In: Gil D, Brumm H, editors. Avian urban ecology: behavioural and physiological adaptations. Oxford: Oxford University Press; 2014. https://doi.org/10.1093/acprof:osobl/9780199661572.003.0006.
Halfwek W, Slabbekoorn H. The impact of anthropogenic noise on avian communication and fitness. In: Gil D, Brumm H, editors. Avian urban ecology: behavioural and physiological adaptations. Oxford: Oxford University Press; 2014. https://doi.org/10.1093/acprof:osobl/9780199661572.003.0007.
Parris KM. Ecological impacts of road noise and options for mitigation. In: van der Ree R, Smith DJ, Grilo C, editors. Handbook of road ecology. Chichester: Wiley; 2015. p. 151–8. https://doi.org/10.1002/9781118568170.ch19.
Abbott I, Berthinussen A, Stone E, Boonman M, Melber M, Altringham J. Bats and roads. In: Handbook of road ecology. 2015. p. 290–9. ISBN 978-1-118-56818-7.
Ortega CP. Effects of noise pollution on birds: a brief review of our knowledge. In: Ornithological monographs, vol. 74. 2012. p. 6–22. https://doi.org/10.1525/om.2012.74.1.6.
Francis CD et al. Behavioral responses by two songbirds to natural-gas-well compressor noise. In: Ornithological monographs, vol. 74. 2012. p. 36–46. https://doi.org/10.1525/om.2012.74.1.36.
Blickley JL, Patricelli GL. Potential acoustic masking of Greater Sage-Grouse (Centrocercus urophasianus) display components by chronic industrial noise. In: Ornithological monographs, vol. 74. 2012. p. 23–35. https://doi.org/10.1525/om.2012.74.1.23.
Harding HR, Gordon TAC, Eastcott E, Simpson SD, Radford AN. Causes and consequences of intraspecific variation in animal responses to anthropogenic noise. Behav Ecol. 2019;30(6):1501–11. https://doi.org/10.1093/beheco/arz114.
Erbe C, Marley SA, Schoeman RP, Smith JN, Trigg LE, Embling CB. The effects of ship noise on marine mammals—a review. Front Mar Sci. 2019;6:606. https://doi.org/10.3389/fmars.2019.00606.
Raboin M, Elias DO. Anthropogenic noise and the bioacoustics of terrestrial invertebrates. J Exp Biol. 2019;222(12):jeb178749. https://doi.org/10.1242/jeb.178749.
Popper AN, Hawkins AD. An overview of fish bioacoustics and the impacts of anthropogenic sounds on fishes. J Fish Biol. 2019;94(5):692–713. https://doi.org/10.1111/jfb.13948.
Davies TW, Smyth T. Why artificial light at night should be a focus for global change research in the 21st century. Glob Change Biol. 2018;24(3):872–82. https://doi.org/10.1111/gcb.13927.
Kendall LS, Širović A, Roth EH. Effects of construction noise on the cook inlet beluga whale (Delphinapterus leucas) vocal behavior. Can Acoust. 2013;41(3):3–14.
Chosy J, Wilson M, Santymire R. Behavioral and physiological responses in felids to exhibit construction: felid response to exhibit construction. Zoo Biol. 2014;33(4):267–74. https://doi.org/10.1002/zoo.21142.
Espmark Y. Behaviour reactions of reindeer exposed to sonic booms. Deer. 1972;2(7):800–2.
Tressler J, Smotherman MS. Context-dependent effects of noise on echolocation pulse characteristics in free-tailed bats. J Comp Physiol A. 2009;195:923–34. https://doi.org/10.1007/s00359-009-0468-x.
Plassmann W, Kadel M. Low-frequency sensitivity in a gerbilline rodent, Pachyuromys duprasi. Brain Behav Evol. 1991;38:115–26. https://doi.org/10.1159/000114382.
Böhm M, Collen B, Baillie JEM, Bowles P, Chanson J, Cox N, et al. The conservation status of the world’s reptiles. Biol Conserv. 2013;157:372–85. https://doi.org/10.1016/j.biocon.2012.07.015.
Stuart SN, Chanson JS, Cox NA, Young BE, Rodrigues ASL, Fischman DL, et al. Status and trends of amphibian declines and extinctions worldwide. Science. 2004;306(5702):1783–6. https://doi.org/10.1126/science.1103538.
Bee MA. Selective phonotaxis by male wood frogs (Rana sylvatica) to the sound of a chorus. Behav Ecol Sociobiol. 2007;61(6):955–66. https://doi.org/10.1007/s00265-006-0324-8.
Römer H, Schmidt AKD. Directional hearing in insects with internally coupled ears. Biol Cybern. 2016;110(4–5):247–54. https://doi.org/10.1007/s00422-015-0672-4.
Christensen CB, Christensen-Dalsgaard J, Brandt C, Madsen PT. Hearing with an atympanic ear: good vibration and poor sound-pressure detection in the royal python, Python regius. J Exp Biol. 2012;215(2):331–42. https://doi.org/10.1242/jeb.062539.
Shamble PS, Menda G, Golden JR, Nitzany EI, Walden K, Beatus T, et al. Airborne acoustic perception by a jumping spider. Curr Biol. 2016;26(21):2913–20. https://doi.org/10.1016/j.cub.2016.08.041.
Chapuis L, Kerr CC, Collin SP, Hart NS, Sanders KL. Underwater hearing in sea snakes (Hydrophiinae): first evidence of auditory evoked potential thresholds. J Exp Biol. 2019;222(14):jeb198184. https://doi.org/10.1242/jeb.198184.
Mortimer B. A spider’s vibration landscape: adaptations to promote vibrational information transfer in orb webs. Integr Comp Biol. 2019;59(6):1636–45. https://doi.org/10.1093/icb/icz043.
Bolle LJ, de Jong CAF, Bierman SM, van Beek PJG, van Keeken OA, Wessels PW, et al. Common sole larvae survive high levels of pile-driving sound in controlled exposure experiments. PLoS ONE. 2012;7(3):e33052. https://doi.org/10.1371/journal.pone.0033052.
Heide-Jørgensen MP, Hansen RG, Westdal K, Reeves RR, Mosbech A. Narwhals and seismic exploration: is seismic noise increasing the risk of ice entrapments? Biol Conserv. 2013;158:50–4. https://doi.org/10.1016/j.biocon.2012.08.005.
Larsen JK, Guillemette M. Effects of wind turbines on flight behaviour of wintering common eiders: implications for habitat use and collision risk: wind turbines and wintering common eiders. J Appl Ecol. 2007;44(3):516–22. https://doi.org/10.1111/j.1365-2664.2007.01303.x.
Alvarez-Berríos N, Campos-Cerqueira M, Hernández-Serna A, Amanda Delgado CJ, Román-Dañobeytia F, Aide TM. Impacts of small-scale gold mining on birds and anurans near the Tambopata Natural Reserve, Peru, Assessed using passive acoustic monitoring. Trop Conserv Sci. 2016;9(2):832–51. https://doi.org/10.1177/194008291600900216.
Sutter GC, Davis SK, Skiffington JC, Keating LM, Pittaway LA. Nesting behaviour and reproductive success of sprague’s pipit (Anthus spragueii) and vesper sparrow (Pooecetes gramineus) during pipeline construction. Can Field Nat. 2016;130(2):99–109. https://doi.org/10.22621/cfn.v130i2.1833.
Culik B, Koschinski S, Tregenza N, Ellis G. Reactions of harbor porpoises Phocoena phocoena and herring Clupea harengus to acoustic alarms. Mar Ecol Prog Ser. 2001;211:255–60. https://doi.org/10.3354/meps211255.
Watkins WA, Schevill WE. Sperm whales (Physeter catodon) react to pingers. Deep Sea Res Oceanogr Abstr. 1975;22(3):123–9. https://doi.org/10.1016/0011-7471(75)90052-2.
Finneran JJ, Carder DA, Schlundt CE, Ridgway SH. Temporary threshold shift in bottlenose dolphins (Tursiops truncatus) exposed to mid-frequency tonesa). J Acoust Soc Am. 2005;118(2696):10. https://doi.org/10.1121/1.2032087.
Richard JD. Fish attraction with pulsed low-frequency sound. J Fish Res Bd Can. 1968;25(7):1441–52. https://doi.org/10.1139/f68-125.
Fride E, Weinstock M. Alterations in behavioral and striatal dopamine asymmetries induced by prenatal stress. Pharmacol Biochem Behav. 1989;32(2):425–30. https://doi.org/10.1016/0091-3057(89)90174-3.
Woolway EE, Goodenough AE. Effects of visitor numbers on captive European red squirrels (Sciurus vulgaris) and impacts on visitor experience. Zoo Biol. 2017;36(2):112–9. https://doi.org/10.1002/zoo.21357.
Shirley MDF, Armitage VL, Barden TL, Gough M, Lurz PWW, Oatway DE, et al. Assessing the impact of a music festival on the emergence behaviour of a breeding colony of Daubenton’s bats (Myotis daubentonii). J Zool. 2001;254(3):367–73. https://doi.org/10.1017/S0952836901000863.
Graham AL, Cooke SJ. The effects of noise disturbance from various recreational boating activities common to inland waters on the cardiac physiology of a freshwater fish, the largemouth bass (Micropterus salmoides). Aquat Conserv Mar Freshw Ecosyst. 2008;18(7):1315–24. https://doi.org/10.1002/aqc.941.
Price M, Lill A. Behavioural responses of breeding Silver Gulls to tourist traffic. Aust Zool. 2011;35(3):810–21. https://doi.org/10.7882/AZ.2011.032.
Payne CJ, Jessop TS, Guay P-J, Johnstone M, Feore M, Mulder RA. Population, behavioural and physiological responses of an urban population of black swans to an intense annual noise event. PLoS ONE. 2012;7:e45014. https://doi.org/10.1371/journal.pone.0045014.
Rossi-Santos MR. Whale-watching noise effects on the behavior of humpback whales (Megaptera novaeangliae) in the Brazilian breeding ground. In: Fourth international conference on the effects of noise on aquatic life Dublin, Ireland 10–16 July 2016. Proc. Mtgs. Acoust. 2016, vol. 27, 040003. https://doi.org/10.1121/2.0000271.
Mulero-Pázmány M, Jenni-Eiermann S, Strebel N, Sattler T, Negro JJ, Tablado Z. Unmanned aircraft systems as a new source of disturbance for wildlife: a systematic review. PLoS ONE. 2017;12:e0178448. https://doi.org/10.1371/journal.pone.0178448.
Marley SA, Salgado Kent CP, Erbe C, Parnum IM. Effects of vessel traffic and underwater noise on the movement, behaviour and vocalisations of bottlenose dolphins in an urbanised estuary. Sci Rep. 2017;7:13437. https://doi.org/10.1038/s41598-017-13252-z.
Senzaki M, Yamaura Y, Francis CD, Nakamura F. Traffic noise reduces foraging efficiency in wild owls. Sci Rep. 2016;6:30602. https://doi.org/10.1038/srep30602.
Gomes DGE, Page RA, Geipel I, Taylor RC, Ryan MJ, Halfwerk W. Bats perceptually weight prey cues across sensory systems when hunting in noise. Science. 2016;353(6305):1277–80. https://doi.org/10.1126/science.aaf7934.
Bruintjes R, Radford AN. Context-dependent impacts of anthropogenic noise on individual and social behaviour in a cooperatively breeding fish. Anim Behav. 2013;85(6):1343–9. https://doi.org/10.1016/j.anbehav.2013.03.025.
Phillips S. Aversive behaviour by koalas (Phascolarctos cinereus) during the course of a music festival in northern New South Wales, Australia. Aust Mammal. 2016;38(2):158–63. https://doi.org/10.1071/AM15006.
Owen MA, Swaisgood RR, Czekala NM, Steinman K, Lindburg DG. Monitoring stress in captive giant pandas (Ailuropoda melanoleuca): behavioral and hormonal responses to ambient noise. Zoo Biol. 2004;23(2):147–64. https://doi.org/10.1002/zoo.10124.
Borneman TE, Rose ET, Simons TR. Minimal changes in heart rate of incubating American Oystercatchers (Haematopus palliatus) in response to human activity. The Condor. 2014;116(3):493–503. https://doi.org/10.1650/CONDOR-14-48.1.
Buscaino G, Filiciotto F, Buffa G, Bellante A, Stefano VD, Assenza A, et al. Impact of an acoustic stimulus on the motility and blood parameters of European sea bass (Dicentrarchus labrax L.) and gilthead sea bream (Sparus aurata L.). Mar Environ Res. 2010;69(3):136–42. https://doi.org/10.1016/j.marenvres.2009.09.004.
Li ZZ, Burke WH. Influence of 12 hours of sound stimuli on gonad development and plasma luteinizing hormone in Japanese Quail (Cotumix coturnix japonica) exposed to 6 hours of daily light. Poult Sci. 1987;66(6):1045–52. https://doi.org/10.3382/ps.0661045.
Malhi Y, Franklin J, Seddon N, Solan M, Turner MG, Field CB, et al. Climate change and ecosystems: threats, opportunities and solutions. Phil Trans R Soc B. 2020;375(1794):20190104. https://doi.org/10.1098/rstb.2019.0104.
Van der Biest K, Meire P, Schellekens T, D’hondt B, Bonte D, Vanagt T, et al. Aligning biodiversity conservation and ecosystem services in spatial planning: focus on ecosystem processes. Sci Tot Environ. 2020;712:136350. https://doi.org/10.1016/j.scitotenv.2019.136350.
Chen HL, Koprowski JL. Animal occurrence and space use change in the landscape of anthropogenic noise. Biol Conserv. 2015;192:315–22. https://doi.org/10.1016/j.biocon.2015.10.003.
Nabi G, McLaughlin RW, Hao Y, Wang K, Zeng X, Khan S, et al. The possible effects of anthropogenic acoustic pollution on marine mammals’ reproduction: an emerging threat to animal extinction. Environ Sci Pollut Res. 2018;25:19338–45. https://doi.org/10.1007/s11356-018-2208-7.
European Commission. Communication from the Commission to the European Parliament, the Council, the European Economic and Social Committee and the Committee of the Regions. EU Biodiversity Strategy for 2030. Bringing nature back into our lives. COM(2020) 380 final, Brussels, 20 May 20 2020. https://ec.europa.eu/info/sites/info/files/communication-annex-eu-biodiversity-strategy-2030_en.pdf.
Bougnec AL. Mémoire de première année de Master Gestion territoriale du développement durable. 2018. p. 79.
Tyack P, Gordon J, Thompson D. Controlled exposure experiments to determine the effects of noise on marine mammals. Mar Technol Soc J. 2003;37(4):41–53. https://doi.org/10.4031/002533203787537087.
Smokorowski KE, Randall RG. Cautions on using the before-after-control-impact design in environmental effects monitoring programs. FACETS. 2017;2:212–32. https://doi.org/10.1139/facets-2016-0058.
De Palma A, Sanchez-Ortiz K, Martin PA, Chadwick A, Gilbert G, Bates AE, et al. Challenges with inferring how land-use affects terrestrial biodiversity: study design, time, space and synthesis. In: Advances in ecological research. Elsevier; 2018. p. 163–99. https://doi.org/10.1016/bs.aecr.2017.12.004.
Christie AP, Amano T, Martin PA, Shackelford GE, Simmons BI, Sutherland WJ. Simple study designs in ecology produce inaccurate estimates of biodiversity responses. J Appl Ecol. 2019;56(12):2742–54. https://doi.org/10.1111/1365-2664.13499.
Faulkner RC, Farcas A, Merchant ND. Guiding principles for assessing the impact of underwater noise. J Appl Ecol. 2018;55(6):2531–6. https://doi.org/10.1111/1365-2664.13161.
Wade L, Whitehead H, Weilgart L. Conflict of interest in research on anthropogenic noise and marine mammals: does funding bias conclusions? Mar Policy. 2010;34(2):320–7. https://doi.org/10.1016/j.marpol.2009.08.009.
Stebbins WG, Moody DB, Serafin JV. Some principal issues in the analysis of noise effects on hearing in experimental animals. Am J Otolaryngol. 1982;3(4):295–304. https://doi.org/10.1016/S0196-0709(82)80069-0.
Acknowledgements
The map team thanks:
Dakis-Yaoba Ouédraogo (MNHN) and Yorick Reyjol (OFB) for providing comments on earlier versions of the manuscript;
Marc Morvan, Magali Morvan and Benoît Pichet from the library of the National Museum of natural History for their help during the pdf search;
All the institutions that transmitted full-texts to us during the pdf search, namely the library of the “Arts-et-Métiers” (Isabelle FERAL), the library of the “Ecole de Médecine” (Isabelle Beaulande), the library of the “Maison des Sciences de l’Homme” (Amélie Saint-Marc), the library of the “École Polytechnique” (Claire Vandermeersch), the library of “Sorbonne Université” (Isabelle Russo and Peggy Bassié), the library of “Paris 13 Villetaneuse”, ZeFactory ARTELIA (Magalie Rambaudi);
all the organizations that relayed our call for literature through their websites or mailing lists, namely the “Centre de ressources Trame verte et bleue”, the IENE, the ITTECOP;
everyone who transmitted literature to us during the call, namely Vital Azambourg (MNHN), Ludivine Boursier (FRB), Fabien Claireau (MNHN), Patricia Detry (CEREMA), Cindy Fournier (MNHN), Philippe Goulletquer (IFREMER), Aurelie Goutte, Anne Guerrero (SNCF Réseau), Eric Guinard (CEREMA), Heinrich Reck, Antonin Le Bougnec (PNR Morbihan), Barbara Livoreil (FRB), Sylvain Moulherat (TerrOïko), Dakis-Yaoba Ouédraogo (MNHN), Marc Thauront (Ecosphère), Dennis Wansink (BUWA);
Barbara Livoreil (FRB) for her help with the protocol of this map;
Cary Bartsch for his proofreading and corrections concerning the English language.
Funding
This research was undertaken as current work of UMS Patrimoine Naturel, a joint research unit funded by the French Biodiversity Agency (OFB), the National Scientific Research Center (CNRS) and the National Museum of Natural History (MNHN), on behalf of the French Ecology Ministry.
Author information
Authors and Affiliations
Contributions
RS originated the idea of the systematic map and was the scientific coordinator of the map. RS conducted the first scoping stage. FF participated in the search strategy. RS, SV and AD screened the articles. RS searched the full-texts with help from FF and CL. OR, AD and RS extracted the metadata. RS analysed, interpreted and discussed the results, helped by the rest of the team. RS wrote the draft of the manuscript and the rest of the team contributed to it. All authors read and approved the final manuscript.
Corresponding author
Ethics declarations
Ethics approval and consent to participate
Not applicable.
Consent for publication
Not applicable.
Competing interest
The authors declare that they have no competing interests.
Additional information
Publisher's Note
Springer Nature remains neutral with regard to jurisdictional claims in published maps and institutional affiliations.
Supplementary information
Additional file 1.
ROSES form.
Additional file 2.
Search strategy.
Additional file 3.
Key reviews from which bibliographic references were extracted.
Additional file 4.
Comprehensiveness of databases and search engines.
Additional file 5.
Detailed screening process.
Additional file 6.
Full flow diagram.
Additional file 7.
Inclusion/exclusion decisions during the three screening stages and extraction of rejected full-texts.
Additional file 8.
Accepted full-texts published in 2019–2020.
Additional file 9.
Systematic map database.
Additional file 10.
Information on standardized evidence syntheses.
Additional file 11.
List and statistics on missing full-texts.
Additional file 12.
Rejected full-texts (language exclusion).
Rights and permissions
Open Access This article is licensed under a Creative Commons Attribution 4.0 International License, which permits use, sharing, adaptation, distribution and reproduction in any medium or format, as long as you give appropriate credit to the original author(s) and the source, provide a link to the Creative Commons licence, and indicate if changes were made. The images or other third party material in this article are included in the article's Creative Commons licence, unless indicated otherwise in a credit line to the material. If material is not included in the article's Creative Commons licence and your intended use is not permitted by statutory regulation or exceeds the permitted use, you will need to obtain permission directly from the copyright holder. To view a copy of this licence, visit http://creativecommons.org/licenses/by/4.0/. The Creative Commons Public Domain Dedication waiver (http://creativecommons.org/publicdomain/zero/1.0/) applies to the data made available in this article, unless otherwise stated in a credit line to the data.
About this article

Cite this article
Sordello, R., Ratel, O., Flamerie De Lachapelle, F. et al. Evidence of the impact of noise pollution on biodiversity: a systematic map. Environ Evid 9, 20 (2020). https://doi.org/10.1186/s13750-020-00202-y
Received:
Accepted:
Published:
DOI: https://doi.org/10.1186/s13750-020-00202-y