
Abstract
Background
Type 1 Chiari malformation (CM-I) has been historically defined by cerebellar tonsillar position (TP) greater than 3–5 mm below the foramen magnum (FM). Often, the radiographic findings are highly variable, which may influence the clinical course and patient outcome. In this study, we evaluate the inter-operator reliability (reproducibility) of MRI-based measurement of TP in CM-I patients and healthy controls.
Methods
Thirty-three T2-weighted MRI sets were obtained for 23 CM-I patients (11 symptomatic and 12 asymptomatic) and 10 healthy controls. TP inferior to the FM was measured in the mid-sagittal plane by seven expert operators with reference to McRae’s line. Overall agreement between the operators was quantified by intraclass correlation coefficient (ICC).
Results
The mean and standard deviation of cerebellar TP measurements for asymptomatic (CM-Ia) and symptomatic (CM-Is) patients in mid-sagittal plane was 6.38 ± 2.19 and 9.57 ± 2.63 mm, respectively. TP measurements for healthy controls was 0.48 ± 2.88 mm. The average range of TP measurements for all data sets analyzed was 7.7 mm. Overall operator agreement for TP measurements was relatively high with an ICC of 0.83.
Conclusion
The results demonstrated a large average range (7.7 mm) of measurements among the seven expert operators and support that, if economically feasible, two radiologists should make independent measurements before radiologic diagnosis of CM-I and surgery is contemplated. In the future, an objective diagnostic parameter for CM-I that utilizes automated algorithms and results in smaller inter-operator variation may improve patient selection.
Background
Type I Chiari malformation (CM-I) is often defined as caudal descent or herniation of the cerebellar tonsil(s) into the spinal canal > 3–5 mm beyond the basion-opisthion line (McRae’s line) (Fig. 1) [1,2,3,4,5,6,7,8,9]. Reliability of TP measurements across operators has not been assessed in detail, however, Moore et al. observed reduced variation and higher correlation with TP measurements with reference to the 1st cervical vertebra (C1) arch landmark [10]. Tonsillar position (TP) is regarded as a relatively straightforward measurement for physicians to use in diagnosis or research of CM-I. TP is often measured with reference to McRae’s line in the mid-sagittal plane. It also has been proposed to perform the measurement in the coronal plane, since both cerebellar TPs can be observed together and have been shown sometimes to be asymmetric in CM-I patients [6, 11,12,13].

3D multi-planar reconstruction of tonsillar position (TP, red) morphometric measurement for a T2-weighted MRI of subject 27 in this study: A mid-sagittal plane with McRae’s line shown as a violet line. B Coronal plane with orientation of McRae’s line shown as violet line. C Axial plane visualization through McRae’s line showing partial obstruction of cerebrospinal fluid (CSF) space around the spinal cord
The definition of CM-I based on TP has come under scrutiny since several studies employing quantitative measurements have shown that TP does not correlate with the severity of symptoms and the degree of cerebellar TP below the foramen magnum is not heritable in multiplex families with CM-I patients [14,15,16,17]. Patients with pronounced TP may present clinically asymptomatic, while patients with minimal or no TP may present with marked symptomatology. With the increased use of MRI, the incidental discovery of asymptomatic patients with TP greater than 5 mm below the foramen magnum is likely to increase [18]. Smith et al. showed that 1, 2, and 3% of adult male, adult female, and pediatric populations, respectively, have TP greater than 5 mm below the FM demonstrating that the cerebellar TP follows a normal distribution and varies significantly by age [6]. In contrast to these cases, there are also patients who present with clinical symptomatology consistent with CM-I without the established radiographic criteria, and consequently, are not considered a CM-I patient by definition. In these cases, the absence of CM-I diagnosis leads to lack of evaluation for surgical treatment that may alleviate symptoms.
Given the importance placed on TP in the diagnosis of CM-I in modern practice, it is crucially important to evaluate TP measurement reliability. The aim of this study was to quantify the inter-operator reliability for the cerebellar tonsillar position among experienced operators, thereby aiding in the decision-making process for physicians and researchers working to diagnose and treat patients with CM-I.
Materials and methods
Ethics statement
This study was carried out in accordance with the Declaration of Helsinki (1989) and MRI data acquisition was performed at the University of Wisconsin (UW), the Cleveland Clinic Foundation (CCF), and Emory University (EU). The study was approved by the institutional review board of each institution (IRB #20130226). Prior to scanning, written informed consent was obtained from all subjects. All MRI data were anonymized before being transferred to operators for analysis.
In vivo MR image acquisition and post-processing morphometric quantification
Axial T2-weighted MR images were obtained without contrast on a 1.5 or 3.0 T scanner with isotropic resolution ranging from 0.750 to 0.875 mm. Image field of view covered the entire craniovertebral junction, upper cervical spine and cerebellum. In total, 33 data sets were used and included 10 healthy controls, with no known neurological or cardiovascular disorders or trauma, and 23 CM-I patients. 12 of the CM-I patients were considered asymptomatic (CM-Ia). 11 CM-I patients were considered symptomatic (CM-Is). The neurosurgeon (MGL or BJI) made a “gold standard judgment” to classify patients as symptomatic based on the presence of sufficiently severe neurological symptoms to warrant corrective cranial/cervical decompression surgery [19]. Patients were classified as asymptomatic that had only mild symptoms or symptoms that were not attributable to tonsillar ectopia and were not recommended for decompression surgery. Although the patients in this group can have symptoms, they are commonly referred to by neurosurgeons as asymptomatic. Patients were excluded that had secondary causes of tonsillar ectopia, such as hydrocephalus, had undergone previous decompression surgery or had implanted cerebrospinal fluid (CSF) shunts.
The 33 MRI data sets were provided to a group of seven expert operators with previous experience (neurosurgery, neurology, and radiology) and previous training in TP measurement. Operators were blinded to the subject status. All operators in the study were male with an average age of 34 years old and with an average of 4.5 years since completing an MD or PhD degree(s). Measurement order for the 33 data sets was randomized for each operator. TP position was measured with respect to McRae’s line using each operator’s preferred software to maintain familiarity and intra-operator consistency. Six different software packages were used to perform TP measurements: Siemens Syngo (Siemens Healthcare GmbH, Erlangen, Germany), McKesson PACS-Horizon Imaging (McKesson, San Francisco, CA, USA), Philips ViewForum (Philips, Amsterdam, Netherlands), RadiAnt (RadiAnt, Poznan, Poland), OsiriX (Pixmeo, Geneva, Switzerland), GE Centricity PACS (General Electric Corp, Boston, USA) and ImageJ [20]. A 3D stack of images was supplied to each operator. For each MRI TP measurement, each operator followed a set procedure: re-format the 3D axial image volume in the sagittal plane, select the mid-sagittal image slice with the maximum caudal extent of tonsillar position and mark the foramen magnum by drawing a line from the basion to the opisthion to most consistently approximate McRae’s line. Craniocaudal distance for each patient was measured to the point of maximal decent perpendicular to McRae’s line. Negative values were reported when TP was measured superior to McRae’s line, and positive values were reported when TP was located inferior to McRae’s line.
Statistical analysis
Descriptive statistics of TP measurement for 33 MRI data sets for the seven operators were calculated for healthy controls, asymptomatic CM-I patients (CM-Ia), and symptomatic CM-I patients (CM-Is). Intraclass correlation (ICC) was assessed by estimating the level of inter-operator agreement for each MR image using a two-way, mixed model (three levels of patients and two levels of symptom type) [21]. We used patient number as a random effect and operator number as a fixed effect to calculate intra-class correlation (ICC) with a 95% confidence interval (CI) [21, 22]. The ICC was calculated to include all seven operators, as reported. We also performed an additional calculation by including only two operators to verify operator reliability as the number of operators increased. Data were further analyzed for a false negative of CM-I patients in which at least one operator reported a TP value of < 3 mm below the FM, when other operators clearly measured > 5 mm TP below McRae’s line. False positives for the control groups was defined when at least one operator measured TP being > 5 mm below McRae’s line when other operators measured < 3 mm. All statistical analyses were performed using Microsoft Excel for Mac (Version 2016, Seattle, WA) and R (Version 3.4.0, Vienna, Austria).
Results
Descriptive statistics for 33 sagittal MRI TP measurements (mm) as measured by seven expert operators are listed in Tables 1 and 2. Table 1 reports the result of seven operator’s measurements for all 33 subjects, Table 2 descriptively compares the overall measurements across seven operators and by subject group (CM-Ia, CM-Is, and control). TP mean ± standard deviation (SD) for all individuals was 5.66 ± 2.54 mm (Fig. 2). Mean of the maximum and minimum TP measurements for all subjects was 9.17 and 1.43 mm, respectively. The mean ± SD of cerebellar TP measurements for CM-Ia and CM-Is patients in mid-sagittal plane was 6.38 ± 2.19 and 9.57 ± 2.63 mm, respectively. Mean ± SD of cerebellar TP measurements for controls was 0.48 ± 2.88 mm. ICC obtained for all seven operators was 0.83 (95% CI 0.74–0.90, p < 0.001). When only the two most experienced operators were considered in the analysis, the ICC was 0.84 (95% CI 0.70–0.92, p < 0.001). ICC values over 0.75 are considered to have excellent clinical significance [23].

Mean ± 1SD of N = 33 tonsillar position measurements for the seven operators (green = control, red = asymptomatic CM-I patient, blue = symptomatic CM-I patient). Shaded horizontal rectangle indicates TP 3–5 mm
The average range of TP measurements for all data sets analyzed was 7.7 mm. TP SD and range did not show a statistically significant trend with increasing mean TP measurement obtained for the seven operators (Figs. 3, 4). The range of mean TP ranges (grand range) decreased when the average of TP was increased: for subjects with < 5 mm TP, the grand range was 9.40 mm, however, for subjects with TP > 5 mm, the grand range was 6.60 mm. Likewise, the range of standard deviations also decreased with increasing TP. For TP < 5 mm, the range of standard deviations was 2.50 mm, while the range of standard deviations for TP > 5 mm decreased to 2.37 mm.

Relation of average tonsillar descent measurement and standard deviation of the measurement for the seven operators. Standard deviation shows no statistical correlation with increase in tonsillar position (R2 = 0.004)

Relation of average tonsillar descent measurement and maximum difference in tonsillar position measurement between the seven operators. Difference in measurements shows slight increase as tonsillar position increases
In this study, false negatives for CM-I diagnosis were documented when at least one operator reported a TP value of less than 3 mm tonsillar herniation, when other operators clearly measured > 5 mm herniation below McRae’s line. By this definition, eight of the CM-I patients had false negative reports for eight out of 133 measurements. In other words, 6.0% of CM-I patients could have been considered “healthy” by at least one diagnostician when other operators would have radiographically categorized the individual with CM-I. Conversely, healthy controls, when the TP measurement was analyzed where at least one operator measured the TP as being > 5 mm below the FM in the control MRI studies, 8 out of 70 measurements (11.4%) were considered to meet the diagnostic criteria for CM-I (false positive). When the same analysis was repeated with at least two operators making a questionable measurement relative to the group, the number of questionable diagnoses was reduced to 1.5% false negatives for CM-I patients and 4.3% false positives for healthy controls.
Discussion
The current standard for the radiologic diagnosis of CM-I is based on a static MRI measurement of tonsillar descent 3–5 mm below the McRae line. This study quantifies the variability between seven operators measuring TP for a group of CM-I patients and controls with varying degree of TP relative to the foramen magnum. Overall operator agreement for TP measurements, as measured by ICC, were relatively high, yet there was still a high TP measurement range among expert operators (average TP measurement range of 7.7 mm). These results support that multiple operators should confirm a measurement before arriving at conclusive radiographic CM-I diagnosis.
Importance of reliability assessment
In the past, research in neuroradiology, neurology, and neurosurgery has examined the inter-rater reliability of operators making MRI measures [11, 24]. Inter-rater reliability allows researchers to quantify to the agreement of measurements made between two or more operators. In this study, the degree of precision for seven operators measuring tonsillar position were collated and analyzed. Many scenarios in the healthcare industry rely on multiple people to collect research or clinical laboratory data, thus it is critical for technologists to have a high degree of consistency when evaluating MR images. The question of consistency, or agreement among the individuals collecting data immediately arises due to the variability among human observers. However, for the TP measurement, there has been little evaluation of the error potential inherent in this diagnostic and its subsequent clinical impact in terms of accurate diagnoses. Moore’s robust assessment of TP measurements with respect to FM, C1, and C2 help to establish a better morphometric measurement for reducing inter-operator variation [10]. There are a number of statistics that have been used to measure intra-rater reliability. The results of this study were measured using the ICC two-way mixed model to account for random patients and fixed operators.
Significance of results on Chiari diagnosis
Our results show that just one standard deviation for TP measurements across CM-Ia, CM-Is, and controls is approximately ± 2–3 mm. It is possible that this may be a consequence of lack of attention in cases where TP is not extreme, or simply because a smaller mean TP measurement require a smaller standard deviation to be meaningfully accurate. This is important since a borderline CM-I case with 3 mm TP may easily tilt the diagnosis for an individual to be considered for treatment. The false negative rate for operators in this study was approximately 6.0%. The American Association of Neurological Surgeons estimated that approximately 11,000 CM-I patients received surgical treatment in 2007 and 20–40% of these surgeries do not resolve symptoms [25,26,27,28]. Conservatively estimating that 50% of patients being evaluated for Chiari undergo surgery implies there are more than 22,000 patients evaluated for Chiari each year. Applying a 6.0% false negative rate to this number yields a potential 1320 missed cases each year that are near the cutoff TP measurement and may not be referred for a detailed clinical assessment of CM-I symptoms.
Sources of TP measurement error
Morphometric quantification of TP has multiple potential sources of error and difficulty that include:
-
a.
MR image type (T1 or T2-weighted) and specific imaging settings such as resolution and slice spacing implemented across scanner system types.
-
b.
Selection of mid-sagittal slice and software capabilities for multi-planer reconstruction and placement of the mid-sagittal slice.
-
c.
Measurement technique applied to select the basion and opisthion that define McRae’s line.
-
d.
Difficulty to determine the grayscale threshold cutoff to define the anatomic landmarks including the cerebellar tonsil tip.
-
e.
Complex 3D FM bony morphology that impacts relative TP position with respect to the McRae’s line (Fig. 5).
Fig. 5 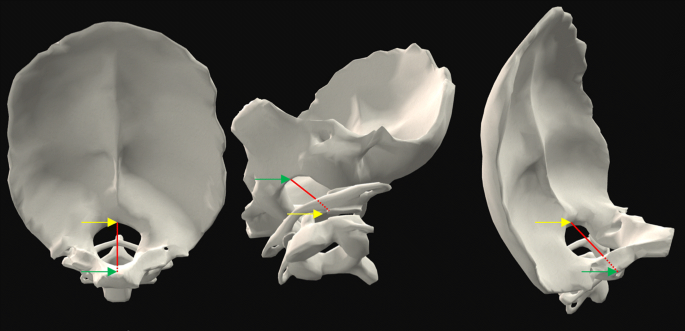
3D reconstruction of posterior cranial fossa and surrounding bony anatomy depicting McRae’s line (red line) drawn between the basion (green arrow) and opisthion (yellow arrow). Suboccipital region of the intracranial space (left), cervical-medullary junction (center and right) (images with permission from BioDigital Human Visualization Platform 1.1)
-
f.
Natural variation of TP due to neck orientation, posture and other factors [29].

To ensure operator consistency and help control for additional sources of error, high-resolution T2-weighted images were used in this study only. Approximately half of the operators indicated that they prefer T2-weighted images and half of the operators preferred T1-weighted images for making TP measurements. At present, there is no standard image type that is recommended for TP measurement. Image type may have an impact on TP reliability and should be investigated. To locate the mid-sagittal slice, a set of 3D high-resolution MR images is needed along with software capability for multi-planar reconstruction to correctly select optimal mid-sagittal slice location (Fig. 1). In many clinical settings, a high-resolution 3D MRI may not be possible to obtain, as it requires a longer scanning time. Thus, clinicians often make TP measurement based on imaging with larger slice thickness and with a mid-sagittal slice that is placed by the radiology technician. Due to these factors, we expect that typical TP measurements in the clinical workflow likely have a lower degree of reliability that that found in our study. FM also contributes an additional layer of difficulty to McRae’s line placement between the basion and opisthion. The bony structure at the basion and opisthion has an upward-shaped arch (Fig. 5). Due to the arch-shaped structure, mid-sagittal slice selection will directly impact the location of the basion and opisthion and thereby impact the TP relative to McRae’s line. Note also, invasive surgical treatment further complicates TP measurement by removing part of the reference frame for recreating McRae’s line (opisthion is removed in decompression). The surgical outcome can be difficult to correlate with TP measurement change because this feature is removed.
Need for an improved Chiari diagnostic
An increasing number of asymptomatic, minimally symptomatic, and doubtfully symptomatic patients are being diagnosed [30,31,32]. Widespread use of MRI has shown that 1–4% of the US population has radiographic indication of CM-I [6, 33, 34]. However, less than 1 in 30 of these people are regarded as CM-I patients [35]. If left untreated, CM-I can result in CNS damage, especially if the patient develops syringomyelia and resultant neurological deficits. The leading CM-I treatment is a highly invasive brain surgery with a lack of consensus for the “best practice” in surgical techniques [32, 36]. A principal concern within the medical community is that of patients receiving unnecessary operations, specifically if a patient does not meet the diagnostic criteria for the diagnosis. It is imperative that diagnostic criteria for CM-I are further refined to a point of minimizing unnecessary operations that not only have the potential to harm patients but also perpetuate the encouragement of inflated healthcare spending. In addition to the hundreds of millions of dollars in yearly health care costs attributed to CM-I, physical setbacks result in suffering and loss of economic productivity [36,37,38].
Impact of false negative and false positive radiographic diagnosis of Chiari
Anecdotally, some patients report being told that a herniation of 3–4 mm is not large enough to cause symptoms and are not referred for further Chiari evaluation (Conquer Chiari correspondence). Delays in diagnosis are further supported by data from the Conquer Chiari Patient Registry, which showed the average time to diagnosis for 768 patients was 3.4 years. The overall effect of delays in diagnosis on eventual patient outcomes is unclear, however it is likely that some patients are encountering significant roadblocks in the diagnostic process due, at least in part, to a lack of awareness of the potential error in measuring TP via MR imaging. The average false positive rate for the operators in this study was 11.4%; however, the rate of false positives (6.0% vs. 1.5%) and false negatives (11.4% vs. 4.3%) drop considerably by simply having one more individual measure the same MR image. Clinically, the impact of false positives is mitigated by subsequent opinion and diagnostic tests for the prevention of surgery. In the meantime, this over-diagnosis results in patient anxiety and subsequent testing that results in additional costs, risks, and anxiety. Ultimately, the TP measurement will be only one factor in a more thorough consideration of decompression surgery.
Diagnostic problem of asymptomatic Chiari
Based on comprehensive review of the literature, at least 50% of patients that come to medical doctors for CM-I assessment are considered asymptomatic [10, 12, 14, 17, 19, 24, 30, 33, 39, 40]. Increasing use of MRI has revealed that large tonsillar descent can be accompanied by no symptoms and vice versa [2, 15, 41]. Speer et al. estimated the prevalence of CM-I to be 200,000 persons, a value less than 0.06% of the United States population, but as already mentioned, more recent studies indicate that upwards of 1–4% of the population may meet the diagnostic criteria for anatomic CM-I [6, 34, 42, 43]. More specifically, recent radiological findings indicate that 1% of adult male, 2% of adult female, and 3% of pediatric population meet the radiographic diagnosis of CM-I [33]. Thus, CM-I prevalence is upwards of two orders of magnitude less than the radiological findings of tonsillar descent [19]. It is clear that additional diagnostic measures or diagnostic methods such as machine learning are needed to accurately detect CM-I and thereby aid in the decision of treatment options [40, 44]. In addition to static morphometric analysis, there is a need for dynamic MRI-based methods that identify symptomatic CM-I and correspond to severity of symptoms. Some proposed measurement methods include phase-contrast MR imaging to quantify CSF velocities [9, 45,46,47,48,49,50,51], time-slip or STAMP MRI methods [52], and cardiac-related neural tissue motion [53,55,56,57,57].
Limitations
The principle limitation in our work is that each operator used different software packages to perform the measurements. Also, the trained expert operators had varying degree of experience with radiographic measurement of TP. Differences in operator training could contribute to variation in TP measurement. Furthermore, only seven operators made the measurements. It would be beneficial to check consistency of results across a greater number of operators and for various operator cohorts with identical previous training and experience. We did not check measurement consistency between software programs since it is expected that different software is used in daily practice across clinical centers and operators. The accuracy and resolution of software could be different and influence the measurement result. Our aim was not to analyze the reliability of individual software packages. Our primary goal was to capture a snapshot of clinically applied measurements as one may experience in day-to-day activities. We feel that it is reasonable to assume natural variation in training level and software used for the diagnosis and treatment of CM-I across centers.
Conclusion
These results demonstrate a high degree of variability in TP measurement among expert operators and support that, if economically feasible, two radiologists should make independent measurements before the radiologic diagnosis of CM-I and surgery is contemplated. An objective diagnostic parameter is needed for use with traditional diagnostic methods that more clearly predicts diagnosis and symptomatology, as well as reducing inter-operator variation across imaging centers.
Abbreviations
- C1:
-
1st cervical vertebra
- CI:
-
confidence interval
- CM-Ia:
-
asymptomatic Chiari malformation type I
- CM-Is:
-
symptomatic Chiari malformation type I
- CM-I:
-
Chiari malformation type I
- CSF:
-
cerebrospinal fluid
- FM:
-
foramen magnum
- ICC:
-
intraclass correlation coefficient
- IQR:
-
interquartile range
- SD:
-
standard deviation
- TP:
-
tonsillar position
References
Meadows J, Kraut M, Guarnieri M, Haroun RI, Carson BS. Asymptomatic Chiari type I malformations identified on magnetic resonance imaging. J Neurosurg. 2000;92(6):920–6 (Epub 2000/06/06).
Sekula RF Jr, Jannetta PJ, Casey KF, Marchan EM, Sekula LK, McCrady CS. Dimensions of the posterior fossa in patients symptomatic for Chiari I malformation but without cerebellar tonsillar descent. Cerebrospinal Fluid Res. 2005;2:11.
Milhorat TH, Chou MW, Trinidad EM, Kula RW, Mandell M, Wolpert C, et al. Chiari I malformation redefined: clinical and radiographic findings for 364 symptomatic patients. Neurosurgery. 1999;44(5):1005–17 (Epub 1999/05/08).
Elster AD, Chen MY. Chiari I malformations: clinical and radiologic reappraisal. Radiology. 1992;183(2):347–53 (Epub 1992/05/01).
Barkovich AJ, Wippold FJ, Sherman JL, Citrin CM. Significance of cerebellar tonsillar position on MR. AJNR Am J Neuroradiol. 1986;7(5):795–9 (Epub 1986/09/01).
Smith BW, Strahle J, Bapuraj JR, Muraszko KM, Garton HJ, Maher CO. Distribution of cerebellar tonsil position: implications for understanding Chiari malformation. J Neurosurg. 2013;119(3):812–9.
McRae DL. Bony abnormalities in the region of the foramen magnum: correlation of the anatomic and neurologic findings. Acta Radiol. 1953;40(2–3):335–54.
Aboulezz AO, Sartor K, Geyer CA, Gado MH. Position of cerebellar tonsils in the normal population and in patients with Chiari malformation: a quantitative approach with MR imaging. J Comput Assist Tomogr. 1985;9(6):1033–6 (Epub 1985/11/01).
Alperin N, Loftus JR, Oliu CJ, Bagci AM, Lee SH, Ertl-Wagner B, et al. Magnetic resonance imaging measures of posterior cranial fossa morphology and cerebrospinal fluid physiology in Chiari malformation type I. Neurosurgery. 2014;75(5):515–22 (discussion 22).
Moore AG, Gomez-Hassan D, Quint DJ, Garton HJ, Maher CO, Srinivasan A. Interobserver variation in cerebellar tonsillar tip localization: comparison of 3 different osseous landmarks on magnetic resonance imaging. J Comput Assist Tomogr. 2016;40(1):34–8 (Epub 2015/10/21).
John JP, Wang L, Moffitt AJ, Singh HK, Gado MH, Csernansky JG. Inter-rater reliability of manual segmentation of the superior, inferior and middle frontal gyri. Psychiatry Res. 2006;148(2–3):151–63.
Deng X, Wang K, Wu L, Yang C, Yang T, Zhao L, et al. Asymmetry of tonsillar ectopia, syringomyelia and clinical manifestations in adult Chiari I malformation. Acta Neurochir. 2014;156(4):715–22 (Epub 2014/01/23).
Tubbs RS, Wellons JC 3rd, Oakes WJ. Asymmetry of tonsillar ectopia in Chiari I malformation. Pediatr Neurosurg. 2002;37(4):199–202 (Epub 2002/10/10).
Isik N, Elmaci I, Kaksi M, Gokben B, Isik N, Celik M. A new entity: Chiari Zero malformation and its surgical method. Turk Neurosurg. 2011;21(2):264–8 (Epub 2011/05/03).
Tubbs RS, Elton S, Grabb P, Dockery SE, Bartolucci AA, Oakes WJ. Analysis of the posterior fossa in children with the Chiari 0 malformation. Neurosurgery. 2001;48(5):1050–4 (discussion 4–5. Epub 2001/05/04).
Markunas CA, Enterline DS, Dunlap K, Soldano K, Cope H, Stajich J, et al. Genetic evaluation and application of posterior cranial fossa traits as endophenotypes for Chiari type I malformation. Ann Hum Genet. 2014;78(1):1–12.
Boyles AL, Enterline DS, Hammock PH, Siegel DG, Slifer SH, Mehltretter L, et al. Phenotypic definition of Chiari type I malformation coupled with high-density SNP genome screen shows significant evidence for linkage to regions on chromosomes 9 and 15. Am J Med Genet A. 2006;140(24):2776–85 (Epub 2006/11/15).
Martin BA, Kalata W, Shaffer N, Fischer P, Luciano M, Loth F. Hydrodynamic and longitudinal impedance analysis of cerebrospinal fluid dynamics at the craniovertebral junction in type I Chiari malformation. PLoS ONE. 2013;8(10):e75335.
Shaffer N, Martin BA, Rocque B, Madura C, Wieben O, Iskandar BJ, Dombrowski S, Luciano M, Oshinski JN, Loth F. Cerebrospinal fluid flow impedance is elevated in type I Chiari malformation. J Biomech Eng. 2014;136(2):021012.
Schneider CA, Rasband WS, Eliceiri KW. NIH Image to ImageJ: 25 years of image analysis. Nat Methods. 2012;9(7):671–5.
Hallgren KA. Computing inter-rater reliability for observational data: an overview and tutorial. Tutor Quant Methods Psychol. 2012;8(1):23–34.
McGraw KO, Wong SP. Forming inferences about some intraclass correlation coefficients. Psychol Methods. 1996;1(1):30.
Cicchetti DV. Guidelines, criteria, and rules of thumb for evaluating normed and standardized assessment instruments in psychology. Psychol Assess. 1994;6(4):284.
Frisoli FA, Lang SS, Vossough A, Cahill AM, Heuer GG, Dahmoush HM, et al. Intrarater and interrater reliability of the pediatric arteriovenous malformation compactness score in children. J Neurosurg Pediatr. 2013;11(5):547–51.
Labuda R. Chiari surgeries becoming more common… [web page] 2009. http://www.conquerchiari.org/subsonly/Volume7/Issue7(5)/Editorial7(5).asp.
Tubbs RS, McGirt MJ, Oakes WJ. Surgical experience in 130 pediatric patients with Chiari I malformations. J Neurosurg. 2003;99(2):291–6 (Epub 2003/08/20).
McGirt MJ, Attenello FJ, Atiba A, Garces-Ambrossi G, Datoo G, Weingart JD, et al. Symptom recurrence after suboccipital decompression for pediatric Chiari I malformation: analysis of 256 consecutive cases. Childs Nerv Syst. 2008;24(11):1333–9 (Epub 2008/06/03).
Mueller D, Oro JJ. Prospective analysis of self-perceived quality of life before and after posterior fossa decompression in 112 patients with Chiari malformation with or without syringomyelia. Neurosurg Focus. 2005;18(2):ECP2 (Epub 2005/02/18).
Tubbs RS, Kirkpatrick CM, Rizk E, Chern JJ, Oskouian RJ, Oakes WJ. Do the cerebellar tonsils move during flexion and extension of the neck in patients with Chiari I malformation? A radiological study with clinical implications. Childs Nerv Syst. 2016;32(3):527–30.
Schijman E, Steinbok P. International survey on the management of Chiari I malformation and syringomyelia. Childs Nerv Syst. 2004;20(5):341–8 (Epub 2004/02/18).
Novegno F, Caldarelli M, Massa A, Chieffo D, Massimi L, Pettorini B, et al. The natural history of the Chiari type I anomaly. J Neurosurg Pediatr. 2008;2(3):179–87 (Epub 2008/09/02).
Navarro R, Olavarria G, Seshadri R, Gonzales-Portillo G, McLone DG, Tomita T. Surgical results of posterior fossa decompression for patients with Chiari I malformation. Childs Nerv Syst. 2004;20(5):349–56 (Epub 2004/03/17).
Strahle J, Muraszko KM, Kapurch J, Bapuraj JR, Garton HJ, Maher CO. Natural history of Chiari malformation type I following decision for conservative treatment. J Neurosurg Pediatr. 2011;8(2):214–21 (Epub 2011/08/03).
Kahn EN, Muraszko KM, Maher CO. Prevalence of Chiari I malformation and syringomyelia. Neurosurg Clin N Am. 2015;26(4):501–7 (Epub 2015/09/27).
Speer MC, Enterline DS, Mehltretter L, Hammock P, Joseph J, Dickerson M, et al. Review article: Chiari type I malformation with or without syringomyelia: prevalence and genetics. J Genet Couns. 2003;12(4):297–311.
Mutchnick IS, Janjua RM, Moeller K, Moriarty TM. Decompression of Chiari malformation with and without duraplasty: morbidity versus recurrence. J Neurosurg Pediatr. 2010;5(5):474–8 (Epub 2010/05/04).
Fischbein R, Saling JR, Marty P, Kropp D, Meeker J, Amerine J, et al. Patient-reported Chiari malformation type I symptoms and diagnostic experiences: a report from the national Conquer Chiari Patient Registry database. Neurol Sci. 2015;36(9):1617–24.
Meeker J, Amerine J, Kropp D, Chyatte M, Fischbein R. The impact of Chiari malformation on daily activities: a report from the national Conquer Chiari Patient Registry database. Disabil Health J. 2015;8(4):521–6.
NIH. NINDS common data elements: Chiari I malformation. 2017. https://commondataelements.ninds.nih.gov/CM.aspx-tab=Data_Standards. Available 20 July 2017.
Urbizu A, Martin BA, Moncho D, Rovira A, Poca MA, Sahuquillo J, Macaya A, Espanol MI. Machine learning applied to neuroimaging for diagnosis of adult classic Chiari malformation: roleof the basion as a key morphometric indicator. J Neurosurg. 2018;129(3):779–91.
Alperin N, Sivaramakrishnan A, Lichtor T. Magnetic resonance imaging-based measurements of cerebrospinal fluid and blood flow as indicators of intracranial compliance in patients with Chiari malformation. J Neurosurg. 2005;103(1):46–52 (Epub 2005/08/27).
Strahle J, Smith BW, Martinez M, Bapuraj JR, Muraszko KM, Garton HJ, et al. The association between Chiari malformation type I, spinal syrinx, and scoliosis. J Neurosurg Pediatr. 2015;15(6):607–11 (Epub 2015/06/02).
Vernooij MW, Ikram MA, Tanghe HL, Vincent AJ, Hofman A, Krestin GP, et al. Incidental findings on brain MRI in the general population. N Engl J Med. 2007;357(18):1821–8 (Epub 2007/11/06).
Levy LM. MR identification of Chiari pathophysiology by using spatial and temporal CSF flow indices and implications for syringomyelia. AJNR Am J Neuroradiol. 2003;24(2):165–6 (Epub 2003/02/20).
Pahlavian SH, Loth F, Luciano M, Oshinski J, Martin BA. Neural tissue motion impacts cerebrospinal fluid dynamics at the cervical medullary junction: a patient-specific moving-boundary computational model. Ann Biomed Eng. 2015;43(12):2911–23.
Radmanesh A, Greenberg JK, Chatterjee A, Smyth MD, Limbrick DD Jr, Sharma A. Tonsillar pulsatility before and after surgical decompression for children with Chiari malformation type 1: an application for true fast imaging with steady state precession. Neuroradiology. 2015;57(4):387–93.
Martin BA, Labuda R, Royston TJ, Oshinski JN, Iskandar B, Loth F. Spinal subarachnoid space pressure measurements in an in vitro spinal stenosis model: implications on syringomyelia theories. J Biomech Eng. 2010;132(11):111007.
Cousins J, Haughton V. Motion of the cerebellar tonsils in the foramen magnum during the cardiac cycle. AJNR Am J Neuroradiol. 2009;30(8):1587–8 (Epub 2009/03/13).
Ucar M, Tokgoz N, Koc AM, Kilic K, Borcek AO, Oner AY, et al. Assessment of 3D T2-weighted high-sampling-efficiency technique (SPACE) for detection of cerebellar tonsillar motion: new useful sign for Chiari I malformation. Clin Imaging. 2015;39(1):42–50.
Alves T, Ibrahim ES, Martin BA, Malyarenko D, Maher C, Muraszko KM, et al. Principles, techniques, and clinical applications of phase-contrast magnetic resonance cerebrospinal fluid imaging. Neurographics. 2017;7(3):199–210.
Yildiz S, Thyagaraj S, Jin N, Zhong X, Heidari Pahlavian S, Martin BA, et al. Quantifying the influence of respiration and cardiac pulsations on cerebrospinal fluid dynamics using real-time phase-contrast MRI. J Magn Reson Imaging. 2017;46:431–9.
Yamada S, Goto T. Understanding of cerebrospinal fluid hydrodynamics in idiopathic hydrocephalus (A) Visualization of CSF bulk flow with MRI time-spatial labeling pulse method (time-SLIP). Rinsho Shinkeigaku. 2010;50(11):966–70.
Yiallourou TI, Kroger JR, Stergiopulos N, Maintz D, Martin BA, Bunck AC. Comparison of 4D phase-contrast MRI flow measurements to computational fluid dynamics simulations of cerebrospinal fluid motion in the cervical spine. PLoS ONE. 2012;7(12):e52284.
du Boulay G, Shah SH, Currie JC, Logue V. The mechanism of hydromyelia in Chiari type 1 malformations. Br J Radiol. 1974;47(561):579–87.
Battal B, Kocaoglu M, Bulakbasi N, Husmen G, Tuba Sanal H, Tayfun C. Cerebrospinal fluid flow imaging by using phase-contrast MR technique. Br J Radiol. 2011;84(1004):758–65.
Lane B, Kricheff II. Cerebrospinal fluid pulsations at myelography: a videodensitometric study. Radiology. 1974;110(3):579–87.
Lawrence BJ, Luciano M, Tew J, Ellenbogen RG, Oshinski JN, Loth F, et al. Cardiac-related spinal cord tissue motion at the foramen magnum is increased in patients with type I Chiari malformation and decreases postdecompression surgery. World Neurosurg. 2018;116:e298–307 (Epub 2018/05/08).
Authors’ contributions
AU, AB, BAM, BJI, BGR, CM, FL, JNO, JRK, MGL, PAA, and RST conceived and designed the study, obtained and processed the MRI data. AU, BJI, BAM, CM, MGL, and JNO were involved in patient selection and clinical data acquisition. AU, BAM, BJL, and JAC were involved in design and implementation of the statistical portion of the paper as well as interpretation of the data and writing the manuscript. All authors contributed to editing of the manuscript. All authors read and approved the final manuscript.
Acknowledgements
Publication of this article was funded by the University of Idaho Open Access Publishing Fund.
Competing interests
The authors declare that they have no competing interests.
Availability of data and materials
The datasets used during the current study are available from the corresponding author on reasonable request.
Consent for publication
Consent was obtained to publish any or all anonymized data.
Ethics approval and consent to participate
This study was carried out in accordance with the Declaration of Helsinki (1989) and MRI data acquisition was performed at the University of Wisconsin (UW), the Cleveland Clinic Foundation (CCF), and Emory University (EU). The study was approved by the institutional review board of each institution (IRB #20130226). Prior to scanning, written informed consent was obtained from all subjects. All MRI data were anonymized before being transferred to operators for analysis.
Funding
This work was supported by The Chiari and Syringomyelia Patient Education Foundation and NIH NINDS grant 1R15NS071455-01 (FL), NIH NIGMS grants P20GM103408 (BAM) and 4U54GM104944-04 (BAM) and the University of Washington School of Medicine Medical Student Research Training Program (MSRTP–BJL). AU was the recipient of a Postdoctoral Fellowship from Fundación Ramón Areces (Spain) and mentored by BAM.
BAM served as Director of the Conquer Chiari Research Center and received research funding from American Syringomyelia and Chiari Alliance Project at the time of this study. FL served as Executive Director at Conquer Chiari Research Center and received research funding from Conquer Chiari at the time of this study.
Publisher’s Note
Springer Nature remains neutral with regard to jurisdictional claims in published maps and institutional affiliations.
Author information
Authors and Affiliations
Corresponding author
Rights and permissions
Open Access This article is distributed under the terms of the Creative Commons Attribution 4.0 International License (http://creativecommons.org/licenses/by/4.0/), which permits unrestricted use, distribution, and reproduction in any medium, provided you give appropriate credit to the original author(s) and the source, provide a link to the Creative Commons license, and indicate if changes were made. The Creative Commons Public Domain Dedication waiver (http://creativecommons.org/publicdomain/zero/1.0/) applies to the data made available in this article, unless otherwise stated.
About this article

Cite this article
Lawrence, B.J., Urbizu, A., Allen, P.A. et al. Cerebellar tonsil ectopia measurement in type I Chiari malformation patients show poor inter-operator reliability. Fluids Barriers CNS 15, 33 (2018). https://doi.org/10.1186/s12987-018-0118-1
Received:
Accepted:
Published:
DOI: https://doi.org/10.1186/s12987-018-0118-1