
Abstract
Background
Pilea is a genus of perennial herbs from the family Urticaceae, and some species are used as courtyard ornamentals or for medicinal purposes. At present, there is no information about the plastid genome of Pilea, which limits our understanding of this genus. Here, we report 4 plastid genomes of Pilea taxa (Pilea mollis, Pilea glauca ‘Greizy’, Pilea peperomioides and Pilea serpyllacea ‘Globosa’) and performed comprehensive comparative analysis.
Results
The four plastid genomes all have a typical quartile structure. The lengths of the plastid genomes ranged from 150,398 bp to 152,327 bp, and each genome contained 113 unique genes, including 79 protein-coding genes, 4 rRNA genes, and 30 tRNA genes. Comparative analysis showed a rather high level of sequence divergence in the four genomes. Moreover, eight hypervariable regions were identified (petN-psbM, psbZ-trnG-GCC, trnT-UGU-trnL-UAA, accD-psbI, ndhF-rpl32, rpl32-trnL-UAG, ndhA-intron and ycf1), which are proposed for use as DNA barcode regions. Phylogenetic relationships based on the plastid genomes of 23 species of 14 genera of Urticaceae resulted in the placement of Pilea in the middle and lower part of the phylogenetic tree, with 100% bootstrap support within Urticaceae.
Conclusion
Our results enrich the resources concerning plastid genomes. Comparative plastome analysis provides insight into the interspecific diversity of the plastid genome of Pilea. The identified hypervariable regions could be used for developing molecular markers applicable in various research areas.
Background
Pilea species are perennial herbs from the family Urticaceae and mainly distributed in tropical and subtropical regions, and some species are distributed in warm temperate regions. Pilea is a species-rich genus, which is the largest one in the family Urticaceae, and a relatively large genus among angiosperms [1]. The leaves of many species in Pilea have color spots, which can be used for garden cultivation and ornamental purposes. They are often the main plant groups in shady and humid environments of the garden landscape. On the other hand, in traditional Chinese pharmacopeia, several species are recorded as medicinal plants from which a variety of pharmacologically active substances can be extracted [2,3,4]. For example, P. peperomioides is recorded in “Dai medicine” for anti-inflammatory and detoxifying activities and is also used for erysipelas and bone setting. However, this group that has received little attention, and there are also few reports about Pilea. Considering that many medicinal plants are morphologically similar, especially those of these species-rich genera, accurate species identification based on molecular markers is particularly important for rational utilization of these medicinal plants.
The genus Pilea is also a controversial group in traditional taxonomy, and previous studies have suggested that Sarcopilea also belongs to this genus [5]. In addition, some new species have been reported in recent years [6, 7]. It is difficult to revise this species-rich genus with little attention from experts and scholars. Moreover, relatively little research has been reported on this genus, especially in the field of molecular biology and genomics. Though some researchers have used molecular methods to explore phylogenetic relationships within the genus Pilea [1] and its phylogenetic position in the family Urticaceae [5], the selected DNA fragments are one-sided and partially complete, with low bootstrap support values, which has certain limitations. It is therefore necessary for us to further study the phylogenetic relationships of Pilea species in Urticaceae.
The chloroplast is a kind of organelle involved in photosynthesis [8] and energy transformation in plants and algae [9, 10]. The chloroplast genome (referred to as the plastid genome or the plastome in the present text) encodes many key proteins that play essential roles in photosynthesis and other metabolic properties [11]. In previous studies, several unique characteristics of the plastome have been widely reported, such as its monophyletic inheritance [12], conserved coding region sequences [13] and genome structure [14, 15]. These reliable resources provide rich information for the study of evolution, DNA barcoding, taxonomy and phylogeny [16,17,18]. Although the plastid genome is highly conserved, some interesting structural variations have been observed in some taxa, such as the rare expansion of IR regions in Strobilanthes [15], the insertion of mitochondrial DNA in the plastome of Anacardium [19], and the complete or partial loss of IR regions in some legumes [16, 20, 21]. In a recent study, Wang et al. reported plastid genomes from 13 of 58 genera in Urticaceae, providing an abundance of plastid genome resources for the study of this group of plants [22]. Unfortunately, there have been no reports on the plastid genome of Pilea plants.
Here, we sequenced, assembled and analyzed the plastid genomes of four Pilea species, including a rare succulent plant of this genus (P. serpyllacea). As ornamental or medicinal plants, these species have great differences in morphology (especially their leaves) and are representative of the genus. Our main tasks were as follows: (1) we sequenced and assembled the plastome of four Pilea plant species; (2) we analyzed the structural characteristics and sequence divergence of the plastomes in Pilea; (3) we identified simple sequence repeats (SSRs) loci and repeat sequences for further studies on population genetic structure; (4) we inferred the phylogenetic relationships of Pilea in Urticaceae based on the complete plastome sequence; and (5) we identified the hypervariable regions that could be used as DNA barcodes for identification of members of this genus.
Results
General features of the plastid genome
Using Illumina HiSeq sequencing platforms, 5.38–5.89 Gb of clean data from each Pilea species were obtained, with the number of clean reads ranging from 17,935,118 to 19,627,967 (Additional File 1: Table S1). The plastome was assembled based on these data. The 4 plastomes of Pilea are characterized by a typical circular DNA molecule with a length ranging from 150,398 to 152,327 bp. They all have a conservative quartile structure composed of a large single copy (LSC) region (82,063 to 83,292 bp), a small single copy (SSC) region (17,487 to 18,363 bp) and a pair of inverted repeat (IR) regions (25,180 to 25,356 bp) (Table 1). The lengths of the plastomes are conserved in this genus. GC content analysis showed that the overall GC contents ranged from 36.35 to 36.69% in the 4 plastomes. Note that the GC contents in the IR regions (42.56–42.73%) are significantly higher than those in the LSC (33.87–34.36%) and SSC regions (30.01–30.81%). The raw sequencing data and the four genome sequences have been deposited into the NCBI database (accession numbers: PRJNA675740 and MT726015 to MT726018).
Genome annotation
The plastid genomes of the four Pilea species all comprise 113 unique genes, including 79 protein-coding genes, 4 rRNA genes and 30 tRNA genes (Additional File 1: Table S2). The gene order and gene numbers of these four species are highly similar, showing conserved genomic structures. Figure 1 shows the schematic diagram of the plastome of Pilea. Introns play a significant role in selective gene splicing [23]. Among the 79 protein-coding genes annotated, nine unique genes (rps16, rpoC1, atpF, petB, petD, rpl16, rpl2, ndhB, ndhA) contained one intron, and two unique genes (ycf3, clpP) contained two introns. Moreover, six unique tRNA genes (trnK-UUU, trnG-UCC, trnL-UAA, trnV-UAC, trnI-GAU, trnA-UGC) contain one intron. There are seven protein-coding genes, four rRNA genes, and seven tRNA genes completely duplicated in the IR regions, so they exist as two copies. The rps12 gene is a trans-spliced gene, and the 5′ end is located in the LSC region. However, the 3′ ends are found in the IRa and IRb regions. These results are similar to those in other species in Urticaceae [22].

Plastid genome map of four Pilea species and image of the four plants. The genome has a conservative quartile structure that is composed of an LSC region, an SSC region and a pair of IR regions. The genes outside the circle are transcribed in the counterclockwise direction, and the genes inside the circle are transcribed in the clockwise direction. Different colors in genes represent different functions. The dark gray area and light gray area of the inner circle represent the ratio of GC content to AT content in the genome, respectively
Repeat analysis
SSRs, also referred to as microsatellite sequences, provide a large amount of genetic information [24,25,26]. Because of its high genetic polymorphism, SSRs are often used for the development of molecular markers and play an important role in the identification of species [27, 28]. In this study, we detected 68, 75, 71, and 80 SSRs in the 4 analyzed species (Fig. 2a, Additional File 1: Table S3). Most SSRs are mononucleotide homopolymers, particularly A/T, which accounts for 70.75% of the total. Hexanucleotide repeats are detected only in P. mollis. These SSRs showed high polymorphism, suggesting great potential in the identification of Pilea species.
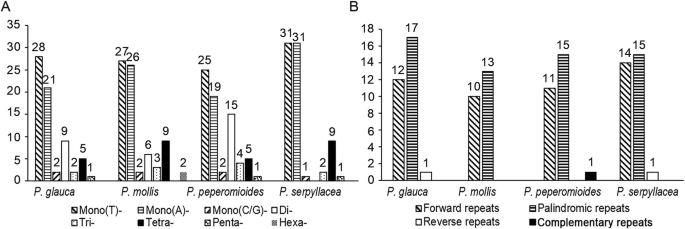
Comparison of the repeats in the plastid genomes of 4 Pilea species. a. Types and numbers of SSRs detected in the 4 plastomes; b. Types and numbers of interspersed repeats in the 4 plastomes
In the plastid genomes of Pilea species, we detected four types of interspersed repeats. Most of them are forward repeats and palindromic repeats (Fig. 2b). By contrast, there are only two reverse repeats and one complementary repeat. The only complementary repeats were found in P. peperomioides. The detailed sequences showed in Additional File 1: Table S4. Moreover, the length of these short interspersed repeats mainly ranged from 30 to 34 bp. We note one forward repeat with a length of 102 bp (detected in P. serpyllacea).
Contraction and expansion analysis of IR regions
The contraction and expansion of IR regions are considered to be an important reason for the length diversity in plastid genomes [29]. In addition, with the expansion/contraction of the IR regions, genes near the border have an opportunity to access IR or SC regions [30]. We retrieved the published plastomes of six species from Urticaceae and compared them with those of the four Pilea species. We found several genes spanning or near the boundary of the IR and SC regions. They include mainly rps19, rpl22, rpl2, ycf1, ndhF and trnH (Fig. 3). Notably, an abnormal expansion of IR regions was observed in Gonostegia hirta. The IR regions are more than 30,000 bp in G. hirta, and more genes can access the IR regions (e.g., rpl36 and rps19). However, the length of IR regions in the other nine species is approximately 25,000 bp, and the rps19 gene spans the LSC/IRb boundary, except in Droguetia iners and Hesperocnide tenella; the rps19 gene in the former is in the LSC region, while that in latter is completely in the IR region. In addition, the trnH gene completely accesses IR regions in H. tenella, obtaining two copies. It can be seen that the genomic structure, gene order and numbers of some species in Urticaceae have changed obviously.

Comparison of the borders among the LSC, SSC, and IR regions of 10 analyzed species. The genes around the borders are shown above or below the mainline. JLB, JSB, JSA, and JLA represent junction sites of LSC/IRb, IRb/SSC, SSC/IRa, and IRa/LSC, respectively
Furthermore, the ycf1 gene crosses the SSC/IRa boundary, most of which is located in the SSC region. The length of the ycf1 gene in the four Pilea species varies widely, indicating the possibility of sequence differences. Surprisingly, we annotated two copies of ycf1 in the four Pilea plants; they cross the IRb/SSC boundary and are not annotated in other species. Sequence alignment found that the two copies of ycf1 exist in other taxa, indicating that the previous annotation is imperfect, although one of the two copies is a fragment of ycf1 and is generally considered to be a pseudogene. Interestingly, a small fraction of the ndhF gene (less than 100 bp) crosses the IRb/SSC regions, which means that the first copy of ycf1 has an overlap with ndhF in Pilea species. The overlapping areas are 108 bp in length.
Genomic divergence
To evaluate the genomic divergence, sequence identity analysis based on mVISTA [31] was performed among the 4 Pilea species, with the reference being the plastome of P. peperomioides. We observed varying degrees of sequence divergence, especially in the LSC and SSC regions. In contrast, the IR regions were more conserved. Most of these highly variable regions were observed in conserved noncoding sequences (CNS) (Fig. 4). However, the regions with the greatest sequence divergence were found in protein-coding regions, in which the gene ycf1 is present. The coding regions of ycf1 in the four Pilea species showed significant differences, and the similarity was even less than 50% for some fragments. Overall, the analyzed genomic sequences showed rather high levels of sequence divergence throughout the genus Pilea.

Comparison of the plastomes in the 4 Pilea species by using mVISTA. The genes are represented as gray arrows on the top of the alignments. The different regions are labeled with different colors. The pink regions are “conserved noncoding sequences” (CNS), the dark blue regions are exons, and the light-blue regions are tRNAs or rRNAs. The percentages 50 and 100% refer to the similarity among sequences. The gray arrows above the aligned sequences represent genes and their orientation
To quantify the levels of DNA polymorphism, the 4 genomes were aligned and analyzed by using DnaSP v6.0 [32]. We detected 8 hypervariable regions, with Pi values exceeding 0.06 (Fig. 5), petN-psbM (Pi = 0.06067); psbZ-trnG-GCC (Pi = 0.07067); trnT-UGU-trnL-UAA (Pi = 0.06433); accD-psbI (Pi = 0.06003); ndhF-rpl32 (Pi = 0.06100); rpl32-trnL-UAG (Pi = 0.06800); ndhA-intron (Pi = 0.06533), and most regions of the gene ycf1 (Pi values ranging from 0.07367 to 0.17067). The Pi values are listed in parentheses. Notably, most regions of the plastome sequences had Pi values greater than 0.02 (except for IR regions), exhibiting abundant polymorphism of the plastid genome in Pilea.
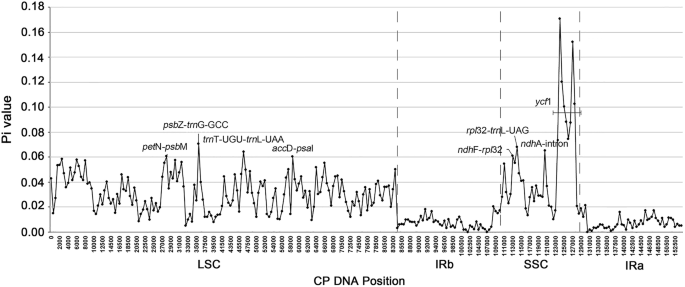
Nucleotide diversity (Pi) of plastomes among the 4 Pilea species. Each black dot represents the nucleotide diversity per 500 bp. Seven intergenic regions (petN-psbM, 0.06067; psbZ-trnG-GCC, 0.07067; trnT-UGU-trnL-UAA, 0.06433; accD-psbI, 0.06003; ndhF-rpl32, 0.06100; rpl32-trnL-UAG, 0.06800; ndhA-intron, 0.06533) and one protein-coding region (ycf1, 0.07367–0.17067) had Pi values greater than 0.06
Nucleotide variations in protein-coding genes
The protein-coding regions are highly conserved in plastid genomes [33]. We analyzed the protein-coding sequences of 79 identified unique orthologous genes in 4 Pilea taxa. Surprisingly, these protein-coding genes also showed high levels of variation (Fig. 6a, Additional File 1: Table S5). Of the 79 shared genes, 63 had a mutation rate of more than 2%, and 30 had a mutation rate of more than 4%. The gene with the highest mutation rates was ycf1 (16.62%), followed by matK (10.54%), ccsA (8.74%) and rps15 (8.42%). Only two genes (psbJ and psbL) showed extreme conservation without any variable sites. Moreover, we observed a total of 11 genes (ycf1, ndhF, rps19, accD, rpoC2, rps16, rpoA, rpl20, ndhD, rpoC1 and ycf2) with InDels in nucleotide sequences by using DnaSP v6.0 [32]. Among these, ycf1 had 35 InDels, followed by ycf2 (9), accD (4) and rpoC2 (3). Considering that the protein-coding regions are highly conserved, protein-coding sequences with high nucleotide mutation rates are usually infrequent in the same genus, and these results showed interspecific diversity within the plastid genome of Pilea.

Sequence polymorphism among 79 shared plastid genes of 4 Pilea species. b. Percentages of variable sites in 79 shared protein-coding genes. We used MEGA v6.0 to calculate the percentages of variable sites. The three genes with the highest mutation rates are labeled with an *: ycf1 (16.62%), matK (10.54%) and ccsA (8.74%). b. Estimations of nonsynonymous (dN) and synonymous (dS) substitution rates and the dN/dS of 79 shared protein-coding genes. The four genes with the highest dN/dS values are labeled with an *
In this study, synonymous (dS) and nonsynonymous (dN) substitution rates, along with dN/dS, were estimated for the 79 shared genes in parallel by using PAML v4.9 [34]. Among the 79 genes, ycf1, matK, ccsA and rps15 had relatively high dN values, and rps16, rpl32, ndhF and psaJ had relatively high dS values (Fig. 6b, Additional file 1: Table S6). Most genes exhibited considerably low dN/dS values (less than 0.6), implying that most of the protein-coding genes were under purifying selection during evolution. However, the dN/dS ratio of three genes (rpl36, clpP and accD) was between 0.6 and 1.0. Moreover, the dN/dS ratio was greater than 1.0 for petL, rps12, ycf1 and ycf2, indicating that they were under positive selection during evolution. These results clearly indicated that the plastid genes in the different species of Pilea may have been subjected to different selection pressures.
Phylogenetic analysis
In this study, we constructed maximum likelihood (ML) trees by using the complete plastome sequences as data sets (detailed materials are shown in Additional File 1: Table S7). The phylogenetic tree has high bootstrap support in all nodes, showing the reliability of the phylogeny recovered (Fig. 7).
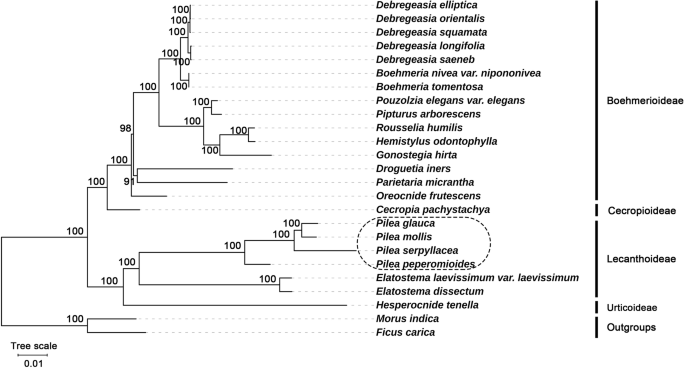
Phylogenetic relationships of species from Urticaceae inferred using the maximum likelihood (ML) method. The phylogenetic tree was constructed using the complete plastome sequences among the 25 plastid genomes. The number at the bottom of the scale, 0.01, means that the length of the branch represents the replacement frequency of bases at each site of the genome at 0.01. The bootstrap values were calculated from 1000 replicates. Two taxa from Moraceae, nam
Our phylogenetic tree displayed two clades clearly and then further diversified into four subclades with 100% bootstrap support (ML). These four subclades correspond to four subfamilies: Boehmerioideae, Cecropioideae, Lecanthoideae and Urticoideae. This is consistent with the traditional classification [5]. All 4 Pilea species clustered together (all nodes have BS = 100 for the ML method) and formed a monophyletic group that is a sister group to Elatostema. They all belong to the subfamily Lecanthoideae.
Discussion
Conserved genome structure and gene content
In our study, we reported four plastid genomes of Pilea taxa for the first time. Our assembly results showed that the lengths of the 4 plastid genomes ranged from 150,398 bp to 152,327 bp and that they have a typical tetrad structure. In terms of structure, these results are similar to those of most Urticaceae plants [35, 36]. In this study, the longest and shortest plastid genomes in Urticaceae were 159,085 bp (Gonostegia hirta) and 146,842 bp (Hesperocnide tenella), respectively. This suggests that the plastid genomes of Urticaceae may have undergone different evolutionary processes. Among our four Pilea taxa, the longest genome sequence was that of P. peperomioides (152,327 bp) and the shortest was that of P. serpyllacea (150,398 bp), and we did not detect gene gain or loss, suggesting that the plastomes are still relatively conserved in Pilea.
Moreover, we detected SSRs and repeat sequences in the four plastid genomes. Of the 294 total SSRs, 215 are mononucleotide repeats, accounting for the majority of all SSRs (73.13%). These mononucleotide repeats are mainly A/T repeats, and they have a significant impact on the overall G/C content of the genomes [37, 38]. These SSR sequences are often composed of simple repeating units such as polyadenine (Poly-A) or polythymine (Poly-T) repeats. With length polymorphisms in different species, they are often used as molecular markers. These abundant SSR loci in plastomes have been applied in species identification [16, 39]. Interspersed repeats are thought to be essential for promoting plastome rearrangements [40, 41]. We note that there is one forward repeat with a length of 102 bp in P. serpyllacea, and this is effective for increasing the length of the plastome. Whether these repeats caused the rearrangement of the plastomes of Pilea species is an interesting question.
Variation in IR regions is a common phenomenon in angiosperms. Compared with the overall absence of one IR region [42,43,44], the expansion/contraction of IR regions is more common in angiosperms [45, 46]. By comparative analysis, we found that G. hirta has significantly expanded IR regions, which also led to an increase in the overall length of the plastome. In our tested four Pilea species, the length of the IR regions ranged from 25,180 bp to 25,356 bp, showing no significant difference. As far as the boundary regions of IR/SC are concerned, the position of genes near the boundary in the four Pilea species is similar to that in most angiosperms. This indicates that the Pilea species did not experience significant expansion/contraction in the IR regions. However, we observed that the overlap of the ycf1 and SSC regions (4634 bp) in P. peperomioides was longer than that in the other three species (4203 bp-4314 bp), and the overlap with IRa was similar (803 bp–843 bp). This suggests that there is a significant difference in ycf1 gene sequences. In addition, the first copy of ycf1 overlaps with ndhF in Pilea taxa, and this result is also observed in Arabidopsis; the overlaps are approximately 30 bp [47]. Whether these overlaps affect the transcription or translation of these proteins is also an interesting subject.
Sequence divergence reveals the interspecific diversity of plastid genomes in Pilea
In our comparative plastid genomics analysis, we first compared the whole plastid genomes based on mVISTA. Specifically, we also calculated the percentage of variable sites and estimated the ratios of dN/dS among 79 orthologous protein-coding genes. Like in most angiosperms, the noncoding regions of plastomes in Pilea showed higher polymorphism than did the coding regions. Surprisingly, we also found rather high levels of sequence differences in the coding regions of Pilea taxa. Of the 79 orthologous genes identified, 63 had a mutation rate of more than 2%, and 30 had a mutation rate of more than 4%. This is rare in other genera because usually only the ycf1 gene has a high mutation rate [48]. The mutation rate of the ycf1 gene in the four Pilea species is an astonishing 16.62%. Additionally, a total of 35 InDels were detected, including a large fragment insertion in P. peperomioides (177 bp, data not shown). These InDels caused an increase in the length of the ycf1 gene in P. peperomioides. In addition, unusually high nucleotide mutation rates were also observed in matK, ccsA and other genes.
In general, dN changes are subject to bidirectional effects of varied mutation rates and selective constraints. A ratio of dN/dS greater than 1 is thought to be a sign that the gene has experienced selection pressure. In our study, the dN/dS ratios indicate that four genes (petL, rps12, ycf1 and ycf2) may have undergone positive selection in Pilea. The rapid evolution of protein-coding genes is closely related to the adaptive evolution of species [49, 50], indicating that Pilea species may have experienced a rapid evolutionary process, resulting in a species-rich genus.
Eight hypervariable regions could be used as potential DNA barcodes
Moreover, we used DnaSP v6.0 to quantify DNA sequence polymorphisms by conducting a sliding window analysis (window length, 500 bp; step size, 500 bp). Similar to the results of mVISTA, most regions except IR regions have high Pi values, which means that several regions have potential for the development of molecular markers. We recommend eight hypervariable regions, petN-psbM (Pi = 0.06067); psbZ-trnG-GCC (Pi = 0.07067); trnT-UGU-trnL-UAA (Pi = 0.06433); accD-psbI (Pi = 0.06003); ndhF-rpl32 (Pi = 0.06100); rpl32-trnL-UAG (Pi = 0.06800); ndhA-intron (Pi = 0.06533) and almost the entire ycf1 gene (Pi values ranging from 0.07367 to 0.17067), as potential molecular markers for Pilea taxa. In particular, the gene ycf1, with a large number of InDels, can be used as a specific molecular marker, which is of great significance for us to correctly identify and rationally utilize medicinal taxa from this genus.
Phylogenetic analysis of Pilea based on the plastid genome
Compared to nuclear and mitochondrial genomes, plastid genomes are highly conserved, and they have been widely used in phylogenetic and evolutionary studies [51,52,53]. With the development of high-throughput sequencing technology, the chloroplast genome sequence plays an important role in species identification as a super barcode [54, 55].
The phylogenetic relationships of Pilea in Urticaceae were analyzed based on the complete plastome sequences. In a one-sided analysis based on plastid genomes, Pilea and Elatostema were found to be sister groups to each other, both belonging to the subfamily Lecanthoideae. This is consistent with the results of traditional classification studies [5]. However, due to the maternal inheritance of the plastid genome [56], these results are limited. Accurate phylogenetic relationships still require a comprehensive analysis of nuclear and organellar genes [57]. Furthermore, only 14 of the 58 genera of Urticaceae have been sequenced to date. More genome sequencing is needed in the future to determine the relationships among Pilea and other species from the family Urticaceae.
Conclusions
In this study, four plastid genomes of Pilea were sequenced and assembled for the first time in this genus. These 4 plastomes have similar structural characteristics and a typical quartile structure similar to that in most angiosperms. Unusually, the sequences of these 4 plastomes, including the relatively conserved protein-coding regions, have rather high levels of variability, which provides insight into the interspecific diversity of the plastid genome of Pilea. In addition, eight hypervariable regions were identified, which could be used as molecular markers for the identification of this genus. Our results enrich the data on the plastid genomes of Urticaceae and provide the basis for the phylogenetic reconstruction of Pilea.
Methods
Plant material, DNA extraction and sequencing
Fresh leaves of four Pilea species were collected from the local flower market of Guangzhou, Kunming and Suqian. They were identified by Professor Jie Yu. These species are cultivated as ornamental plants, and no permission is required to collect these samples. Our experimental research, including the collection of plant materials, are complies with institutional, national or international guidelines. All the samples were deposited in the Herbarium of Southwest University, Chongqing, China (voucher code: UP200602 to UP200605). The detailed information for the plant samples shown in Additional File 1: Table S8. Total genomic DNA was extracted by using the CTAB method [58]. The DNA library with an insert size of 350 bp was constructed using a NEBNext® library construction kit and sequenced by using the HiSeq Xten PE150 sequencing platform. Sequencing produced a total of 5.4–5.9 Gb of raw data per species. Clean data were obtained by removing low-quality sequences, including sequences with a quality value of Q < 19 that accounted for more than 50% of the total bases and sequences in which more than 5% bases were “N”.
Genome assembly and annotation
De novo genome assembly from the clean data was accomplished utilizing NOVOPlasty v2.7.2 [59], with a k-mer length of 39 bp and a sequence fragment of the rbcL gene from maize as the seed sequence. The correctness of the assembly was confirmed by using Bowtie2 (v2. 0.1) [60] to manually edit and map all the raw reads to the assembled genome sequence under the default settings. The plastid genome was annotated initially by using CPGAVAS2 [61] with a reference genome (Elatostema dissectum, GenBank: NC_047192.1). GeSeq was then used to confirm the annotation results [62]. Furthermore, the annotations with problems were manually edited by using Apollo [63], and genome maps were drawn by OGDRAW [64]. The raw sequencing data and the four genome sequences have been deposited in GenBank (accession numbers: PRJNA675740; MT726015, MT726016, MT726017 and MT726018).
Repeats and SSR analysis
The GC content was determined by using the cusp program provided by EMBOSS (v6.3.1) [65]. The simple sequence repeats (SSRs) were identified using the online website MISA (https://webblast.ipk-gatersleben.de/misa/), including mono-, di-, tri-, tetra-, penta-, and hexanucleotides with minimum numbers of 10, 5, 4, 3, 3, and 3, respectively [66]. Additionally, REPuter (https://bibiserv.cebitec.uni-bielefeld.de/reputer/) was used to calculate palindromic repeats, forward repeats, reverse repeats, and complementary repeats with the following settings: hamming distance of three and minimal repeat size of 30 bp [67].
Genome comparison
The plastomes of the 4 Pilea species were compared by using the shuffle-LAGAN mode in mVISTA [68, 69] to identify interspecific variations (http://genome.lbl.gov/vista/mvista/submit.shtml). A total of 79 orthologous genes among the 4 species were identified and extracted by using PhyloSuite [70]. The corresponding nucleotide sequences were aligned by using MAFFT (v 7.450) [71] implemented in PhyloSuite. We used MEGA v6.0 [72] to calculate the percentage of variable sites in the protein-coding genes. We also conducted a sliding window analysis (window length: 500 bp, step size: 500 bp) by using DnaSP v6.0 [32] to calculate the nucleotide polymorphism (Pi) among the 4 species. Finally, IRscope (https://irscope.shinyapps.io/irapp/) was used to visualize the IR boundaries in these genomes [73].
Analysis of the nucleotide substitution rate
The protein-coding sequences in the previous step were processed in parallel. We used the CODEML module in PAML v.4.9 [34] to estimate the rates of nucleotide substitution, including dN, dS, and the ratio of dN to dS. The detailed parameters were as follows: CodonFreq = 2 (F3 × 4 model); model = 0 (allowing a single dN/dS value to vary among branches); cleandata = 1 (removing sites with ambiguous data); and other parameters in the CODEML control file set to the default settings. A phylogenetic tree of each gene was generated by using the maximum likelihood (ML) method implemented in RAxML v8.2.4 [74].
Phylogenetic analysis
The plastid genomes of 19 species belonging to the family Urticaceae were downloaded from GenBank (NCBI, https://www.ncbi.nlm.nih.gov/). These species belong to 4 subfamilies (Additional File 1: Table S7). Two species from Moraceae (Morus indica and Ficus carica) were used as outgroups. The complete plastome sequences were aligned by using MAFFT (https://mafft.cbrc.jp/alignment/server/) online version 7.471 [71]. These aligned sequences were used to construct the phylogenetic trees by using the maximum likelihood (ML) method implemented in RAxML v8.2.4 [74]. The parameters were “raxmlHPC-PTHREADS-SSE3 -f a -N 1000 -m GTRGAMMA -x 551314260 -p 551314260”. The bootstrap analysis was performed with 1000 replicates.
Availability of data and materials
The raw sequencing data generated in this study and the four plastid genome sequences were deposited in NCBI (https://www.ncbi.nlm.nih.gov/) with accession number: PRJNA675740, MT726015, MT726016, MT726017 and MT726018. All the samples are saved at the Herbarium of Southwest University, Chongqing, China. All other data and material generated in this manuscript are available from the corresponding author upon reasonable request.
Abbreviations
- SSR:
-
Simple sequence repeat
- CNS:
-
Conserved Non-Coding Sequences
- IRs:
-
Inverted repeats
- LSC:
-
Large single-copy
- SSC:
-
Small single-copy
- ML:
-
Maximum-likelihood
- BS:
-
Branch support
- PolyA:
-
Polyadenine
- PolyT:
-
Polythymine
- dS:
-
Synonymous substitution rates
- dN:
-
Nonsynonymous substitution rates
- DnaSP:
-
DNA Sequences Polymorphism
- CTAB:
-
Cetyl trimethylammonium bromide
- NCBI:
-
National Center for Biotechnology Information
- Pi:
-
Nucleotide diversity/polymorphism
References
Monro AK. The revision of species-rich genera: a phylogenetic framework for the strategic revision of Pilea (Urticaceae) based on cpDNA, nrDNA, and morphology. Am J Bot. 2006;93(3):426–41. https://doi.org/10.3732/ajb.93.3.426.
Zhou Y, Li LY, Ren HC, Qin RD, Li Q, Tu PF, Dou GF, Zhang QY, Liang H. Chemical constituents from the whole plants of Pilea cavaleriei Levl subsp. cavaleriei. Fitoterapia. 2017;119:100–7. https://doi.org/10.1016/j.fitote.2017.04.010.
Prabhakar KR, Veerapur VP, Bansal P, Parihar VK, Reddy Kandadi M, Bhagath Kumar P, Priyadarsini KI, Unnikrishnan MK. Antioxidant and radioprotective effect of the active fraction of Pilea microphylla (L.) ethanolic extract. Chem Biol Interact. 2007;165(1):22–32. https://doi.org/10.1016/j.cbi.2006.10.007.
Modarresi Chahardehi A, Ibrahim D, Fariza Sulaiman S. Antioxidant, Antimicrobial Activity and Toxicity Test of Pilea microphylla. Int J Microbiol 2010; 2010:826–830. doi:https://doi.org/10.1155/2010/826830.
Wu ZY, Monro AK, Milne RI, Wang H, Yi TS, Liu J, Li DZ. Molecular phylogeny of the nettle family (Urticaceae) inferred from multiple loci of three genomes and extensive generic sampling. Mol Phylogenet Evol. 2013;69(3):814–27. https://doi.org/10.1016/j.ympev.2013.06.022.
Dorr LJ, Stergios B. Four new species of Andean Pilea (Urticaceae), with additional notes on the genus in Venezuela. PhytoKeys. 2014;42:57–76. https://doi.org/10.3897/phytokeys.42.8455.
Monro AK, Wei YG, Chen CJ. Three new species of Pilea (Urticaceae) from limestone karst in China. PhytoKeys. 2012;19:51–66. https://doi.org/10.3897/phytokeys.19.3968.
Szabò I, Spetea C. Impact of the ion transportome of chloroplasts on the optimization of photosynthesis. J Exp Bot. 2017;68(12):3115–28. https://doi.org/10.1093/jxb/erx063.
Mullineaux PM, Exposito-Rodriguez M, Laissue PP, Smirnoff N. ROS-dependent signalling pathways in plants and algae exposed to high light: comparisons with other eukaryotes. Free Radic Biol Med. 2018;122:52–64. https://doi.org/10.1016/j.freeradbiomed.2018.01.033.
Pollari M, Ruotsalainen V, Rantamaki S, Tyystjarvi E, Tyystjarvi T. Simultaneous inactivation of sigma factors B and D interferes with light acclimation of the cyanobacterium Synechocystis sp. strain PCC 6803. J Bacteriol. 2009;191(12):3992–4001. https://doi.org/10.1128/JB.00132-09.
Wang Z, Zhu XG, Chen Y, Li Y, Hou J, Li Y, Liu L. Exploring photosynthesis evolution by comparative analysis of metabolic networks between chloroplasts and photosynthetic bacteria. BMC Genomics. 2006;7:100. https://doi.org/10.1186/1471-2164-7-100.
Brandrud MK, Baar J, Lorenzo MT, Athanasiadis A, Bateman RM, Chase MW, Hedren M, Paun O. Phylogenomic relationships of diploids and the origins of Allotetraploids in Dactylorhiza (Orchidaceae). Syst Biol. 2020;69(1):91–109. https://doi.org/10.1093/sysbio/syz035.
Shin DH, Lee JH, Kang SH, Ahn BO, Kim CK. The complete chloroplast genome of the Hare's ear root, Bupleurum falcatum: its molecular features. Genes (Basel). 2016;7(5):20. https://doi.org/10.3390/genes7050020.
Ebert D, Peakall R. Chloroplast simple sequence repeats (cpSSRs): technical resources and recommendations for expanding cpSSR discovery and applications to a wide array of plant species. Mol Ecol Resour. 2009;9(3):673–90. https://doi.org/10.1111/j.1755-0998.2008.02319.x.
Chen H, Shao J, Zhang H, Jiang M, Huang L, Zhang Z, Yang D, He M, Ronaghi M, Luo X, et al. Sequencing and analysis of Strobilanthes cusia (Nees) Kuntze chloroplast genome revealed the rare simultaneous contraction and expansion of the inverted repeat region in angiosperm. Front Plant Sci. 2018;9:324. https://doi.org/10.3389/fpls.2018.00324.
Jiang M, Chen H, He S, Wang L, Chen AJ, Liu C. Sequencing, Characterization, and Comparative Analyses of the Plastome of Caragana rosea var. rosea. Int J Mol Sci. 2018;19(5):1419. https://doi.org/10.3390/ijms19051419.
Liu X, Zhou B, Yang H, Li Y, Yang Q, Lu Y, Gao Y. Sequencing and Analysis of Chrysanthemum carinatum Schousb and Kalimeris indica. The Complete Chloroplast Genomes Reveal Two Inversions and rbcL as Barcoding of the Vegetable. Molecules (Basel, Switzerland). 2018;23(6):1358. https://doi.org/10.3390/molecules23061358.
Pang X, Liu H, Wu S, Yuan Y, Li H, Dong J, Liu Z, An C, Su Z, Li B. Species Identification of Oaks (Quercus L., Fagaceae) from Gene to Genome. Int J Mol Sci. 2019;20(23):5940. https://doi.org/10.3390/ijms20235940.
Rabah SO, Lee C, Hajrah NH, Makki RM, Alharby HF, Alhebshi AM, Sabir JSM, Jansen RK, Ruhlman TA. Plastome Sequencing of Ten Nonmodel Crop Species Uncovers a Large Insertion of Mitochondrial DNA in Cashew. The Plant Genome. 2017;10(3):plantgenome2017.03.0020. https://doi.org/10.3835/plantgenome2017.03.0020.
Choi IS, Jansen R, Ruhlman T. Lost and found: return of the inverted repeat in the legume clade defined by its absence. Genome Biol Evol. 2019;11(4):1321–33. https://doi.org/10.1093/gbe/evz076.
Sabir J, Schwarz E, Ellison N, Zhang J, Baeshen NA, Mutwakil M, Jansen R, Ruhlman T. Evolutionary and biotechnology implications of plastid genome variation in the inverted-repeat-lacking clade of legumes. Plant Biotechnol J. 2014;12(6):743–54. https://doi.org/10.1111/pbi.12179.
Wang RN, Milne RI, Du XY, Liu J, Wu ZY. Characteristics and mutational hotspots of Plastomes in Debregeasia (Urticaceae). Front Genet. 2020;11:729. https://doi.org/10.3389/fgene.2020.00729.
Plangger R, Juen MA, Hoernes TP, Nußbaumer F, Kremser J, Strebitzer E, Klingler D, Erharter K, Tollinger M, Erlacher MD, et al. Branch site bulge conformations in domain 6 determine functional sugar puckers in group II intron splicing. Nucleic Acids Res. 2019;47(21):11430–40. https://doi.org/10.1093/nar/gkz965.
Ma SJ, Sa KJ, Hong TK, Lee JK. Genetic diversity and population structure analysis in Perilla crop and their weedy types from northern and southern areas of China based on simple sequence repeat (SSRs). Genes Genomics. 2019;41(3):267–81. https://doi.org/10.1007/s13258-018-0756-3.
Seyoum M, Du XM, He SP, Jia YH, Pan Z, Sun JL. Analysis of genetic diversity and population structure in upland cotton (Gossypium hirsutum L.) germplasm using simple sequence repeats. J Genet. 2018;97(2):513–22.
Yang X, Xu Y, Shah T, Li H, Han Z, Li J, Yan J. Comparison of SSRs and SNPs in assessment of genetic relatedness in maize. Genetica. 2011;139(8):1045–54. https://doi.org/10.1007/s10709-011-9606-9.
Guang XM, Xia JQ, Lin JQ, Yu J, Wan QH, Fang SG. IDSSR: An Efficient Pipeline for Identifying Polymorphic Microsatellites from a Single Genome Sequence. Int J Mol Sci. 2019;20(14):3497. https://doi.org/10.3390/ijms20143497.
Guo Q, Li X, Yang S, Yang Z, Sun Y, Zhang J, Cao S, Dong L, Uddin S, Li Y. Evaluation of the Genetic Diversity and Differentiation of Black Locust (Robinia pseudoacacia L.) Based on Genomic and Expressed Sequence Tag-Simple Sequence Repeats. Int J Mol Sci. 2018;19(9):2492. https://doi.org/10.3390/ijms19092492.
Goulding SE, Olmstead RG, Morden CW, Wolfe KH. Ebb and flow of the chloroplast inverted repeat. Mol Gen Genet. 1996;252(1–2):195–206. https://doi.org/10.1007/bf02173220.
Wang W, Chen S, Zhang X. Whole-Genome Comparison Reveals Divergent IR Borders and Mutation Hotspots in Chloroplast Genomes of Herbaceous Bamboos (Bambusoideae: Olyreae). Molecules (Basel, Switzerland). 2018;23(7):1537. https://doi.org/10.3390/molecules23071537.
Frazer KA, Pachter L, Poliakov A, Rubin EM, Dubchak I. VISTA: computational tools for comparative genomics. Nucleic Acids Res. 2004;32(suppl_2):W273–9.
Rozas J, Ferrer-Mata A, Sánchez-DelBarrio JC, Guirao-Rico S, Librado P, Ramos-Onsins SE, Sánchez-Gracia A. DnaSP 6: DNA sequence polymorphism analysis of large data sets. Mol Biol Evol. 2017;34(12):3299–302. https://doi.org/10.1093/molbev/msx248.
Hong Z, Wu Z, Zhao K, Yang Z, Zhang N, Guo J, Tembrock LR, Xu D. Comparative Analyses of Five Complete Chloroplast Genomes from the Genus Pterocarpus (Fabacaeae). Int J Mol Sci. 2020;21(11):3758. https://doi.org/10.3390/ijms21113758.
Yang Z. PAML 4: phylogenetic analysis by maximum likelihood. Mol Biol Evol. 2007;24(8):1586–91. https://doi.org/10.1093/molbev/msm088.
Fu L-F, Xin Z-B, Wen F, Li S, Wei Y-G. Complete chloroplast genome sequence of Elatostema dissectum (Urticaceae). Mitochondrial DNA Part B. 2019;4:838–9. https://doi.org/10.1080/23802359.2019.1567292.
Wang R-N, Liu J, Li Z-H, Wu Z-Y. Complete chloroplast genome sequences of Debregeasia orientalis (Urticaceae). Mitochondrial DNA Part B. 2019;4(1):1830–1. https://doi.org/10.1080/23802359.2019.1604186.
Gichira AW, Avoga S, Li Z, Hu G, Wang Q, Chen J. Comparative genomics of 11 complete chloroplast genomes of Senecioneae (Asteraceae) species: DNA barcodes and phylogenetics. Bot Stud. 2019;60(1):17. https://doi.org/10.1186/s40529-019-0265-y.
Li W, Zhang C, Guo X, Liu Q, Wang K. Complete chloroplast genome of Camellia japonica genome structures, comparative and phylogenetic analysis. PLoS One. 2019;14(5):e0216645. https://doi.org/10.1371/journal.pone.0216645.
Su Y, Liu Y, Li Z, Fang Z, Yang L, Zhuang M, Zhang Y. QTL Analysis of Head Splitting Resistance in Cabbage (Brassica oleracea L. var. capitata) Using SSR and InDel Makers Based on Whole-Genome Re-Sequencing. PLoS One. 2015;10(9):e0138073. https://doi.org/10.1371/journal.pone.0138073.
Lee HO, Joh HJ, Kim K, Lee SC, Kim NH, Park JY, Park HS, Park MS, Kim S, Kwak M, et al. Dynamic Chloroplast Genome Rearrangement and DNA Barcoding for Three Apiaceae Species Known as the Medicinal Herb “Bang-Poong”. Int J Mol Sci. 2019;20(9):2196. https://doi.org/10.3390/ijms20092196.
McCann J, Jang TS, Macas J, Schneeweiss GM, Matzke NJ, Novak P, Stuessy TF, Villasenor JL, Weiss-Schneeweiss H. Dating the species network: Allopolyploidy and repetitive DNA evolution in American daisies (Melampodium sect. Melampodium, Asteraceae). Syst Biol. 2018;67(6):1010–24. https://doi.org/10.1093/sysbio/syy024.
Rousseau-Gueutin M, Bellot S, Martin GE, Boutte J, Chelaifa H, Lima O, Michon-Coudouel S, Naquin D, Salmon A, Ainouche K, et al. The chloroplast genome of the hexaploid Spartina maritima (Poaceae, Chloridoideae): comparative analyses and molecular dating. Mol Phylogenet Evol. 2015;93:5–16. https://doi.org/10.1016/j.ympev.2015.06.013.
Zheng W, Chen J, Hao Z, Shi J. Comparative Analysis of the Chloroplast Genomic Information of Cunninghamia lanceolata (Lamb.) Hook with Sibling Species from the Genera Cryptomeria D. Don, Taiwania Hayata, and Calocedrus Kurz. Int J Mol Sci. 2016;17(7):1084. https://doi.org/10.3390/ijms17071084.
Hao Z, Cheng T, Zheng R, Xu H, Zhou Y, Li M, Lu F, Dong Y, Liu X, Chen J, et al. The complete chloroplast genome sequence of a relict conifer Glyptostrobus pensilis: comparative analysis and insights into dynamics of chloroplast genome rearrangement in Cupressophytes and Pinaceae. PLoS One. 2016;11(8):e0161809. https://doi.org/10.1371/journal.pone.0161809.
Zhu A, Guo W, Gupta S, Fan W, Mower JP. Evolutionary dynamics of the plastid inverted repeat: the effects of expansion, contraction, and loss on substitution rates. New Phytol. 2016;209(4):1747–56. https://doi.org/10.1111/nph.13743.
He J, Yao M, Lyu RD, Lin LL, Liu HJ, Pei LY, Yan SX, Xie L, Cheng J. Structural variation of the complete chloroplast genome and plastid phylogenomics of the genus Asteropyrum (Ranunculaceae). Sci Rep. 2019;9(1):15285. https://doi.org/10.1038/s41598-019-51601-2.
Asaf S, Khan AL, Khan MA, Waqas M, Kang SM, Yun BW, Lee IJ. Chloroplast genomes of Arabidopsis halleri ssp. gemmifera and Arabidopsis lyrata ssp. petraea: Structures and comparative analysis. Sci Rep. 2017;7(1):7556. https://doi.org/10.1038/s41598-017-07891-5.
Dong W, Xu C, Li C, Sun J, Zuo Y, Shi S, Cheng T, Guo J, Zhou S. ycf1, the most promising plastid DNA barcode of land plants. Sci Rep. 2015;5:8348. https://doi.org/10.1038/srep08348.
Dong WL, Wang RN, Zhang NY, Fan WB, Fang MF, Li ZH. Molecular Evolution of Chloroplast Genomes of Orchid Species: Insights into Phylogenetic Relationship and Adaptive Evolution. Int J Mol Sci. 2018;19(3):716. https://doi.org/10.3390/ijms19030716.
Huang Y, Wang J, Yang Y, Fan C, Chen J. Phylogenomic analysis and dynamic evolution of chloroplast genomes in Salicaceae. Front Plant Sci. 2017;8:1050. https://doi.org/10.3389/fpls.2017.01050.
Du YP, Bi Y, Yang FP, Zhang MF, Chen XQ, Xue J, Zhang XH. Complete chloroplast genome sequences of Lilium: insights into evolutionary dynamics and phylogenetic analyses. Sci Rep. 2017;7(1):5751. https://doi.org/10.1038/s41598-017-06210-2.
Guo S, Guo L, Zhao W, Xu J, Li Y, Zhang X, Shen X, Wu M, Hou X. Complete Chloroplast Genome Sequence and Phylogenetic Analysis of Paeonia ostii. Molecules (Basel, Switzerland). 2018;23(2):246. https://doi.org/10.3390/molecules23020246.
Shen X, Guo S, Yin Y, Zhang J, Yin X, Liang C, Wang Z, Huang B, Liu Y, Xiao S, et al. Complete Chloroplast Genome Sequence and Phylogenetic Analysis of Aster tataricus. Molecules (Basel, Switzerland). 2018;23(10):2426. https://doi.org/10.3390/molecules23102426.
Fu CN, Wu CS, Ye LJ, Mo ZQ, Liu J, Chang YW, Li DZ, Chaw SM, Gao LM. Prevalence of isomeric plastomes and effectiveness of plastome super-barcodes in yews (Taxus) worldwide. Sci Rep. 2019;9(1):2773. https://doi.org/10.1038/s41598-019-39161-x.
Krawczyk K, Nobis M, Myszczyński K, Klichowska E, Sawicki J. Plastid super-barcodes as a tool for species discrimination in feather grasses (Poaceae: Stipa). Sci Rep. 2018;8(1):1924. https://doi.org/10.1038/s41598-018-20399-w.
Christie JR, Beekman M. Uniparental inheritance promotes adaptive evolution in cytoplasmic genomes. Mol Biol Evol. 2016;34(3):677–91. https://doi.org/10.1093/molbev/msw266.
Górniak M, Paun O, Chase MW. Phylogenetic relationships within Orchidaceae based on a low-copy nuclear coding gene, Xdh: congruence with organellar and nuclear ribosomal DNA results. Mol Phylogenet Evol. 2010;56(2):784–95. https://doi.org/10.1016/j.ympev.2010.03.003.
Arseneau JR, Steeves R, Laflamme M. Modified low-salt CTAB extraction of high-quality DNA from contaminant-rich tissues. Mol Ecol Resour. 2017;17(4):686–93. https://doi.org/10.1111/1755-0998.12616.
Dierckxsens N, Mardulyn P, Smits G. NOVOPlasty: de novo assembly of organelle genomes from whole genome data. Nucleic Acids Res. 2017;45(4):e18–8. https://doi.org/10.1093/nar/gkw955.
Langmead B, Trapnell C, Pop M, Salzberg SL. Ultrafast and memory-efficient alignment of short DNA sequences to the human genome. Genome Biol. 2009;10(3):R25. https://doi.org/10.1186/gb-2009-10-3-r25.
Shi L, Chen H, Jiang M, Wang L, Wu X, Huang L, Liu C. CPGAVAS2, an integrated plastome sequence annotator and analyzer. Nucleic Acids Res. 2019;47(W1):W65–w73. https://doi.org/10.1093/nar/gkz345.
Tillich M, Lehwark P, Pellizzer T, Ulbricht-Jones ES, Fischer A, Bock R, Greiner S. GeSeq - versatile and accurate annotation of organelle genomes. Nucleic Acids Res. 2017;45(W1):W6–w11. https://doi.org/10.1093/nar/gkx391.
Misra S, Harris N. Using Apollo to browse and edit genome annotations. Curr Protoc Bioinformatics. 2005;12(1):9.5.1–9.5.28. https://doi.org/10.1002/0471250953.bi0905s12.
Greiner S, Lehwark P, Bock R. OrganellarGenomeDRAW (OGDRAW) version 1.3.1: expanded toolkit for the graphical visualization of organellar genomes. Nucleic Acids Res. 2019;47(W1):W59–w64. https://doi.org/10.1093/nar/gkz238.
Rice P, Longden I, Bleasby A. EMBOSS: the European molecular biology open software suite. Trends Genet. 2000;16(6):276–7. https://doi.org/10.1016/s0168-9525(00)02024-2.
Beier S, Thiel T, Munch T, Scholz U, Mascher M. MISA-web: a web server for microsatellite prediction. Bioinformatics. 2017;33(16):2583–5. https://doi.org/10.1093/bioinformatics/btx198.
Kurtz S, Choudhuri JV, Ohlebusch E, Schleiermacher C, Stoye J, Giegerich R. REPuter: the manifold applications of repeat analysis on a genomic scale. Nucleic Acids Res. 2001;29(22):4633–42. https://doi.org/10.1093/nar/29.22.4633.
Frazer KA, Pachter L, Poliakov A, Rubin EM, Dubchak I. VISTA: computational tools for comparative genomics. Nucleic Acids Res. 2004; 32(Web Server issue):W273–W279. doi:https://doi.org/10.1093/nar/gkh458.
Thiel T, Michalek W, Varshney RK, Graner A. Exploiting EST Databases for the development and characterization of gene-derived SSR-markers in barley (Hordeum vulgare L.). Theor Appl Genet 2003; 106(3):411–422. doi:https://doi.org/10.1007/s00122-002-1031-0.
Zhang D, Gao F, Jakovlic I, Zou H, Zhang J, Li WX, Wang GT. PhyloSuite: An integrated and scalable desktop platform for streamlined molecular sequence data management and evolutionary phylogenetics studies. Mol Ecol Resour. 2020;20(1):348–55. https://doi.org/10.1111/1755-0998.13096.
Rozewicki J, Li S, Amada KM, Standley DM, Katoh K. MAFFT-DASH: integrated protein sequence and structural alignment. Nucleic Acids Res. 2019;47(W1):W5–w10. https://doi.org/10.1093/nar/gkz342.
Tamura K, Stecher G, Peterson D, Filipski A, Kumar S. MEGA6: molecular evolutionary genetics analysis version 6.0. Mol Biol Evol. 2013;30(12):2725–9. https://doi.org/10.1093/molbev/mst197.
Amiryousefi A, Hyvonen J, Poczai P. IRscope: an online program to visualize the junction sites of chloroplast genomes. Bioinformatics. 2018;34(17):3030–1. https://doi.org/10.1093/bioinformatics/bty220.
Stamatakis A. RAxML version 8: a tool for phylogenetic analysis and post-analysis of large phylogenies. Bioinformatics. 2014;30(9):1312–3. https://doi.org/10.1093/bioinformatics/btu033.
Acknowledgements
The authors are grateful to the technical support provided by Novogene (Tianjin).
Funding
This work was supported by the National Natural Science Foundation of China [31772260] and Chongqing Study Abroad Innovation Project [cx2019052]. The funders were not involved in the study design, data collection, and analysis, decision to publish, or manuscript preparation.
Author information
Authors and Affiliations
Contributions
JieY conceived the study and designed experiments; JingY collected the samples and extracted DNA for sequencing by using the Illumina platform; FH assembled and annotated the cp genomes; JMT, SYZ and JLL carried out the comparative chloroplast analysis; JLL drafted the manuscript. All authors have read and approved the final manuscript.
Corresponding author
Ethics declarations
Ethics approval and consent to participate
The four collected Pilea species are widely distributed in China as ornamental plants. Experimental researches do not include the genetic transformation, preserving the genetic background of the species used, and any other processes requiring ethics approval.
Consent for publication
Not applicable.
Competing interests
The authors declare that they have no competing interests
Additional information
Publisher’s Note
Springer Nature remains neutral with regard to jurisdictional claims in published maps and institutional affiliations.
Supplementary Information
Additional file 1: Table S1.
Summary of sequencing data quality. Table S2. Gene composition in the plastid genomes of Pilea. Table S3. Statistics on simple sequence repeats (SSRs) in the 4 plastid genomes. Table S4. Repeats (> = 30 bp) identified in the four Pilea species. Table S5. Percentages of variable sites and Indels in orthologous genes among the 4 Pilea species. Table S6. The dS, dN and dN/dS values in 79 shared genes among 4 Pilea species. Table S7. List of plastid genomes used for phylogenetic analysis. Table S8. Summary information of the plant samples.
Rights and permissions
Open Access This article is licensed under a Creative Commons Attribution 4.0 International License, which permits use, sharing, adaptation, distribution and reproduction in any medium or format, as long as you give appropriate credit to the original author(s) and the source, provide a link to the Creative Commons licence, and indicate if changes were made. The images or other third party material in this article are included in the article's Creative Commons licence, unless indicated otherwise in a credit line to the material. If material is not included in the article's Creative Commons licence and your intended use is not permitted by statutory regulation or exceeds the permitted use, you will need to obtain permission directly from the copyright holder. To view a copy of this licence, visit http://creativecommons.org/licenses/by/4.0/. The Creative Commons Public Domain Dedication waiver (http://creativecommons.org/publicdomain/zero/1.0/) applies to the data made available in this article, unless otherwise stated in a credit line to the data.
About this article

Cite this article
Li, J., Tang, J., Zeng, S. et al. Comparative plastid genomics of four Pilea (Urticaceae) species: insight into interspecific plastid genome diversity in Pilea. BMC Plant Biol 21, 25 (2021). https://doi.org/10.1186/s12870-020-02793-7
Received:
Accepted:
Published:
DOI: https://doi.org/10.1186/s12870-020-02793-7