
Abstract
Background
Understanding the genetic diversity in endangered species that occur inforest remnants is necessary to establish efficient strategies for the species conservation, restoration and management. Panax vietnamensis Ha et Grushv. is medicinally important, endemic and endangered species of Vietnam. However, genetic diversity and structure of population are unknown due to lack of efficient molecular markers.
Results
In this study, we employed Illumina HiSeq™ 4000 sequencing to analyze the transcriptomes of P. vietnamensis (roots, leaves and stems). Raw reads total of 23,741,783 was obtained and then assembled, from which the generated unigenes were 89,271 (average length = 598.3191 nt). The 31,686 unigenes were annotated in different databases i.e. Gene Ontology, Kyoto Encyclopedia of Genes and Genomes, Nucleotide Collection (NR/NT) and Swiss-Prot for functional annotation. Further, 11,343 EST-SSRs were detected. From 7774 primer pairs, 101 were selected for polymorphism validation, in which; 20 primer pairs were successfully amplified to DNA fragments and significant amounts of polymorphism was observed within population. The nine polymorphic microsatellite loci were used for population structure and diversity analyses. The obtained results revealed high levels of genetic diversity in populations, the average observed and expected heterozygosity were HO = 0.422 and HE = 0.479, respectively. During the Bottleneck analysis using TPM and SMM models (p < 0.01) shows that targeted population is significantly heterozygote deficient. This suggests sign of the bottleneck in all populations. Genetic differentiation between populations was moderate (FST = 0.133) and indicating slightly high level of gene flow (Nm = 1.63). Analysis of molecular variance (AMOVA) showed 63.17% of variation within individuals and 12.45% among populations. Our results shows two genetic clusters related to geographical distances.
Conclusion
Our study will assist conservators in future conservation management, breeding, production and habitats restoration of the species.
Background
Panax species (Araliaceae) are medicinally important plants of North America and eastern Asia [1, 2]. In 19 species of the Panax genus [3, 4], three known species, Panax vietnamensis, P. stipuleanatus and P. bipinatifidus are related to the high mountains of Vietnam [5, 6]. Panax species are characterized by the presence of ginsenosides, which refer to a series of dammarane [7]. P. vietnamensis was found for the first time in Ngoc Linh mountain of Kon Tum province [8]. P. vietnamensis (Vietnamese Ginseng) is an endemic species of Vietnam, rich in saponin compound [1, 8, 9]. It is a perennial plant and grows up to 1 m in height, with a diameter of 4–8 mm under humus forest canopy. It has oval-shaped leaves with a serrated margin. The flowers are an inflorescence and fruit turn red at maturity with 1–2 white color seeds. P. vietnamensis is routinely used for the treatment of many serious diseases and enhancement of body stamina during mountainous journeys by the Sedang ethnic group [1]. Excessive exploitation in the past few decades and slow growth rate, poor regeneration of P. vietnamensis, the natural population sharply declines and put the species in endangered [10]. Therefore, it is listed in in the Vietnam Red Data Book 2007 (EN A1a,c,d, B1 + 2b,c,e) [11]. It is currently in the protection list of both the central and local governments of Vietnam. It needs urgent conservation and restoration, but main hurdle is the unexplored structure and genetic diversity of the P. vietnamensis wild populations due to unavailability of informative and reliable molecular markers for P. vietnamensis.
Simple sequence repeats (SSRs) markers are useful tools for research in plant genetics, breeding, identification of individuals, species and varieties, and to generate genetic maps because of the allelic sequence diversity as they are widely spread in the genome and have high levels of the polymorphism, co-dominant inheritance, abundance, maximum reproducibility, multi-allelic variation, and good genome coverage [12,13,14,15,16,17,18]. The expressed sequence tags (EST) availability, enhanced SSR identification possibility in some woody plants [19]. As a functional molecular marker, SSRs generated from expressed sequence tags (EST-SSRs) can investigate the effects of environmental heterogeneity and local adaptation due to its tight linkage with functional genes controlling phenotype [20,21,22]. Up till now numbers of EST-SSRs developed and checked for polymorphism in many species, such as sweet potato [23], Sesamum indicum [24], radish [25], Cymbidium sinense [26], Chinese bayberry [27], Silver fir [28], Salix, Populus, Eucalyptus [29]; Rosa roxburghii [30], Neottopteris nidus [16], Lacquar tree [31], Bread wheat [32], Proso Millet [33], Almond [34] and Ginseng [35]. Limited genomic resources have been developed for Panax species so far, e.g., P. vietnamensis var. fuscidiscus [2], P. ginseng [35, 36] as compared to other crop.
Illumina HiSeq™ 4000 is a new-generation method to permit a comprehensive analysis in the gene expression profile, have provided fascinating opportunities in life sciences and facilitated transcriptomes sequencing at low-cost and rapid identification of EST-SSRs [16, 22, 25, 26, 34, 35, 37,38,39]. Transcriptomes de novo assembly is indispensable for functional genomics or markers mining in non-model plants study, especially when genome sequence is not available [16, 23, 30, 37,38,39]. Up till now, only nucleotide sequences of P. vietnamensis var. fuscidiscus and P. ginseng in the National Center for Biotechnology Information (NCBI) database are available (August 2019), while no ESTs are available in GenBank for P. vietnamensis. Previous studies investigated the genetic variation and verified the taxonomic status of the Panax species at the molecular level [40,41,42,43,44,45,46,47,48,49]. However, few researchers studied the P. vietnamensis in Vietnam [50,51,52].
In the current study, (i) we have produced global transcriptome from P. vietnamensis using the Illumina HiSeq™ 4000 and analyzed functions, classification and metabolic pathways of the resulting transcripts. (ii) Then we have developed a set of EST-SSRs for P. vietnamensis and (iii) confirmed the efficacy of these markers by studying the genetic structure and diversity of three wild populations of P. vietnamensis. (iv) At last, the influences of geographical distance on genes flow within wild population were tested.
Results
De novo assembly and Illumina sequencing of P. vietnamensis transcriptomes
Transcriptome sequencing of P. vietnamensis, a total of 7,083,775,547 bases were generated and after a stringent quality check 23,741,783 paired-end, high quality, clean reads were obtained with 97.52% Q20 and 93.5% Q30 bases, while the GC contents were 51.43%. De novo assembly was further checked through Trinity and as a result, 153,074 transcripts with 117,954,630 bp were detected, while N50 value was1,268 bp with an average length of 770.572 bp. Among total number of transcripts, 48,314 (31.56%) transcripts were between 200 and 300 bp; 35,174 (22.98%) transcripts ranged from 301 to 500 bp; 32,031 (20.93%) transcripts ranged from 501 to 1000 bp; 25,800 (16.85%) transcripts ranged from 1001 to 2000 bp and 11,755 (7.68%) transcripts were larger than 2000 bp. Meanwhile, the assembly produced 89,271 unigenes having a N50 length of 942 bp (average length = 598.319 bp) were assembled and retained for analyses. In these unigenes 39,947 (44.75%) were between 200 and 300 bp; 22,049 (24.70%) ranged from 301 to 500 bp; 13,669 (15.31%) ranged from 501 to 1000 bp; 9048 (10.14%) ranged from 1001 to 2000 bp and 4558 (5.11%) were larger than 2000 bp (Fig. 1, Table 1).

Distribution of unigenes lengths resulting from de novo transcriptome assembly of P. vietnamensis
Functional annotation of assembled unigenes
For functional annotation analyses the unigenes were blasted against the seven databases (COG, GO, KEGG, KOG, Pfam, Swissprot and NR), a total 31,686 matched sequences was found (Table 2). Among the 89,271 unigenes, resulted successful annotation of 7647 (8.57%) in the COG databases, 14,568 (16.32%) in the GO database, 5838 (5.42%) in KEGG database, 16,860 (18.89%) in KOG database, 18,600 (20.845) in Pfam, 19, 228 (21.54%) in the Swiss-Prot protein database and 16,659 (18.66%) unigenes in the NR protein database (Table 2). For the species distribution BLASTx was used to search against Nr databases, the P. vietnamensis transcriptome shows highest similarities with Elaeis guineensis (25%) followed by Phoenix dactylifera (22%) and Musa acuminata (9%) (Fig. 2).

Distribution of species search of unigenes against the Nr database
Based on Nr annotations, we used the GO system to categorize the possible functions of the unigenes. A total of 72,183 (80.86%) unigenes was successfully grouped into three classes (biological process, molecular function and cellular component) and 51 subclasses (Fig. 3). The biological process was the top category (28,653; 39.69%), while subcategories were “metabolic process” (8016; 27.98%) “cellular process” (7528; 26.27%) and “response to stimulus” (2347; 8.19%). The cellular component unigenes were 27,232 (37.72%), classified into “cell part” (6645; 24.40%) “cell” (6596; 24.22%) and “organelle” (5269; 19,35%). The 16,298 (22.58%) unigenes were related to “molecular function” in which prominent subcategories are “binding” (7459; 45.77%) and “catalytic activity” (7130; 43.75%). It was also observed that the few genes are enriched in the terms of “nutrient reservoir activity”, “molecular carrier activity”, “protein tag” and “translation regulator activity”.

Gene Ontology classification of unigenes
A total of 7647 unigenes were assigned to Clusters of Orthologous Groups (COG), to check the reliability of the transcriptome library and effectiveness of the annotation process, for functional prediction and classification (Fig. 4). COG-annotated putative proteins were functionally classified into 25 categories. The top groups were “general function prediction only” (9089), “translation, ribosomal structure and biogenesis” (3388) and “transcription” (977), respectively. However, only few unigenes were annotated as “extracellular structures” and “nuclear structure.”

Clusters of orthologous groups (COG) classification
The KEGG pathway analysis was used to explore the biological pathways in P. vietnamensis that might be active with an E value cutoff < 10− 5. The 5838 unigenes was significantly matched in the KEGG database and assigned to 118 KEGG functional pathways (Fig. 5). The specific pathways, including plant hormone signal transduction, purine metabolism, ribosome, RNA transport spliceosome and many more pathways. In addition, 45 unigenes were in the terpenoid backbone biosynthesis pathway.

Clusters of orthologous groups KEGG classification
EST-SSR markers development and characterization from the P. vietnamensis transcriptome
To develop new molecular markers and to check the assembly quality, the 89,271 unigenes were used for microsatellites mining that were well-defined as di- to hexa-nucleotide motifs. The SSRIT was used and identified 11,343 EST-SSRs. The 6949 sequences contained one SSR, while 2763 sequences have more than one SSR. The EST-SSRs frequency was 12.71%, and one EST-SSRs distribution density was 5.98 kilobases (kb) in the unigenes.
The potential EST-SSRs were analyzed for frequency, type, and distribution. The most common repeat motif was mono-nucleotide (5004; 44.12%), followed by di-nucleotide (4648; 40.98%), tri-nucleotide (1563; 13.78%), tetra-nucleotide (66; 0.58%), hexa-nucleotide (29; 0.26%), and penta-nucleotide (32; 0.28%) repeats (Fig. 6; Table 3). EST-SSRs with ten repeat motifs (2040; 20.50%), six repeat motifs (1363; 12.02%), five repeat motifs (925; 8.15%), seven repeat motifs (862; 7.6%), eight repeat motifs (594; 5.24%), and nine repeat motifs (428; 3.77%) were the most common, respectively. The dominant motif in di-nucleotide repeats was AG/TC (90.06%), followed by AT/TA (5.34%) and AC/TG (4.43%). In type 10 of tri-nucleotide repeats, the highest motif distribution was CCG/GGC (22.65%), while the common motif in tetra-nucleotide repeats was ACTG/TGAC (19.30%) (Fig. 7). Additionally, 16 and 17 different types of penta and hexa-nucleotides repeats of EST-SSRs were detected, respectively.

Distribution type of EST-SSRs of P. vietnamensis

Percentage of different motifs in di-nucleotide (a), tri-nucleotide (b), and tetra-nucleotide (c) repeats in P. vietnamensis
Genetic structure and diversity of population
A total of 98 individuals from three P. vietnamensis populations produced 27 different alleles, ranging from 120 to 265 bp at the nine loci (Table 4). In the current study, the polymorphism information content (PIC) value ranged from 0.325 (L111) to 0.493 (L145), with an average of 0.361. The number of detected alleles per locus (A) in overall 98 individuals ranged from two at two loci (L119 and L145) to four at two loci (L37 and L111) with an average value of three. The lowest detected heterozygosity (HO) was found at locus L73 (0.178) and the highest at locus L111, with an average of 0.422. Similarly, the lowest expected heterozygosity (HE) was recorded for locus L73 (0.208) and the highest for locus L37 (0.65), with an average of 0.479. The value of fixation index (F) in overall population for each locus, average 0.14, ranging from − 0.185 (L111) to 0.386 (L115).
At population level, the values of genetic diversity are shown in Table 5, including the alleles mean number (A = 2.6), the effective alleles numbers (AE = 2.2), the proportion of polymorphic loci (92.59%), the observed heterozygosity (HO = 0.422) and expected heterozygosity (HE = 0.479). The fixation index (F) was positive for all the populations (F = 0.13). Therefore, these results showed heterozygosity deficiency and significant inbreeding (p < 0.05). Seven loci of the nine loci had positive fixation and indicating high homozygosity and inbreeding. However, among the loci, five loci had significant inbreeding (p < 0.05). Two loci had negative values.
During the Bottleneck analysis using Stepwise mutation model (SMM) and two phase model (TPM) models (p < 0.01) shows that targeted population is significantly heterozygote deficient (Table 5). This suggests sign of the bottleneck in all population.
The analysis of molecular variance (AMOVA) showed that total variation was highly significant (p < 0.001) within individuals i.e. 63.17% (Table 6). The FST were significant (p < 0.05), values range was from 0.072 to 0.182 (average = 0.133) and with 1.63 gene flow. Low genetic differentiation value (FST = 0.072) was found between DT and TN population, while high value (FST = 0.182) was between DT and KT population (Table 7).
The genetic relationship of P. vietnamensis populations are expressed in Fig. 8. The DT and TN populations were grouped together and firmed one cluster with the bootstrap value of 100%. In the STRUCTURE analysis, the highest ∆K value (2032.81) (Fig. S1) for 98 individuals revealed K = 2 to be the optimum number of genetic clusters and indicated that all the studied plants exhibited admixture from two clusters. The percentage of ancestry of each population and individuals in two genetic groups shows that one group (red) was predominant in two populations (DT and TN) and second group (green) was predominant in one population i.e. KT (Fig. 9).
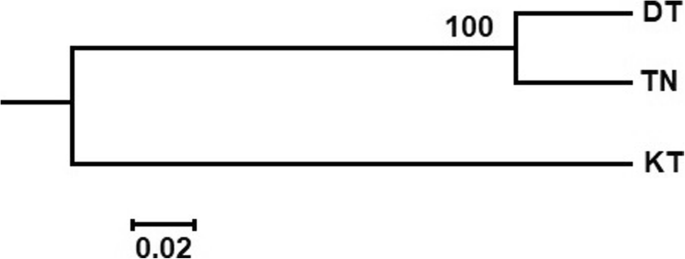
UPGMA dendrogram based on Nei’s chord distance of genetic relationship among three P. vietnamensis populations

Bar plot of admixture assignment for three P. vietnamensis populations to cluster (K = 2) based on Bayesian analysis
Discussion
Transcriptome sequencing/analysis is very effective tool for gene identification [53,54,55,56] and to identify gene expression at different developmental stages or physiological conditions of a cell [47]. Illumina HiSeq™ 4000 technology is effective, timeless, affordable, trusty tool for transcriptome description and gene detection in non-model plants as well. Previous studies showed that the numbers of ESTs were generated from P. ginseng leaves [48, 57], P. notoginseng roots [58] and American ginseng (P. quinquefolius L.) flowers, leaves and roots [44]. To date, many researchers have studied the molecular markers for the genetic analysis of Panax species i.e. P. ginseng [40,41,42, 46, 48, 49], P. notoginseng [45]. However, due to unavailability of reference genome for P. vietnamensis, using Illumina HiSeq™ 4000 the produced reads were assembled through the de novo assembler Trinity. For the first time, we have reported comprehensive transcriptional information for the EST-SSR markers development and then explored the diversity and genetic structure of existent natural P. vietnamensis populations.
Illumina paired-end sequencing technology generated 23,741,783 clean and high quality reads with 93.5% Q30 bases and GC content 51.43%. The current results is higher than the previous study [2] on P. vietnamensis var. fuscidiscus (43.25%), indicating better quality sequencing. In the sequence assembly 89,271 unigenes (average length = 598.32 bp, N50 = 942 bp) were recorded, which was shorter than the results of Cao et al. [47] in P. ginseng (average length = 690–698 bp, N50 = 1130–1161 bp) and Zhang et al. [2] in P. vietnamensis var. fuscidiscus (average length = 1304 bp, N50 = 2018 bp). We had used the same technology; this might be the depth of sequencing, method of assembly and natural features of the plants. The transcriptome sequencing data of P. vietnamensis was further explored for genetic diversity, population structure and marker development. The 72,183 (80.86%) unigenes were annotated into 51 GO categories. The “metabolic activities”, “binding” and “cell part” was on the top among biological activities, molecular function and cellular component, respectively. The results are in line with GO functional categories of P. vietnamensis var. fuscidiscus [2] and P. ginseng [47]. The predicted unigenes 5838 (5.42%) through KEGG pathways were mapped into 118 biological pathways and majority of pathways were related to metabolism. The specific pathways, including ribosome, RNA transport spliceosome, purine metabolism and signal transduction of plant hormone etc. These data unveil the active metabolic processes as well as synthesis of multifarious metabolites in the species. In P. vietnamensis and other Panax species, leaves have high value of aldehydes, esters and terpenoids, these compound help in resistance against biological as well as environmental pressures, such as cold, drought and pests. In the current study, we have recorded the unigenes for signal transduction of the plant hormones that reacts to plant environmental conditions.
Microsatellites are spread in plant genomes and involved in the regulation of their expression and function [13, 59]. The studies on distribution of SSRs in species, the mechanism of SSR variation and comparison are the first step towards elucidation of the function [59, 60]. There are many types of SSR markers and extensively spread in plant genomes [43, 61]. From 8927 unigenes, 11,343 EST-SSR molecular markers were identified by RNA sequencing, while 2763 unigenes have EST-SSR locus more than one. Zhang et al. [2] also identified 21,320 SSRs in P. vietnamensis var. fuscidiscus with 2918 containing more than one SSR. In the previous studies of Um et al. [49] on P. ginseng and Zhang et al. [2] on P. vietnamensis var. fuscidiscus in EST-SSRs di-nucleotide repeats (60.1 and 52.25%, respectively) were the most abundant type. We have identified SSR markers (11,343) of P. vietnamensis, the mono-nucleotide (5004; 44.12%), di-nucleotide (4648, 40.98%) and tri-nucleotide (1563, 13.78%) were the top repeats. The leading was di-nucleotide, tri-nucleotide, tetra-nucleotide repeat motif in P. vietnamensis with AG/TC (90.06%), CCG/GGC (22.65%), ACTG/TGAC (19.30%), respectively. Which confirmed the study of Um et al. [49] on P. ginseng, but tri-nucleotide repeat motif was different in P. vietnamensis than other plants, such as Myricarubra [27], Salix, Populus and Eucalyptus [29]. The CG/CG motif (0.17%) was irregularly detected in P. vietnamensis, as also observed by Wu et al. [44], which confirmed that the repeat motif CG/CG is not common in numerous dicotyledon plants [62,63,64,65].
Genetic diversity has important character in the germplasm improvement and generally used in various medicinal plants [65,66,67,68]. The genetic diversity degree in many plants can be linked with the numbers of loci and populations [31, 69], the geographical range size [70] and genetic exchange [71]. In the current research, the nine SSR markers showed a high degree of genetic diversity in P. vietnamensis populations and expected heterozygosity (HO = 0.422 and HE = 0.479) compared to some Panax species, such as P. stipuleanatus [50], P. ginseng [72, 73] However, our results are in line with studies of Reunova et al. [46] on P. ginseng, the natural species of Russia (HO = 0.453 and HE = 0.393), Liu et al. [74] on P. notoginseng (HE = 0.350) and Reunova et al. [75] on P. vietnamensis (HE = 0.55) using microsatellite markers. High levels of genetic diversity in three P. vietnamensis populations, TN, DT and KT indicated that this species is predominantly outcrossed. High gene flow (Nm > 1) may be a consequence of high outcrossing rates in the three populations. Dispersal of pollen grains by insects might be considered as a major factor for this species. Positive fixation index values were detected in all P. vietnamensis populations and showed a deficit of heterozygosity due to inbreeding. This suggests small neighborhood size and mattings between siblings within populations. Our results also showed a sign of the bottleneck in all three studied populations (p < 0.005). Significant heterozygosity deficits were detected in three populations (TN, DT and KT) under TPM and SMM (p < 0.005) models. The models suggested reduction in population size of the targeted populations.
FST is trenchant approach for measurement of gene flow in populations and genetic variation [76]. The genetic variation among P. vietnamensis populations was moderate. The low FST value between two populations (DT and TN) can facilitate strong gene flow within populations (Nm = 3.2). However, the low level of genetic variation between two populations, TN and DT (FST = 0.072) might be due to geographical distance. These two populations are located in the same province of Quang Nam. The results of AMOVA analysis also indicated that 63.17% of variation was distributed within individuals and 12.45% among individuals within populations. These results showed a moderate genetic structure of P. vietnamensis. Genetic variation among populations is highly affected by genetic drift, gene flow, mutations, selection and long-term evolution [77]. Long lived and outcrossing species maintain high degree of genetic variation in populations and low genetic differentiation in populations, reflecting maximum levels of gene flow. Previous studies reported low differentiation between populations, and reflecting strong gene flow in P. ginseng [46, 72] and P. stipuleanatus [50]. The strong gene flow among populations might be due to high outcross rates within populations. Thus, pollen grains dispersion through insects can be considered as a major factor of the population structure. The Bayesian analysis and UPGMA tree showed two different groups of genetically mixed individuals of P. vietnamensis. In the current study we had isolated population among province through geographical distance. Two populations DT and TN closed together within the province (Quang Nam) and formed a genetic cluster while the KT population in Kon Tum province was separated and formed one cluster by the geographical distance, where gene exchange between the two groups was restricted. The P. vietnamensis faced serious threats in their survival. Based on our studied results, all the studied populations can be considered for both in-situ and ex-situ conservation strategies.
Conclusions
De-novo transcriptome sequencing of P. vietnamensis was performed by the Illumina sequencing platform. We produced a large number of ESTs and identified candidate genes that differentially expressed in P. vietnamensis. A total of 11,343 EST-SSRs was identified. It is obvious from the data that the natural populations of P. vietnamensis maintained high level of genetic diversity. Numerous SSR markers were identified and will contribute to marker-assisted breeding of P. vietnamensis. This study does not only provide ground for P. vietnamensis breeding but also a platform for its conservation, to maintain genetic diversity.
Methods
Plant material
We had collected samples (roots, leaves and stems) in liquid nitrogen of P. vietnamensis (Fig. 10a) from a wild population (Quang Nam province) for RNA extraction stored at − 80 °C. P. vietnamensis (ten plants) wild population (Quang Nam province) was used for EST-SSRs development to test the amplification relevancy of the synthesized EST-SSR primers (Table 8). Three different wild populations (98 Plants) of P. vietnamensis were sampled to assess structure and genetic diversity (Fig. 10b, Table 8). The wild population of P. vietnamensis was sampled during spring and summer 2019, respectively. For DNA extraction fresh leaves were desiccated in silica gel. This species was identified by Dr. Nguyen Thi Phuong Trang as Panax vietnamensis Ha et Grushv (percent identify: 100%) based on the morphology characteristics, and it was further confirmed by the sequence data of the nuclear gene (ITS-rDNA) with Genbank accession number MH238443. The permission for samples collection in Quang Nam and Kon Tum provinces (Letter No.123/QĐ-STTNSV dated February 20, 2019 and Letter No. 819/QĐ-STTNSV dated May 10, 2019) were granted by Institute of Ecology and Biological Resources (IEBR) and further confirmed from people committee of Quang Nam and Kon Tum provinces. The voucher specimens of this species were saved in Dept. of Molecular Systematics and Conservation Genetics, Institute of Ecology and Biological Resources (IEBR), Vietnam Academy of Science and Technology.

The Leaves, Stem, Roots (a) and adult Plant (b) of P. vietnamensis in Quang Nam province, Vietnam. Photographs by Dinh Duy Vu
RNA extraction
Total RNA was extracted from each sample (roots, leaves and stems) by the OmniPlant RNA Kit (DNase I) for Illumina sequencing. RNA quality and quantity were validated by Nanodrop and 1.2% agarose gel electrophoresis [18]. Total RNA (equal amount of each sample) was pooled together and sent to Breeding Biotechnologies Co., Ltd., for transcriptome sequencing using Illumina HiSeq™ 4000.
Transcriptome sequencing and De novo assembly
Cleaned mRNA was used for cDNA library construction extracted from 200 μg of total RNA using Oligo (dT). The cDNA 1st strand was prepared from random hexamers using mRNA as a template and the other strand was from buffer, dNTPs, RNase H and DNA polymerase I, and then cleaned with AMPure XP beads. The cleaned double-stranded cDNA was subjected to terminal repair, the sequencing linker was ligated and then the fragment size was selected with AMPure XP beads. The cDNA library was acquired by PCR enrichment. After library validation on a BioAnalyzer (Agilent 2100), Breeding Biotechnologies Co., Ltd. sequenced the cDNA libraries on a MiSeq (Illumina HiSeq™ 4000).
The Trimmomatic v3.0 [78] was used for raw reads filtration. The reads showing adaptor contamination, length < 36 bp and low quality value (quality < 20) higher than 15% were eliminated. Trinity [79] with default parameters were used for de novo assembly of the cleaned reads. Then the TIGR Gene Indices clustering tool (TGICL) v2.1 [80] was used to cluster and eradicate redundant transcripts, and identified unigenes for further analysis.
Annotation and functional classification
For functional annotation, all unigene sequences were compared with NCBI non-redundant (NR) protein sequences [81], Swiss-Prot [82], Gene Ontology (GO) [83], Clusters of Orthologous Groups (COG) [84], KOG [85] and KEGG [86] databases using BLAST software [87] to predict the amino acids. The sequence was then aligned using the HMMER software [88] with the Protein family (Pfam) [89] database to obtain Unigene annotation information.
Development, detection of EST-SSR markers and primer design
The assembled P. vietnamensis transcriptome was mined by MISA (Microsatellite identification tool) for markers. The candidate SSRs from 2 to 6 nucleotides range were defined as for dinucleotides, 6 repeats and for all higher order motifs, 5 repeats, according to Jurka and Pethiyagoda [90]. The end-to-end EST-SSRs (interruptions < 100 bp) were considered as compound EST-SSRs. Different nucleotide repeats distribution within UTRs and ORFs in unigenes were analyzed. The annotated SSR-rich unigenes, GO analysis was performed to evaluate its significance. Primer 5.0 [91] at default settings was used for ETS-SSR primers designing to generate PCR products in 100–300 bp size. The primer length was 18–24 bp with an optimum of 20 bp, annealing temperature between 55 and 65 °C with an optimum of 60 °C. A polymorphic maximization criterion was used for the selection of polymorphic loci. For polymorphism maximization, for dinucleotides, trinucleotides and tetranucleotides, SSR loci with minimum ten, seven and five repeats were selected, respectively. Reactions were executed in 25 μl volume, 2 μl of genomic DNA (10 ng total), 12.5 μl Master Mix 2X, 1 μl of each 10 μM primer and 9.5 μl H2O deionized. The cycling conditions were 95 °C for 3 min, then 35 cycles of 94 °C for 45 s, 60 °C for 45 s, 72 °C for 45 s, and 72 °C for 10 min at final extension. The PCR products were separated, determined and analyzed according to Vu et al. [18].
Population genetic analysis
To evaluate population structure and genetic diversity of P. vietnamensis precisely, 101 polymorphic SSR markers were carefully chosen and 20 primer pairs were successfully amplified for DNA fragments. Among the selected SSR markers, nine markers had clear and reproducible profiles, and were selected for study (Table 2). DNA isolation kit (Norgenbiotek, Canada) was used for genomic DNA extraction. The samples were crushed by Mixer mill MM 400 (Retsch) in liquid nitrogen. DNA quality and concentration were validated according to Vu et al. [18]. The concentration was then diluted to 10 ng/μl.
PCR was executed in 25 μl volume including 2 μl of genomic DNA (total 10 ng), 12.5 μl Master Mix 2X, 1 μl of each 10 μM primer, and 9.5 μl H2O deionized. The reaction was amplified in the thermal cycler conditions: an initial denaturing at 94 °C for 3 min, 40 cycles for 1 min at 94 °C, 30s at 54-56 °C annealing temperature for primer pair (each) and 1 min extension at 72 °C and 10 min at 72 °C for final cycle before holding the samples at 4 °C till analysis. The Sequi-Gen®GT DNA electrophoresis system were used for amplification products separation with 8% polyacrylamide gels in 1 x TAE buffer and then visualized by GelRed™ Nucleic Acid Gel Stain. Alleles size was detected by Gel-Analyzer software of GenoSens 1850 (Clinx Science Instruments Co., Ltd) with a 20 bp DNA ladder (Invitrogen).
Genetic parameters were analyzed on the GenAlEx [92], with the proportion of polymorphic loci (P), effective alleles (AE), the number of alleles per locus (A). Observed heterozygosities (HO), expected heterozygosities (HE), the fixation index (F), the differentiation index between pairwise populations (FST), the matrix of FST between various populations and gene flow (Nm) was calculated by the formula Nm = [(1/Fst) - 1]/4 [93] Polymorphism information content (PIC) value was calculated according to Botstein et al. [94] Tests for deviation from Hardy-Weinberg equilibrium at the locus (each) and disequilibrium in the linkage for each locus pairwise combination in each population were performed by Genepop v.4.6 [95]. Testing of recent bottleneck events for population (each) via the SSM and TPM were tested using Botteneck v.1.2 [96]. The significance of these tests was measured by the one-tailed Wilcoxon signed rank test. The proportion of the SSM was set to 70% under default settings. The genetic distances among populations were also calculated using GenAlEx. The significance of FST values in each population pair across all loci was tested by applying the sequential Bonferroni correction.
The data were subjected to AMOVA using Arlequin 3.1 and significance test was applied on a basis of 10,000 permutations [97]. The UPGMA approach was used to determine the genetic association among population by Poptree2 [98]. STRUCTUREv.2.3.4 was used to explore population structure with Bayesian clustering approach [99]. The admixture model was set with correlated allele frequencies i.e. in the data set (K), in different groups, ten separate runs were employed for K within 1 and 15 at 500,000 Markov Chain Monte Carlo (MCMC) repetitions and at 100,000 burn–in the period. Structure Harvester [100] was used for the group (number) detection that best fits in the dataset based on the ∆K according to Evanno et al. [101].
Availability of data and materials
The data charts supporting the results and conclusions are included in the article and additional files. Partial cds the SSR sequences data have been deposited inthe NCBI under accession number from MK802095 to MK802103 (https://www.ncbi.nlm.nih.gov/).
Abbreviations
- AMOVA:
-
Analysis of molecular variance
- COG:
-
Clusters of orthologous groups
- EST-SSRs:
-
Expressed sequence tag-simple sequence repeat
- GO:
-
Gene ontology categories
- KEGG:
-
Kyoto encyclopedia of genes and genomes pathways
- UPGMA:
-
Unweighted pair group method of arithmetic average
- SSM:
-
Stepwise mutation model; TPM: two phase model
References
Nhut DT, Hai NT, Huy NP, Chien HX, Nam NB. New achievement in Panax vietnamensis research. Biotechnol Neglected Underutilized Crop. 2013:43–57.
Zhang GH, Ma CH, Zhang JJ, Chen JW, Tang QY, He MH, Xu XZ, Jiang NH, Yang SC. Transcriptome analysis of Panax vietnamensis var fuscidicus discovers putative ocotillol-type ginsenosides biosynthesis genes and genetic markers. BMC Genomics. 2015;16:159.
Pandey AK, Ali MA. Intraspecific variation in Panax assamicus ban. Populations based on internal transcribed spacer (ITS) sequences of nrDNA. Indian J Biotech. 2012;11:30–8.
Momang TM, Das AP, Tag H. A new species of Panax L. (Araliaceae) from Arunachal Pradesh, India. Pleione. 2018;12(2):315–21.
Ho PH. An illustrated Flora of Vietnam. Tome II. Fascicule. 2002;2:640–1.
Tap N. The species of Panax L. in Vietnam. J Med Mater. 2005;10:71–6.
Kim DH. Chemical diversity of Panax ginseng, Panax quinquifolium, and Panax notoginseng. J Ginseng Res. 2012;36(1):1–15.
Ha TD, Grushvitzky IV. New species in Panax (Araliaceae) in Vietnam. J Botany. 1985;70:518–22.
Tran LQ, Adnyana IK, Tezuka Y, Harimaya Y, Saiki I, Kurashige Y, Tran KQ, Kadota S. Hepatoprotective effect of majonoside R2, the major saponin from Vietnamese ginseng (Panax vietnamensis). Planta Med. 2002;68:402–6.
Chu DH, Le HL, Nguyen VK, Le TD, Do MC, Hoang TT, Duong TN. Panax vietnamensis: Avalueable national medical plant in Vietnam. Vietnam J Sci Technol. 2018;1:33–5 (in Vietnamese).
MOST, VAST. Vietnam red data book, part II. plants. Pub Sci Tech. 2007. (in Vietnamese).
Gur-Arie R, Cohen CJ, Eitan Y, Shelef L, Hallerman EM, Kashi Y. Simple sequence repeats in Escherichia coli: abundance, distribution, composition, and polymorphism. Genome Res. 2000;10:62–71.
Li YC, Korol AB, Fahima T, Nevo E. Microsatellites within genes: structure, function, and evolution. Mol Biol Evol. 2004;21:991–1007.
Kalia RK, Rai MK, Kalia S, Singh R, Dhawan AK. Microsatellite markers: an overview of the recent progress in plants. Euphytica. 2011;177:309–34.
Kameyama Y. Development of microsatellite markers for Cinnamomum camphora (Lauraceae). Am J Bot. 2012;99:e1–3.
Jia X, Deng Y, Sun X, Liang L, Su J. De novo assembly of the transcriptome of Neottopteris nidus using Illumina paired-end sequencing and development of EST-SSR markers. Mol Breed. 2016;36:94.
Vieira MLC, Santini L, Diniz AL, Munhoz CF. Microsatellite markers: what they mean and why they are so useful. Gene Mol Biol. 2016;39:312–28.
Vu DD, Bui TTX, Nguyen MT, Vu DG, Nguyen MD, Bui VT, Huang X, Zhang Y. Genetic diversity in two threatened species in Vietnam: Taxus chinensis and Taxus wallichiana. J For Res. 2017;28(2):265–72.
Kaur S, Pembleton LW, Cogan NOI, Savin KW, Leonforte T, Paull J, Materne M, Forster JW. Transcriptome sequencing of field pea and faba bean for discovery and validation of SSR genetic markers. BMC Genomics. 2012;13:104.
Kumari K, Muthamilarasan M, Misra G, Gupta S, Subramanian A, Parida SK, Chattopadhyay D, Prasad M. Development of eSSR-markers in Setaria italica and their applicability in studying genetic diversity, cross-transferability and comparative mapping in millet and non-millet species. PLoS One. 2013;8:e67742.
Chen LY, Cao YN, Yuan N, Nakamura K, Wang GM, Qiu YX. Characterization of transcriptome and development of novel EST-SSR makers based on next-generation sequencing technology in Neolitsea sericea (Lauraceae) endemic to east Asian land-bridge islands. Mol Breed. 2015;35:1–15.
Guo R, Landis JB, Moore MJ, Meng A, Jian S, Yao X, Wang H. Development and application of transcriptome-derived microsatellites in Actinidia eriantha (Actinidiaceae). Front Plant Sci. 2017;8:1383.
Wang ZY, Fang BP, Chen JY, Zhang XJ, Luo ZX, Huang L, Chen X, Li Y. De novo assembly and characterization of root transcriptome using Illumina paired–end sequencing and development of cSSR markers in sweet potato (Ipomoea batatas). BMC Genomics. 2010;11:726.
Wei W, Qi X, Wang L, Zhang Y, Hua W, Li D, Lv H, Zhang X. Characterization of the sesame (Sesamum indicum L.) global transcriptome using Illumina paired end sequencing and development of EST-SSR markers. BMC Genomics. 2011;12:451.
Wang S, He Q, Liu X, Xu W, Li L, Gao J, Wang F. Transcriptome analysis of the roots at early and late seedling stages using Illumina paired-end sequencing and development of EST-SSR markers in radish. Plant Cell Rep. 2012;31:1437–47.
Zhang J, Wu K, Zeng S, Silva JAT, Zhao X, Tian CE, Xia H, Duan J. Transcriptome analysis of Cymbidium sinense and its application to the identification of genes associated with floral development. BMC Genomics. 2013;14:279.
Jiao Y, Jia YM, Li XW, Chai ML, Jia HJ, Chen Z, Wang GY, Chai CY, Weg EVD, Gao ZS. Development of simple sequence repeat (SSR) markers from a genome survey of Chinese bayberry (Myrica rubra). BMC Genomics. 2012;13:201.
Postolache D, Piotti A, Spanu I, Vendramin GG. Transcriptome versus genomic microsatellite markers: highly informative multiplexes for genotyping Abies alba mill. And congeneric species. Plant Mol Biol Rep. 2014;32:750–60.
He XD, Zheng JW, Zhou J, He K, Shi SZ, Wang BS. Characterization and comparison of EST-SSRs in Salix, Populus, and Eucalyptus. Tree Genet Genomes. 2015;11:820.
Yan X, Zhang X, Lu M, He Y, An H. De novo sequencing analysis of the Rosa roxburghii fruit transcriptome reveals putative ascorbate biosynthetic genes and EST-SSR markers. Gene. 2015;561:54–62.
Vu DD, Bui TTX, Nguyen THN, Zhu YH, Zhang L, Zhang Y, Huang XH. Isolation and characterization of polymorphic microsatellite markers in Toxicodendron vernicifluum (stokes) F. A. Barkley. Czech J Genet Plant Breed. 2018;54(1):17–25.
Chu Z, Chen J, Sun J, Dong Z, Yang X, Wang Y, Xu H, Zhang X, Chen F, Cui D. De Novo assembly and comparative analysis of the transcriptome of embryogenic callus formation in bread wheat (Triticum aestivum L.). BMC Plant Biol 2017;17:244.
Hou S, Sun Z, Li Y, Wang Y, Ling H, Xing G, Han Y, Li H. Transcriptomic analysis, genic SSR development, and genetic diversity of Proso millet (Panicum miliaceum; Poaceae). Appl Plant Sci. 2017;5(7):1600137.
Zhang L, Yang X, Qi X, Guo C, Jing Z. Characterizing the transcriptome and microsatellite markers for almond (Amygdalus communis L.) using the Illumina sequencing platform. Hereditas. 2018;155:14.
Yang BW, Hahm YT. Transcriptome analysis using de novo RNA-seq to compare ginseng roots cultivated in different environments. Plant Growth Regul. 2018;84(1):149–57.
Nguyen VD, Ramchiary N, Choi SR, Uhm TS, Yang TJ, Ahn IO, Lim YP. Development and characterization of new microsatellite markers in Panax ginseng (C.a. Meyer) from BAC end sequences. Conserv Genet. 2010;11:1223–5.
Hu Z, Zhang T, Gao XX, Wang Y, Zhang Q, Zhou HJ, Zhao GF, Wang ML, Woeste KE, Zhao P. De novo assembly and characterization of the leaf, bud, and fruit transcriptome from the vulnerable tree Juglans mandshurica for the development of 20 new microsatellite markers using Illumina sequencing. Mol Genet Genomics. 2016;291:849–62.
Rajesh MK, Fayas TP, Naganeeswaran S, Rachana KE, Bhavyashree U, Sajini KK, Karun A. De novo assembly and characterization of global transcriptome of coconut palm (Cocos nucifera L.) embryogenic calli using Illumina paired-end sequencing. Protoplasma. 2016;253:913–28.
Yan LP, Liu CL, Wu DJ, Li L, Shu J, Sun C, Xia Y, Zhao LJ. De novo transcriptome analysis of Fraxinus velutina using Illumina platform and development of EST-SSR markers. Bio Plant. 2017;61(2):210–8.
Kim J, Jo BH, Lee KL, Yoon ES, Ryu GH, Chung KW. Identification of new microsatellite markers in Panax ginseng. Mol Cells. 2007;24(1):60–8.
Ma KH, Dixit A, Kim YC, Lee DY, Kim TS, Cho EG, Park YJ. Development and characterization of new microsatellite markers for ginseng (Panax ginseng C. A. Meyer). Conserv Genet. 2007;8:1507–9.
Jo BH, Suh DS, Cho EM, Kim J, Ryu GH, Chung KW. Characterization of polymorphic microsatellite loci in cultivated and wild Panax ginseng. Genet Genom. 2009;2:119–27.
Jo IH, Kim YC, Kim DH, Kim KH, Hyun TL, Ryu H, Bang KH. Applications of molecular markers in the discrimination of Panax species and Korean ginseng cultivars (Panax ginseng). J Ginseng Res. 2017;41:444e449.
Wu Q, Song J, Sun Y, Suo F, Li C, Luo H, Liu Y, Li Y, Zhang X, Yao H, Li X, Hu S, Sun C. Transcript profiles of Panax quinquefolius from flower, leaf and root bring new insights into genes related to ginsenosides biosynthesis and transcriptional regulation. Physiol Plant. 2010;138:134–49.
Liu H, Xia T, Zuo YJ, Chen ZJ, Zhou SL. Development and characterization of microsatellite markers for Panax notoginseng (Araliaceae). Am J Bot. 2011:e274–6.
Reunova GD, Koren OG, Muzarok TI, Zhuravlev YN. Microsatellite analysis of Panax ginseng natural populations in Russia. Chin Med. 2014;5:231–43.
Cao H, Nuruzzaman M, Xiu H, Huang J, Wu K, Chen X, Li J, Wang L, Jeong JH, Park SJ, Yang F, Luo J, Luo Z. Transcriptome analysis of methyl jasmonate-elicited Panax ginseng adventitious roots to discover putative ginsenoside biosynthesis and transport genes. Int J Mol Sci. 2015;16:3035–57.
Jiang P, Shi FX, Li YL, Liu B, Li LF. Development of highly transferable microsatellites for Panax ginseng (Araliaceae) using whole-genome data. Appl Plant Sci. 2016;4(11):1600075.
Um Y, Jin ML, Kim OT, Kim YC, Kim SC, Cha SW, Chung KW, Kim S, Chung CM, Lee Y. Identification of Korean ginseng (Panax ginseng) cultivars using simple sequence repeat markers. Plant Breed Biotech. 2016;4(1):71–8.
Le NT, Nguyen TM, Tran VT, Nguyen VK, Nong VD. Genetic diversity of Panax stipuleanatus Tsai in North Vietnam detected by inter simple sequence repeat (ISSR) markers. Biotechnol Biotec Eq. 2016;30(3):506–11.
Trang NTP, Mai NTH, Zhuravlev YN. Application of DNA barcoding to authentic Panax vietnamensis. Am Sci Res J Eng Techno Sci. 2017;29(1):60–7.
Manzanilla V, Kool A, Nguyen LN, Nong VH, Le TTH, Boer HJ. Phylogenomics and barcoding of Panax: toward the identification of ginseng species. BMC Evol Biol. 2018;18:44.
Zhang Y, Zhang X, Wang YH, Shen SK. De novo assembly of transcriptome and development of novel EST-SSR markers in Rhododendron rex Lévl through Illumina sequencing. Front Plant Sci. 2017;8:1664.
Li W, Zhang C, Jiang X, Liu Q, Liu Q, Wang K. De novo transcriptomic analysis and development of EST–SSRs for Styrax japonicus. Forests. 2018a;9:748.
Park S, Son S, Shin M, Fujii N, Hoshino T, Park S. Transcriptome-wide mining, characterization, and development of microsatellite markers in Lychnis kiusiana (Caryophyllaceae). BMC Plant Biol. 2019;19:14.
Taheri S, Abdullah TL, Rafi MY, Harikrishna JA, Werbrouck SPO, Teo CH, Mahbod SM, Azizi P. De novo assembly of transcriptomes, mining, and development of novel EST-SSR- markers in Curcuma alismatifolia (Zingiberaceae family) through Illumina sequencing. Sci Rep. 2019;9:3047.
Liu S, Wang S, Liu M, Yang F, Zhang H, Liu S, Wang Q, Zhao Y. De novo sequencing and analysis of the transcriptome of Panax ginseng in the leaf-expansion period. Mol Med Rep. 2016;14:1404–12.
Luo H, Sun C, Sun Y, Wu Q, Li Y, Song J, Niu Y, Cheng X, Xu H, Li C, Liu J, Steinmetz A, Chen S. Analysis of the transcriptome of Panax notoginseng root uncovers putative triterpene saponin-biosynthetic genes and genetic markers. BMC Genomics. 2011;12(Suppl 5):S5.
Li YC, Korol AB, Fahima T, Beiles A, Nevo E. Microsatellites: genomic distribution, putative functions and mutational mechanisms: a review. Mol Ecol. 2002;11(12):2453–65.
Gao CH, Tang ZL, Yin JM, An ZS, Fu DH, Li JN. Characterization and comparison of gene-based simple sequence repeats across Brassica species. Mol Genet Genomics. 2011;286(2):161–70.
Huang L, Wu B, Zhao J, Li H, Chen W, Zheng Y, Ren X, Chen Y, Zhou X, Lei Y, Liao B, Jiang H. Characterization and transferable utility of microsatellite markers in the wild and cultivated Arachis species. PLoS One. 2016;11:e0156633.
Kumpatla SP, Mukhopadhyay S. Mining and survey of simple sequence repeats in expressed sequence tags of dicotyledonous species. Genome. 2005;48:985–98.
Huang DN, Zhang YQ, Jin MD, Li HK, Song ZP, Wang YG, Chen J. Characterization and high cross-species transferability of microsatellite markers from the floral transcriptome of Aspidistra saxicola (Asparagaceae). Mol Ecol Resour. 2014;14:569–77.
Yue XY, Liu GQ, Zong Y, Teng YW, Cai DY. Development of genic SSR markers from transcriptome sequencing of pear buds. J Zhejiang Univ Sci B. 2014;15(4):303–12.
Li X, Li M, Hou L, Zhang Z, Pang X, Li Y. De novo transcriptome assembly and population genetic analyses for an endangered Chinese endemic Acer miaotaiense (Aceraceae). Genes. 2018b;9:378.
El-Domyati FM, Younis RAA, Edris S, Mansour A, Sabir J, Bahieldin A. Molecular markers associated with genetic diversity of some medicinal plants in Sinai. J Med Plants Res. 2011;5(10):1918–29.
Feng S, He R, Lu J, Jiang M, Shen X, Jiang Y, Wang Z, Wang H. Development of SSR markers and assessment of genetic diversity in medicinal Chrysanthemum morifolium cultivars. Front Genet. 2016;7:113.
Bakatoushi R, Ahmed DGA. Evaluation of genetic diversity in wild populations of Peganum harmala L., a medicinal plant. J Genet Eng Biotechn. 2018;16:143–51.
Vu DD, Bui TTX, Nguyen MD, Shah SNM, Vu DG, Zhang Y, Nguyen MT, Huang XH. Genetic diversity and conservation of two threatened dipterocarps (Dipterocarpaceae) in Southeast Vietnam. J For Res. 2019;30:1823–31.
Tam NM, Duy VD, Duc NM, Thanh TTV, Hien DP, Trang NTP, Hong NPL, Thanh NT. Genetic variation and outcrossing rates of the endangered tropical species Dipterocarpus dyeri. J Trop For Sci. 2019;31(2):259–67.
Hellmann JJ, Pineda-Krch M. Constraints and reinforcement on adaptation under climate change: selection of genetically correlated traits. Biol Conserv. 2007;140:599–609.
Zhuravlev YN, Koren OG, Reunova GD, Muzarok TI, Gorpenchenko TY, Kats IL, Khrolenko YA. Panax ginseng natural populations: their past, current state and perspectives. Acta Pharmacol Sin. 2008;29(9):1127–36.
Artyukova EV, Kozyrenko MM, Koren OG, Kholina AB, Nakonechnaya OV, Zhuravlev YN. Living on the Edge: Various modes of persistence at the range margins for some far eastern species. In: Galiskan M, editor. Genetic Diversity in Plant. Rijeka: InTech; 2012. p. 349–74.
Liu H, Xia T, Zuo YJ, Chen ZJ, Zhou SL. Development and characterization of microsatellite markers for Panax notoginseng (Araliaceae) a Chinese traditional herb. Am J of Bot. 2011;98(8):e218–20.
Reunova GD, Kats IL, Muzarok TI, Nguyen TTP, Dang TT, Brenner EV, Zhuravlev YN. Diversity of microsatellite loci in the Panax vietnamensis Ha et Grushv. (Araliaceae) population. Dokl Biol Sci. 2011;441(1):408–11.
Peng LP, Cai CF, Zhong Y, Xu XX, Xian HL, Cheng FY, Mao JF. Genetic analyses reveal independent domestication origins of the emerging oil crop Paeonia ostii, a tree peony with a long-term cultivation history. Sci Rep. 2017;7:5340.
Schaal BA, Hayworth DA, Olsen KM, Rauscher JT, Smith WA. Phylogeographic studies in plants: problems and prospects. Mol Ecol. 1998;7:465–74.
Bolger AM, Lohse M, Usadel B. Trimmomatic: a flexible trimmer for Illumina sequence data. Bioinformatics. 2014;30:2114–20.
Grabherr MG, Haas BJ, Yassour M, Levin JZ, Thompson DA, Amit I, Adiconis X, Fan L, Raychowdhury R, Zeng O, Chen Z, Mauceli E, Hacohen N, Gnirke A, Rhind N, Palma FD, Birren BW, Nusbaum C, Lindblad-Toh K, Friedman N, Regev A. Full length transcriptome assembly from RNA Seq data without a reference genome. Nat Biotechnol. 2011;29:644–52.
Pertea G, Huang X, Liang F, Antonescu V, Sultana R, Karamycheva S, Lee Y, White J, Cheung F, Parvizi B, Tsai J, Quackenbush J. TIGR gene indices clustering tools (TGICL): a software system for fast clustering of large EST datasets. Bioinformatics. 2003;19(5):651–2.
Deng YY, Li JQ, Wu SF, Zhu YP, Chen YW, He FC. Integrated nr database in protein annotation system and its localization. Comput Eng. 2006;32(5):71–4.
Apweiler R, Bairoch A, Wu CH, Barker WC, Boeckmann B, Ferro S, Gasteiger E, Huang H, Lopez R, Magrane M, Martin MJ, Natale DA, O'Donovan C, Redaschi N, Yeh LS. UniProt: the universal protein knowledgebase. Nucleic Acids Res. 2004;32:D115–9.
Ashburner M, Ball CA, Blake JA, Botstein D, Butler H, Cherry JM, Davis AP, Dolinski K, Dwight SS, Eppig JT, Harris MA, Hill DP, Tarver IL, Kasarskis A, Lewis S, Matese JC, Richardson JE, Ringwald M, Rubin GM, Sherlock G. Gene ontology: tool for the unification of biology. Nat Genet. 2000;25(1):25–9.
Tatusov RL, Galperin MY, Natale DA. The COG database: a tool for genome scale analysis of protein functions and evolution. Nucleic Acids Res. 2000;28(1):33–6.
Koonin EV, Fedorova ND, Jackson JD, Jacobs AR, Krylov DM, Makarova KS, Mazumder R, Mekhedov SL, Nikolskaya AN, Rao BS, Rogozin IB, Smirnov S, Sorokin AV, Sverdlov AV, Vasudevan S, Wolf YI, Yin JJ, Natale DA. A comprehensive evolutionary classification of proteins encoded in complete eukaryotic genomes. Genome Biol. 2004;5(2):R7.
Kanehisa M, Goto S, Kawashima S, Okuno Y, Hattori M. The KEGG resource for deciphering the genome. Nucleic Acids Res. 2004;32:D277–80.
Altschul SF, Madden TL, Schäffer AA, Zhang J, Zhang Z, Miller W, Lipman DJ. Gapped BLAST and PSI BLAST: A new generation of protein database search programs. Nucleic Acids Res. 1997;25(17):3389–402.
Eddy SR. Profile hidden Markov models. Bioinformatics. 1998;14(9):755–63.
Finn RD, Bateman A, Clements J, Coggill P, Eberhardt RY, Eddy SR, Heger A, Hetherington K, Holm L, Mistry J, Sonnhammer EL, Tate J, Punta M. Pfam: the protein families database. Nucleic Acids Res. 2014;42:D222–30.
Jurka J, Pethiyagoda C. Simple repetitive DNA sequences from primates: compilation and analysis. J Mol Evol. 1995;40:120–6.
Clark KR, Gorley RN. Primer 5.0 (Plymouth routines in multivariate ecological research). Issue, Plymouth, UK: Primer-E Ltd.; 2001.
Peakall R, Smouse PE. Genalex 6.5: genetic analysis in excel. Population genetic software for teaching and research an update. Bioinformatics. 2012;28:2537–9.
Slatkin M. Gene flow in natural populations. Ann Rev Ecol Syst. 1985;16:393–430.
Botstein D, White RL, Skolnick M, Davis RW. Construction of a genetic linkage map in man using restriction fragment length polymorphisms. Am J Hum Genet. 1980;32:314–31.
Raymond M, Rousset F. Genepop (ver. 1.2): population genetics software for exact tests and ecumenicism. J Hered. 1995;86:248–9.
Piry S, Luikart G, Cornnet JM. Bottleneck: a computer program for detecting recent reductions in the effective population size frequency data. J Hered. 1999;90:502–3.
Excoffier L, Laval G, Schneider S. Arlequin. v. 3.0. An integrated software package for population genetics data analysis. Evol Bioinforma. 2005;1:47–50.
Takezaki N, Nei M, Tamura K. Software for constructing population trees from allele frequency data and computing other population statistics with windows interface. Mol Evol. 2010;27(4):747–52.
Pritchard JK, Stephens M, Donnelly P. Inference of population structure using multilocus genotype data. Genetics. 2000;155:945–59.
Earl DA, Von-Holdt BM. Structure harvester: a website and program for visualizing structure output and implementing the Evanno method. Conserv Genet Resour. 2012;4:359–61.
Evanno G, Regnaut S, Goudet J. Detecting the number of clusters of individuals using the software structure: a simulaton study. Mol Ecol. 2005;14:2611–20.
Acknowledgements
We are grateful to the Institute of Tropical Ecology, Vietnam-Russia Tropical Centre, Institute of Ecology and Biological Resource, Vietnam Academy of Science and Technology, Ngoc Linh Ginseng joint stock company, Kon Tum Province; Ngoc Linh Ginseng center, Nam Tra My district, Quang Nam Province for support of our field work and issuing relevant permits. We acknowledged the support of Dr. Bui Thi Tuyet Xuan (Institute of Ecology and Biological Resource, Vietnam Academy of Science and Technology), Prof. Dr. Altaf Hussain Lahori (Sindh Madressatul Islam University, Karachi 74000, Pakistan) in the current study.
Funding
This work was funded by Vietnam Academy of Sciences and Technology (VAST) under the project Biodiversity and Bioactive Compounds (VAST04.07/19–20). The funder had no role in the design of the study and collection, analysis, and interpretation of data and in writing the manuscript.
Author information
Authors and Affiliations
Contributions
DDV, TPTN: designed the study; TPTN, MTN, MPP, VTB, DDV: collected samples; MPP, VTB, DDV: performed the experiments; VTB, MTN, DDV, TPTN, SNMS: analyzed the data; DDV, TPTN, MTN, SNMS: drafted and revised the manuscript. All authors have read and approved the final manuscript.
Corresponding author
Ethics declarations
Ethics approval and consent to participate
Permission/consent was granted from the Director, Institute of Ecology and Biological Resources, Vietnam Academy of Science and Technology (Letter No. #123/QĐ-STTNSV dated 20 February 2019 and Letter No. #829/QĐ-STTNSV dated 10 May 2019) and from the Director, Ngoc Linh Ginseng Center, Peoples Committee of Nam Tra My district, Quang Nam Province (consent letter attached) before studying the targeted species under the Project (VAST04.07/19–20).
Consent for publication
Not applicable.
Competing interests
The authors declare that they have no competing interests.
Additional information
Publisher’s Note
Springer Nature remains neutral with regard to jurisdictional claims in published maps and institutional affiliations.
Supplementary information
Additional file 1: Figure S1.
The Delta K distribution graph.
Rights and permissions
Open Access This article is licensed under a Creative Commons Attribution 4.0 International License, which permits use, sharing, adaptation, distribution and reproduction in any medium or format, as long as you give appropriate credit to the original author(s) and the source, provide a link to the Creative Commons licence, and indicate if changes were made. The images or other third party material in this article are included in the article's Creative Commons licence, unless indicated otherwise in a credit line to the material. If material is not included in the article's Creative Commons licence and your intended use is not permitted by statutory regulation or exceeds the permitted use, you will need to obtain permission directly from the copyright holder. To view a copy of this licence, visit http://creativecommons.org/licenses/by/4.0/. The Creative Commons Public Domain Dedication waiver (http://creativecommons.org/publicdomain/zero/1.0/) applies to the data made available in this article, unless otherwise stated in a credit line to the data.
About this article

Cite this article
Vu, D.D., Shah, S.N.M., Pham, M.P. et al. De novo assembly and Transcriptome characterization of an endemic species of Vietnam, Panax vietnamensis Ha et Grushv., including the development of EST-SSR markers for population genetics. BMC Plant Biol 20, 358 (2020). https://doi.org/10.1186/s12870-020-02571-5
Received:
Accepted:
Published:
DOI: https://doi.org/10.1186/s12870-020-02571-5