
Abstract
Background
Verticillium wilt of cotton is a serious soil-borne disease that causes a substantial reduction in cotton yields. A previous study showed that the endophytic fungus Chaetomium globosum CEF-082 could control Verticillium wilt of cotton, and induce a defense response in cotton plants. However, the comprehensive molecular mechanism governing this response is not yet clear.
Results
To study the signalling mechanism induced by CEF-082, the transcriptome of cotton seedlings pretreated with CEF-082 was sequenced. The results revealed 5638 DEGs at 24 h post inoculation with CEF-082, and 2921 and 2153 DEGs at 12 and 48 h post inoculation with Verticillium dahliae, respectively. At 24 h post inoculation with CEF-082, KEGG enrichment analysis indicated that the DEGs were enriched mainly in the plant-pathogen interaction, MAPK signalling pathway-plant, flavonoid biosynthesis, and phenylpropanoid biosynthesis pathways. There were 1209 DEGs specifically induced only in cotton plants inoculated with V. dahliae in the presence of the biocontrol fungus CEF-082, and not when cotton plants were only inoculated with V. dahliae. GO analysis revealed that these DEGs were enriched mainly in the following terms: ROS metabolic process, H2O2 metabolic process, defense response, superoxide dismutase activity, and antioxidant activity. Moreover, many genes, such as ERF, CNGC, FLS2, MYB, GST and CML, that regulate crucial points in defense-related pathways were identified and may contribute to V. dahliae resistance in cotton. These results provide a basis for understanding the molecular mechanism by which the biocontrol fungus CEF-082 increases the resistance of cotton to Verticillium wilt.
Conclusions
The results of this study showed that CEF-082 could regulate multiple metabolic pathways in cotton. After treatment with V. dahliae, the defense response of cotton plants preinoculated with CEF-082 was strengthened.
Background
Cotton (Gossypium spp.) is an important economic crop species cultivated worldwide. Verticillium wilt of cotton is a serious vascular disease that detrimentally affects cotton yield and fiber quality [1] and is caused by the soil-borne fungus Verticillium dahliae Kleb. This disease can cause yellowing, wilting, defoliation, and ultimately death of cotton plants [2], and the pathogen is difficult to control because of its long-term survival as microsclerotia in the soil and its broad host range [3]. To date, no fungicide has been identified that can eliminate Verticillium wilt of upland cotton (Gossypium hirsutum L.) after plants have been infected [2, 4, 5].
At present, the use of biological control agents is a promising, more environmentally friendly strategy to control Verticillium wilt of cotton [6]. Numerous studies have shown that various biological control agents can suppress Verticillium wilt in different host species [7, 8]. Iturins mediate the defense response, and significantly activate PR1, LOX, and PR10 at 24 h after V. dahliae infection [9]. The nonvolatile substances produced by CEF-818 (Penicillium simplicissimum), CEF-325 (Fusarium solani), CEF-714 (Leptosphaeria sp.), and CEF-642 (Talaromyces flavus) inhibit V. dahliae growth [10]. Fusarium oxysporum 47 (Fo47) reduced the symptoms of Verticillium wilt in pepper; the expression of three defense genes, CABPR1, CACHI2 and CASC1, was upregulated in the roots [11]. Bacillus subtilis DZSY21 reduced the disease severity of southern corn leaf blight, and upregulated the expression level of PDF1.2 [12]. Preinoculation of cauliflower with Verticillium Vt305 reduced symptom development and the colonization of plant tissues by Verticillium longisporum [13]. Various fungal and bacterial strains showed biocontrol activity against Verticillium wilt of olive. These microorganisms protect plants from the deleterious effects of the various pathogens, cause induced systemic resistance (ISR), compete for nutrients and colonization space, or promote plant growth through the production of phytohormones and the delivery of nutrients [14].
It has been reported that a series of immune reactions are induced in cotton plants infected with V. dahliae. In recent years, transcriptomic studies of the defense responses of plants infected with V. dahliae have become increasingly common, and several signal transduction pathways and key genes have been identified, including those involved in plant hormone signal transduction, plant-pathogen interaction, and phenylpropanoid-related and ubiquitin-mediated signals in cotton; additionally, these studies have investigated members of key regulatory gene families, such as receptor-like protein kinases (RLKs), WRKY transcription factors and cytochrome P450s (CYPs) [3]. The expression levels of phenylalanine ammonia-lyase (PAL), 4-coumarate-CoA ligase (4CL), cinnamyl alcohol dehydrogenase (CAD), caffeoyl-CoA O-methyltransferase (CCoAOMT), and caffeoyl O-methyltransgerase (COMT) in the phenylalanine metabolism pathway have been shown to be upregulated in sea-island cotton [2]; the expression levels of 401 transcription factors (TFs), mainly in the MYB, bHLH, AP2-EREBP, NAC, and WRKY families, have been shown to be up- or downregulated in response to V. dahliae in Arabidopsis thaliana [15]; and genes encoding cyclic nucleotide gated channel (CNGC), respiratory burst oxidase homologue (RBOH), flagellin-sensitive 2 (FLS2), jasmonate ZIM domain-containing protein (JAZ), transcription factor MYC2, regulatory protein NPR1 and transcription factor TGA have been shown to be induced by V. dahliae in sunflower [16]. Several studies have investigated transcript levels in plants in response to biocontrol agents [17, 18].
In previous studies, we found that the endophytic fungus Chaetomium globosum CEF-082, which was isolated from upland cotton plants, suppressed the growth of V. dahliae and increased cotton resistance to Verticillium wilt [19]. However, the signalling mechanism induced by CEF-082 is unknown. Therefore, the purpose of this study was to reveal the molecular mechanism by which CEF-082 increased cotton resistance to Verticillium wilt via RNA sequence analysis.
Results
Control effect of CEF-082 on Verticillium wilt of cotton and H2O2 content
The disease index was 18.61 in the control group (water+ V. dahliae) and 7.62 in the treatment group (CEF-082+ V. dahliae) 14 d after V. dahliae inoculation (Fig. 1A). The results showed that CEF-082 enhanced the resistance of cotton to Verticillium wilt, and the biocontrol effect was 59.1% (Fig. 1C).

Disease index and symptoms of Verticillium wilt in cotton 14 d after V. dahliae inoculation. (A) The disease index. (B) The content of H2O2. (C) Symptoms of Verticillium wilt in cotton, a: water+V. dahliae, b: CEF-082 + V. dahliae. Bars represent SEs
The H2O2 content in the treatment group was higher than that in the control group throughout the majority of the duration of the experiment and lower than that in the control group at 5 dpi with V. dahliae. The H2O2 content in the treatment group was highest at 2 dpi (12.80 μmol/g), while the H2O2 content in the control group was highest at 1 dpi (10.38 μmol/g). The changes in the two groups were similar and were stable 5 d later (Fig. 1B).
Verification of RNA-Seq analysis by qRT-PCR
Twelve DEGs were randomly selected. The gene expression levels in the control and treatment groups were compared by qRT-PCR. The RNA-seq data showed that the expression of the 12 genes was upregulated at 0 h, 12 h or 48 h. The qRT-PCR results showed that the expression of nine of the 12 genes was upregulated, which was consistent with the results of their upregulated expression in the transcriptome; however, the expression of three genes was downregulated, which was inconsistent with their expression in the transcriptome, namely, Gh_D12G2793, Gh_D08G2484 and Gh_D05G3615 (Fig. 2). In addition, the levels of upregulation of 5 genes in the qRT-PCR data were lower than those in the RNA-seq data. The qRT-PCR data were up to 75% consistent with the transcriptome data.
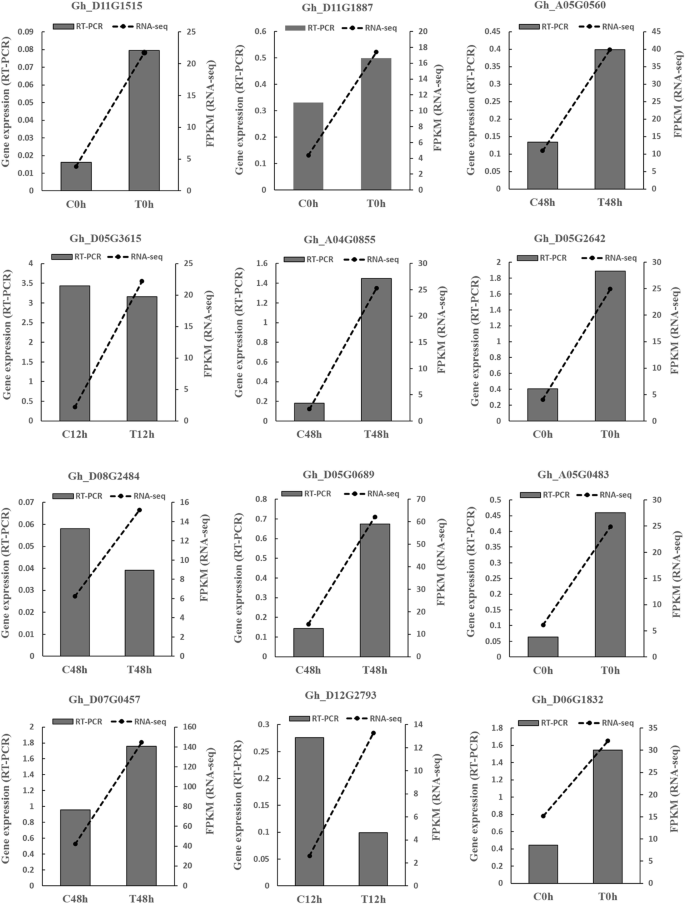
Comparison of the expression trends in the qRT-PCR and RNA-seq data. The gray bars represent the genes expression levels relative to that of the cotton ubiquitin gene, which was used as an internal control, to normalize the expression levels of the target genes. Dotted lines represent the mean FPKM
Functional annotation and enrichment analysis of the DEGs
The minimum correlation between the three replicates was 95.5% (Additional file 1: Figure S1). Principal component analysis (PCA) of 18 arrays (Additional file 2: Figure S2) was also used to compare the samples and to explore the dynamic changes in the cotton transcriptome after treatment with CEF-082 and V. dahliae.
The average clean reads of the 18 samples was 62.08 M. The lowest Q20 value of the clean reads was 97.93, and the lowest Q30 value was 90.06 (Additional file 9: Table S2). A total of 47,183 new transcripts were found, of which 7288 belonged to new protein-coding genes (Additional file 10: Table S3).
There were 3480 upregulated and 2158 downregulated DEGs at 0 h, 1716 upregulated and 1205 downregulated DEGs at 12 h, and 1524 upregulated and 629 downregulated DEGs at 48 h. The greatest number of DEGs was identified after inoculation with CEF-082 for 24 h. After inoculation with V. dahliae, the number of DEGs gradually decreased.
DEGs induced by CEF-082 at 0 h without V. dahliae inoculation
After inoculation with CEF-082 for 24 h (0 h), 5638 DEGs were identified, and KEGG pathway enrichment analysis revealed 15 significantly enriched pathways, including plant-pathogen interaction, MAPK signalling pathway-plant, flavonoid biosynthesis, phenylpropanoid biosynthesis, galactose metabolism, arachidonic acid metabolism, carotenoid biosynthesis, glutathione metabolism, sesquiterpenoid and triterpenoid biosynthesis, linoleic acid metabolism, other glycan degradation, glycosphingolipid biosynthesis - ganglio series, brassinosteroid biosynthesis, diterpenoid biosynthesis and sphingolipid metabolism (Q-value < 0.05) (Table 1). In the plant-pathogen interaction pathway, there were 106 FLS2 genes, 88 upregulated and 18 downregulated; 7 Rboh genes, 5 upregulated and 2 downregulated; 5 upregulated calcium-dependent protein kinase (CDPK) genes; 5 CNGC genes, 3 upregulated and 2 downregulated; and 57 glutathione S-transferase (GST) genes in the glutathione metabolism pathway, of which 49 were upregulated and 8 downregulated (Fig. 3). These genes were related to the metabolism of reactive oxygen species (ROS) and Ca2+. In the MAPK signalling pathway-plant pathway, 304 DEGs regulated 30 crucial points related to ROS, Ca2+, abscisic acid (ABA), ethylene (ET), jasmonic acid (JA), H2O2 and FLS2. In the flavonoid biosynthesis pathway, the genes encoding chalcone synthase (CHS) and ferulate-5-hydroxylase (F5H) were induced. In the phenylpropanoid biosynthesis pathway, the key genes PAL and 4CL were also induced.

Expression levels of genes related to ROS and Ca2+. The red color represents upregulation, and the green represents downregulation
The GO enrichment analysis revealed that the 5638 genes were mainly enriched in 86 terms, including the intrinsic component of membrane, integral component of membrane, membrane part, membrane, catalytic activity, response to biotic stimulus, cell wall, oxidoreductase activity, defense response, response to stimulus, response to stress, and response to fungus (Q-value < 0.001), and the first 15 terms are listed in Table 2. Of the 16 genes in the response to fungus term, 15 were upregulated and 1 was downregulated. The GO classification showed that there were 18, 14 and 12 terms in biological process, cellular component and molecular function, respectively, and the KEGG classification indicated that the DEGs mainly belonged to the metabolism pathway (2856 DEGs).
DEGs coinduced by CEF-082 and V. dahliae
The 463 shared DEGs at 12 h and 48 h were significantly enriched in 6 KEGG pathways (Table 3). In the plant-pathogen interaction pathway, 29 DEGs regulated 8 crucial points, including CNGCs, calmodulin (CaM), FLS2, disease resistance protein RPS2 (RPS2), heat shock protein 90 kDa (HSP90), pto-interacting protein 1 (Pti1), disease resistance protein RPM1 (RPM1), and EIX receptor 1/2 (EIX1/2). In the phenylpropanoid biosynthesis pathway, 23 DEGs regulated 9 crucial points. In the flavonoid biosynthesis pathway, 12 DEGs regulated 8 crucial points. The enriched GO terms included terpenoid metabolic process, oxidoreductase activity, defense response, H2O2 metabolic process and ROS metabolic process terms.
DEGs induced only in cotton inoculated with V. dahliae in the presence of CEF-082
A total of 1209 specific DEGs were identified at 12 h and 48 h, which were induced only in cotton plants inoculated with V. dahliae in the presence of CEF-082, but not when cotton plants were inoculated with V. dahliae only. The cluster thermogram showed the expression patterns of these genes at different stages (Additional file 3: Figure S3). KEGG classification showed that these DEGs mainly belonged to metabolism (672 DEGs) and were significantly enriched in 5 KEGG pathways, including flavonoid biosynthesis, indole alkaloid biosynthesis, MAPK signalling pathway-plant, plant-pathogen interaction, and phenylpropanoid biosynthesis (Table 4). GO classification showed that there were 14, 12 and 9 terms in the biological process, cellular component and molecular function, respectively. GO enrichment indicated that these DEGs were enriched in ROS metabolic process (14 DEGs), H2O2 metabolic process (12 DEGs), H2O2 catabolic process (12 DEGs), defense response (31 DEGs), superoxide dismutase activity (5 DEGs), antioxidant activity (19 DEGs), oxidoreductase activity, acting on superoxide radicals as acceptor (5 DEGs), cofactor binding (75 DEGs) and DNA binding (121 DEGs) (Additional file 4: Figure S4).
At 12 h and 48 h, 96 shared DEGs were obtained, which were induced only in cotton plants inoculated with V. dahliae in the presence of CEF-082, but not when cotton plants were inoculated with V. dahliae only (Additional file 5: Figure S5). KEGG analysis of the 96 DEGs indicated that they were mainly enriched in glutathione metabolism and flavonoid biosynthesis (Table 5). GO analysis showed that the DEGs were enriched in the terms superoxide dismutase activity, oxidoreductase activity, acting on superoxide radicals as acceptors, and antioxidant activity. Of the 96 DEGs, 9 encoded TFs and 20 encoded predicted PRGs (Additional file 11: Table S4).
A protein-protein interaction network (Additional file 6: Figure S6) was constructed via the 96 DEGs shared between 12 h and 48 h and other genes interacting with them in cotton. Six hub genes were obtained, Gh_A05G1020, Gh_D09G0858, BGI_novel_G004376, Gh_A08G0125, Gh_D07G1197 and Gh_A05G3508. Among them, Gh_D07G1197 was annotated in the flavonoid biosynthesis pathway.
Putative R genes and TFs involved in resistance to Verticillium wilt
On the basis of the transcriptome analysis, a total of 65 candidate genes that may be related to the resistance of cotton to Verticillium wilt were identified, including 5 CNLs (whose members contain an NB-ARC domain), 3 CNs (members of the U-box domain-containing protein kinase family protein), 5 NLs (whose members contain an NBS-LRR domain), 7 RLPs (whose members contain an eLRR-TM-S/TPK domain), 7 Ns (whose members contain an NBS domain only), 9 TNLs (members of the TIR-NBS-LRR class), 6 Ts (members of NAC domain containing protein 17), 1 Mlo-like (a member of the Mlo-like resistant proteins) and 2 other types (which have resistance functions but do not fit the known classes). These genes mainly included a disease resistance protein, 2 probable calcium-binding protein (CML45), 3 ethylene-responsive transcription factor (ERF), 2 cyclic nucleotide-gated ion channel 2 (CNGC2), 5 MYB TFs and 2 GST (Tables 6, 7 and 8). A clustering thermogram of 65 genes (Fig. 4) showed that certain genes were upregulated at 0, 12 and 48 h; certain genes were downregulated at 0 h and upregulated at 12 and 48 h; and certain genes were downregulated at 0, 12 and 48 h.

Clustering thermogram of putative R genes and genes encoding TFs
Discussion
The number of DEGs identified at 12 h and 48 h was lower than that identified at 0 h. The number of DEGs may have decreased in these cases because the plants were infected with V. dahliae and began to respond defensively. The DEGs between the CEF-082 treatment and CEF-082+ V. dahliae treatment, were enriched mainly in 5 signalling pathways: plant-pathogen interaction, MAPK signalling pathway-plant, flavonoid biosynthesis, phenylpropanoid biosynthesis, and glutathione metabolism. The pathways of plant-pathogen interaction and flavonoid biosynthesis were also induced in sunflower plants infected with V. dahliae [16], and the results were also consistent with those of Tan [20], who reported that most DEGs in tomato were associated with phenylpropanoid metabolism and plant-pathogen interaction pathways. However, the glutathione metabolism pathway has rarely been reported in the transcriptome of cotton plants treated with V. dahliae.
It is clear that plant responses to biotic or abiotic stress depend on interactions among several signalling pathways, including those mediated by JA, ET, salicylic acid (SA) or ABA [21, 22]. Morán-Diez et al. [17] found SA- and JA-related DEGs were downregulated in A. thaliana after 24 h of incubation in the presence of Trichoderma harzianum T34. A set of DEGs influenced by JA or ET was induced upon pathogen attack when A. thaliana was previously colonized by a photosynthetic Bradyrhizobium sp. strain, ORS278 [18]. DEGs related to ET, SA, JA, brassinosteroid (BR) and cytokinin were upregulated or downregulated upon V. dahliae infection in cotton [3]. In this study, we also found that DEGs in ABA, auxin and gibberellin were significantly induced not only after treatment with CEF-082 but also after inoculation with V. dahliae. In addition, DEGs related to JA, ET, SA, BR and cytokinin were induced in cotton plants treated only with CEF-082. The 8 plant hormones were also induced after infection with V. dahliae in sunflower [16]. The responses of the A. thaliana auxin receptors TIR1, AFB1 and AFB3 and auxin transporter AXR4 were impaired upon infection with V. dahliae [23]. Therefore, both CEF-082 and V. dahliae can induce changes in hormones.
Previously, it was shown that after plants were infected with pathogens, the FLS2 pattern recognition receptors recognized pathogens, and the hypersensitive response (HR) was activated through ROS, JA, WRKYs and the NO signalling pathways [24, 25] and mediated by CNGC, RBOH, CaM/CML and FLS2 [26,27,28]. These results are consistent with the results of this study. In this study, 24 h after treatment with CEF-082, the DEGs of FLS2, Rboh, CDPK, CNGCs and GST in the plants were also upregulated or downregulated to varying degrees (Fig. 3). In addition, most of the genes encoding peroxidase (POD), superoxide dismutase (SOD), and catalase (CAT) were also upregulated. These genes were related to the accumulation of ROS. Forty-eight hours after treatment with V. dahliae, the genes encoding CNGC, CaM/CML and FLS2 were upregulated. However, in this study, the NO signalling pathway was not induced.
Phenylpropane synthesis is related to cotton defense mechanisms [29], while flavonoids are known to buffer substantial stress-induced alterations in ROS homeostasis and to modulate the ROS-signalling cascade [30]. Plant CNGC subunits and CaM constitute a molecular switch that either opens or closes calcium channels [31]. Previous reports have shown that calcium-dependent CDPK4 and CDPK5 regulate ROS production by phosphorylating NADPH oxidase in potatoes [32]. ROS are important not only as defense signalling mechanisms [33] but also for regulating programmed cell death via the establishment of the HR [34]. MAPK family members can improve resistance to Verticillium wilt of cotton [35]. In this study, 24 h after CEF-082 inoculation, certain signal transduction pathways might have been involved in the plant response to CEF-082 (Fig. 5). After inoculation with CEF-082, FLS2 recognized CEF-082, MAPK signal transduction was induced, and calcium channels opened. H2O2 was then produced, leading to an ROS burst. Plant hormones were also induced, including ET, SA, JA, ABA, BR, auxin, gibberellin and cytokinin. The signalling pathways of flavonoids and phenylpropane synthesis were also involved in this process. In addition, lignin synthesis was induced after treatment with CEF-082 (Fig. 6). Figure 6 refers to the lignin biosynthesis pathway of Miedes et al. [36]. Cinnamate 4-hydroxylase (C4H) and p-coumarate 3 hydroxylase (C3H) were not induced in T0 h-vs-C0h, T12 h-vs-C12h, or T48 h-vs-C48h but were induced in C12h-vs-C0h, which was similar to the results of Xu et al. [37], who indicated that C4H-1 and C4H-3 were upregulated after treatment with V. dahliae. Three days after inoculation with V. dahliae, lignin was detected, and the pith diameter of CEF-082 + V. dahliae-treated plants was slightly larger than that of water + V. dahliae-treated plants (Additional file 7: Figure S7). The defense response at T12 h and T48 h was similar to that at T0 h, and only a few key points induced were different in the pathways, which are shown in Figs. 5 and 6. Thus, it is speculated that CEF-082 reduced the occurrence of cotton Verticillium wilt because inoculation with CEF-082 can prime signalling pathways involved in defense against V. dahliae upon infection.

Signal transduction pathways induced by CEF-082

Lignin biosynthesis pathway. This figure refers to the lignin biosynthesis pathway of Miedes et al. [36]. Enzymes colored red or black indicate the key points induced or uninduced by CEF-082. The red numbers represent the number of upregulated genes, and green numbers represent the number of downregulated genes. PAL, phenylalanine ammonia-lyase; C4H, cinnamate 4-hydroxylase; 4CL, 4-coumarate-CoA ligase; C3H, p-coumarate 3 hydroxylase; HCT, hydroxycinnamoyl transferase; CCR, cinnamoyl CoA reductase; CAD, cinnamyl alcohol dehydrogenase; CCoAOMT, caffeoyl-CoA O-methyltransferase; F5H, ferulate-5-hydroxylase. Figure 6 is a part of the figure of Miedes E, and then added the numbers of upregulated and downregulated genes, and draw it by ourselves, not copied from the paper. The gene numbers upregulated and downregulated in Fig. 6 are our data from RNA-seq
When pathogens infect plants, they induce a series of defense responses. GST participates in plant defense and can remove ROS [38]. Plant GSTs can be subdivided into eight categories, phi, zeta, tau, theta, lambda, dehydroascorbate reductase (DHAR), elongation factor 1 gamma (EF1G) and tetrachlorohydroquinone dehalogenase (TCHQD) [39]. GSTF8 has been used as a marker of early stress and defense responses [40], and JA, methyl jasmonate, ABA and H2O2 can induce GST expression [41,42,43]. LrGSTU5 was obviously upregulated after treatment with Fusarium oxysporum [44], and the GST genes were also upregulated in G. barbadense treated with V. dahliae [45]. In this study, the GST genes were also significantly induced 24 h after treatment with CEF-082 (Fig. 3), and GST genes were upregulated in cotton treated with water + V. dahliae. These results are consistent with those of Han et al. and Zhang et al. [44, 45]. Certain GST genes were also significantly induced in the treatment group but were not significantly induced in the control group after treatment with V. dahliae. The GST gene Gh_A09G1509 was shown to increase resistance to Verticillium wilt in tobacco [46]. Hence, we suggest that CEF-082 can induce specific GST genes to protect cotton from V. dahliae.
V. dahliae can induce a defense response after it infects cotton [3]. In this study, susceptible cotton varieties were inoculated with the biocontrol fungus CEF-082 and V. dahliae, which also induced a series of defense responses. Compared with plants inoculated with water +V. dahliae, the plants inoculated with CEF-082 + V. dahliae presented significantly upregulated or downregulated expression of resistance-related genes. Therefore, it is speculated that the defense response was strengthened after inoculation with the biocontrol fungus CEF-082. In addition, we obtained 1209 specific DEGs, that were not induced in plants inoculated with water +V. dahliae, but were induced only in plants inoculated with CEF-082 + V. dahliae. GO enrichment showed that these genes were involved in ROS metabolic process. The disease resistance of cotton was enhanced after CEF-082 treatment, and thus, we inferred that these specific DEGs might be genes related to plant disease resistance.
Conclusion
CEF-082 can induce defense responses in cotton, and pretreatment with CEF-082 at an appropriate concentration of 105spore/mL can improve the resistance of cotton (Jimian 11) to Verticillium wilt. Transcriptome analysis revealed that genes expressed in cotton leaves involved in ROS burst, Ca2+, lignin biosynthesis, flavonoids and phenylpropane synthesis were significantly upregulated or downregulated. Defense responses could be induced in cotton plants treated with CEF-082, and these responses were stronger in cotton plants inoculated with V. dahliae in the presence of CEF-082. In addition, 1209 specific DEGs induced only in plants inoculated with V. dahliae in the presence of the biocontrol fungus CEF-082 were obtained.
Methods
Fungal strain culture
The cotton endophyte C. globosum CEF-082 was cultured on potato dextrose agar (PDA) plates for 20 d. Spores were obtained by adding sterile water to each plate, rubbing a sterile spatula over the colony and then filtering the suspension through a sterile cheesecloth, after which the suspension was diluted to a 1 × 10⁵ spore/mL. V. dahliae VD1070–2 was cultured on PDA for 7 d, inoculated into liquid Czapek-Dox medium [47], and cultured in the dark at 25 °C and 150 rpm for 7 d. The mycelia were filtered out and removed, and the filtrate was subsequently diluted to a 1 × 10⁷ spore/mL spore suspension.
Cotton inoculation treatment
Jimian 11, a highly Verticillium wilt-susceptible upland cotton variety, was provided by Professor Heqin Zhu from State Key Laboratory of Cotton Biology, Institute of Cotton Research of Chinese Academy of Agricultural Sciences. It is a cultivar selected from hybrid cross [(Jihan 4× Ke 4104) F2 × 74Yu102]. The seeds were sterilized with 70% alcohol for 1 min and then with 1.05% sodium hypochlorite for 10 min, after which the seeds were washed with sterile water 5 times. The cotton seeds were planted in vermiculite and transferred to plastic pots (25 cm × 15 cm) that contained 2000 mL of liquid culture solution after emergence. The cultivation solution was prepared according to the methods of Zhang et al. [48], with some modifications. In this study, 2 mM NaCl was used instead of 2.5 mM KCl, while the other 9 mineral nutrients were the same. A black foam board with 20 holes was placed on the plastic pot, and cotton plants were placed into the holes and supported by a sponge. Twenty plants were cultivated per pot per treatment, and each treatment was repeated three times. Twenty cotton plants in each treatment were removed from the plastic pots, and inoculated with CEF-082 by soaking the cotton roots in 300 mL of a 1 × 10⁵ spore/mL spore suspension for 40 min prior to the flattening of the first true leaf. For the control group, water was used instead of the CEF-082 spore suspension. The cotton plants were then returned to the pots. At 0 h, 6 h and 24 h later, 5 leaves were randomly collected at each time point for each biological replicate in each treatment, and 24 h was considered to be 0 h before inoculation with V. dahliae (24 h (0 h)). Twenty four hours post inoculation with CEF-082, the same method was used to inoculate V. dahliae VD1070–2 (1 × 10⁷ spore/mL) in the treatment group and the control group. Leaf samples were then collected at 12 h, 1 d, 2 d, 3 d, 5 d and 7 d, and 5 leaves were also randomly collected at each time point for each biological replicate under each treatment. Three biological replicates were included.
Determination of hydrogen peroxide (H2O2) content
H2O2 content was estimated according to the methods of Sharma et al. [49] with minor modifications. Approximately 0.1 g of cotton leaves was weighed and added to 1 mL of acetone for ice bath homogenization. The samples were then centrifuged at 8000×g and 4 °C for 10 min, and the supernatant was collected. Then, 25 μL of 20% titanium chloride in concentrated HCl and 200 μL of ammonia solution (17 M) were added. The precipitate was washed 3 times with acetone. Afterward, the washed precipitates were dissolved in 1.5 mL of H2SO4 (2 N), and the absorbance was read at 415 nm.
Control effect of the biocontrol fungus CEF-082 on Verticillium wilt of cotton
The above mentioned hydroponic seedlings were investigated at 14 d post inoculation (dpi) with VD1070–2. The disease severity was rated according to a disease index that was based on a five-scale categorization of Verticillium wilt disease of cotton seedlings [50].
RNA sequencing (RNA-seq)
A polysaccharide polyphenol RNA extraction kit (TianGen, Beijing) was used to extract RNA from cotton leaves. Electrophoresis was performed, and a One Drop (1000+) spectrophotometer was used to detect the concentration and quality of RNA. Transcriptome sequencing was performed for the 24 h (0 h (T0 h, C0h)), 12 h (T12 h, C12h) and 48 h (T48 h, C48h) samples. T0 h, T12 h and T48 h represented the 0, 12 and 48 h samples in the treatment group, respectively, and C0h, C12h and C48h represented the 0, 12 and 48 h samples in the control group, respectively. Three biological replicates were performed, and there were 18 samples. The construction of the DNA library and sequencing were performed by Beijing Genomics Institute (BGI). Data filtering was performed using SOAPnuke software (BGI, Beijing). Clean reads were obtained by removing the reads containing adapters, reads with more than 5% N, and low-quality sequences. The clean reads were spliced and aligned to the reference G. hirsutum genome retrieved from the cotton genome website (https://www.cottongen.org/). The fragments per kilobase per transcript per million mapped reads (FPKM) values were calculated and used to estimate the effects of sequencing depth and gene length on the mapped read counts.
Screening and analysis of differentially expressed genes (DEGs)
The DEGseq R package (1.20.0) [51] was used to analyze DEGs in cotton leaves treated or nontreated with CEF-082 under the criteria of a corrected P value < 0.001 and an absolute log2 ratio ≥ 1. GO (Gene Ontology) terms and KEGG (Kyoto Encylopedia of Genes and Genomes) pathways were enriched by DEGs if the P values were < 0.001. Resistance genes among the DEGs were predicted by a BLAST search of the Plant Resistance Gene (PRG) Database (identity ≥40, E-value <1E-5) [52]. TFs encoded by the DEGs were predicted (E-value <1E-5) according to the Plant Transcription Factor Database [53].
Quantitative reverse-transcription-PCR (qRT-PCR) analysis
The plant-pathogen interaction pathway and R genes are important for plant resistance. Twelve DEGs involved in the plant-pathogen interaction pathway and predicted R genes were randomly selected for qRT-PCR to verify whether the trends in their expression was consistent with the transcriptome sequencing results. Data were collected from three replicate experiments, and the samples used for qRT-PCR were the same as those used for RNA-seq. RNA was extracted from sample leaves and reverse transcribed into cDNA. qRT-PCR was performed via a Bio-Rad CFX96 Real-Time System (Bio-Rad, USA), and each PCR mixture (20 μL) consisted of 10 μL SuperReal PreMix Plus SYBR Green (Tiangen), 0.4 μL of each primer, 2 μL of cDNA and 7.2 μL of sterile water. Each sample involved at least three technical repeats. The PCR cycle consisted of an initial denaturation step of 95 °C for 10 min, followed by 40 cycles of 95 °C for 30 s, 60 °C for 30 s and 72 °C for 30 s. The cotton ubiquitin gene was used as the internal reference, and relative gene expression was calculated using the 2-ΔCT method. Primers were obtained from the upland cotton gene fluorescence quantitative specific primer database (https://biodb.swu.edu.cn/qprimerdb/) (Additional file 8: Table S1).
Abbreviations
- 4CL:
-
4-coumarate-CoA ligase
- ABA:
-
Abscisic acid
- BR:
-
Brassinosteroid
- C3H:
-
P-coumarate 3 hydroxylase
- C4H:
-
Cinnamate 4-hydroxylase
- CAD:
-
Cinnamyl alcohol dehydrogenase
- CAT:
-
Catalase
- CCoAOMT:
-
Caffeoyl-CoA O-methyltransferase
- CDPK:
-
Calcium-dependent protein kinase
- CHS:
-
Chalcone synthase
- CML:
-
Calcium-binding protein
- COMT:
-
Caffeoyl O-methyltransferase
- CYP:
-
Cytochrome P450 proteins
- ERF:
-
Ethylene-responsive transcription factor
- ET:
-
Ethylene
- F5H:
-
Ferulate-5-hydroxylase
- FLS2:
-
Flagellin-sensitive 2
- GST:
-
Glutathione S-transferase
- HR:
-
Hypersensitive response
- HSP90:
-
Heat shock protein 90 kDa
- JA:
-
Jasmonic acid
- PAL:
-
Phenylalanine ammonia-lyase
- POD:
-
Peroxidase
- Pti1:
-
Pto-interacting protein 1
- qRT-PCR:
-
Quantitative reverse-transcription-PCR
- Rboh:
-
Respiratory burst oxidase homologue
- ROS:
-
Reactive oxygen species
- RPS2:
-
Disease resistance protein RPS2
- SA:
-
Salicylic acid
- SOD:
-
Superoxide dismutase
References
Tian J, Zhang XY, Liang BG. Expression of baculovirus anti-apoptotic genes p35 and op-iap in cotton (Gossypium hirsutum L.) enhances tolerance to Verticillium wilt. Plos One. 2010;5(12):e14218.
Sun Q, Jiang HZ, Zhu XY, Wang WN, He XH, Shi YZ, Yuan YL, Du XM, Cai YF. Analysis of sea-island cotton and upland cotton in response to Verticillium dahliae infection by RNA sequencing. BMC Genomics. 2013;14:852.
Zhang WW, Zhang HC, Liu K, Jian GL, Qi FJ, Si N. Large-scale identification of Gossypium hirsutum genes associated with Verticillium dahliae by comparative transcriptomic and reverse genetics analysis. PLoS One. 2017;12(8):e0181609.
Wang YQ, Liang CZ, Wu SJ, Zhang XY, Tang JY, Jian GL, Jiao GL, Li FG, Chu CC. Significant improvement of cotton Verticillium wilt resistance by manipulating the expression of Gastrodia antifungal proteins. Mol Plant. 2016;9(10):1436–9.
Zhang Y, Wang XF, Rong W, Yang J, Li ZK, Wu LQ, Zhang GY, Ma ZY. Histochemical analyses reveal that stronger intrinsic defenses in Gossypium barbadense than in G. hirsutum are associated with resistance to Verticillium dahliae. Mol Plant-Microbe Interact. 2017;30(12):984–96.
Yuan Y, Feng HJ, Wang LF, Li ZF, Shi YQ, Zhao LH, Feng ZL, Zhu HQ. Potential of endophytic fungi isolated from cotton roots for biological control against Verticillium wilt disease. PLoS One. 2017;12(1):e0170557.
Berg G, Fritze A, Roskot N, Smalla K. Evaluation of potential biocontrol rhizobacteria from different host plants of Verticillium dahliae Kleb. J Appl Microbiol. 2001;91:963–71.
Giovanni B, Antonio Domenico M, Margherita D, Mario A, Matteo C. Evaluation of Streptomyces spp for the biological control of corky root of tomato and Verticillium wilt of eggplant. Appl Soil Ecol. 2013;72:128–34.
Han Q, Wu FL, Wang XN, Qi H, Shi L, Ren A, Liu QH, Zhao MW, Tang CM. The bacterial lipopeptide iturins induce Verticillium dahliae cell death by affecting fungal signalling pathways and mediate plant defence responses involved in pathogen-associated molecular pattern-triggered immunity. Environ Microbiol. 2015;17(4):1166–88.
Li ZF, Wang LF, Feng ZL, Zhao LH, Shi YQ, Zhu HQ. Diversity of endophytic fungi from different Verticillium-wilt-resistant Gossypium hirsutum and evaluation of antifungal activity against Verticillium dahliae in vitro. J Microbiol Biotechnol. 2014;24(9):1149–61.
Veloso J, Díaz J. Fusarium oxysporum Fo47 confers protection to pepper plants against Verticillium dahliae and Phytophthora capsici, and induces the expression of defence genes. Plant Pathol. 2012;61(2):281–8.
Ding T, Su B, Chen XJ, Xie SS, Gu SY, Wang Q, Huang DY, Jiang HY. An endophytic bacterial strain isolated from eucommia ulmoides inhibits southern corn leaf blight. Front Microbiol. 2017;8:903.
Tyvaert L, França S, Debode J, Höfte M. The endophyte Verticillium Vt305 protects cauliflower against Verticillium wilt. J Appl Microbiol. 2014;116:1563–71.
Varo A, Raya-Ortega MC, Trapero A. Selection and evaluation of micro-organisms for biocontrol of Verticillium dahliae in olive. J Appl Microbiol. 2016;121:767–77.
Su XF, Lu GQ, Guo HM, Zhang KX, Li XK, Cheng HM. The dynamic transcriptome and metabolomics profiling in Verticillium dahliae inoculated Arabidopsis thaliana. Sci Rep. 2018;8(1):1–11.
Guo SC, Zuo YC, Zhang YF, Wu CY, Su WX, Jin W, Yu HF, An YL, Li QZ. Large-scale transcriptome comparison of sunflower genes responsive to Verticillium dahliae. BMC Genomics. 2017;18(1):42.
Morán-Diez E, Rubio B, Domínguez S, Hermosa R, Monte E, Nicolás C. Transcriptomic response of Arabidopsis thaliana after 24 h incubation with the biocontrol fungus Trichoderma harzianum. J Plant Physiol. 2012;169:614–20.
Cartieaux F, Contesto C, Adrien Gallou A, Desbrosses G, Kopka J, Taconnat L, Renou JP, Touraine B. Simultaneous interaction of Arabidopsis thaliana with Bradyrhizobium Sp. strain ORS278 and Pseudomonas syringae pv. Tomato DC3000 leads to complex transcriptome changes. Mol Plant-Microbe Interact. 2008;21(2):244–59.
Zhang Y, Feng ZL, Feng HJ, Li ZF, Shi YQ, Zhao LH, Zhu HQ, Yang JR. Control effect of endophytic fungus Chaetomium globosum CEF-082 against Verticillium wilt in Gossypium hirsutum. Acta Phytopathologica Sinica. 2016;46(5):697–706.
Tan GX, Liu K, Kang JM, Xu KD, Zhang Y, Hu LZ, Zhang J, Li CW. Transcriptome analysis of the compatible interaction of tomato with Verticillium dahliae using RNA-sequencing. Front Plant Sci. 2015;6:428.
Balbi V, Devoto A. Jasmonate signalling network in Arabidopsis thaliana: crucial regulatory nodes and new physiological scenarios. New Phytol. 2008;177:301–18.
Pieterse CMJ, Leon-Reyes A, van der Ent S, van Wees SCM. Networking by small-molecule hormones in plant immunity. Nat Chem Biol. 2009;5:308–16.
Fousiaa S, Tsafourosb A, Roussosb PA, Tjamos SE. Increased resistance to Verticillium dahliae in Arabidopsis plants defective in auxin signaling. Plant Pathol. 2018;67:1749–57.
Yao LL, Zhou Q, Pei BL, Li YZ. Hydrogen peroxide modulates the dynamic microtubule cytoskeleton during the defence responses to Verticillium dahliae toxins in Arabidopsis. Plant Cell Environ. 2011;34(9):1586–98.
Dang ZH, Zheng LL, Wang J, Gao Z, Wu SB, Qi Z, Wang YC. Transcriptomic profiling of the salt-stress response in the wild recretohalophyte Reaumuria trigyna. BMC Genomics. 2013;14:29.
Zhang H, Yang YZ, Wang CY, Liu M, Li H, Fu Y, Wang YJ, Nie YB, Liu XL, Ji WQ. Large-scale transcriptome comparison reveals distinct gene activations in wheat responding to stripe rust and powdery mildew. BMC Genomics. 2014;15:898.
Singh N, Bhatla SC. Nitric oxide and iron modulate heme oxygenase activity as a long distance signaling response to salt stress in sunflower seedling cotyledons. Nitric Oxide. 2016;53:54–64.
Yadav S, David A, Baluska F, Bhatla SC. Rapid auxin-induced nitric oxide accumulation and subsequent tyrosine nitration of proteins during adventitious root formation in sunflower hypocotyls. Plant Signal Behav. 2013;8(3):e23196.
Bu BW, Qiu DW, Zeng HM, Guo LH, Yuan JJ, Yang XF. A fungal protein elicitor PevD1 induces Verticillium wilt resistance in cotton. Plant Cell Rep. 2014;33:461–70.
Cecilia B, Alessio F, Federico S, Antonella G, Massimiliano T. Modulation of phytohormone signaling: a primary function of flavonoids in plant-environment interactions. Front Plant Sci. 2018;9:1042.
Pan YJ, Chai XY, Gao QF, Zhou LM, Zhang SS, Li LG, Luan S. Dynamic interactions of plant CNGC subunits and Calmodulins drive oscillatory Ca2+ channel activities. Dev Cell. 2019;48(5):710–25.
Kobayashi M, Ohura I, Kawakita K, Yokota N, Fujiwara M, Shimamoto K, Doke N, Yoshioka H. Calcium-dependent protein kinases regulate the production of reactive oxygen species by potato NADPH oxidase. Plant Cell. 2007;19:1065–80.
Eckardt NA. The plant cell reviews plant immunity: receptor-like kinases, ROS-RLK crosstalk, quantitative resistance, and the growth/defense trade-off. Plant Cell. 2017;29:601–2.
Tamas L, Mistrik I, Huttova J, Haluskova L, Valentovicova K, Zelinova V. Role of reactive oxygen species-generating enzymes and hydrogen peroxide during cadmium, mercury and osmotic stresses in barley root tip. Planta. 2010;231:221–31.
Meng J, Gao H, Zhai WB, Shi JY, Zhang MZ, Zhang WW, Jian GL, Zhang MP, Qi FJ. Subtle regulation of cotton resistance to Verticillium wilt mediated by MAPKK family members. Plant Sci. 2018;272:235–42.
Miedes E, Vanholme R, Boerjan W, Molina A. The role of the secondary cell wall in plant resistance to pathogens. Front Plant Sci. 2014;5:358.
Xu L, Zhu LF, Tu LL, Liu LL, Yuan DJ, Jin L, Long L, Zhang XL. Lignin metabolism has a central role in the resistance of cotton to the wilt fungus Verticillium dahliae as revealed by RNA-Seq-dependent transcriptional analysis and histochemistry. J Exp Bot. 2011;62(15):5607–21.
Chan C, Lam HM. A putative lambda class glutathione S-transferase enhances plant survival under salinity stress. Plant Cell Physiol. 2014;55(3):570–9.
Wang Z, Huang SZ, Jia CH, Liu JH, Zhang JB, Xu BY, Jin ZQ. Molecular cloning and expression of five glutathione S-transferase (GST) genes from Banana (Musa acuminata L. AAA group, cv. Cavendish). Chin J Trop Agric. 2013;32(9):1373–80.
Thatcher LF, Kamphuis LG, Hane JK, Onate-Sánchez L, Singh KB. The Arabidopsis KH-domain RNA-binding protein ESR1 functions in components of jasmonate signalling, unlinking growth restraint and resistance to stress. PLoS One. 2015;10:e0126978.
Dixon DP, Lapthorn A, Edwards R. Plant glutathione transferases. Genome Biol. 2002;3:1–10.
Dixon DP, Davis BG, Edwards R. Functional divergence in the glutathione transferase superfamily in plants. J Biol Chem. 2002;277(34):30859–69.
Moons A. Regulatory and functional interaction of plant growth regulators and plant glutathione S-transferases (GSTs). Vitam Horm. 2005;72:155–202.
Han Q, Chen R, Yang Y, Cui XM, Ge F, Chen CY, Liu DQ. A glutathione S -transferase gene from Lilium regale Wilson confers transgenic tobacco resistance to Fusarium oxysporum. Sci Hortic. 2016;198:370–8.
Zhang Y, Wang XF, Ding ZG, Ma Q, Zhang GR, Zhang SL, Li ZK, Wu LQ, Zhang GY, Ma ZY. Transcriptome profiling of Gossypium barbadense inoculated with Verticillium dahliae provides a resource for cotton improvement. BMC Genomics. 2013;14:637.
Li ZK, Chen B, Li XX, Wang JP, Zhang Y, Wang XF, Yan YY, Ke HP, Yang J, Wu JH, et al. A newly identified cluster of glutathione S-transferase genes provides Verticillium wilt resistance in cotton. Plant J. 2019;98(2):213–27.
Zhang YL, Li ZF, Feng ZL, Feng HJ, Zhao LH, Shi YQ, Hu XP, Zhu HQ. Isolation and functional analysis of the pathogenicity-related gene VdPR3 from Verticillium dahliae on cotton. Curr Genet. 2015;61(4):555–66.
Zhang ZY, Zhang X, Hu ZB, Wang SF, Zhang JB, Wang XJ, Wang QL, Zhang BH. Lack of K-dependent oxidative stress in cotton roots following coronatine-induced ROS accumulation. PLoS One. 2015;10(5):e0126476.
Sharma A, Thakur S, Kumar V, Kesavan AK, Thukral AK, Bhardwaj R. 24-epibrassinolide stimulates imidacloprid detoxification by modulating the gene expression of brassica junceal. BMC Plant Biol. 2017;17(1):56.
Zhu HQ, Feng ZL, Li ZF, Shi YQ, Zhao LH. Characterization of two fungal isolates from cotton and evaluation of their potential for biocontrol of Verticillium wilt of cotton. J Phytopathol. 2013;161(2):70–7.
Wang L, Feng Z, Wang X, Wang X, Zhang X. DEGseq: an R package for identifying differentially expressed genes from RNA-seq data. Bioinformatics. 2010;26:136–8.
Sanseverino W, Hermoso A, D’Alessandro R, Vlasova A, Andolfo G, Frusciante L, et al. PRGdb 2.0: towards a community-based database model for the analysis of R-genes in plants. Nucleic Acids Res. 2013;41:1167–71.
Jin J, Zhang H, Kong L, Gao G, Luo J. PlantTFDB 3.0: a portal for the functional and evolutionary study of plant transcription factors. Nucleic Acids Res. 2014;42:1182–7.
Acknowledgments
We thank the members of Professor Zhu’s group for technical assistance, financial support and helpful discussions.
Funding
This work was supported by National Key Research and Development Program of China (2017YFD0201900) and National Natural Science Foundation of China (31901938). We thank all the foundation for economic support. The funding organizations provided the financial support to the research projects, and involved in the design of the study.
Author information
Authors and Affiliations
Contributions
YZ, LZ, HZ and CT conceived the study. YZ and NY performed the experiments. YZ analyzed the results and wrote the manuscript, with feedback from all authors. NY and HZ discussed the results and revised the manuscript. All authors have read and approved the manuscript.
Corresponding authors
Ethics declarations
Ethics approval and consent to participate
Not applicable.
Consent for publication
Not applicable.
Competing interests
The authors declare that they have no competing interests.
Additional information
Publisher’s Note
Springer Nature remains neutral with regard to jurisdictional claims in published maps and institutional affiliations.
Supplementary information
Additional file 1: Figure S1.
Correlation thermograms of the 18 samples.
Additional file 2: Figure S2.
PCA of the 18 samples.
Additional file 3: Figure S3.
Clustering thermogram of 1209 DEGs.
Additional file 4: Figure S4.
GO enrichment analysis of 1209 DEGs.
Additional file 5: Figure S5.
Venn diagram of DEGs.
Additional file 6: Figure S6.
Protein interaction network of 96 DEGs and their related genes in cotton. The red font indicates hub genes.
Additional file 7: Figure S7.
Histochemical analysis of lignin in stem cross-sections of cotton plants.
Additional file 8: Table S1.
Specific primer sequences used for qRT-PCR.
Additional file 9: Table S2.
Sequencing quality statistics table.
Additional file 10: Table S3.
Overview of novel transcripts.
Additional file 11: Table S4.
Putative R genes and genes encoding TFs among the 96 DEGs.
Additional file 12.
Data concerning the H2O2 content.
Additional file 13.
Data concerning the disease index.
Additional file 14.
qPCR data.
Rights and permissions
Open Access This article is distributed under the terms of the Creative Commons Attribution 4.0 International License (http://creativecommons.org/licenses/by/4.0/), which permits unrestricted use, distribution, and reproduction in any medium, provided you give appropriate credit to the original author(s) and the source, provide a link to the Creative Commons license, and indicate if changes were made. The Creative Commons Public Domain Dedication waiver (http://creativecommons.org/publicdomain/zero/1.0/) applies to the data made available in this article, unless otherwise stated.
About this article

Cite this article
Zhang, Y., Yang, N., Zhao, L. et al. Transcriptome analysis reveals the defense mechanism of cotton against Verticillium dahliae in the presence of the biocontrol fungus Chaetomium globosum CEF-082. BMC Plant Biol 20, 89 (2020). https://doi.org/10.1186/s12870-019-2221-0
Received:
Accepted:
Published:
DOI: https://doi.org/10.1186/s12870-019-2221-0