
Abstract
Background
Sweetpotato (Ipomoea batatas (L.) Lam.) is one of the most important crops from the family of Convolvulaceae. It is widely reported that cultivated sweetpotato was originated from Ipomoea trifida. However, diploid, tetraploid and hexaploid I. trifida were found in nature. The relationship, between them, and among them and sweetpotato, is remaining unclear.
Results
In the present study, we detected the genome diversity and relationship of sweetpotato and different polyploidy types I. trifida using Restriction-site Associated DNA Sequencing (RAD-seq). A total of 38,605 RAD-tags containing 832,204 SNPs had been identified. These tags were annotated using five public databases, about 11,519 tags were aligned to functional genes in various pathways. Based on SNP genotype, phylogenetic relation analysis results confirmed that cultivated sweetpotato has a closer relationship with I. trifida 6× than with I. trifida 4X and I. trifida 2×. Besides, 5042 SSRs were detected in I. trifida 6×, and 3202 pairs of high-quality SSR primers were developed. A total of 68 primers were randomly selected and synthesized, of which 61 were successfully amplified.
Conclusion
These results provided new evidence that cultivated sweetpotato originated from I. trifida 6×, and that I. trifida 6× evolved from I. trifida 4X and I. trifida 2×. Therefore, using I. trifida 6× as the model plant of sweetpotato research should be more practical than using I. trifida 2× in the future. Meanwhile, sequence information and markers from the present study will be helpful for sweetpotato and I. trifida studies in the future.
Key message
We report a genome-wide SNP&SSR discovery and SSR marker development using RAD-seq, and phylogenetic analysis of sweetpotato and different polyploidy of Ipomoea trifida.
Background
Ipomoea, including about 600–700 species, has maximum genus in the family of Convolvulaceae [1]. About 13 wild species of this genus belong to Ipomoea section Batatas. Sweetpotato (Ipomoea batatas (L.) Lam.) is the only species that is widely cultivated as a major staple crop in over 100 countries [2]. It plays an important role in food security in numerous African countries [1, 3]. However, the study of sweetpotato in genetics and genomics lags far behind that of other major crops for its complex genome structure and cross incompatibility [4].
So far, the ancestor of sweetpotato and its domestication remained unclear. Only few studies about the relationships between sweetpotato and its wild species have been reported [5, 6], but some debate about sweetpotato origins still exists. It is widely accepted that I. trifida is the closest wild species of sweetpotato [7, 8]. However, the genetic relationships between sweetpotato and its wild species have not been fu1ly elucidated.
Wild relative species of sweetpotato possess lots of desirable traits, such as drought and salinity tolerance, disease resistance, and high content of starch, etc.. They should be a precious gene reservoir for sweetpotato breeding and cultivar improvement, and may provide a new approach for sweetpotato genetic study. Therefore, it is crucial to elucidate the genetic relationships between sweetpotato and its allied species in the future genetic studies.
Several hypotheses have been applied to reveal the origin of sweetpotato. Recent studies were focused on two perspectives about the origin of cultivated sweetpotato [5, 9, 10]. The first hypotheses proposed the ancestor of sweetpotato was from a cross between I. trifida and I. triloba. Another hypothesis proposed that a hybridization between diploid I. leucantha and its polyploidization tetraploid I. littoralis Blume generated triploid Ipomoea trifida (H.B.K.) Don., which spontaneous polyploidy originated wild ancestor of hexaploid I. batatas. Although two hypotheses supported different origin models of sweetpotato, they all acknowledged that I. trifida is one of the ancestors of sweetpotato.
I. trifida (H. B. K.) G. Don. has a complex forms of polyploidy, including diploid (2 N = 2× = 30), triploid (2 N = 3× = 45), tetraploid (2 N = 4× = 60), and hexaploid (2 N = 6× = 90), and it is cross-compatible with cultivated sweetpotato [5]. Furthermore, several studies in molecular genetics and cytogenetic indicated that I. trifida is the closest wild relative of cultivated sweetpotato [7], and it was considered to be the most likely candidate progenitor of sweetpotato.
With the application of next-generation sequencing (NGS) technology, genomics has developed rapidly in recent years. More and more whole-genome sequences of plants and animal species have been released [11]. However, many agricultural crops and animals were still without reference genomes because of the complexity of genome. The situation will be hard to change in the near future. For these species, reduced-representation libraries sequencing (RRLS) is deemed to be the most effective and economic choice in genomics research [12,13,14]. Restriction-site Associated DNA sequencing (RAD-seq) is one of the widest used RRLS techniques, which combines the advantages of low cost and high throughput [15], and it is particularly useful for genome studying in species lacking reference genomes. Now, RAD sequencing was widely used in genetic diversity, ecological and evolutionary genetics, genetic mapping and molecular markers development studies [16, 17].
In this study, we used RAD-seq to (1) evaluate the use value of this approach, (2) detect plenty of SNPs in sweetpotato and its related wild species I. trifida, (3) evaluate the phylogenetic relationships among sweetpotato accessions and different polyploidy forms of I. trifida, (4) detect SSR loci in I. trifida 6× and develop SSR markers. These results will be helpful to understand the phylogenetic relationship and genetic diversity of I. batatas species and its putative progenitor I. trifida.
Results
RAD-seq and SNP discovery
By sequencing the genomes of 27 samples, including sweetpotato cultivars, I. trifida (2×, 4X, 6×) and synthetic accessions, a total of 37.29 Gb high-quality sequence data, containing 100,507,572 pair-end reads and 7,843,552 single-end reads, was obtained. The number of raw reads from each accession ranged from 6,453,618 to 23,422,064 with an average of 9,320,100. Although genomes of sweetpotato and I. trifida 6× were larger in size than I. trifida 2× and I. trifida 4X, the total number of raw reads had no significant difference. The number of total raw reads was 45,236,943. The raw reads number for sweetpotato ranged from 2,545,682 to 9,994,361 with an average of 3,831,194. For different polyploidy type I. trifida, I. trifida 2× had an average raw reads of 3,965,810, and average raw reads of 3,511,641 were for I. trifida 4X, and 2,975,540 raw reads were from I. trifida 6×. After filtering the raw reads, 8,585,422 high-quality reads-tags were generated. For each sample, number of reads-tags ranged from 209,850 to 608,047, with an average of 317,978 (Tables 1 and 2).
After grouping RAD-seq reads into RAD-tags, the sequencing depth was identified as varying significantly across loci, which has been observed in many other RAD-seq based studies. The majority of the loci were in coverage between 8.6 and 21.98. The mean coverage of polymorphic loci was 12.15 (Additional file 1: Figure S1), which was at a medium level (Table 2).
All candidate alleles identified among cultivated sweetpotato and different polyploidy types of I. trifida were clustered using SNP genotype. Finally, 38,605 RAD-tags were comparable among 27 samples, and 832,204 SNPs had been identified. The A/G type, T/C type and A/C type SNPs were accounted for 32.87%, 29.17% and 13.34%, respectively.
Genetic relationship between sweetpotato and I. trifida
The application of Phylip in combination with PLINK and fastSTRUCTURE revealed evolutionary history and population structure across 27 accessions of I. batatas and I. trifida. Phylogenetic analyses of combining data matrix from all SNPs showed that the trees constructed with parsimony genetic distances and neighbor-joining had almost the same topologies (Figs. 1 and 2). Twenty-seven accessions tested in this study were grouped into three major groups at the distance of 0.02884. The first group, including 13 sweetpotato accessions and one synthetic line Beinong 6–13, could be clearly separated into three clusters. Five Chinese sweetpotato landraces Baiguqilong, Shengwuyan, Dalanguo, Jinhuanggua, Tanwanziyang and a modern variety Nanshu88 were clustered together. Another cluster contained one Japanese cultivar, one Tanzanian cultivar and two Chinese cultivars. The last cluster included two accessions Meiguohong from U.S. and Aozhouhong from Australia, and one Chinese modern cultivar Chuanshu20 and synthetic line Beilong 6–13 (Fig. 1). The second group contained eight I. trifida 2X accessions. These accessions had the distinct characteristics of I. trifida 2X, such as thin stem, small leaf small seed. Moreover, the accessions in this group all have 30 chromosomes based on cytological observation. The third group, which located between the first group and the second group, consisted of three I. trifida 4X accessions, one I. trifida 6× accession and one synthetic line Beilong 5521 (Fig. 1). The phylogenetic tree revealed that I. trifida 6× are more closely related to I. trifida 4X than to I. trifida 2X.

Phylogenetic tree of 27 accessions based on identified SNP

Neighbor-joining trees showing the genetic relatedness of the 27 accessions
Phylogeny was constructed based on genetic similarity calculating using SNP datasets. The SNPs-based UPGMA genetic similarities among each accession ranged from 0.1779 to 0.06699. A dendrogram was constructed based on the simple matching coefficient. At the distance of 0.02295, two groups were clustered in the dendrogram, and two distinct sub-groups existed in one group, which almost the same as phylogenetic analyses results (Fig. 2).
Group 1 contained all eight I. trifida 2X, but genetic similarities were different among them. I. trifida 2X B1 showed the biggest difference with other genotypes. I. trifida 2X Y23 and I. trifida 2X Y22, had the closest relationship with a genetic similarity 0.05087, followed by I. trifida 2X 13.1–4 and I. trifida 2X 6.1–2 with a genetic similarity 0.08058. There were abundant in genetic diversity among each I. trifida 2X in this group. The second group included three I. trifida 4X accessions, one I. trifida 6X and all sweetpotato accessions. Two distinct sub-groups could be identified in this group. One sub-group only contained three I. trifida 4X accessions. Interestingly, the other sub-group consisted of one I. trifida 6X and all sweetpotato accessions. It showed I. trifida 6X had a closer relationship with I. batatas than that with I. trifida 4X and I. trifida 2X. Except I. trifida 6X, there was a little genetic difference in this sub-group. In contrast, Nanshu88, Meiguohong and Aozhouhong showed the difference with extra sweetpotato accessions. Two of them came from America and Australia, respectively, and Nanshu88 was a widely grown Chinese sweetpotato verity. The other sweetpotato accessions had high genetic similarity with each other in the dendrogram. In addition, the dendrogram showed that synthetic species Beinong5521 and Beinong6–13 were closely related to sweetpotato as compared to other wild species (Fig. 2).
To further reveal the genetic structure, fastSTRUCTURE software was utilized with different K values from 1 to 10 based on all effective SNP markers. Using the model-based clustering analysis, the optimal number of clusters to describe the data was K = 3, which distinguished I. trifida 2X, cultivated I. batatas accessions and I. trifida 6X, cultivated I. batatas accessions and I. trifida 4X. This grouping result also basically confirmed the phylogenetic analyses results and genetic similarity. I. trifida 2X accessions were represented by cluster K1. Three accessions of I. trifida 4X were clustered in K3, in addition, K3 contained 3 sweetpotato accessions, namely Nanshu88, Danlanguo and Jinhuanggua. I. batatas accessions were grouped to clusters K2 and K3. Except three I. batatas accessions were attributed to I. trifida 4X cluster (K3), most of the I. batatas accessions were clustered into K2, which included landraces and modern cultivars. Interestingly, I. trifida 6X and two synthetic species also were divided into K2 group. Consequently, clustering results indicated the genetic relationship between I. batatas and I. trifida 2X is quite far from the phylogenetic relationship of I. trifida 4X and I. trifida 6X. By contrast, genetic distances revealed that I. trifida 6X has a closer genetic relationship with sweetpotato than with I. trifida 4X and I. trifida 2X (Fig. 3).

Population structure analysis based on identified SNP
SSR loci detection in I. trifida 6X
To further detecting SSR loci, the MISA script (http://pgrc.ipk-gatersleben.de/misa/) with the default settings was used to analyze in I. trifida 6X. The criteria included a 50 bp minimum match, 95% minimum identity in the overlap region and 20 bp maximum unmatched overhangs. The results indicated a total of 5042 SSRs were identified from 55,167,516 bp of 180,286 reads in I. trifida 6X, with an average of one SSR per 3.6 kb. 2951 SSR contained sequences (Table 3). In total, the compilation of all SSRs revealed that the proportion of SSR unit sizes was not evenly distributed. Among all SSRs, 2779 (55.12%) SSRs were belonging to 2 unit size types, followed by tri-nucleotide repeat motifs, accounting for 1882 (37.33%). A total of 381 (7.56%) SSRs had unit size between 3 to 6 (Additional file 2: Table S1) (Fig. 4). In total, 1812 sequences containing more than 1 SSR, and 694 SSRs presented in compound formation that have more than one repeat type (Table 3).

The distribution SSRs loci number with different unit size
Among 5042 SSRs, 4172 SSRs were highly dispersed with sizes ranging from 10 bp to 20 bp, which accounted for 82.74% of total SSRs, followed by 21–30 bp (715 SSRs, 14.18%) (Additional file 2: Table S1). A maximum of 69 bp Tri-nucleotide repeats (TAA) was observed. In addition, a total of 224 SSR motifs were identified, of which, di-, tri-, tetra-, penta- and hexa- nucleotide repeat had 4, 10, 31, 67 and 112 types, respectively. The AT/TA di-nucleotide repeat was the most abundant motif detected in RAD sequences (779, 15.45%), followed by the motif GA/AG (721, 14.30%), TC/CT (696, 13.80%), TG/GT (298, 5.91%), AC/CA (279, 5.53%), AAT/TAA (93, 4.01%) and TTC/CTT (166, 3.29%). The frequency of remaining 161 types of motifs accounted for 3.19% (Fig. 4).
Development and evaluation of SSR markers
Based on the sequences of 5042 SSRs, 3202 pairs of high-quality SSR primers were successfully designed after stringent filtering using Primer Premier 5.0 (PREMIER Biosoft International, Palo Alto CA). To further evaluate the polymorphism of SSR markers, 68 SSR markers were randomly selected and synthesized. After being tested by 3 I. trifida accessions, 61 primer pairs (89.71%) were successfully amplified. Different annealing temperatures were tried, 7 (10.29%) SSR primers still were unable to generate PCR products. Most of these 61 working primer pairs amplified bands almost at the expected sizes, except for 11 SSR primers amplified with larger bands than that expected.
The polymorphism of the 61 SSR primer pairs was further evaluated in eight diverse accessions of I. trifida (Fig. 5). The results showed that all primers amplified more than two bands and all primers had polymorphic bands. PCR products ranged in size from 100 bp to 480 bp. The number of polymorphic loci varied from 2 to 11 per optimized primer, with an average of 6 polymorphic loci.
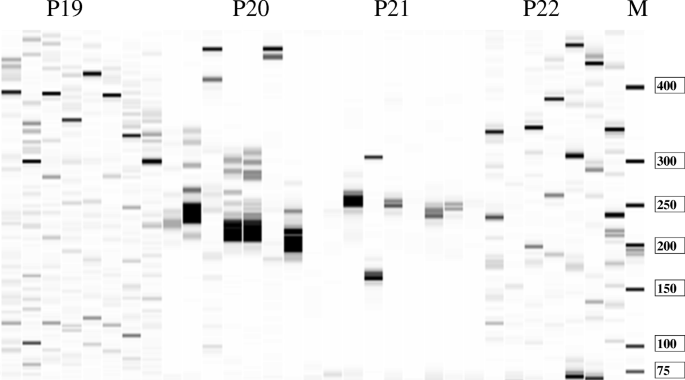
The result of capillary electrophoresis. P12–22 was novel SSR primers pairs. M was a marker. The accessions in each group were different I. trifida genotypes from Venezuela, Mexico and Colombia
Annotation of sequences with SNPs
Total of 38,605 sequences with polymorphic SNP loci were blasted using Blast2GO software, of which 11,519 (29.84%) matched significant hits (E = 10− 5) in Nr database. In total, 11,541 (29.90%) of them aligned with sequences in UnProtKB database, including 2516 reads only with blast hit, and 2551 hits were mapped without GO Annotation. Only 6474 (16.77%) hits were successfully mapped and annotated. 27,064 (70.10%) singletons had no significant hits. The frequency of sequences with significant hits was lower in the present study than that in transcription studies. It could be because most reads without hits were derived from non-coding regions of the genome.
The number of hits was over 50 in 48 species, most of which belonged to biannual or perennial plants. 1726 reads were hit in Ipomoea nil. 866 and 722 were hit in Nicotiana sylvestris and Nicotiana tomentosiformis, respectively. Interestingly, only 200 hits were from Ipomoea batatas, and 127 hits were from Ipomoea trifida. In addition, only few hits were from other Ipomoea species, including Ipomoea purpurea, Ipomoea pes-caprae, etc. (Additional file 1: Figure S2).
A total of 6474 (16.77%) out of the 38,605 blastx-annotated sequences could be associated with GO terms. Totally 35,384 unigenes were annotated. Based on annotation analysis, the blast hits genes were divided into molecular function (MF), cellular component (CC), and biological process (BP) categories at level 2. 15,163 (42.85%) annotations related to biological process, 8328 (23.54%) reads connected to molecular function, and 11,893 (33.61%) reads worked in cellular component. In biological process, ‘metabolic process’ (3800), ‘cellular process’ (3588) and ‘single-organism process’ (2142) were prominently represented. For the molecular function category, ‘binding’ (3803), ‘catalytic activity’ (3641) and ‘transporter activity’ (358) were the most highly represented categories. Under cellular components category, the largest proportion of genes were divided into ‘cell’ (2334), ‘cell part’ (2324) and ‘membrane’ (2110) (Fig. 6). Additionally, only 7 sequences were assigned to ‘nutrient reservoir activity’ terms.

The distribution of Gene Ontology (GO) classification with different annotations
From analysis GO evidence codes, we detected 8836 (72.47%) putative genes inferred from Electronic Annotation (EA). These annotations have not been manually checked. 1749 (14.34%) putative genes were derived from Biological Aspect of Ancestor (BA). The remaining 1148 (9.42%) putative genes were inferred from expression pattern (EP), direct assay (DA), mutant phenotype (MP), Sequence Model (SM), and Sequence or structural similarity (SS) (Additional file 1: Figure S3).
In parallel, a total of 8587 RAD-tags, were aligned to OG databases using Blast2GO. Interestingly, 2025 (23.58%) of them were with unknown function. This may be related to the reads in the present study were from genome, which had non-coding region, or because there are few studies on sweetpotato and I. trifida. 6562 sequences were annotated in OG categories. ‘Signal transduction mechanisms’ and ‘Posttranslational modification, protein turnover, chaperones’ had the largest amount sequences of 992 (11.55%) and 703 (8.19%), respectively, followed by ‘Energy production and conversion’, ‘Replication, recombination and repair’ and ‘Carbohydrate transport and metabolism’, with 671 (7.81%), 558 (6.50%) and 495 (5.76) sequence, respectively (Additional file 1: Figure S4). About 164 (1.91%) sequences were annotated with ‘Defense mechanisms’, which should have particular potentials for resistance gene study in sweetpotato and I. trifida.
Mapping of genes for putative proteins onto the KEGG database was performed along with e value <=1e− 5 and rank <=5. In the pathways categorized ‘Metabolism’ in the KEGG database, a total of 1727 unigenes were mapped onto 349 metabolic pathways (Additional file 1: Figure S5). The pathways included ‘Starch and sucrose metabolism’, ‘Carotenoid biosynthesis’, ‘Brassinosteroid biosynthesis’, ‘Photosynthesis-antenna proteins’, ‘Indole alkaloid biosynthesis’, ‘Photosynthesis’, ‘Zeatin biosynthesis’, ‘Biosynthesis of amino acids’, ‘Plant hormone signal transduction’, which should provide valuable information for future studies.
Discussion
RAD-seq in sweetpotato and I. trifida
The next generation (NGS) sequencing can be used to infer evolutionary relationships between species, as well as identify a large number of SNPs scattered among the genome. In this study, we sequenced sweetpotato and different polypoid types of I. trifida, and found about 832,204 SNP loci and 5042 SSRs. These markers could be broadly used for mapping agronomic genes and constructing genetic maps in sweetpotato and I. trifida.
The genetic complexity species without reference genome are still difficult to carry out genetic study using advantage of NGS, the situation is difficult to change in the near future. Some researchers have attempted to assemble preliminary reference genomes at first, followed by re-sequencing to identify a set of SNPs. However, this approach is too costly to carry out in the majority of species. On the compromise of SNP quality and reduce the cost, several methods have been tried. Finally, reduced-representation libraries sequencing (RRLS) was set up, which offered a greatly simplified library production procedure more amenable to use on large numbers of individuals/lines [18]. Now, several RRLS methods have developed, including Restriction site Associated DNA (RAD) sequencing [16, 19], and Genotyping by Sequencing (GBS) [20, 21], etc.. Using RRLS to study genetic complexity species without reference was much more efficient and cheap.
Numerous reports indicated that RAD-seq data can be utilized to accurately determine SNP genotype without a reference genome [22, 23]. However, accurate results were built on relatively elevating sequencing depths. Nonetheless, higher sequencing depth means higher cost. What is more, increasing sequencing coverage is not always effective and necessary. The pioneer studies had revealed that the sequencing depth at least four reads were required for calling genotype from homozygous and heterozygous loci to ensure 95% confidence, and depth of 6–89 was recommended to balance the cost and the quality of data. In this regard, the average sequencing depth was 12.15 in the present study, which far above the lower limit. Hence, the SNP genotype used for analysis could provide the most conserved result.
So far, SNP genotyping is still difficult to accomplish. Although the methods, such as capillary electrophoresis, high resolution melting, etc., could be used to differentiate SNP alleles, they depend on a special instrument and test kit. By contrast, the reduction of genome complexity and RAD-seq was the best choice for SNP genotyping [24]. However, it was still expensive now. The practices in rice, wheat and maize have proved DNA microarray is the best choice for SNP genotyping, which was characterized as high throughput, high accuracy, fast and cheap track. In this study, we harvested 38,605 RAD-tags with 832,204 polymorphism SNPs using RAD-seq, which provided useful information and should be helpful in developing SNP chip in the future.
The Centre of origin of sweetpotato and its wild species I. trifida
Currently, two major hypotheses about sweetpotato origins were proposed. One scenario suggests that the domestication of sweetpotato may be originated in Central American based on genetic diversity analysis [25, 26]. And the other regards that two domestication events happened in Central America and northwestern South America, which was supported by a distinct divergence between the Northern and Southern gene pools [6, 26, 27]. In contrast, the origins of I. trifida were clear, but its taxonomy has long been controversial. Tamari and Kobayashi found the wild diploid species in Acapulco, Mexico, which was believed to be a typical I. trifida now [28, 29]. In the same area as where the diploid species had been collected, triploid Ipomoes seed was also collected by Shiotani et al. in Acapulco, Mexico [30]. Tetraploid Ipomoea closely resembling sweetpotato, were also collected in Mexico, Guatemala, Colombia and Ecuador [31, 32]. And those tetraploids observed from the Andes to Mexico were believed to have been derived from the autopolyploid of diploid I. trifida [29]. In 1955, Nishiyama collected a wild hexaploid (6X, 2n = 90) in Fortin, Mexico, and designated the wild plant as I. trifida (H.B.K.) G. Don [33], which could be crossed with sweetpotato. Beyond that, several communities of I. trifida, including diploid, tetraploid and hexaploid I. trifida individuals were observed along the coast of Santa Marta, Maracay and Colombia. These plants are widely distributed in places at elevations of 5 to 20 m, and also could be found in areas of about 1000 m above sea level [29].
All these reports can briefly summarize that I. trifida and its relatives located mainly in the belt zone reaching from the Pacific Ocean to the Gulf of Mexico at about 17o-20oN latitude [34], and the most probable this vast geographical region was one of domestication of sweetpotato. In addition, based on the morphological, cytological and genetical evidence, it is logical to assume that I. trifida was one of direct progenitor of the sweetpotato [33, 35,36,37]. In recent years, numerous genetic, phylogenetic and cytogenetic studies have further confirmed the close relationship between I. batatas and I. trifida [3, 7, 38]. However, further research is needed to precisely determine when and where and how sweetpotato domestication took place.
I. trifida 6X had a closer relationship with sweetpotato
Two principal hypotheses about the origin of Ipomoea batatas were proposed. One proposed that I. batatas was autopolyploidization or allopolyploidization from I. trifida. The other held that I. trifida and I. triloba were the wild ancestors of I. batatas. Austin (1988) noted that I. trifida and I. triloba were most likely the ancestors of cultivated sweetpotato [10]. Roullier et al. did not support I. batatas was originated from I. triloba [6]. They considered that I. trifida and I. batatas are closely related. Most of researchers accepted that I. trifida was one of the ancestors of I. batatas. However, there is no agreement about the formation of the I. batatas polyploid genome whether autopolyploid originated from I. trifida or allopolyploidization from I. trifida and distant relative species. Kobayashi et al. pointed out that an autopolyploid of sweetpotato was from the ancestor. It shares with I. trifida [29].
Four different polyploidy types of I. trifida were found, including 2X (2n = 2X = 30), 3X (2n = 3X = 45), 4X (2n = 4X = 60) and 6X (2n = 6X = 90). It is important to reveal the relationship between sweetpotato and different polyploidy types of I. trifida. The evolution analysis using SNP genotypes, which distributed the whole genome of sweetpotato and I. trifida, should be more reliable and accurate than traditional molecular markers. Three different polyploidy types of I. trifida and cultivated I. batatas formed well separated clusters. Within the cluster of I. trifida, 3 different polyploidy types were grouped into three distinct lineages. Both nested within Beinong5521 and I. trifida 6X accessions were intermediate between the cultivated sweetpotato and the I. trifida 2X clusters. Among the polyploid I. trifida accessions distribution in our evolutionary tree, although they had different polyploidy and different regions, they had a close genetic relationship. It could propose at least one polyploidization or hybridization events of I. trifida 2X generated I. trifida 4X. On this basis, another two or more polyploidization or hybridization events generated I. trifida 6X.
Interestingly, the location of I. trifida 6X was far from I. trifida 2X, and between I. trifida 4X and sweetpotato on the evolutionary tree. It has a closer genetic relationship with sweetpotato than with I. trifida 4X and I. trifida 2X. This result supported Nishiyama’s hypothesis [34], and should be valuable to further clarify the origins of sweetpotato. Kobayashi et al. reported that the wild polyploids of I. batatas were collected from Mexico to northern Peru [29]. Furthermore, our hybridization studies lasting more than 3 years showed that the crossing of sweetpotato with I. trifida 6X was more easy to succeed than with I. trifida 2X or I. trifida 4X, which supported that sweetpotato had more closer genetic relationship with I. trifida 6X than with diploid I. trifida. However, further study using whole-genome sequencing and other advanced biotechnology to reveal the origins of sweetpotato is needed.
Functional annotation of sequence with SNPs
A total of 11,519 RAD-tags with SNPs loci were matched unique genes in public databases, which only counted 29.90% of total. Most of them were assigned to different function types of gene ontology categories and COG classifications, including ‘Signal transduction mechanisms’ ‘Posttranslational modification, protein turnover, chaperones’ and ‘Defense mechanisms’, etc.. From blasting in KEGG databases, about 1727 related genes were hit, which connected to the 349 well represented pathways, such as ‘Starch and sucrose metabolism’, ‘Carotenoid biosynthesis’, ‘Brassinosteroid biosynthesis’ and ‘Plant hormone signal transduction’, etc.. Therefore, these results preliminarily showed these RAD-tags related to different functional genes, and they should be useful in functional gene studies. Compared to transcriptome sequencing, the RAD-seq could generate more SNP genotype and acquired more abundant genome information. In addition, highly similar species of I. batatas, I. nil and I. trifida were found in the NCBI dataset, suggesting the presence of an orthologue in the sweetpotato genome.
Conclusions
In conclusion, our study results suggested RAD-seq should be more efficient and reliable than traditional molecular methods in evolution and genetic study of sweetpotato and I. trifida. Thousands of SNP were detected from RAD-seq and annotated with public datasets. Based on SNP genotypes, the evolution relationship between sweetpotato and different polyploidy wild species I. trifida, a putative wild ancestor of sweetpotato, was revealed for the first time that cultivated sweetpotato has the closest genetic relationship with I. trifida 6X, closely followed by I. trifida 4X. In contrast, I. trifida 2X has a further genetic relationship. The result provided a valuable clue for researchers to use I. trifida 6X as the model plant of sweetpotato research, which should be more practical than using I. trifida 2X in the future. Meanwhile, SSR primers, designed from I. trifida 6X, should be helpful to solve the problem of lacking SSR markers in I. trifida study.
Methods
Plant materials
Thirteen sweetpotato accessions, including 4 foreign varieties, 4 Chinese varieties and 5 Chinese landraces, 12 different polyploidy I. trifida accessions containing diploid types, tetraploid types and hexaploid type, and 2 genotypes from protoplast fusion were used in the present study (Table 4).
DNA extraction
CTAB (cetyltrimethyl ammonium bromide) method was used to isolate genomic DNA from all samples [39]. The concentration of all DNA samples was quantified using NonoDrop ND-2000 (Thermo Scientific, Wilmington, DE, USA) and confirmed by 1% agrose gel electrophoresis. Finally, the original DNA was dissolved in 1 × TE buffer (10 mM Tris-HCl and 1 mM EDTA, pH 8.0), and diluted to 50 ng/ul with ddH2O for RAD analyses.
RAD libraries construction and sequencing
A total of 27 RAD libraries were prepared following the method described by Baird et al. [19]. First, enzymes EcoRI and NlaIII were chosen from comparison of the number of repeated tags and the distribution of enzymatic tags of different enzymes. Second, RAD libraries were constructed using pre-selected enzymes. Then, enzymolysis genomic DNA of all samples ligated with the P1 adaptor, which containing Illumina sequence primers, PCR forward primers and barcodes, were pooled together. 300-400 bp fragments were isolated using agarose gel electrophoresis and purified. Retrieved DNA fragments were ligated with another adapter (P2), which including PCR reverse primers and divergent ends. Finally, DNA fragments with two adapters (P1 and P2) were selectively amplified through PCR reactions. PCR products were purified and pooled, then separated on a 2% agarose gel. Fragments with 375-400 bp (with indexes and adaptors) in size were divorced and purified. Pair-end (PE) sequencing was performed using an Illumina HiSeq4000 platform (http://www.illumina.com/). Quality filtering and loci assembly were conducted utilizing Stacks v1.40 [40]. The sequences of each sample were sorted depending on the barcodes.
To ensure the nucleotides quality value above Q30 (< 0.1% sequencing error) and more than 99% above Q20 (< 1% sequencing error), raw reads with ≥10% unidentified nucleotides (N), > 50% bases having phred quality < 5, with > 10 nt aligned to the adapter, containing enzyme sequence, were discarded. Raw sequence reads with RAD-tag were divided following the order of sequence depth. Heterozygous loci were tested through comparison in each sample. The comparison among RAD-tag of discrete samples produced SNPs. Finally, combine the frequency data and comparison results, low confidence SNPs from repeat regions were filtered.
SNP detection and annotation
Single nucleotide polymorphisms (SNPs) were marked with maximum likelihood models, implemented in Stacks v1.40 [40]. For SNPs calling, all trimmed reads were collapsed into clusters based on sequence similarity using Stacks v1.40 [40] under default parameters. Vcftools v 0.1.1.12b [41] was used for quality control. Finally, SNP loci detected more than 22 individuals and with allele frequency greater than 0.1 were used for further analysis.
To avoid mistakes, RAD-tags depth above 500 were excluded. Blast was done with sequences of RAD-tags of all samples. SNPs were identified in alignment results, and regarded as true polymorphisms when each allele was observed at least four times. Genotypes of all samples were determined by the resultant sequence reads containing SNPs loci.
To assess the potential function of the SNP loci, a similarity search were conducted using local gene finding software Blast2GO v2.4.2 [42] with E value cutoff of 10− 5 against Non-redundant (Nr) database, Gene Ontology (GO) database, Cluster of Orthologous Groups of proteins (COG) (http://www.ncbI.nlm.nih.gov/COG) database, Kyoto Encyclopedia of Genes and Genomes (KEGG) database (http://www.genome.jp/kegg) and the UniProt Knowledgebase (UnProtKB) protein database. RAD sequences contained SNP loci were aligned with these five databases to predict and classify possible functions.
SSR markers development
MIcroSAtellite (MISA, http:// pgrc.ipk-gatersleben.de/misa/) script was used to detect microsatellites in RAD-tags with default parameters. The SSR (Simple sequence repeat) loci with repeat units of 2–6 nucleotides and at least five reiterations in each repeat unit were retained for designing primers. Then, the tags containing microsatellites were used for primer design using Primer premier 5.0 (PREMIER Biosoft International, Palo Alto, CA) following the default setting excluding three criteria [43, 44], (1) the length of primer were ranged from 18 to 25 bases, (2) GC content of primers within 40–60% and the annealing temperature between 50 °C and 60 °C, (3) PCR products size of designed primers was 100 bp–400 bp.
In order to make sure whether these primers worked, 68 primers were randomly synthesized and amplified in 8 I. trifida accessions. The condition of PCR amplification and electrophoresis as described Ban et al. [45]. The Fragment Analyzer INFINITY™ (Advanced Analytical Technologies (AATI), Ames, Iowa, USA) electrophoresis system and DNF-900 dsDNA Reagent Kit were used to separate PCR products, and the results were analysed by PROSize 2.0 Software Version 1.3 (AATI).
Evolutionary analysis of sweetpotato and I. trifida
Neighbor-joining phylogenetic tree was undertaken using Phylip (v 3.695) [46] based on SNP dataset after quality control. The Neighbor-joining phylogenetic tree was generated with R-package of APE and iTOL v3 (http://itol.embl.de) [47, 48]. On the premise of the K value of the subgroup number from 0 to 10, population structure was inferred using fastSTRUCTURE (v1.2) with the default parameters [49]. K with marginal maximum likelihood from each K analysis was selected as the optimal subgroup number. Genetic similarity matrix was calculated between each sample using PLINK (v1.90) [50, 51] based on filtered dataset. Then, the tree of unweighted pair group method of arithmetic mean (UPGMA) clustering was calculated with Phylip (v 3.695) [46] from genetic similarity matrix, and draw with R-package of APE [48] and iTOL v3 (http://itol.embl.de) [47].
Abbreviations
- BA:
-
Biological aspect of ancestor
- BP:
-
Biological process
- CC:
-
Cellular component
- COG:
-
Clusters of orthologous groups of proteins
- CTAB:
-
Cetyltrimethyl ammonium bromide
- DA:
-
Direct assay
- DNA:
-
Deoxyribonucleic acid
- EA:
-
Electronic annotation
- EP:
-
Expression pattern
- GBS:
-
Genotyping-by-sequencing
- GO:
-
Gene ontology
- KEGG:
-
Kyoto encyclopedia of genes and genomes pathway
- MF:
-
Molecular function
- MISA:
-
Microsatellite
- MP:
-
Mutant phenotype
- NCBI:
-
National center for biotechnology information
- NGS:
-
Next-generation sequencing
- Nr:
-
Non-redundant
- PCR:
-
Polymerase chain reaction
- PE:
-
Pair-end
- RAD-seq:
-
Restriction site-associated DNA sequencing
- RRLS:
-
Reduced-representation libraries sequencing
- SM:
-
Sequence model
- SNP:
-
Single nucleotide polymorphisms
- SS:
-
Sequence or structural similarity
- SSR:
-
Simple sequence repeat
- UnProtKB:
-
UniProt Knowledgebase
- UPGMA:
-
Unweighted pair group method with arithmetic mean clustering
References
Galetto L, Bernardello G. Floral nectaries, nectar production dynamics and chemical composition in six Ipomoea species (Convolvulaceae) in relation to pollinators. Ann Bot. 2004;94:269–80.
Woolfe JA. Sweet potato: an untapped food resource. New York: Cambridge University Press; 1992.
Huang J, Sun M. Genetic diversity and relationships of sweetpotato and its wild relatives in Ipomoea series Batatas (Convolvulaceae) as revealed by inter-simple sequence repeat (ISSR) and restriction analysis of chloroplast DNA. Theor Appl Genet. 2000;100:1050–60.
Hirakawa H, Okada Y, Tabuchi H, Shirasawa K, Watanabe A, Tsuruoka H, Minami C, Nakayama S, Sasamoto S, Kohara M. Survey of genome sequences in a wild sweet potato, Ipomoea trifida (HBK) G. Don. DNA Res. 2015;22(2):171-9.
Nishiyama I, Miyazaki T, Sakamoto S. Evolutionary autoploidy in the sweet potato (Ipomoea batatas (L.) lam.) and its progenitors. Euphytica. 1975;24:197–208.
Roullier C, Duputié A, Wennekes P, Benoit L, Bringas VMF, Rossel G, Tay D, McKey D, Lebot V. Disentangling the origins of cultivated sweet potato (Ipomoea batatas (L.) lam.). PLoS One. 2013;8:e62707.
Srisuwan S, Sihachakr D, Siljak-Yakovlev S. The origin and evolution of sweet potato (Ipomoea batatas Lam.) and its wild relatives through the cytogenetic approaches. Plant Sci. 2006;171:424–33.
Hu J, Nakatani M, Lalusin AG, Kuranouchi T, Fujimura T. Genetic analysis of sweetpotato and wild relatives using inter-simple sequence repeats (ISSRs). Breeding Sci. 2003;53:297–304.
O'Brien PJ. The sweet potato: Its origin and dispersal. Am Anthropol. 1972;74(3):342-65.
Austin DF. The taxonomy, evolution and genetic diversity of sweet potatoes and related wild species. Planning Conference of Exploration, Maintenance and Utilization of Sweet Potato Genetic Resources, Lima (Peru), 23-27 Feb 1987. CIP, 1988:27-60.
Pruitt KD, Tatusova T, Maglott DR. NCBI reference sequences (RefSeq): a curated non-redundant sequence database of genomes, transcripts and proteins. Nucleic Acids Res. 2007;35:61–5.
Altshuler D, Pollara VJ, Cowles CR, Van Etten WJ, Baldwin J, Linton L, Lander ES. An SNP map of the human genome generated by reduced representation shotgun sequencing. Nature. 2000;407:513–6.
Young AL, Abaan HO, Zerbino D, Mullikin JC, Birney E, Margulies EH. A new strategy for genome assembly using short sequence reads and reduced representation libraries. Genome Res. 2010;20:249–56.
Deschamps S, la Rota M, Ratashak JP, Biddle P, Thureen D, Farmer A, Luck S, Beatty M, Nagasawa N, Michael L. Rapid genome-wide single nucleotide polymorphism discovery in soybean and rice via deep resequencing of reduced representation libraries with the Illumina genome analyzer. Plant Genome. 2010;3:53–68.
Varshney RK, Song C, Saxena RK, Azam S, Yu S, Sharpe AG, Cannon S, Baek J, Rosen BD, Tar'an B. Draft genome sequence of chickpea (Cicer arietinum) provides a resource for trait improvement. Nat Biotechnol. 2013;31:240–6.
Baxter SW, Davey JW, Johnston JS, Shelton AM, Heckel DG, Jiggins CD, Blaxter ML. Linkage mapping and comparative genomics using next-generation RAD sequencing of a non-model organism. PLoS One. 2011;6:e19315.
Cromie GA, Hyma KE, Ludlow CL, Garmendia-Torres C, Gilbert TL, May P, Huang AA, Dudley AM, Fay JC. Genomic sequence diversity and population structure of Saccharomyces cerevisiae assessed by RAD-seq. G3: genes| genomes|. Genetics. 2013;3:2163–71.
Davey JW, Hohenlohe PA, Etter PD, Boone JQ, Catchen JM, Blaxter ML. Genome-wide genetic marker discovery and genotyping using next-generation sequencing. Nat Rev Genet. 2011;12:499–510.
Baird NA, Etter PD, Atwood TS, Currey MC, Shiver AL, Lewis ZA, Selker EU, Cresko WA, Johnson EA. Rapid SNP discovery and genetic mapping using sequenced RAD markers. PLoS One. 2008;3:e3376.
Elshire RJ, Glaubitz JC, Sun Q, Poland JA, Kawamoto K, Buckler ES, Mitchell SE. A robust, simple genotyping-by-sequencing (GBS) approach for high diversity species. PLoS One. 2011;6:e19379.
Glaubitz JC, Casstevens TM, Lu F, Harriman J, Elshire RJ, Sun Q, Buckler ES. TASSEL-GBS: a high capacity genotyping by sequencing analysis pipeline. PLoS One. 2014;9:e90346.
Pfender W, Saha M, Johnson E, Slabaugh M. Mapping with RAD (restriction-site associated DNA) markers to rapidly identify QTL for stem rust resistance in Lolium perenne. Theor Appl Genet. 2011;122:1467–80.
Lamour KH, Mudge J, Gobena D, Hurtado-Gonzales OP, Schmutz J, Kuo A, Miller NA, Rice BJ, Raffaele S, Cano LM. Genome sequencing and mapping reveal loss of heterozygosity as a mechanism for rapid adaptation in the vegetable pathogen Phytophthora capsicI. Mol Plant Microbe In. 2012;25:1350–60.
Zhang BD, Xue DX, Wang J, Li YL, Liu BJ, Liu JX. Development and preliminary evaluation of a genomewide single nucleotide polymorphisms resource generated by RAD-seq for the small yellow croaker (Larimichthys polyactis). Mol Ecol Resour. 2016;16:755–68.
Zhang DP, Cervantes J, Huaman Z, Carey E, Ghislain M. Assessing genetic diversity of sweet potato (Ipomoea batatas (L.) lam.) cultivars from tropical America using AFLP. Genet Resour Crop Ev. 2000;47:659–65.
Gichuki ST, Berenyi M, Zhang DP, Hermann M, Schmidt J, Glössl J, Burg K. Genetic diversity in sweetpotato [Ipomoea batatas (L.) Lam.] in relationship to geographic sources as assessed with RAPD markers. Genet Resour Crop Ev. 2003;50:429–37.
Roullier C, Rossel G, Tay D, McKey D, Lebot V. Combining chloroplast and nuclear microsatellites to investigate origin and dispersal of New World sweet potato landraces. Mol Ecol. 2011;20(19):3963–77.
Teramura T, Shiotani I, Kawase T. Triploid plants of Ipomoea collected in Mexico. Japan J Breed. 1967;17:187–8.
Kobayashi M. The Ipomoea trifida complex closely related to sweet potato. Proceedings, Sixth Symposium of the International Society for Tropical Root Crops/hosted by CIP in Lima, Peru, 21-26 February 1983. Lima, Peru: International Potato Center (CIP), 1984; pp:561-68.
Shiotani I, Kawase T. Origin and differentiation of the sweet potato. Genome constitution and domestication. Japan J Breed. 1980;30:306–9.
Martin FW, Ruberté RM, Jones A. A wild Ipomoea species closely related to the sweet potato. Econ Bot. 1974;28(3):287–92.
Muramatsu M, Shiotani I. Closely related wild Ipomoea species of the sweet potato in Mexico and Guatemala. A preliminary report of the Kyoto University Scientific Expedition to the Latin America. 1974;1:9–30.
Nishiyama I. The origin of the sweet potato. In: Tenth Pacific Sci Congr Univ Hawaii, Honolulu; 1961. p. 119–28.
Nishiyama I. Evolution and domestication of the sweet potato. Shokubutsugaku Zasshi. 1971;84(996):377–87.
Nishiyama I, Fujise K, Teramura T, Miyazaki T. Studies of sweet potato and its related species: I. Comparative investigationson the chromosome numbers and the main plant characters of Ipomoea speclesin section Batatas. Japan J Breed. 1961;11(1):37–43.
Nishiyama I, Teramura T. Mexican wild forms of sweet potato. Econ Bot. 1962;16(4):305–14.
Kobayashi M, Miyazaki T. Sweet potato breeding using wild related species. In: Proc IV Symp. Int Soc trop. Root crops; 1976. p. 53–7.
Jarret RL, Austin DF. Genetic diversity and systematic relationships in sweetpotato (Ipomoea batatas (L.) lam.) and related species as revealed by RAPD analysis. Genet Resour Crop Ev. 1994;41(3):165–73.
Murray M, Thompson WF. Rapid isolation of high molecular weight plant DNA. Nucleic Acids Res. 1980;8:4321–6.
Catchen J, Hohenlohe PA, Bassham S, Amores A, Cresko WA. Stacks: an analysis tool set for population genomics. Mol Ecol. 2013;22:3124–40.
Danecek P, Auton A, Abecasis G, Albers CA, Banks E, DePristo MA, Handsaker RE, Lunter G, Marth GT, Sherry ST. The variant call format and VCFtools. Bioinformatics. 2011;27:2156–8.
Conesa A, Götz S, García-Gómez JM, Terol J, Talón M, Robles M. Blast2GO: a universal tool for annotation, visualization and analysis in functional genomics research. Bioinformatics. 2005;21:3674–6.
Barchi L, Lanteri S, Portis E, Acquadro A, Valè G, Toppino L, Rotino GL. Identification of SNP and SSR markers in eggplant using RAD tag sequencing. BMC Genomics. 2011;12:304.
Dutta S, Kumawat G, Singh BP, Gupta DK, Singh S, Dogra V, Gaikwad K, Sharma TR, Raje RS, Bandhopadhya TK. Development of genic-SSR markers by deep transcriptome sequencing in pigeonpea [Cajanus cajan (L.) Millspaugh]. BMC Plant Biol. 2011;11:17.
Ban SH, Yun WH, Kim GH, Kwon SI, Choi C. Genetic identification of apple cultivars bred in Korea using simple sequence repeat markers. Horticulture. 2014;55:531–9.
Felsenstein J. PHYLIP (Phylogeny Inference Package) version 3.6. Distributed by the author. Seattle: Dep Genome Sci Univ Washington; 2005.
Letunic I, Bork P. Interactive tree of life (iTOL) v3: an online tool for the display and annotation of phylogenetic and other trees. Nucleic Acids Res. 2016;44(W1):242–5.
Paradis E, Claude J, Strimmer K. APE: analyses of phylogenetics and evolution in R language. Bioinformatics. 2004;20:289–90.
Raj A, Stephens M, Pritchard JK. fastSTRUCTURE: variational inference of population structure in large SNP data sets. Genetics. 2014;197(2):573-89.
Chang CC, Chow CC, Tellier LC, Vattikuti S, Purcell SM, Lee JJ. Second-generation PLINK: rising to the challenge of larger and richer datasets. Giga Science. 2015;4:7.
Purcell S, Neale B, Todd-Brown K, Thomas L, Ferreira MA, Bender D, Maller J, Sklar P, De Bakker PI, Daly MJ. PLINK: a tool set for whole-genome association and population-based linkage analyses. Am J Hum Genet. 2007;81:559–75.
Acknowledgements
This research was supported by The Financial Innovation Project of Sichuan Province (Project No. 2015JSCX-003, 2016LWJJ-002, 2016ZYPZ-005, 2017QNJJ-001 and 2017QNJJ-021), the National Natural Science Foundation of China (Project No. 31101119), the Breeding Cooperation of Sichuan Province (Sweetpotato), and the earmarked fund for China Agriculture Research System (CARS-10-B5). We thank Majorbio Bio-pharm Technology Co., Ltd. (Shanghai, China) for assisting with the RAD-Seq technique.
Funding
The Financial Innovation Project of Sichuan Province (Project No. 2015JSCX-003, 2016LWJJ-002, 2016ZYPZ-005, 2017QNJJ-001 and 2017QNJJ-021), the National Natural Science Foundation of China (Project No. 31101119), the Breeding Cooperation of Sichuan Province (Sweetpotato), and the earmarked fund for China Agriculture Research System (CARS-10-B5).
Availability of data and materials
The datasets generated and analysed during the current study are not publicly available, because the datasets will be used for other study, but are available from the corresponding author on reasonable request.
Author information
Authors and Affiliations
Contributions
JYF analyzed data and drafted the manuscript. ML selected sweetpotato varieties and analyzed the data. SZ analyzed the data and drafted the manuscript. CZ guided analysis of SSR and SNP marker, and revised the manuscript. STY selected sweetpotato varieties. SQ analyzed the SNP data and revised the manuscript. WFT and HJQ guided for sweetpotato diversity analysis and contributed in drafting the manuscript. DYW guided for data analysis and revised the manuscript. ZGP guided the entire study and revised the manuscript. All authors read and approved the final manuscript.
Corresponding authors
Ethics declarations
Ethics approval and consent to participate
Not applicable.
Consent for publication
Not applicable.
Competing interests
The authors declare that they have no competing interests.
Publisher’s Note
Springer Nature remains neutral with regard to jurisdictional claims in published maps and institutional affiliations.
Additional files
Additional file 1:
Figure S1. The distribution of reads number in different average fragments depth. Figure S2. The distribution of Top-hits species based on Gene Ontology (GO) result. Figure S3. The sequence distribution with different Evidence Codes. Figure S4 COG classification assigned sequences to top orthologous groups. The x-axis represents the abbreviation of COG Categories, and the full name of COG Categories was on the right. The y-axis denotes the sequence number. Figure S5. The sequence distribution in different pathway detecting from the KEGG database. (PDF 1490 kb)
Additional file 2:
Table S1. The distribution of SSR loci with different SSR unit and different unit number. (DOCX 27 kb)
Rights and permissions
Open Access This article is distributed under the terms of the Creative Commons Attribution 4.0 International License (http://creativecommons.org/licenses/by/4.0/), which permits unrestricted use, distribution, and reproduction in any medium, provided you give appropriate credit to the original author(s) and the source, provide a link to the Creative Commons license, and indicate if changes were made. The Creative Commons Public Domain Dedication waiver (http://creativecommons.org/publicdomain/zero/1.0/) applies to the data made available in this article, unless otherwise stated.
About this article

Cite this article
Feng, J.Y., Li, M., Zhao, S. et al. Analysis of evolution and genetic diversity of sweetpotato and its related different polyploidy wild species I. trifida using RAD-seq. BMC Plant Biol 18, 181 (2018). https://doi.org/10.1186/s12870-018-1399-x
Received:
Accepted:
Published:
DOI: https://doi.org/10.1186/s12870-018-1399-x