
Abstract
We examine the characteristics of consumers who reported scams to the U.S. Federal Trade Commission. We assess how consumers vary demographically across six scam types, and how the overall emotional sentiment of a consumer’s complaint (positive, negative, neutral/mixed) relates to reporting victimization versus attempted fraud (no losses). For romance, tech support, and prize, sweepstakes, and lottery scams, more older than young and middle-aged adults reported victimization. Across all scam types, consumers classified as Black, Hispanic, and Asian/Asian Pacific Islander were more likely than non-Hispanic white consumers to report victimization than attempted fraud. Relative to complaints categorized as emotionally neutral or mixed, we find that emotionally positive complaints and emotionally negative complaints were significantly associated with victimization, but that these relationships differed by scam type. This study helps identify which consumer groups are affected by specific scams and the association between emotion and victimization.
Introduction
Mass marketing scams are a form of financial fraud in which perpetrators use mass communication technologies such as robocalls, phishing emails, social media, text messages, and other low-cost methods to target and exploit thousands of consumers, often overseas. Mass marketing scams typically incorporate social engineering tactics that involve “trickery, persuasion, impersonation, emotional manipulation, and abuse of trust to gain information or computer-system access” (Thompson 2006, p. 1).
There is significant variation in the types and prevalence of mass marketing scams, which change over time in response to new communication and money transfer methods, changes in culture and purchasing habits, and national and global events such as the Covid-19 pandemic (Whittaker et al. 2022). Consumer complaints of mass marketing scams received by the U.S. Federal Trade Commission (FTC) increased substantially throughout the Covid-19 pandemic, reaching a peak of 2.8 million in 2021 (FTC 2022a), and then declining to 2.4 million in 2022 (FTC 2023). Several of the most common mass marketing scams reported in 2022 were imposter scams (~ 726,000 complaints), online shopping scams (327,000 complaints), prize, sweepstakes, and lottery scams (~ 143,000 complaints), and fake business and job opportunities (~ 92,700 complaints) (FTC 2023). The majority of these complaints involve attempted fraud where the consumer was exposed to a scam but was not victimized—i.e., no financial losses were reported. The consumer may have immediately recognized that the solicitation was fraudulent or became suspicious before sending money, or someone intervened before losses occurred. In the remaining 26% of complaints, consumers reported victimization and median losses were $650 per complaint (FTC 2023).
In the present study, we use consumer fraud complaints to the FTC (N = 1,010,748) to assess the demographic correlates of victimization versus attempted fraud for six types of mass marketing scams: romance; tech support; prize, sweepstakes, lottery; government imposter; business imposter; and online shopping. We also use sentiment analysis to categorize the emotional valence of each complaint narrative as either positive, negative, or neutral/mixed, and determine how emotional valence relates to reports of victimization by different types of scams. In the following sections, we first review literature on the extent of underreporting by both victims and non-victims. Next we present literature on the demographic and socioeconomic characteristics of victims, showing that characteristics such as age, sex, race, income, and education vary across scam type. Last we identify studies that demonstrate a connection between emotion and fraud victimization. We describe how emotional arousal affects financial decision making, and how fraud negatively impacts victims’ emotional well-being.
Underreporting
Underreporting, both to law enforcement and in surveys, presents a challenge for researchers and consumer protection agencies seeking to identify vulnerable consumers for targeted outreach and awareness. Using data from three mass marketing fraud prevalence studies administered in 2005, 2011, and 2017, Anderson (2021) found that only 4.8% percent of U.S. fraud victims complained to a government agency or the Better Business Bureau. Raval (2020) compared victim information taken from fraud cases against nine mass marking scams to FTC consumer complaint data on those same scams. For scams that involved low-dollar losses (average loss of $40–90 per victim), as few as 1 in ~ 2,500 victims submitted a complaint. The complaint rate was closer to 1 in 10 victims for scams that involved significantly higher dollar losses (Raval 2020, Table 1, p. 171). This indicates that financial losses motivate reporting behavior. In another analysis of consumer complaint behavior, Raval (2021) found demographic differences in reporting, such that consumers situated in heavily minority areas were less likely to complain than those in predominantly white areas.
Underreporting issues also extend to survey research on fraud victimization. In 2003, researchers with AARP administered a survey to known victims of fraud and found that 50% of lottery scam victims and 77% of investment fraud victims did not report investing or paying money in any of the relevant questions about investment fraud or a lottery scam (AARP 2003).
Victims may not report to law enforcement, survey researchers, and consumer protection agencies for reasons such as self-blame, shame, embarrassment, and the stigma of victimization (Cross et al. 2016). Kemp (2022) recently found that the most common reason for not reporting was opportunity cost, including the time required for gathering evidence and contacting authorities. Another reason for not reporting is not considering the incident to be a crime (Kemp 2022), and feeling that there is little that authorities can do to hold perpetrators accountable (Cross 2020). Raval’s (2020) analysis indicates that lack of trust in authorities and lack of social capital may account for lower rates of fraud reporting among residents in predominantly minority communities compared to residents in predominantly white communities.
For every unreported case of fraud victimization, there are many more incidents of attempted fraud that consumers do not report. Attempted fraud is so ubiquitous that reporting every unwanted phone call, email, text message, mailed letter, or other scam solicitation would be tremendously burdensome. Illustrating the extraordinary frequency of mass marketing scams, a large market survey of more than 36,000 American adults showed that 45% received imposter scam text messages, emails, or calls every day, and another 24% were targeted each week (YouGov America 2023). Some consumers may assume that government agencies only address complaints that involve a financial loss. However, given that approximately three quarters of the fraud complaints in the FTC’s Consumer Sentinel Network involve no reported losses (FTC 2023), many people are still motivated to report attempted fraud.
Demographic characteristics of fraud reporters
A growing body of research seeks to understand consumer risk factors associated with mass marketing scam victimization, yet existing studies present a mixed and sometimes contradictory picture of which demographic and socioeconomic groups are most susceptible. One reason is that many fraud studies focus on a narrow subtype of mass marking scams—such as investment fraud or romance scams (e.g., Buchanan and Whitty 2014; Deliema et al. 2020), and risk factors do not necessarily generalize across the universe of consumer fraud. Another limitation of existing victim profiling research is that survey samples are typically small—between several hundred to a few thousand respondents. One notable exception is the U.S. Bureau of Justice Statistics’ (BJS) nationally representative fraud survey of 51,000 U.S. respondents that assessed the prevalence of victimization by seven fraud subtypes (Morgan 2021). Because overall rates of self-reported victimization were extremely low (1.25%), victim demographic profiles for specific mass marketing scams were not described in the report.
Random sample surveys that ask respondents to self-report fraud victimization typically find that young and middle-aged adults are more likely than older adults to report losing money in a scam (Anderson 2019). For scams overall, FTC’s consumer complaint data also indicate that older adults are the least likely of any age group to report a loss (compared to attempted fraud); however, their median losses are between 1.5 and three times greater than losses reported by younger adults (FTC 2022b).
Looking at general fraud victimization obscures consumer age differences by scam type. For example, in a survey of law enforcement-identified fraud victims, Pak and Shadel (2011) found that lottery, sweepstakes, and prize scam victims were older than the general U.S. population aged 50 and older. Anderson (2019) found that survey participants aged 65 and older were more likely to self-report computer repair fraud (i.e., tech support scams) than young and middle-aged adults. Using victim information from 23 consumer protection law enforcement cases, Raval (2021) found that the victimization rate was 43% higher in zip codes with a median age of 55 compared to zip codes with a median age of 25. Studies that examine age-related declines in cognitive functioning suggest that older adults may be more susceptible to scams (Han et al. 2016a, 2016b), yet these and other prior studies do not control for different rates of fraud exposure by age. Older adults, possibly due to higher rates of social isolation and greater wealth, may be targeted more than other age groups.
Prior research also suggests that risk factors such as income, education, and sex vary across scam types. For example, Whitty (2020) found that men and educated people were more likely to be deceived by cyberscams in general. DeLiema, Pak, and Shadel (2020) found that compared to general investors, investment fraud victims were more likely to be male. However, a recent study that examined investment fraud cases in Canada showed that 60% of the defrauded investors were female (Lokanan and Liu 2021). Using samples of independently identified victims, Pak and Shadel (2011) found that investment fraud victims were more likely to be male and to have higher education and income than the general population, whereas lottery scam victims were more likely to be female and have lower education and income compared to the general population.
Understanding which race/ethnic communities are affected by different forms of fraud is important for fraud prevention. Such research can inform whether fraud prevention messages should be presented in multiple languages or whether it should focus on specific scam subtypes more than others in particular communities. Broader crime victimization surveys find that Black and Hispanic individuals experience higher rates of serious criminal offenses compared to non-Hispanic (NH) white individuals (Morgan and Truman 2020). Similarly, in the 2017 fraud prevalence study conducted by BJS (Morgan 2021), a smaller percentage of white respondents were victims (1.19%) compared to respondents who were Black (1.67%) and respondents who were Native Hawaiian or Other Pacific Islander, American Indian or Alaska Native, or two or more races (2.19%). Raval (2021) found that victimization rates by payday loan and student debt relief frauds were substantially higher in majority Black communities. This may suggest that these scams disproportionality target economically disadvantaged communities.
For Hispanics, Raval (2021) found that victimization rates were slightly higher in moderately Hispanic communities compared to 0% Hispanic communities, and the victim rate was 14% lower in 100% Hispanic areas compared to 0% Hispanic areas. These results could indicate that ethnically homogenous communities provide a buffer against fraud; Hispanic community members may inform other network members about common scams affecting their community. However, it is also possible that the Raval (2021) sample of fraud cases did not include scams that most affect Hispanic individuals. For example, DeLiema and Witt (2021) found that both Black and Hispanic communities were more likely than majority NH white communities to report victimization (versus attempted fraud) by the Social Security Administration (SSA) imposter scam. This could suggest these groups are less familiar with the SSA’s roles and norms for interacting with U.S. consumers.
Taken together, prior research findings indicate that victim demographic profiles vary by scam type, perhaps due to differences in fraud exposure or other factors that make some groups more susceptible to certain types of persuasion messages than others. These differences speak to the importance of analyzing victim risk profiles separately for different types of mass marketing scams.
Emotion and fraud victimization
Demographic characteristics alone do not explain differences in rates of fraud victimization among consumers. “In the moment” persuasion tactics affect decision making and play a role in victimization. An important “in the moment” factor is the degree to which the scam solicitation message elicits strong emotional arousal. Fraud perpetrators use visceral factors, including moods, emotions and drive states that have a direct hedonic impact, to manipulate decision making (Loewenstein 1996). Government imposter and tech support scams incorporate fear-based messaging to make the target feel a sense of urgency and insecurity, whereas other scams—like prize, sweepstakes, and lottery scams—use positive appeals to make the target feel excited in anticipation of a and reward.
According to the Elaboration Likelihood Model (ELM) of persuasion (Petty and Cacioppo 1986), individuals process persuasive information through either a “central route” that involves dedicating attentional resources to carefully scrutinize and cross-reference the message with prior knowledge, or a “peripheral route” which involves using heuristic shortcuts and reliance on basic cues to judge the legitimacy of the message. High arousal emotions like fear and excitement influence how a persuasion message is processed (Petty and Briñol 2015). In controlled experimental studies, emotions have been shown to produce peripheral thinking to influence subsequent judgements. For example, Dunn and Schweitzer (2005) reported that participants induced to feel happy rated acquaintances as more trustworthy than participants induced to feel angry or sad. In another study, subjects in a sadness-induction condition were more impatient and chose to accept an immediate payout of less money instead of waiting to receive more money after a delay (Lerner et al. 2013). Kircanski et al. (2018) found that young and older adults in positive and negative arousal states (excited and frustrated, respectively) were more likely to want to purchase a product featured in a misleading advertisement than those in a neutral emotional state.
While prior research suggests that emotional arousal increases susceptibility to persuasion and fraud (see Norris and Brookes (2021) for review), there is also research documenting the emotional outcomes of fraud. Victims often report guilt, shame, embarrassment, severe stress and anxiety, trouble sleeping, relationship trouble, divorce, and indebtedness (Button et al. 2014; Cross 2015; FINRA Investor Education Foundation 2015; Knüpfer et al. 2021). A lack of access to criminal justice interventions, combined with dismissive responses from law enforcement, exacerbate victims’ feelings of self-blame (Cross et al. 2016). Another contributor to negative psychological effects is that most fraud victims are not be eligible for victim assistance programs that could help them financially recover (Cross 2018a). In the current study, consumers’ descriptions of incident in their fraud complaint may reflect how they were feeling at the time of exposure, as well as the psychological impact of the experience.
Current study
The current study uses 18 months of consumer complaint data on mass marketing fraud from the largest consumer complaint database in the U.S.—the FTC’s Consumer Sentinel. The Consumer Sentinel is a nonpublic database of tens of millions of consumer complaints on fraud, identity theft, and Do Not Call Registry violations. It is designed for law enforcement agencies to identify individuals who have been affected by financial and identity crimes, but is also a tool to track trends in scam types, scam solicitation methods, payment methods, and losses. Complaints include incidents where consumers encountered a scam but did not lose money (attempted fraud), as well as incidents that resulted in a financial loss (victimization). Approximately, one quarter of complaints involve victimization.
The objective of the present study is to describe and compare the demographic characteristics of consumers who reported victimization versus attempted fraud across six common subtypes of mass marketing scams. These subtypes are defined in Table 1 and include (1) romance; (2) tech support; (3) prize, sweepstakes, lottery; (4) government imposter; (5) business imposter; and (6) online shopping. These subtypes were selected because they represent some of the most prevalent mass marketing scams reported to FTC during the Covid-19 pandemic between 2020 and 2022 and resulted in high losses to consumers. Second, these scams are more clearly defined in the literature (see Beals, DeLiema, and Deevy (2015) for a taxonomy). Third, complaints were more likely to involve true incidents of fraud rather than negative consumer experiences with a legitimate product, service, or organization. And last, in nearly all of the selected subtypes, perpetrators use social engineering tactics, emotional arousal, and impersonation—of a government agency, a well-known business, a romantic interest, etc.—to gain the target’s trust and compliance.
In addition to the Consumer Sentinel’s vast scope and inclusion of victim and attempted fraud complaints, another advantage is the rich qualitative information provided in each consumer’s description of the scam. These complaint narratives may reflect what the consumer was feeling while they interacted with the perpetrator or viewed the scam solicitation. They often include a description of the content of the solicitation message, which may involve negative emotional appeals (such as the threat of arrest or a computer virus), or positive emotional appeals (such as the promise of romantic connection or a financial windfall). The complaint narrative may also include text that expresses the consumer’s current feelings about the incident, such as anger, mistrust, shame, and sadness.
In the present study, we conduct a sentiment analysis to classify each complaint narrative as either emotionally positive, negative, or neutral/mixed (i.e., affect polarity). Sentiment analysis is a computer-aided method to identify and extract subjective information in a large body of text to categorize its overall emotional valence (Mohammad 2015). Sentiment analysis is appropriate for these data because there are more than 1 million incident narratives to categorize, making researcher-led qualitative data analysis not feasible for the full sample. We use sentiment analysis to test whether victims express significantly more positive or significantly more negative sentiments in their complaints compared to consumers who reported attempted fraud, and how this varies by scam type. This sentiment analysis furthers our understanding of the relationship between emotion and victimization across major forms of mass marketing scams.
Method
Sample
The analysis sample is restricted to fraud complaints involving romance (N = 42,861), tech support (N = 70,363), government imposter (N = 248,932), business imposter (N = 386,802), prizes/sweepstakes/lottery (N = 63,813), and online shopping scams (N = 242,331). When filing a complaint through the FTC’s call center, website, and mobile channels, consumers self-select or describe the type of scam they experienced, such as a government agency impersonator, online shopping, job or money making opportunity, etc. The sample is limited to complaints filed with the FTC between November 1, 2020, when the new intake system was implemented, and April 30, 2022, a period of 18 months. Complaints filed as Do Not Call Registry violations and identity theft were excluded, as were complaints filed with other consumer protection agencies that were later imported into the Consumer Sentinel.
Among the 1,245,274, 18.8% were excluded because (a) the consumer did not report their zip code, (b) the zip code was a PO Box or Unique Organization (such as a business or university with its own zip code), or (c) the zip code had a population of fewer than 100 residents. These zip codes lack census block demographic data needed for the estimation of consumer race and ethnicity. Complaints with fewer than 20 characters in the narrative description of the fraud incident were also excluded, as were complaints lacking the consumer’s first and last name, which was needed for the estimation of their gender and race/ethnicity. The final analysis sample included 1,010,748 fraud complaints. Consumer complaints to the FTC are nonpublic. Data were accessed and analyzed by the second author, an employee of the Federal Trade Commission. Segments of the code used for the analysis are available upon a Freedom of Information Act request. The study was reviewed and approved by the University of Minnesota Institutional Review Board.
Variables
Victimization
Victimization is the dependent variable used for the regression analysis. It is defined as reporting a financial loss of $1 or more. Twenty-nine percent (28.8%) of complaints involved victimization and were coded as “1.” No loss complaints (attempted fraud) were coded as “0.”
Demographic characteristics
When filing a complaint with the FTC, consumers provide their name, address, and select their age from a drop-down menu. Ages are grouped in 10-year increments (20 to 29, 30 to 39, 40 to 49, etc.). Consumers aged 19 and younger are grouped together, as are consumers aged 80 and older. Consumers are not asked to report their sex. We used the Gender Guesser 0.4.0 package in Python (https://pypi.org/project/gender-guesser/) to predict and assign sex based on the consumer’s first name. Overall, 38.5% percent of consumers were assigned female, 28.0% were assigned male, and 33.5% were unassigned. Unassigned consumers primarily have names that are androgynous but may also have names that are nontraditional, rare, misspelled, or associated with nationalities that do not exist in the 40,000-name library.
The FTC does not ask for complaint filers’ race or ethnicity. To classify consumers’ race/ethnicity for analysis, we used Bayesian Improved First Name Surname Geocoding (BIFSG) (Voicu 2018). The original Bayesian Improved Surname Geocoding (BISG) algorithm was developed and validated using administrative healthcare organization and mortgage lending application data (see Adjaye-Gbewonyo et al. 2014; Elliott et al. 2009). This method has been applied in studies examining racial disparities in Covid-19 (Labgold et al. 2021), polarized voting patterns (Barreto et al. 2021), and fair lending product analysis (Zhang 2018). The addition of first name in the BIFSG algorithm helps improve the predictive accuracy of race/ethnicity estimations, particularly for NH Black individuals (Voicu 2018).
Race/ethnic categories predicted by BIFSG include Hispanic, Non-Hispanic (NH) Black, NH white, Asian/Pacific Islander, American Indian/Alaskan Native, and multiracial. For each consumer, we first calculate the direct probabilities of belonging to each race/ethnic category based on first name, surname, and the racial composition of the consumer’s census block. For example, hypothetical Consumer A may have the following direct probabilities based on their full name and zip code: 58.5% NH white, 9.3% Hispanic, 28.5% NH Black, 9.3% Asian/Pacific Islander, 0.3% American Indian/Alaskan Native, and 3.4% multiracial. Next, we used the max a priori method to assign each consumer the race/ethnicity associated with their highest direct probability. Using the max a priori method, Consumer A in the above example would be assigned NH white.Footnote 1
BIFSG predicted consumers’ race/ethnicity in 74.2% of complaints. For the complaints where the consumer’s race could not be estimated, we use the original Bayesian Improved Surname Geocoding (BISG) algorithm that uses surname and census block characteristics only (no first name). This yielded race/ethnicity estimates for another 12.2% of complaints. For the remaining 13.6% of complaints, we defaulted to assigning each consumer the predominant race/ethnicity of their census block. Overall, 79.6% of consumers were assigned NH white, 8.9% Hispanic, 7.7% NH Black, 3.6% Asian/Pacific Islander (API), 0.13% American Indian/Alaskan Native, and 0.16% multiracial.
Complaint characteristics
Consumers select the fraud contact method using a drop-down menu: phone call/voicemail (reference category), text message, social media, website or apps, online ad or pop-up, email, mail, and other.
To identify seasonal patterns in reporting and victimization, we include a variable that denotes the season the complaint was filed. Spring, the reference category, was defined as complaints filed in March, April, and May; summer was June, July, and August; fall was September, October, and November; and winter was December, January, and February.
We created a variable that specifies whether a third party, such as a friend or family member, filed the complaint on the consumer’s behalf (no = 1, 96.2%).
Sentiment analysis
We use Valence Aware Dictionary and sEntiment Reasoner (VADER), to identify and categorize the emotional valence—positive, negative, neutral/mixed—of consumers’ descriptions of the fraud incident. VADER is an open-source lexicon and rule-based sentiment classifier developed by Hutto and Gilbert (2014). It assess the valence and intensity (-1 to + 1) of emotion in informal text, such as posts on social media. VADER was initially tested and validated using Twitter posts (tweets) and is advantageous to other sentiment analysis tools because it can classify emoticons, acronyms, and slang commonly used in informal text.
Researchers have used VADER to analyze sentiments in Twitter posts associated with Covid-19 (Mittal et al. 2021), anti-vaccination beliefs (Garay et al. 2019), as well as sentiments in customer support emails (Borg and Boldt 2020). VADER is appropriate for the current study because consumer complaints are informal and relatively short. Average characters is 596 including spaces, with a standard deviation of 649 (between 90 and 150 words). Recognizing that victim complaints are typically longer than attempted fraud complaints, we control for number of characters in regression models.
The average sentiment intensity and valence for each of the six scam types are presented in Table 2. Reports involving prize, sweepstakes, and lottery scams have the highest emotional intensity (0.42) and are categorized as positive overall. This is likely because consumers describe the content of the solicitation message and how it made them initially feel. Messages about prizes, sweepstakes, and lotteries generally contain positive, trust-laden language promising financial rewards (Carter 2015; Rich 2018). Online shopping scams have the lowest emotional intensity (0.01), on average, and are categorized as neutral/mixed. Neutral/mixed complaints are complaints that have low emotional content, as well as complaints that contain roughly equal levels of positive and negative emotional intensity. Example consumer complaints and their estimated valence and intensity using VADER are presented in Appendix Table 7.
Analysis procedure
All descriptive and regression analysis procedures were conducted using Python. For descriptive statistics, we analyze overall consumer demographic and complaint characteristics for each scam type separately (N, %). We also analyze the characteristics of those who experienced victimization by each scam (% victims, median losses ($)). Because the outcome is binary, logistic regression was used to estimate the effects of consumer and scam characteristics on the likelihood of reporting victimization versus attempted fraud for each of the six scam types. To adjust for community-level differences in complaint filing, we control for the fraud complaint rate by zip code, calculated as the total number of all fraud complaints filed by each zip code between 2018 and 2020, divided by the 2018 population of that zip code.
Results
Descriptive consumer characteristics (age, estimated sex, and estimated race/ethnicity) for each of the six scam types are presented in Table 3, along with the percent of complaints that involved victimization (versus attempted fraud), and the median losses. Table 4 describes the distribution of incident-level characteristics including which seasons scams were reported, methods of contact, sentiment classification (negative, neutral/mixed, and, positive) and whether reports were filed by another person on the consumer’s behalf.
Odds ratios (OR) and 95% confidence intervals (95%CI) from separate logistic regression models for each scam type are presented in Table 5. Each regression model estimates the effects of consumer and incident-level characteristics on the likelihood of reporting victimization versus attempted fraud. Because consumer and incident characteristics vary substantially across scam types, results are presented separately for each category. Appendix Table 8 presents the results of all scam types together in a single model.
Romance scams
As shown in Table 3, nearly half of the ~ 43,000 consumers who reported a romance scam were victims (49.4%). The majority were younger than age 50; however, the odds of reporting victimization (versus attempted fraud) increased with age. For example, although adults aged 80 and older comprised only 1.4% of all romance scam reporters, they were 76% more likely to indicate a loss than romance scam reporters in their 30 s who comprised 16.6% of the sample (OR 1.76, 95%CI 1.45, 2.14, p < 0.001).
Median fraud losses were higher for romance scams ($2,500) than all other scam types. In a similar pattern observed across most scam types, older victims reported significantly higher median losses than younger and middle-aged victims. For example, median losses were $10,000 for those aged 70 and older and ranged from $450 to $3,000 for consumers younger than age 50.
Although more consumers were classified as female across all scam types, romance scam reporters who were classified as male were 26% more likely to report victimization than reporters classified as female (OR 1.26, 95%CI 1.19, 1.33, p < 0.001). A similar pattern emerged for other scam types, although given the high number of reporters whose names could not be classified as either male or female (between 30.7% and 36.7% of reporters across scam types), these results should be treated as preliminary.
Using BIFSG to categorize consumers’ race/ethnicity based on first names, surnames, and zip codes, we find that romance scam reporters were relatively more diverse than reporters of other scams. Twelve percent were categorized as Hispanic, 6.9% were Black, and 5.0% were Asian/Asian Pacific Islander. Consumers categorized as Asian/Asian Pacific Islander were 89% more likely to report victimization by romance scams relative to consumers categorized as NH white (OR 1.89, 95%CI 1.71, 2.08, p < 0.001). Notably, this group experienced the highest median losses—$10,200—roughly five times higher than what was reported by romance scam victims categorized as other race/ethnic groups.
As shown in Table 4, compared to other scam types, a substantially higher proportion of people who reported romance scams were contacted on social media (37.3%). Other common contact methods were websites and applications (19.6%) and text message (18.25). Romance scams had the highest proportion of complaints filed by a proxy (7.6%), and these were significantly associated with victimization (p < 0.001).
Using VADER to analyze the overall emotional valence of each complaint narrative, we find that 42.7% of romance scam complaints were categorized as negative, 46.4% were positive, and 10.9% were categorized as neutral or contained an equal mix of positive and negative emotional sentiment (e.g., “I really loved this person. I am so angry I trusted him.”) Compared to emotionally neutral/mixed complaints, complaints categorized as positive were 17% more likely to involve victimization. Negative complaints were not significantly associated with victimization (OR 1.02, 95%CI 0.95, 1.09, p = 0.613).
Prize, sweepstakes, and lottery scams
Compared to romance scams, a much lower proportion of prize, sweepstakes, and lottery scam complaints involved victimization (17.4%). Of these cases, median losses were $857. Older victims reported 5 to 13 times higher median losses compared to younger victims. For example, median losses were $6,830 for those in their 80 s compared to $300 for victims aged 20-to-49-years-old. The relationship between age and victimization for prizes, sweepstakes, and lottery scams followed a U-shaped pattern, such that compared to adults aged 30 to 39, young adults and older adults were significantly more likely to report victimization relative to attempted fraud.
Thirty-seven percent of reporters were classified as female and 32.1% were classified male. As with romance scams, males were slightly more likely to report victimization than attempted fraud compared to females (OR 1.08, 95%CI 1.03, 1.14, p < 0.001).
More than 82% of prize, sweepstakes, and lottery scam reporters were categorized as NH white, 7.8% were categorized as Black, and 7.0% were categorized as Hispanic. As shown in Table 5, Black consumers were 84% more likely to report victimization, Hispanic consumers were 56% more likely to report victimization, and Asian/Asian Pacific Islanders were 68% more likely to report victimization relative to attempted fraud compared to NH white consumers (all p < 0.001).
Text messages (36.3%) and phone calls (33.0%) were the most common reported methods of contact. Solicitations received by text were 69% less likely to be associated with victimization compared to solicitations received by phone (OR 0.31; 95%CI 0.29, 0.34, p < 0.001). Although the effect size is small, we observe that consumers who reported a prize, sweepstake, or lottery scam in the winter were 6.0% less likely to report victimization than consumers who reported in the spring (OR 0.94, 95%CI 0.89, 0.99, p < 0.05).
More than three quarters of consumer narratives describing prize, sweepstakes, and lottery scams were categorized as having an overall positive sentiment. Only 14.1% of these reports were categorized as negative. However, only these negative complaints were significantly associated with victimization versus attempted fraud (OR 1.34, 95%CI 1.29, 1.49, p < 0.001).
Tech support scams
Approximately, one quarter of tech support scam complaints involved victimization. Median losses were $1,200, the second highest after romance scams. Similar to other scam types, losses were much higher among those in their 70 s and 80 s, and relative to the other scam types, the age of reporters tended to be older (see Fig. 1). The relationship between age and victimization for tech support scams also followed a U-shaped pattern. Compared to adults aged 30 to 39, young adults and older adults were significantly more likely to report victimization versus attempted fraud. Results show that teenagers (age 19 and younger) who reported a tech support scam were 85% more likely (OR 1.85, 95%CI 1.49, 2.29, p < 0.001) to report victimization, and adults aged 70 and older were twice as likely (OR 2.09, 95%CI 1.89, 2.31, p < 0.001) to report victimization by tech support scams relative to 30-to-39-year-olds.
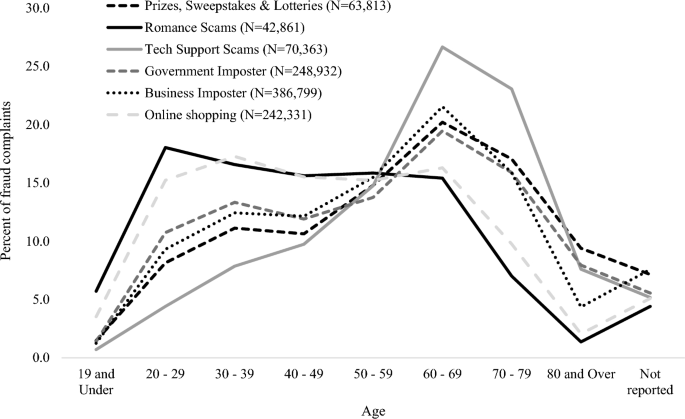
Age distribution of consumers who reported fraud according to scam type
While analyses of the selected scam types show that a higher proportion of reporters classified as female report scams compared to consumers classified as male, this was especially true for tech support scams: 41.1% of reporters were classified as female compared to just 28.2% male. However, a higher proportion of male reporters were victims (26.5% compared to 24.5% of females). These differences were statistically significant (OR 1.13, 95%CI 1.08, 1.18, p < 0.001).
Eighty-four percent of all tech support scam reporters were classified as NH white, although a higher proportion of the tech support scam reporters who were Black, Hispanic, and Asian/Asian Pacific Islander reported victimization relative to attempted fraud (p < 0.001).
Contrary to expectations, tech support scam narratives were more likely to be categorized as positive (53.8%) versus negative overall (38.6%). Compared to complaints categorized as emotionally neutral/mixed, complaints categorized as positive and complaints categorized as negative were both significantly associated with victimization. Specifically, consumers who expressed overall negative emotional sentiment were 16% more likely to report victimization (OR 1.16, 95%CI 1.06, 1.26, p = 0.001), and consumers who expressed overall positive emotional sentiment were 38% more likely to report victimization (OR 1.38, 95%CI 1.27, 1.50, p < 0.001) relative to those who filed neutral/mixed complaints.
Phone calls were the number one method of contact in tech support scams (35.3%), followed by email (25.2%) and online advertisements/pop-up messages (12.0%). Those who were contacted via an online advertisement/pop-up message were two and a half times as likely than those contacted by telephone to report that they were victims (OR 2.68; 95%CI 2.54, 2.83, p < 0.001).
Government imposter scams
Rates of reporting victimization (versus attempted fraud) were lowest for government imposter scams where just 11.1% reported a loss (median = $850). A higher proportion of younger consumers reported victimization compared to older consumers. For example, just 13.8% of 70-to-79-year-olds who reported government imposter scams were victims compared to 30.7% of 20-to-29-year-olds. These differences were statistically significant (p < 0.001). A higher proportion of male reporters indicated victimization compared to female reporters (OR 1.09, 95%CI 1.05, 1.13, p < 0.001).
Among all government imposter scam complaints, 77.8% of consumers were categorized as NH white, 9.4% were Hispanic, and 3.4% were Asian/Asian Pacific Islander. Government imposter scams had the highest proportion of consumers categorized as Black (9.1%). Compared to NH white consumers, Black consumers were 70% more likely to report victimization than attempted fraud (OR 1.70, 95%CI 1.63, 1.77, p < 0.001). Asian/Asian Pacific Islanders were 87% more likely to report victimization (OR 1.87, 95%CI 1.75, 1.96, p < 0.001), and American Indian/Alaska Native consumers were 56% more likely to report victimization (OR 1.56, 95%CI 1.17, 2.06, p = 0.002).
Phone calls were the number one method of contact reported in government imposter scams (61.5%) followed by text message (10.6%). Consumers who reported being contacted via text message were 43% less likely to report victimization compared to consumers contacted by phone (OR 0.52, 95%CI 0.54, 0.61, p < 0.001).
There were an equal number of complaint narratives categorized as positive and negative (41.6%). Government imposter scams had the highest proportion of emotionally neutral/mixed narratives (16.2%). Compared to neutral/mixed complaints, complaints categorized as positive were 99% more likely to be associated with victimization (OR 1.99, 95%CI 1.89, 2.10, p < 0.001), and complaints categorized as negative were 41% more likely to be associated with victimization (OR 1.41, 95%CI 1.34, 1.49, p < 0.001).
Business imposter scams
Seventeen and a half percent of business imposter scam complaints involved victimization. As with government imposter scams, median losses for business imposter scams were $850. Although 41.9% of reporters were aged 60 and older, a higher proportion of young adults reported victimization compared to older adults. For example, adults aged 70 and older were about half as likely to report victimization relative to adults in their 30 s (p < 0.001).
A higher proportion of Black, Hispanic, and Asian/Asian Pacific Islander consumers reported victimization compared to NH white reporters. For example, although they only comprised 6.7% of business imposter scam reporters, consumers categorized as Black were 73% more likely to report victimization relative to those categorized as NH white (OR 1.73; 95%CI 1.67, 1.79, p < 0.001).
Like government imposter, phone calls were the predominant method of contact reported in business imposter scams (34.8%), followed by text message (19.1%) and email (18.2%).
Business imposter scam narratives were more likely to be categorized as positive (52.9%) than negative (36.7%). Positive and negative complaints were associated with victimization. Specifically, consumers who expressed negative emotional sentiment were 12% more likely to report victimization, and those who expressed positive emotional sentiment were 20% more likely to report victimization compared to those who filed neutral/mixed complaints (p < 0.001).
Online shopping scams
The proportion of victim complaints to attempted fraud complaints was highest for online shopping scams where 64.2% of consumers reported a loss. Median losses were lowest for online shopping scams ($177), and in contrast to the age trends observed for the other scam types, consumers in their 20 s reported higher median losses ($219) than consumers in their 70 s and 80 s (~ $130).
Online shopping scams also showed very different patterns with respect to age and the likelihood of reporting victimization. A higher proportion of younger consumers reported victimization compared to older consumers. Just 32.9% of 70-to-79-year-olds who reported online shopping scams were victims compared to 79.0% of 20-to-29-year-olds. Adults in their 80 s were half as likely to report victimization as adults in their 30 s (OR 0.47, 95%CI 0.44, 0.51, p < 0.001), whereas those aged 19 and younger were more than twice as likely to report victimization (OR 2.16, 95%CI 2.00, 2.32, p < 0.001) relative to adults in their 30 s.
As with other scam types, a higher proportion of consumers categorized as Black, Hispanic, and Asian/Asian Pacific Islander reported victimization by online shopping scams relative to NH white consumers. Those categorized as Hispanic (10.6% of online shopping scam reporters) were 56% more likely to report victimization than NH white consumers (OR 1.56, 95%CI 1.50, 1.62, p < 0.01). Those categorized as American Indian/Alaska Native (0.1%) were significantly more likely to report victimization by online shopping scams (144%) compared to NH white consumers. There were also very few fraud reporters categorized as multiracial (0.2%). These individuals were 48% more likely to report online shopping scam victimization relative to NH white consumers (OR 1.48, 95%CI 1.15, 1.89, p = 0.002). Online shopping was the only scam type where this relationship was significant.
Websites/applications and social media were the most common contact methods for online shopping scams (31.1% and 22.8%, respectively). Relative to other scam types, the fewest number of complaints were filed by a proxy reporter (2.5%). Although effect sizes were small, consumers who reported an online shopping scam in the winter months were 7.4% more likely to report victimization compared to consumers who reported online shopping scams in the spring (OR 1.07, 95%CI 1.05, 1.10, p < 0.001), which perhaps reflects the holiday shopping rush.
Online shopping scam complaint narratives were generally more negative than positive. Complaints categorized as positive were 27% less likely to involve victimization. In other words, positive sentiment was negatively associated with victimization reports (OR 0.73, 95%CI 0.70, 0.76, p < 0.001). Interestingly, complaints that were categorized as negative were not significantly associated with online shopping scam victimization relative to neutral/mixed complaints.
Consistent incident-level findings
Several findings presented in Table 5 are relatively consistent across scams. First, the number of characters in consumers’ incident narratives was positively associated with reports of victimization, meaning that consumers who wrote longer complaints were more likely to report that they were victims than attempted fraud victims. This positive association was consistent across all scam types and was significant at p < 0.001, although effect sizes were very small.
Also, neighborhood complaint rate (based on the consumer’s zip code and population size) was negatively associated with reports of victimization. This indicates that consumers residing in areas with higher average complaint rates were significantly less likely to report victimization relative to attempted fraud. Consumers who filed their own fraud complaint were between 10 and 65% less likely to report victimization than consumers whose complaints were filed by a proxy reporter, such as a friend or relative.
Discussion
The aim of this study was to examine how mass marketing scam victims and non-victims vary demographically across six major scam types, and to determine how positive and negative emotions relate to reporting victimization versus attempted fraud. This study contributes to prior research in several ways. First, the novel data source with a sample size of more than one million mass marketing scam complaints is considerably larger than data sets used in other fraud studies. This allowed us to examine how underrepresented groups like American Indian and Alaska Natives are affected by specific scam types relative to NH white Americans. Second, six different types of mass marketing scams were examined separately, providing a comparison of factors associated with exposure to and victimization by different scams. Descriptive findings show that consumer demographic characteristics, scam contact methods, and emotional sentiment differ across scam types, and regression results indicate that many characteristics have different associations with reporting victimization versus reporting attempted fraud.
An important insight from this analysis is that age should not be treated as a continuous variable in future analytic models. The relationship between age and reporting was not linear across all scam types. As shown in Fig. 1, consumers who reported a tech support scam (both victims and non-victims) tended to be older than those who reported romance and online shopping scams. The age distribution of business imposter, government imposter, and prize, sweepstakes, and lottery scam reporters also trended older with the highest proportion of reporters in their 60 s, followed by those in their 70 s.
We also show that older age is not necessarily associated with higher likelihood of reporting victimization versus attempted fraud for all scam types. For online shopping scams, older adults were roughly half as likely to report victimization relative to younger consumers, and they reported lower losses, on average. In contrast, most tech support scam reporters were aged 60 and older, although the odds of reporting victimization (versus attempted fraud) were higher for both older and younger adults compared to adults in their 30 s and 40 s. A similar pattern was observed for prize, sweepstakes, and lottery scams. Results may suggest that adults aged 60 and older are more likely to encounter tech support and prize, sweepstakes, and lottery scams (or have a higher propensity to report these scams), but that both older and younger adults are at risk of victimization once exposed.
In the 2017 mass marketing fraud prevalence survey (Anderson 2019), adults aged 35 to 54 were the most likely to self-report victimization overall, but as with the present study, the association between age and victimization differed by scam type. For example, self-reported victimization by “fraudulent computer repair” scams (i.e., tech support scams) was highest among survey respondents aged 65 to 74 (Anderson 2019). Together, our findings and the FTC fraud prevalence study findings likely reflect variations in exposure to various scams by age as well as variations in personal and contextual risk factors across the age spectrum (e.g., social isolation, inexperience with technology, cognitive decline).
According to the lifestyles/routine activity theory framework (Cohen and Felson 1979; Hindelang et al. 1978), organizational structures and social routines present opportunities for motivated offenders to come into contact with potential targets. Although this theory was originally developed to explain direct-contact predatory offenses, it has also been applied to identity theft (Burnes et al. 2020; Guedes et al. 2022; Reynolds 2021), cybercrime (Khey and Sainato 2013; Leukfeldt and Yar 2016), and fraud (DeLiema 2018; Lee et al. 2022). Based on lifestyles/routine activity theory, factors such as social media use, online shopping frequency, computer ownership, social isolation, and marital status differentially affect how likely a consumer will interact with a mass marketing scam solicitation. For example, Pratt et al. (2010) found that the frequency of internet use and online purchasing significantly increased the probability of being targeted by internet fraud. Young and middle-aged adults are more likely to encounter bogus offers online than older adults, in part because they are more frequent online shoppers and social media users (eMarketer 2020; Klarna 2022). And, because personal computer ownership is greatest among NH white consumers (Anderson 2015), this group may encounter more tech support scams.
Using a “gender guesser” algorithm to assign binary sex (male/female) to consumers, we find that more females submit fraud complaints, yet when males submit fraud complaints, they are significantly more likely to report victimization than females. This pattern emerged across all scam types, although findings must be treated with caution given that approximately one-third of all consumers could not be classified as male or female. In FTC (Anderson 2019) and BJS (Morgan 2021) fraud prevalence surveys, females were more likely than males to self-report fraud victimization. Findings from the 2019 National Crime Victimization Survey (Morgan and Truman 2020) also show that for violent crimes—sexual assault, robbery, aggravated and simple assault—more females than males self-report victimization (1.17% versus 1.04%); however, when serious property crimes such as burglary and motor vehicle theft are included, more males (1.44%) than females (1.28%) self-report victimization.
In terms of reporting to police, females report a higher percentage of violent victimization incidents than males (46% versus 36%) (Morgan and Truman 2020). One way to interpret these findings along with results from the present study is to recognize that males and females have different rates of exposure to various forms of crime as predicted by lifestyles/routine activity theory (Reyns 2013). Also, males’ and females’ motivations and barriers to reporting may vary by crime type. Some research indicates that females hold more positive attitudes toward law enforcement (Nofziger and Williams 2005), although most findings on gender and attitudes toward police are mixed or show no significant gender differences (see Brown and Reed Benedict 2002; Worrall 1999). Qualitative research with consumers who have been exposed to scams may shed light on the extent to which differences in motivation to complain explain gender differences in the Consumer Sentinel.
Using BIFSG to assign consumers their highest probability race/ethnicity, we find that consumers classified as NH white disproportionately submit fraud complaints relative to their composition in the U.S. population, where only 57.8% of Americans are NH white (U.S. Census Bureau 2021). However, relative to those who were classified as NH white, consumers classified as Black, Hispanic, and Asian/Asian Pacific Islander are significantly more likely to report victimization than attempted fraud.
Our findings using consumer complaints reflect results from the FTC fraud prevalence survey (Anderson 2019) that found that Black, Hispanic, Asian, and “other” race/ethnicity respondents were between 2.3% and 6.8% more likely than NH white respondents to report victimization by specific frauds, although these differences may not be statistically significant. Results from the BJS fraud prevalence survey (Morgan 2021) also show that a smaller percentage of NH white Americans self-report victimization (1.19%) compared to those who are Black (1.67%) and those who are Native Hawaiian/Other Pacific Islander/American Indian/Alaska Native/two or more races (2.19%). In our data, very few consumers overall were classified as Native American/Alaska Native and multiracial, which could reflect a limitation of the BIFSG algorithm at predicting membership in those race and ethnic groups.
As would be predicted by lifestyle/routine activity theory, it is likely that different race and ethnic groups are more exposed to certain types of scams than others, increasing their risk of victimization. For example, Raval (2021) found that victimization rates for payday loan, low-dollar business opportunity frauds, and student debt relief schemes were significantly higher in Black communities. For payday loan scams specifically, communities with a 100% Black population had a 209% higher rate of victimization than 0% Black communities. Differences in the rates of victimization by neighborhood race characteristics were not as pronounced for other scam types, such as those involving bogus health products like weight loss treatments. This could mean that perpetrators use very different targeting approaches and marketing tactics to appeal to different demographic groups’ unmet psychosocial needs and/or financial insecurities—e.g., some populations need financial assistance, whereas others value weight loss.
We found that consumers categorized as Hispanic were more likely to report victimization versus attempted fraud. In an analysis of case data from a high-profile pyramid scheme, Bosley and Knorr (2018) found that the scheme was prevalent in counties with high Hispanic populations. Indeed, several types of scams including Ponzi and pyramid schemes exploit communities with high levels of intra-group trust. The “affinity groups” often include religious organizations, immigrant populations, and other cultural groups (Austin 2004). Other surveys on fraud have found little to no association between race and risk of victimization (e.g., Holtfreter et al. 2008; Mesch and Dodel 2018), but sample sizes were significantly smaller and these studies focused on online forms of fraud.
Emotion and victimization
Using the VADER algorithm to analyze the emotional sentiment of fraud complaints, we find that even when recounting a prior fraud experience, victims present more emotion in their fraud complaints than non-victims. Emotions might include eagerness and excitement, such as in prize, sweepstakes, and lottery scams, or fear and anxiety, such as in government imposter scams. Victims may also focus more on the emotional aftermath of victimization, recounting feelings of loss, embarrassment, frustration, and desperation. In an analysis of consumer complaints of the SSA imposter scam, DeLiema and Witt (2021) found that victims were more likely than non-victims to use words associated with trust, anticipation, and anger. Although our study was not able to directly test the elaboration likelihood model of persuasion (Petty and Cacioppo 1986) by showing that emotional arousal increases fraud susceptibility, consumer complaints reveal a link between emotion and reports of victimization.
We also find that sentiment valence varies across scam types and that both positive and negative complaints (relative to neutral/mixed complaints) are associated with victimization for tech support, government imposter, and business imposter scams. This may suggest that high intensity emotions, regardless of their valence, increase susceptibility. For online shopping scams, however, positive complaints were inversely associated with victimization, and negative complaints were not significant. This further indicates that positive and negative emotions can have independent and non-linear relationships with victimization.
Sample bias
Because the analysis uses consumer complaints, limited conclusions can be drawn about which demographic groups are actually most susceptible to different scams. Within our data, there is a complex interplay between fraud exposure, victimization, and the propensity to report to a federal agency. These independent effects cannot be separated analytically.
Substantial research indicates that fraud is widely underreported to law enforcement (Anderson 2021). For example, Anderson (2019) found that 2.0% of survey participants (approximately 5 million Americans) were victims of computer repair/tech support scams in 2017. By comparison, only 17,800 tech support scam victims reported to the FTC in the present study.
Attempted fraud is underreported to an even greater extent. One survey found that nearly half of U.S. adults (~ 258 million people) received a bogus phone call from someone who claimed to be a representative of the SSA from October to December 2020 (SimplyWise 2021). During that same period, however, the SSA received only 160,000 complaints of this scam (Office of Inspector General SSA 2021) and the FTC received fewer than 60,000 complaints (FTC 2022c), suggesting that just a fraction of consumers complained.
One important factor that may affect fraud reporting is trust in law enforcement. Prior research indicates that low trust is associated with lower rates of crime reporting, particularly among those who are Black, Hispanic, and Asian (Martinez-Schuldt and Martínez 2021; Zaykowski 2010). If these consumers chose not to report attempted fraud due to distrust or lack of confidence in law enforcement, then counter to what the regression results suggest, minorities do not necessarily face greater risk of victimization once exposed. Rather, minorities who experienced attempted fraud are underrepresented in the data compared to their NH white attempted fraud counterparts.
Losing money motivates people to report. Raval (2021) used the FTC Consumer Sentinel and compared consumer fraud reports to law enforcement case data on the same frauds. For one scam where average losses were high—$2,800—14.4% of the victims reported to law enforcement. But in a different scam where average losses were low—between $40 and 90—just ~ 0.04% of victims reported, or approximately 1 in 2,500 people. These findings indicate that financial losses are positively associated with reporting, and that victims, relative to attempted victims, are overrepresented in our sample. It also indicates that true median losses may be lower across all scam categories.
It is important to note that while some complaints represent a single fraudulent transaction, other complaints may encompass multiple payments to the perpetrators. This is more common in romance scams which typically last over a period of weeks to months (Whitty et al. 2015), and could explain why median losses are so high for this scam type. Future research should assess whether a higher percentage of tech support and romance scam victims report fraud to law enforcement given their relatively higher losses than victims of other fraud types.
Other factors affecting the propensity to report include the consumer’s knowledge of where and how to file a complaint, their cognitive capacity, levels of social support, phone and internet access, and recognition that the experience was a scam. Consumers with a developmental disability, dementia, and those experiencing extreme poverty or homelessness are likely underrepresented.
Limitations
Although the Consumer Sentinel is the largest complaint database on consumer fraud in the U.S., its primary limitation is that data reflect both underlying rates of fraud exposure and victimization, as well as the propensity to report, which varies across demographic groups and across scam types. Qualitative research indicates that victims are driven to report by a sense of individual justice and an altruistic desire to protect others, such as by raising awareness (Cross 2018b). Research also indicates that fraud victim reporting behavior is strongly associated with higher education (Copes et al. 2001; Kerley and Copes 2002; Schoepfer and Piquero 2009) and greater losses (Copes et al. 2001; Kerley and Copes 2002; Kemp 2022; Raval 2021). Victims who experienced more substantial financial losses and those with more education are likely overrepresented in the data.
Consumers self-select the type of scam that best represents their experience, and some consumers may have selected an incorrect fraud category. The FTC does not independently review each complaint and confirm the reported incident as a scam. Because of these limitations, results should be interpreted with caution.
The VADER algorithm was developed based using posts on Twitter, and consumer fraud complaints typically have more characters that a tweet. Other sentiment analysis tools powered by artificial intelligence could be used in future analyses to determine if findings are robust to different sentiment analysis algorithms.
Consumer race/ethnicity and sex are estimated. Predictive accuracy using BIFSG is poorer for American Indian/Alaska Natives (Sartin et al. 2021) and for multiracial individuals (Derose et al. 2013). These consumers are likely under-identified in the data. Also, given that approximately one-third of consumers could not be assigned male or female, findings on the associations between sex and reporting victimization should be considered preliminary. To address these limitations, the FTC and other entities that accept consumer fraud complaints should consider asking consumers to self-report their gender identity and race/ethnicity.
All fraud cases in the sample were reported during the Covid-19 pandemic. While reports of fraud increased substantially during this time, the extent to which this increase reflects a change in underlying fraud prevalence is unknown.
Conclusion
This is the first study to use the Consumer Sentinel to understand what demographic groups are affected by six common types of mass marketing scams. Results show that consumer age profiles differ across scams. Older adults are more likely to be exposed to and victimized by tech support scams, while young adults are more likely to be exposed to and victimized by online shopping scams. These patterns provide support for the lifestyles/routine activity theory framework in partially explaining demographic differences. Routine behaviors, which differ across generations, impact the frequency of exposure to different forms of fraud. These results have implications for consumer awareness. To safeguard consumers against tech support scams, cyber security and fraud awareness training should be directed toward older adults, perhaps through messaging delivered at senior centers, libraries, religious organizations, and by healthcare providers. Young and middle-aged adults need more education on how to identify a fake product or service advertised on a website or on social media. Consumer literacy training should include information on how to recognize fake product reviews and customer testimonials, how to identify phishing websites, and to determine whether sellers advertising items on peer-to-peer marketplaces are trustworthy.
Some results were similar across scam types. More females submitted fraud complaints in general, but males who submitted complaints were significantly more likely to report that they were victims. Additional efforts are needed to promote the importance of reporting attempted fraud, which may help to reduce the gender disparity in consumer complaints. Another common finding was that Black, Hispanic, and Asian/Asian Pacific Islanders were more likely to report victimization than attempted fraud relative to NH white fraud reporters. Fraud awareness campaigns in multiple languages that are specific to the types of scams affecting minority communities may help to reduce race and ethnic disparities in reporting behavior and fraud risk.
Findings also show that positive and negative emotions in consumer complaints are significantly associated with victimization, but that sentiment relationships differ by scam type. Qualitative research may explore whether consumer complaint narratives are more a reflection of what consumers were feeling in the moment of the scam, or whether they reflect consumers’ emotional reactions after the incident. With recent advances in natural language processing models and artificial intelligence, qualitative analyses of consumer complaints may be conducted at scale to identify consumers in need victim support services.
Notes
As a robustness check, we also ran models using consumers’ direct probabilities for race/ethnicity instead of max a priori assignment. In these models, every consumer had an estimated likelihood of belonging to each race/ethnic category, from 0 to 100%. As shown in Appendix Table 6, the same pattern of results were found.
References
AARP Foundation. 2003. Off the hook: Reducing participation in telemarketing fraud. Washington DC. https://assets.aarp.org/rgcenter/consume/d17812_fraud.pdf
Adjaye-Gbewonyo, Dzifa, Robert A. Bednarczyk, Robert L. Davis, and Saad B. Omer. 2014. Using the Bayesian Improved Surname Geocoding Method (BISG) to create a working classification of race and ethnicity in a diverse managed care population: A validation study. Health Services Research 49 (1): 268–283.
Anderson, Keith B. 2021. To whom do victims of mass-market consumer fraud complain? https://papers.ssrn.com/sol3/papers.cfm?abstract_id=3852323
Anderson, Keith B. 2019. Mass-market consumer fraud in the United States: A 2017 update. Federal Trade Commission. https://www.ftc.gov/system/files/documents/reports/mass-market-consumer-fraud-united-states-2017-update/p105502massmarketconsumerfraud2017report.pdf
Anderson, Monica. 2015. The demographics of device ownership. Pew Research Center. https://www.pewresearch.org/internet/2015/10/29/the-demographics-of-device-ownership/
Austin, David E. 2004. In god we trust: The cultural and social impact of affinity fraud in the African American church. University of Maryland Law Journal of Race, Religion, Gender & Class 4 (2): 365–409.
Barreto, Matt, Michael Cohen, Loren Collingwood, Chad Dunn, and Sonni Waknin. 2021. A novel method for showing racially polarized voting: Bayesian Improved Surname Geocoding. New York University Review of Law & Social Change 46 (1): 1–42.
Beals, Michaela, Marguerite DeLiema, and Martha Deevy. 2015. Framework for a taxonomy of fraud. Financial Fraud Research Center. Stanford Center on Longevity. https://longevity.stanford.edu/framework-for-a-taxonomy-of-fraud/
Borg, Anton, and Martin Boldt. 2020. Using VADER sentiment and SVM for predicting customer response sentiment. Expert Systems with Applications 162: 113746.
Bosley, Stacie, and Maggie Knorr. 2018. Pyramids, Ponzis and fraud prevention: Lessons from a case study. Journal of Financial Crime 25 (1): 81–94.
Brown, Ben, and Wm Reed Benedict. 2002. Perceptions of the police: Past findings, methodological issues, conceptual issues and policy implications. Policing: An International Journal of Police Strategies & Management 25 (3): 543–580.
Buchanan, Tom, and Monica T. Whitty. 2014. The online dating romance scam: Causes and consequences of victimhood. Psychology, Crime & Law 20 (3): 261–283.
Burnes, David, Marguerite DeLiema, and Lynn Langton. 2020. Risk and protective factors of identity theft victimization in the United States. Preventive Medicine Reports 17: 101058.
Button, Mark, Chris Lewis, and Jacki Tapley. 2014. Not a victimless crime: The impact of fraud on individual victims and their families. Security Journal 27 (1): 36–54.
Carter, Elisabeth. 2015. The anatomy of written scam communications: An empirical analysis. Crime, Media, Culture 11 (2): 89–103.
Cohen, Lawrence E., and Marcus Felson. 1979. Social change and crime rate trends: A routine activity approach. American Sociological Review 44 (4): 588–608.
Copes, Heith, Kent R. Kerley, Karen A. Mason, and Judy Van Wyk. 2001. Reporting behavior of fraud victims and Black’s theory of law: An empirical assessment. Justice Quarterly 18 (2): 343–363.
Cross, Cassandra. 2015. No laughing matter: Blaming the victim of online fraud. International Review of Victimology 21 (2): 187–204.
Cross, Cassandra. 2020. ‘Oh we can’t actually do anything about that’: The problematic nature of jurisdiction for online fraud victims. Criminology & Criminal Justice 20 (3): 358–375.
Cross, Cassandra. 2018a. (Mis)understanding the impact of online fraud: Implications for victim assistance schemes. Victims & Offenders 13 (6): 757–776.
Cross, Cassandra. 2018b. Victims’ motivations for reporting to the ‘fraud justice network.’ Police Practice and Research 19 (6): 550–564.
Cross, Cassandra, Kelly Richards, and Russell G. Smith. 2016. The reporting experiences and support needs of victims of online fraud. Trends and Issues in Crime and Criminal Justice 518: 1–14.
Deevy, Martha and Michaela Beals. 2013. The scope of the problem. An overview of fraud prevalence measurement. Financial Fraud Research Center. Stanford Center on Longevity. https://longevity.stanford.edu/financial-fraud-research-center/wp-content/uploads/2016/07/Scope-of-the-Problem-FINAL_corrected2.pdf
DeLiema, Marguerite. 2018. Elder fraud and financial exploitation: Application of routine activity theory. The Gerontologist 58 (4): 706–718.
Deliema, Marguerite, Doug Shadel, and Karla Pak. 2020. Profiling victims of investment fraud: Mindsets and risky behaviors. Journal of Consumer Research 46 (5): 904–914.
DeLiema, Marguerite, and Witt, Paul. 2021. Mixed methods analysis of consumer fraud reports of the Social Security Administration impostor scam. WP2021-434. https://doi.org/10.7302/4195
Derose, Stephen F., Richard Contreras, Karen J. Coleman, Corinna Koebnick, and Steven J. Jacobsen. 2013. Race and ethnicity data quality and imputation using US Census data in an integrated health system: The Kaiser Permanente Southern California experience. Medical Care Research and Review 70 (3): 330–345.
Dunn, Jennifer R., and Maurice E. Schweitzer. 2005. Feeling and believing: The influence of emotion on trust. Journal of Personality and Social Psychology 88 (5): 736–748.
Elliott, Marc N., Peter A. Morrison, Allen Fremont, Daniel F. McCaffrey, Philip Pantoja, and Nicole Lurie. 2009. Using the Census Bureau’s surname list to improve estimates of race/ethnicity and associated disparities. Health Services and Outcomes Research Methodology 9 (2): 69–83.
eMarketer. 2020. Distribution of digital buyers in the United States as of February 2020, by age group [Graph]. In Statista. Retrieved May 05, 2023, from https://www.statista.com/statistics/469184/us-digital-buyer-share-age-group/. Accessed 05 May 2023
Federal Trade Commission. 2023. Consumer Sentinel Network Data Book 2022. https://www.ftc.gov/reports/consumer-sentinel-network-data-book-2022
Federal Trade Commission. 2022a. Consumer Sentinel Network Data Book 2021. https://www.ftc.gov/reports/consumer-sentinel-network-data-book-2021
Federal Trade Commission. 2022b. Protecting older consumers, 2021–2022b, a report of the Federal Trade Commission. https://www.ftc.gov/system/files/ftc_gov/pdf/P144400OlderConsumersReportFY22.pdf
Federal Trade Commission. 2022c. The big view: All Sentinel reports, subcategories over time, government imposter scams, 2019 Q4. Retrieved from Tableau Public: https://public.tableau.com/views/TheBigViewAllSentinelReports/SubcategoriesOverTime?:language=en-US&:display_count=n&:origin=viz_share_link
FINRA Investor Education Foundation. 2015. Non-traditional costs of financial fraud. https://www.finrafoundation.org/files/non-traditional-costs-financial-fraud
Garay, J., R. Yap, and M.J. Sabellano. 2019. An analysis on the insights of the anti-vaccine movement from social media posts using k-means clustering algorithm and VADER sentiment analyzer. In IOP Conference Series: Materials Science and Engineering 482 (1): 012043.
Guedes, Inês., Margarida Martins, and Carla Sofia Cardoso. 2022. Exploring the determinants of victimization and fear of online identity theft: An empirical study. Security Journal 36 (3): 472–497.
Han, Duke S., Patricia A. Boyle, Yu. Lei, Konstantinos Arfanakis, Bryan D. James, Debra A. Fleischman, and David A. Bennett. 2016a. Grey matter correlates of susceptibility to scams in community-dwelling older adults. Brain Imaging and Behavior 10 (2): 524–532.
Han, S. Duke., Patricia A. Boyle, Bryan D. James, Yu. Lei, and David A. Bennett. 2016b. Mild cognitive impairment and susceptibility to scams in old age. Journal of Alzheimer’s Disease 49 (3): 845–851.
Hindelang, Michael J., Michael R. Gottfredson, and James Garofalo. 1978. Victims of Personal Crime: An Empirical Foundation for a Theory of Personal Victimization. Cambridge, MA: Ballinger.
Holtfreter, Kristy, Michael D. Reisig, and Travis C. Pratt. 2008. Low self-control, routine activities, and fraud victimization. Criminology 46 (1): 189–220.
Hutto, Clayton, and Eric Gilbert. 2014. VADER: A parsimonious rule-based model for sentiment analysis of social media text. In Proceedings of the International AAAI Conference on Web and Social Media 8 (1): 216–225.
Kemp, Steven. 2022. Fraud reporting in Catalonia in the Internet era: Determinants and motives. European Journal of Criminology 19 (5): 994–1015.
Kerley, Kent R., and Heith Copes. 2002. Personal fraud victims and their official responses to victimization. Journal of Police and Criminal Psychology 17 (1): 19–35.
Khey, David N., and Vincenzo A. Sainato. 2013. Examining the correlates and spatial distribution of organizational data breaches in the United States. Security Journal 26 (4): 367–382.
Kircanski, Katharina, Nanna Notthoff, Marguerite DeLiema, Gregory R. Samanez-Larkin, Doug Shadel, Gary Mottola, Laura L. Carstensen, and Ian H. Gotlib. 2018. Emotional arousal may increase susceptibility to fraud in older and younger adults. Psychology and Aging 33 (2): 325–337.
Klarna. 2022. Share of shoppers who had purchased a product directly from a social media platforms worldwide in 2022, by generational cohort [Graph]. In Statista. https://www.statista.com/statistics/1273928/share-social-buyers-age-group-worldwide/. Accessed 05 May 2023.
Knüpfer, Samuli, Ville Rantala, and Petra Vokata. 2021. Scammed and scarred: Effects of investment fraud on its victims. Fisher College of Business Working Paper No. 2021-03, 008. https://doi.org/10.2139/ssrn.3850928
Labgold, Katie, Sarah Hamid, Sarita Shah, Neel R. Gandhi, Allison Chamberlain, Fazle Khan, Shamimul Khan, et al. 2021. Estimating the unknown: Greater racial and ethnic disparities in COVID-19 burden after accounting for missing race/ethnicity data. Epidemiology 32 (2): 157–161.
Lee, Byung, Roy Fenoff, and John Spink. 2022. Routine activities theory and food fraud victimization. Security Journal 35 (2): 506–530.
Lerner, Jennifer S., Ye. Li, and Elke U. Weber. 2013. The financial costs of sadness. Psychological Science 24 (1): 72–79.
Leukfeldt, Eric R., and Majid Yar. 2016. Applying routine activity theory to cybercrime: A theoretical and empirical analysis. Deviant Behavior 37 (3): 263–280.
Lokanan, Mark E., and Susan Liu. 2021. The demographic profile of victims of investment fraud: An update. Journal of Financial Crime 28 (3): 647–658.
Loewenstein, George. 1996. Out of control: Visceral influences on behavior. Organizational Behavior and Human Decision Processes 65 (3): 272–292.
Martínez-Schuldt, Ricardo D., and Daniel E. Martínez. 2021. Immigrant sanctuary policies and crime-reporting behavior: A multilevel analysis of reports of crime victimization to law enforcement, 1980 to 2004. American Sociological Review 86 (1): 154–185.
Mesch, Gustavo S., and Matias Dodel. 2018. Low self-control, information disclosure, and the risk of online fraud. American Behavioral Scientist 62 (10): 1356–1371.
Mittal, Ruchi, Amit Mittal, and Ishan Aggarwal. 2021. Identification of affective valence of Twitter generated sentiments during the COVID-19 outbreak. Social Network Analysis and Mining 11: 108.
Mohammad, Saif. 2015. Sentiment analysis: Detecting valence, emotions, and other affectual states from text. In Emotion Measurement, pp. 201–237. Woodhead Publishing.
Morgan, Rachel. 2021. Financial fraud in the United States, 2017. Bureau of Justice Statistics. No. 255817. https://bjs.ojp.gov/library/publications/financial-fraud-united-states-2017
Morgan, Rachel E., and Jennifer L. Truman. 2020. Criminal victimization, 2019. Bureau of Justice Statistics NCJ 255113. https://www.cdeunodc.inegi.org.mx/unodc/wp-content/uploads/2018/10/cv19.pdf
Nofziger, Stacey, and Susan Williams. 2005. Perceptions of police and safety in a small town. Police Quarterly 8 (2): 248–270.
Norris, Gareth, and Alexandra Brookes. 2021. Personality, emotion and individual differences in response to online fraud. Personality and Individual Differences 169: 109847.
Office of the Inspector General Social Security Administration. 2021. Congressional status update: Social security-related phone scams. https://oig.ssa.gov/assets/uploads/congressional_status_update_on_-ssa_related_phone_scams_-fy_21_q3_1.pdf
Pak, Karla and Doug Shadel. 2011. AARP Foundation national fraud victimization study. https://assets.aarp.org/rgcenter/econ/fraud-victims-11.pdf?_sm_nck=1
Petty, Richard E., and John T. Cacioppo. 1986. The elaboration likelihood model of persuasion. In Communication and Persuasion, 1–24. New York: Springer.
Petty, Richard E., and Pablo Briñol. 2015. Emotion and persuasion: Cognitive and meta-cognitive processes impact attitudes. Cognition and Emotion 29 (1): 1–26.
Pratt, Travis C., Kristy Holtfreter, and Michael D. Reisig. 2010. Routine online activity and internet fraud targeting: Extending the generality of routine activity theory. Journal of Research in Crime and Delinquency 47 (3): 267–296.
Raval, Devesh. 2020. Whose voice do we hear in the marketplace? Evidence from consumer complaining behavior. Marketing Science 39 (1): 168–187.
Raval, Devesh. 2021. Who is victimized by fraud? Evidence from consumer protection cases. Journal of Consumer Policy 44 (1): 43–72.
Reyns, Bradford W. 2013. Online routines and identity theft victimization: Further expanding routine activity theory beyond direct-contact offenses. Journal of Research in Crime and Delinquency 50 (2): 216–238.
Reynolds, Dylan. 2021. The differential effects of identity theft victimization: How demographics predict suffering out-of-pocket losses. Security Journal 34 (4): 737–754.
Rich, Timothy. 2018. You can trust me: A multimethod analysis of the Nigerian email scam. Security Journal 31: 208–225.
Sartin, Emma B., Kristina B. Metzger, Melissa R. Pfeiffer, Rachel K. Myers, and Allison E. Curry. 2021. Facilitating research on racial and ethnic disparities and inequities in transportation: Application and evaluation of the Bayesian Improved Surname Geocoding (BISG) algorithm. Traffic Injury Prevention 22 (1): S32–S37.
Schoepfer, Andrea, and Nicole Leeper Piquero. 2009. Studying the correlates of fraud victimization and reporting. Journal of Criminal Justice 37 (2): 209–215.
SimplyWise. 2021. SimplyWise Retirement Confidence Index January 2021. https://www.simplywise.com/blog/retirement-confidence-index/.
Thompson, Samuel T.C.. 2006. Helping the hacker? Library information, security, and social engineering. Information Technology and Libraries 25 (4): 222–225.
United States Census Bureau. 2021. 2020 U.S. population more racially and ethnically diverse than measured in 2010. https://www.census.gov/library/stories/2021/08/2020-united-states-population-more-racially-ethnically-diverse-than-2010.html
Voicu, Ioan. 2018. Using first name information to improve race and ethnicity classification. Statistics and Public Policy 5 (1): 1–13.
Whittaker, Jack Mark, Matthew Edwards, Cassandra Cross, and Mark Button. 2022. “I have only checked after the event”: Consumer approaches to safe online shopping. Victims & Offenders. https://doi.org/10.1080/15564886.2022.2130486.
Whitty, Monica T. 2015. Anatomy of the online dating romance scam. Security Journal 28 (4): 443–455.
Whitty, Monica T. 2020. Is there a scam for everyone? Psychologically profiling cyberscam victims. European Journal on Criminal Policy and Research 26 (3): 399–409.
Worrall, John L. 1999. Public perceptions of police efficacy and image: The" fuzziness" of support for the police. American Journal of Criminal Justice 24 (1): 47–66.
YouGovAmerica. 2023. How often would you say that you receive scam texts, emails, or calls from scammers purporting to be someone they are not? Retrieved from https://today.yougov.com/topics/technology/survey-results/daily/2023/03/06/8073a/1
Zaykowski, Heather. 2010. Racial disparities in hate crime reporting. Violence and Victims 25 (3): 378–394.
Zhang, Yan. 2018. Assessing fair lending risks using race/ethnicity proxies. Management Science 64 (1): 178–197.
Funding
The research reported herein was performed pursuant to a grant from the U.S. Social Security Administration (SSA) funded as part of the Retirement and Disability Research Consortium through the University of Michigan Retirement and Disability Research Center Award RDR18000002-03. The opinions and conclusions expressed are solely those of the author(s) and do not represent the opinions or policy of SSA or any agency of the federal government. Neither the United States government nor any agency thereof, nor any of their employees, makes any warranty, express or implied, or assumes any legal liability or responsibility for the accuracy, completeness, or usefulness of the contents of this report. Reference herein to any specific commercial product, process or service by trade name, trademark, manufacturer, or otherwise does not necessarily constitute or imply endorsement, recommendation or favoring by the United States government or any agency thereof. The authors would like to thank the millions of U.S. consumers who reported fraud to the Federal Trade Commission and made this study possible.
Author information
Authors and Affiliations
Corresponding author
Ethics declarations
Conflict of interest
The authors have no conflicts of interest to disclose.
Additional information
Publisher's Note
Springer Nature remains neutral with regard to jurisdictional claims in published maps and institutional affiliations.
Appendix
Appendix
Rights and permissions
Open Access This article is licensed under a Creative Commons Attribution 4.0 International License, which permits use, sharing, adaptation, distribution and reproduction in any medium or format, as long as you give appropriate credit to the original author(s) and the source, provide a link to the Creative Commons licence, and indicate if changes were made. The images or other third party material in this article are included in the article's Creative Commons licence, unless indicated otherwise in a credit line to the material. If material is not included in the article's Creative Commons licence and your intended use is not permitted by statutory regulation or exceeds the permitted use, you will need to obtain permission directly from the copyright holder. To view a copy of this licence, visit http://creativecommons.org/licenses/by/4.0/.
About this article

Cite this article
DeLiema, M., Witt, P. Profiling consumers who reported mass marketing scams: demographic characteristics and emotional sentiments associated with victimization. Secur J (2023). https://doi.org/10.1057/s41284-023-00401-5
Accepted:
Published:
DOI: https://doi.org/10.1057/s41284-023-00401-5