
Abstract
China's infant crop insurance industry faces two, not mutually exclusive, challenges. The first challenge is operational and arises from the lack of historical crop yield data at the farm household or village level. The second problem relates to a possible disconnect between objective measures of historical yields that is required for actuarial pricing in the supply of insurance and the subjective perceptions of future risk that is required to establish demand. This may require a substantial subsidy from the Chinese government in order to encourage participation. This paper examines both issues, including the form of subsidy, through use of the beta-PERT distribution. The PERT distribution has the advantage of defining proximal (second best) distributions based on farmers’ recall of historical low, high and typical yields to cover objective risk measures, and subjective distributions through projections of low, high and most likely future yields. Direct elicitations of objective and subjective PERT parameters from 730 farmers in Shaanxi were collected in the fall of 2010. We find that 82.3 per cent of farm households have perceptions that their pro-forma corn yields in 2011 would be higher than their historical memory, while 71.63 per cent perceived the distribution of risks in 2011 to be lower than the historical average. In addition, we find that when we regress farmers’ interest in crop insurance it is the skewness of subjective risk that matters, and perception of downside risk is largely dictated by perceived mean and standard deviation. As a result we argue that the need for subsidising crop insurance premiums is a consequence of the dissonance between subjective and historical risks.
Introduction
The role of agricultural insurance and other risk transfer mechanisms for agricultural and rural development is important for a number of reasons including the promotion of financial stability, a reduction in human anxiety, substitution for government social security programmes, the facilitation of trade and commerce, the mobilisation of savings, the enablement of efficient risk management, the encouragement of loss mitigation strategies, and the fostering of efficient capital allocation.Footnote 1 For these benefits to materialise, it is important to understand the extent by which farmers and insurers agree on the underlying probabilities of loss. For the insurer, knowledge of the underlying probabilities establishes the price at which insurance is offered, and ultimately will supply insurance only if the price is at least as great as the expectation of loss across all probabilistic outcomes on an objective basis. On the other hand, the farmer will only demand insurance at the offered price if it is consistent with their expectations of loss based upon subjective probabilities, even in the presence of risk aversion. Indeed, Ramirez and CarpioFootnote 2 have recently shown that participation in crop insurance in the U.S. is largely determined by the relationship between how insurers calculate crop insurance premiums, and how farmers judge these premiums. The academic literature on crop insurance in China has been increasing in recent years but is still very limited in comparison to related literature on more developed agricultural economies. These include awareness of crop insurance;Footnote 3 trust in government,Footnote 4 pricing and subsidisation.Footnote 5 Problems have also been tied to household demographics and characteristics.Footnote 6 Boyd et al.Footnote 7 provide a comparison piece of challenges in the delivery of Western-type crop insurance.
A related, but very important problem is the role that subsidy plays in crop insurance markets. In this paper we examine the rate of subsidy that would be required in order to equate the expected value of the payoff under a subjective distribution to that of the historical distribution. Much has been written on the role of subsidies in agricultural crop insurance. Central to the political debate is the role of markets and institutions and whether subsidies are so distorting to free market principles that they should be offered at all;Footnote 8 or because institutions are so imperfect that government needs to get involved;Footnote 9 or on a more broader role for public policy whether subsidy intervention affects positively agricultural economic considerations such as satisfactory and equitable standard of living for farmers, income stabilisation, price stabilisation, easing of adjustments to exogenous shocks, maintaining the health of rural economies, influence regional development, food security, agricultural efficiency and so on.Footnote 10 Even so, Gardner and KramerFootnote 11 claimed that, for multiple peril crop insurance (as assumed in this paper), farmers would require a 50 per cent subsidy in order to participate, and as GlauberFootnote 12 reports, supplemental premium support was required (in 1999 and 2000) to encourage enrolment in U.S. crop insurance.Footnote 13 Complicating matters is the role that subsidy plays in terms of resource allocation. We do not address this specifically in this paper, but it is well known that insurance can alter choices for risk-averse producers even to the point where insurance plus subsidy can encourage risk-averse farmers to behave as if they were risk neutral. In addition, the re-optimisation from a reduction in downside risk as well as the direct income effect resulting from subsidy can affect crop choices, decision-making and resource allocation, although the extent of such responses may not be so great depending upon ecological and other constraints on production.Footnote 14
In this paper we focus on the relationship between objective and subjective probabilities using quasi-experimental techniques applied to 730 farm households in Shaanxi, China. Considering the importance and high-risk exposure of crops in China,Footnote 15 and the emerging market for crop insurance, research into the design and pricing of crop insurance for farm households is of great interest. Of further interest are the measures of probability of crop yields considered in the experimental build. Detailed methods are provided later on, but the essence of our approach is to query farmers first on their worst, most likely, and best possible yields for 2011, and then query the farmers on the worst, typical and best yields in memory. In both cases we apply the PERT distribution to approximate subjective and objective (historical) crop yield distributions. Each provides a separate measure of downside risk from which actuarial insurance premiums are calculated using Monte Carlo techniques. We find that 82.3 per cent of farm households perceive their pro-forma corn yields in 2011 to be higher than their historical recall, while 71.63 per cent perceived the distribution of risks in 2011 to be lower than the historical average.Footnote 16 Our interest is the extent to which subjective risks are disconnected from objective risks. We introduce the notion of a “subsidy” to measure the amount by which a farmer might have to be compensated in order to equate the subjective insurance premium to the objective premium which we presume would make up the basis for the insurer's premium calculation. Finally, we tie subjective risks to insurance demand using regression techniques. We find that when we regress farmers’ interest in crop insurance it is the skewness of subjective risk that matters, and perception of downside risk is largely dictated by perceived mean and standard deviation. These findings are consistent with experimental work on psychological risk perceptions,Footnote 17 which has consistently shown biases that separate beliefs that people have, and the choices they make, from those assumed by the neo-classical model. We argue that there is a cognitive dissonance, or economic disconnect, between objective and subjective measures of risk to explain why farmers more often than not require a subsidy to participate in crop insurance. This line of research is also aligned with recent insurance literature on the heterogeneity of risksFootnote 18 which as outlined in AkerlofFootnote 19 holds that higher risk types increase insurance premiums, which in turn drive out lower risk types. Recent findings that adverse selection in insurance markets may be overstated have led researchers to explore alternative explanations for heterogeneous demandFootnote 20 including heterogeneous preferences and perceptions and cognitive ability.Footnote 21 While not in an agricultural context, the model posited by SpinnewijnFootnote 22 and the literature on which it builds (mostly health insurance) parallels (at least qualitatively) the discussion in the current paper which argues that the divergence between objective and subjective risks creates a wedge between the actuarial price of crop insurance and the perceived price; that demand is cognitively driven by the perceived risk rather than actual historical (objective) risks; and that government interventions and policies (including subsidies) will be substantially different depending on whether they fixate on historical risks or perceived risks.
In the remaining sections of this paper we first discuss risk, judgement and overconfidence; then we discuss how the PERT distribution can be used to measure subjective and objective crop yield distributions. Next we discuss our methods including our field research, computation of crop yield probabilities, and measurement of subsidy. Base results on probabilities are presented and then a regression model is provided to discuss how measures of risk and skewness affect insurance demand. The paper then concludes.
Risk, judgement and overconfidence
The central question is to why farmers’ subjective distributions should differ from the objective distribution. The objective-subjective dichotomy is generally attributed to Knight.Footnote 23 Knight argues that if uncertainty is measureable, it is risk, but if it is not measurable, it is uncertainty. Measureable data is typically the historical record (in our case historical crop yields) that is unalterable. The objective measure can then be compiled into objective measures of probability and risk with undeniable, and replicable, truths. The subjective measure, on the other hand, is alterable and is possessed solely by the decision-maker. Knight points out that the best example of subjectivity—or in his view uncertainty—is in the judgements that formulate opinions about future events. Pure uncertainty arises when there is no objective (i.e. historical data) on which to base judgements. Probability assessments can be assessed only by imagining a range of possible scenarios and with no, or imperfect, reference frames assigned by the likelihoods on which decisions are based. At the cognitive level, if subjects have no information stored in memory then inferences from other fragments of memory are pieced together in order to come up with an answer of which they are confident.Footnote 24 Hence when some history is available this can be used to filter probabilities. In other words, history may well be representative of the subjective future, but the subjective distributions do not necessarily imply representativeness.Footnote 25 WillettFootnote 26 adds that subjective uncertainty is a faithful interpretation of events in the external world. PfefferFootnote 27 keeps it rather simple: “Risk is a combination of hazards and is measured by probability; uncertainty is measured by a degree of belief. Risk is a state of the world; uncertainty is a state of the mind.”Footnote 28
In the presence of a historical record we would nonetheless anticipate some correspondence between future judgements and objective risk, but experimentation by psychologists has shown repeatedly that subjects alter probabilities away from the objective measure creating an alternative subjective measure. This is the basic argument driving Ellsberg'sFootnote 29 views on risk and ambiguity:
yet the feeling has persisted that … People tend to behave ‘as though’ they assigned numerical probabilities, or ‘degrees of belief,’ to the events impinging on their actions. However, it is hard either to confirm or deny such a proposition in the absence of precisely-defined procedures for measuring these alleged ‘degrees of belief’(p. 643).
The evidence in favour of the psychological model is found in a number of studies conducted by teams of psychologists and economists.Footnote 30 For example, motivated by EdwardsFootnote 31 who argued that subjective weights in decision-making can differ remarkably from objective probabilities that they may not follow any laws at all, McClelland et al.'sFootnote 32 findings show that for high probability losses insurance purchases approximated expected values, but with low probability losses bids for insurance exceeded expected values. In fact they found that the distribution of bids across participants was bimodal with some considering the probabilities and expected loss too low to deal with and bid zero or close to zero, and a second group bidding in excess of losses of low probability losses. They concluded that the expected utility model was not credible and focus should be placed on the cognitive processes of generalised expected utility or prospect theory.Footnote 33
One explanation as to why subjective probabilities depart from objective probabilities is due to overconfidence. Overconfidence may be viewed as a cognitive inability to be underconfident about future choices.Footnote 34 We are aware of only one study, that by Umarov and Sherrick,Footnote 35 that has made a serious attempt to measure overconfidence in crop yield judgements. Pease et al. and Clop-Gallart and Juárez-RubioFootnote 36 come close. A related conjecture is the competence hypothesis. Heath and Tversky and Wallsten et al.Footnote 37 argue that the willingness to take on a bet depends not only on the likelihoods of outcomes and precision over knowledge of these likelihoods, but also on one's general knowledge or understanding of the relevant contexts. Thus, when some form of memory is anticipated, asking a pro-forma question will not entirely be independent of the memoried history but will be a reconstruction of that history with a comingled variety of cognitive social and motivational factors affecting judgement, choice and action.Footnote 38
Crop yield distribution measurement and the PERT distribution
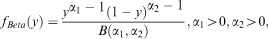
The PERT distribution (“Program Evaluation Research Task”) was developed originally by Malcolm et al.Footnote 39 In our context we define the optimistic yield/mu as b, the pessimistic yield/mu as a, and the modal yield, m. The standard deviation of these yields is assumed to be σ=1/6(b−a). Assuming further that the underlying generating process is a beta distributionFootnote 40 as provided above with  ,
,  and
and  , the Beta-PERT distribution is given byFootnote 41

Although use of the PERT distribution is not foreign to agricultural risk assessments,Footnote 42 we are surprised that we have found only one study of crop yield distributionsFootnote 43 to utilise the PERT distribution even though there is a reasonable literature that attempts to match objective vs. subjective distributions for this purpose.Footnote 44 Clop-Gallart and F. Juárez-Rubio were interested in developing yield distributions for management support systems and not crop insurance but found that simple elicitation techniques were very reliable and did not depart greatly or significantly from the true and known distribution.
As for the PERT distribution we employ in this paper, it has the benefit of being a derivative of the beta distribution, which is a derivative of the gamma distribution; but because this beta distribution's shape parameters can be computed without econometric estimation from observed minimum, maximum, and most likely values, we avoid the need to econometrically estimate the distribution parameters and therefore avoid the over-fitting problem in Woodard and Sherrick.Footnote 45 The PERT distribution is also flexible and can mimic many other types of crop yield distributions. This is important for there is little agreement among researchers as to what distribution best describes crop yields. For example, the distributions for spring grains, wheat, corn and soybeans in Ontario as reported in Turvey and ZhaoFootnote 46 show that of 609 yield records, 28 per cent were consistent with a normal distribution, 50 per cent for a beta distribution and 22 per cent for a gamma distribution. Furthermore, they show in their Table 1 (p. 16) that no crop is excluded from having some proportion being described by normal, beta or gamma. Sherrick et al.Footnote 47 empirically tested Illinois corn data. Examining their Table 2 results (p. 413) shows of 26 corn samples, one tested for normality, eight for logistic, eight for weibull and nine for beta using the Anderson-Darling test.
Applying the PERT distribution to the problem of crop yield distributions
In this section we develop the approach to determining crop yield distributions. We start by defining mean yields

The indemnity function for crop yield coverage protection of z is

We can compare this with the subjective distribution g(y)

Assuming that I−I s <=>0, then

Or

Here we define δ as a subsidy level (Subsidy=1−(Subjective Premium/Actuarially Fair Premium)) but it is probably best described parametrically as a multiplier required to equate the two loss functions. This can be positive or negative. If negative, then that suggests that a subsidy would be required to balance subjective and actuarial risks, but if positive, then this would reflect a willingness to pay above the actuarial risk for protection. Naturally we find the former is far more common in our sample than the latter. Our intention here is similar, yet different, from Umarov and Sherrick,Footnote 48 who test whether farmers tend to be overconfident when assessing expected yields. Their approach was to ask respondents to assign probabilities to the intervals specified for each (corn) yield level and fit those intervals to a Weibull distribution. They then obtained county data, detrended and rescaled it and fit it to a Weibull distribution as well. They then compared the two and found that about 62 per cent of their respondents believed their subjective beliefs to be greater than the average county yields. Our approach is much simpler and more direct since we compare objective (historical) PERT with subjective (pro-forma) PERT but require no intervening maximum likelihood estimates to fit responses to a distribution.
Direct elicitation of risk
This study uses a survey method to directly elicit risk perceptions from farmers. The survey took place in three counties (25 villages) in Shaanxi Province in October 2011. A total of 780 farmers were surveyed about their expectations for next year's price and yield and their historical yield in November 2011, during which 20 Chinese graduate students of the Northwest Agriculture and Forestry University (supervised by faculty researchers) were sent into villages across three counties.
The survey had nine sections with 117 questions in total. Only a portion of these were dedicated to crop insurance and the identification of crop yield risks via PERT. The original survey was prepared in English, translated into Chinese, then translated back into English by two independent bilinguals. The survey took between 40 and 80 minutes to complete, with the student reading the question to the farmer and filling in a paper questionnaire. Participating farmers were provided a gift of two bags of laundry detergent valued at approximately Rmb8. We visited 780 households and collected 731 questionnaires. After eliminating incomplete questionnaires and farmers who do not grow corn or wheat, we have 571 data records for corn.Footnote 49
About 55 per cent of respondents were male, with an average age of 48.72 years, and at least high school completion. On average respondents had farmed for about 27 years but this ranged from first year farmers to about 60 years. Allocated land use rights averaged about 4.93 mu/household (4.88 members per household) and income averaged 23,796 yuan/year from all sources with the highest being 248,000 yuan.
The three key survey questions for eliciting the PERT distributions are presented in Figure 1. The order in which we ask the questions matters to avoid framing issuesFootnote 50 that would otherwise anchor the subjective response. For example had we asked farmers to recall history first, then their responses would have been heavily weighted by this baseline information. Instead we create a cognitive illusionFootnote 51 consistent with the heuristics and biases discussed by Tversky and KahnemanFootnote 52 to explain bounded rationalityFootnote 53 and the reasoning behind subjective departures from objective information including representativeness.Footnote 54 The source of cognitive illusion, as explained by Kahneman and Tversky,Footnote 55 is referred to as base-rate neglect which is the idea that even in the presence of known information (the farmer's own historical record), this history is largely ignored or significantly underweighted. Consequently, we first asked each farmer what would be his/her expected lowest possible, most likely, and highest possible price (Yuan/Jin) for his crops next year. We then asked what would be his expected lowest possible, most likely, and highest possible yield (Jin/Mu) for the following year. The two answers in combination allow us to calculate the subjective revenue (Yuan/mu) for each farm. We make no reference in the questions to the base-rate historical record that could form an objective measure of the crop yield distribution or prices, and therefore have no influence on whether the judgements are based on the historical record, information in the present that is not contained in the historical record or any other heuristic that might influence parameter choice. We then asked each farmer what had been his lowest ever, highest ever and typical yield (Jin/Mu) in his/her memory. This information, combined with the price assessment, allows us to calculate the historical revenue (Yuan/mu) for each farm.

Direct risk elicitation—sample survey questions.
Monte Carlo simulation
One of the advantages of using PERT is that it places no restriction on the shape of the crop yield distribution. Thus, in order to calculate lower partial moments to indemnity schedules, we apply Monte Carlo simulation to the PERT distributions and generate probability distributions for historical and subjective revenues for each farm. We use Palisade Corporation's @RISK to generate the Monte Carlo simulations. We first construct individual price distributions for each farm as well as a “consensus price distribution” that is agreed upon by all farms in the survey area. The consensus price distribution is obtained by plugging average lowest possible price, average most likely price and average highest possible price into the PERT distribution formula. The consensus price distribution helps to reduce variations in price when simulating distributions for historical revenues. The consensus price distribution was used to generate random prices that were the same for all farms. One final consideration for Monte Carlo simulation is the correlation within villages and between villages. We ran Analysis of Variance and found that assessment for yields, both subjectively and historically, are more clustered within villages. We therefore set the within-village correlation to be 0.8 and cross-village correlation to be 0.6. These correlations are not empirically estimated (because we have no individual historical household data with which to estimate them) but are merely used as placeholders to ensure that marginal probability distributions among our sample farms are not generated under a much weaker assumption of independence.Footnote 56 Monte Carlo simulations are based on 5000 iterations.
Results
For each farm we require a comparison of subjective vs. historical probability distributions. These are too numerous to present but we provide an overlay of subjective and historical probability functions for two sample farms in Figure 2. These are very typical of what we observe in all farms and indicate that farmers are in general more optimistic about their expected yield for next year than what has occurred in the past. The historical data, on the other hand, not only suggests lower expectation (i.e. lower mean) but also higher variations (i.e. larger standard deviation) and different degrees of skewness. This result is observationally consistent with Sherrick'sFootnote 57 behavioural finance study on farmers’ “overconfidence”.

PERT-based subjective vs. historical probability distributions. The two figures show what we typically found in the data. Generally the subjective downside risk is lower than the historical distribution, but we also found that the patterns of probability could be quite different.
Table 1 summarises the means and variance comparison in each village. Overall, 82.31 per cent of all farmers expect higher revenue for next year than their historical records suggest. In all, 71.63 per cent of all farmers gave us a narrower interval of variation than the historical variances. Such “overconfidence” prevails in every village we surveyed, indicating that farmers are not only optimistic about their future yields but also seldom aware of the risks they face.
The large portion of overconfident farmers in Shaanxi at least partly explains why farmers may be unwilling to purchase crop insurance at an actuarial rate and requires the heavy subsidisation by the government. What these results reveal is that farmers are unwilling to pay the premiums because they do not believe that the money to pay matches the risk they face. This is the essential case previously presented in Eqs. (2), (3) and (5). Eq. (5) is important because it shows by how much farmers will need to be subsidised in order to equate their subjective (Eq. (3)) and historical or objective (Eq. (2)) probability distributions. Eqs. (2), (3) and (5) are used in the following discussions.
Coverage level, premium and subsidy
The crop insurance products in current pilot areas in China have different coverage levels and inconsistent approaches for premium setting. In Henan Province, for example, the maximum indemnity that would be paid for corn production is 192 Yuan/mu, with a 6 per cent premium rate (11 Yuan/mu). The maximum indemnity for wheat is 311 Yuan/mu, with a 6 per cent premium rate (18 Yuan/mu).Footnote 58 The reason that premium rates are calculated based on maximum payout, however, is not clearly presented in governmental documents and may possibly be actuarially unfair. In this section, we will show that the directly elicited risk assessment will allow actuarial premium rating in absence of historical data. In addition, we will also calculate the expected take-up rate and optimal governmental subsidy levels.
We continue with our simulation method for the coverage level and premium setting task for Shaanxi province.Footnote 59 We assume that each producer may select guaranteed yield levels from 60 to 100 per cent, in 10 per cent increments of the expected yield. In this context, the probability of falling below each yield guarantee level gives us the amount of premium that each farmer is willing to pay as well as the amount that the insurer would charge. The difference between the two premium levels is the amount that the government needs to subsidise. In our simulations we use a guaranteed revenue level at 60 per cent, 70 per cent, 80 per cent, 90 per cent and 100 per cent of on expected income, based on the historical distributions. As discussed previously, it is this historical distribution that will determine the supply of insurance. It is the subjective distributions that determine demand.
For our purposes we define the participation rate, or take-up rate, as the percentage of farmers whose subjective premiums (Eq. (4)) are higher than the actual premiums (Eq. (5)) at a stated and equivalent coverage level. In other words, participation rate measures the percentage of people who are willing to pay more than (or equal to) what the insurance company will charge. The result of participation rate, premiums at various coverage levels and optimal subsidy levels are summarised in Table 2 for corn.
Table 2 shows the aggregated results for a corn insurance programme with an average across all corn producers of 681 Yuan/mu. These were aggregated from Monte Carlo simulations of all farms using individual historical farm PERT yield distributions (Jin/Mu) and a common price distribution based on average low, most likely and optimistic corn prices (Yuan/Jin). Coverage levels as a per cent of average historical yields make up each column pair. At 60 per cent coverage this insurance would provide a payoff if revenue fell below 408 Yuan/mu. Based on the historical yields the near-actuarial rate is 1.61 Yuan/mu, but based on subjective distributions the average premium that would be actuarial to the farmers’ beliefs was only 1.08 Yuan/mu. The ratio of these averages is 0.67, meaning that on average the premium based on a subjective distribution is only 67 per cent of the average historical (actuarial) premium. Only 5.08 per cent of farmers had subjective risk assessments with downside risk greater than the 1.61 Yuan/mu average. Across all farms over-confidence was such that on average farmers would require a premium subsidy of 95.96 per cent. Considering 90 per cent coverage of 613 Yuan/mu the proportions change. The historical distributions suggest an actuarial premium of 26.68 Yuan/mu while the average of the subjective distributions was 20.63 Yuan/mu (77 per cent). Being less over-confident at the central density compared with the tails, 17.16 per cent of farmers’ subjective risk premiums were higher than the actuarial premium. Even so, the average subsidy required to harmonise subjective and historical risks was 71.12 per cent.
Four key findings can be made from Table 2: First, the guaranteed revenues for corn ranges from 408 Yuan/mu (at 60 per cent coverage level) to 681 Yuan/mu (full 100 per cent coverage). Second, the percentage of farmers willing to purchase corn insurance, ranging from 5 per cent to 26 per cent, is quite low. This means that farmers will not participate unless the government provides subsidies. Participation rates increase with the increase of coverage level. Therefore, if higher revenue is guaranteed, more farmers will buy; third, the amount of premium that farmers are willing to pay, and the insurer needs to charge, at each coverage level are widely different. For corn, the amount that farmers are willing to pay ranges from 1.08 Yuan/mu (at 60 per cent coverage level) to 40.67 Yuan/mu (at 100 per cent coverage level). The amount that the insurer charges ranges from 1.61 Yuan/mu (at 60 per cent coverage level) to 53.20 Yuan/mu (at 100 per cent coverage level). At each coverage level, the amount that farmers are willing to pay is always lower than the amount that the insurance company will charge. This result is consistent with our previous analysis that farmers tend to be over-confident about their future revenues; fourth, due to the fact that over 80 per cent of the farmers tend to be overconfident in estimating their production income for the next year, a certain percentage of governmental subsidies will likely be necessary to ensure higher participation rates.
The last line of Table 2 calculates the break-even subsidy levels required at each coverage level. In general, the government will probably need to subsidise crop insurance by approximately 60 to 90 per cent, depending on coverage levels. This is higher than what the government is providing now. In Shanghai, the central government and local government covers 30 per cent of the premiums while the farmers need to pay 70 per cent. In Heilongjiang Province, the government pays for 35 per cent of the premiums while the farmers pay for 65 per cent. The current subsidies that the government provides are insufficient to cover the gap between the price that farmers are willing to pay and the price that the insurer charges. The required the governmental subsidy level decreases as coverage level increases. At a 60 per cent level, the government needs to subsidise over 90 per cent of the total charge. This means that a large portion of taxpayers’ money will be spent on the insurance plans. It is true that at low coverage levels, the premiums are lower. But since the guaranteed revenue is too low, farmers would not believe that they are likely to incur any indemnity. On the other hand, higher premiums with reasonable coverage levels could motivate farmers to participate in insurance programmes.
Econometric results
The survey we conducted in Shaanxi Province is a comprehensive one that also investigates farm characteristics, risk perceptions, farm finance and risk management. In this section we combine the shape parameters (mean, standard deviation and skewness) from Monte Carlo simulations on the PERT distributions for each farm to investigate insurance demand. Two regressions are performed here. We first examine what factors influence farmers’ “decision to purchase”. This information is directly obtained from our survey, in which we asked each farmer “is the crop insurance currently available to you”. If the answer is yes, we ask whether he purchases crop insurance or not. If the crop insurance is currently not available, we ask whether he will purchase or not if the product is offered. Farmers already purchasing insurance and those who would like to purchase if the product is made available are assigned value 1. Otherwise, they are assigned value 0.
Independent variables included here are based on Sherrick's57 paper. He uses age, farm size, education, non-farm income, debt-to-asset ratio, risk management importance, livestock and tenure as control variables. Instead of calculating debt-to-asset ratio, we directly asked farmers for their subjective evaluation of the severities of their debt level. This is because farmers’ subjective perception may have more direct impact on their purchase decisions than what the actual debt-to-asset ratio is. More importantly, the main difference between this study and Sherrick's is that Sherrick directly asks farmers to assign a probability to various categories of yield levels. In this study, however, we use the four moments of the individual probability distribution of revenue as proxies of risk attitudes. The mean, variance, skewness and kurtosis are obtained from the revenue distribution constructed through PERT distribution and Monte Carlo simulation, as described in previous sections. In a separate regression, the coefficient of variation, calculated as standard deviation divided by the mean, is included to replace both mean and standard deviation. We present results for linear probability regressions only since their more easily interpretable results were not materially different from estimated binomial logit models.
The second regression reveals factors that determine farmers’ “perceived downside risk”, which are proxied by the subjective premium that each farmer is revealed to be willing to pay under insurance with 100 per cent coverage at the mean. Same factors such as age, farm size, education, non-farm income, debt-to-asset ratio, risk management importance, livestock and tenure are used as control variables. Similarly, the two of the four moments (mean and variance) and the ratio are used to measure farmers’ risk attitudes. A GLS (controlling heteroskedasticity) regression is used for this regression. The results of the regressions are provided in Table 3.
We find that many of the control variables do not in fact influence either the participation likelihood or perception of downside risk, except for education. Farm households with higher levels of education are more likely to purchase crop insurance, but factors such as years farming, farm size, persons in-house, household income and debt level are relatively unimportant. However, farmers who indicated strong importance for risk management strategies are more likely to invest in insurance. Of greater interest is how the various moments of the distribution affect insurance choices. In both model 1 and model 2 only skewness matters. In fact, the more positively skewed the distribution, the less likely the farmer would be willing to buy insurance. Although not statistically different from zero the sign on mean is negative and standard deviation is positive. If we can ignore significance momentarily the story line is that farmers with higher mean expectations will be less likely to acquire insurance, while farmers with high standard deviations are more likely. But clearly it is subjective skewness, coupled with a philosophy of risk management practices, that will drive insurance decisions, at least for this group of Chinese farmers.
The regressions on perceptions of downside risk examine a different issue. The dependent variable is continuous and not binary. As with the insurance decision, education and importance of risk management are important variables, but unlike the insurance decision the perception of downside risk is negatively influenced by mean and positively influenced by standard deviation. The more risk that is perceived, the greater will be the perception of downside risk but this influence diminishes as expectations increase. Nonetheless, the results suggest that there may be some endogeneity since mean and variance affect downside risk (skewness) while skewness affects insurance decisions. But the relationship is not clear cut.
Conclusion
The biggest problem that crop insurance projects face in China is the lack of historical yield data. Based on a survey of 780 households in Shaanxi China, this study shows that premium setting is possible in absence of the past production data using direct elicitation of risk, the PERT distribution and Monte Carlo simulation. However, we believe that the more significant contribution is the segregation of the individual respondent risk assessments into historical and subjective probability distributions. We find that for the vast majority of farmers, subjective risks tend to be of higher mean, lower standard deviation and are more positively skewed. In other words, farmers’ perceptions of risk lead to overconfidence. In all, 76 per cent of farm households expect mean yields to be higher than the historical records, with 77 per cent having subjective standard deviations lower than the historical record. This phenomenon of overconfidence is not a trivial matter. In much of the Western literature on crop insurance, it is deemed unreasonable/irrational that farmers’ subjective beliefs would be significantly different from the historical record. Our results lend credence to the argument that the reason that farmers do not adopt crop insurance is that there is a disconnect between perceived risk and actual risk. Because insurance premiums and indemnities are calculated from downside risks, we illustrate that unless subjective distributions are aligned with the historical distributions, substantial subsidies will be required to encourage participation for large numbers of Chinese farmers. Our finding that farmers with more negatively skewed (pessimistic) subjective distributions are more likely to purchase crop insurance than those with more positively skewed (optimistic) distributions is consistent also with the conclusions of Spinnewijn22 for health insurance. The welfare implication is that the demand for insurance may overstate welfare surplus to those demanding insurance, while understating surplus for those who do not. Since it is perceived risk that governs demand and actual risk that governs supply it is no wonder that market imperfections arise and that government involvement and subsidies is required to encourage participation. Even if the historical yields would be protected with 100 per cent coverage, only 25 per cent of farmers would purchase the insurance without any form of subsidy. This conclusion is consistent with findings in Feng, Shi and Sun and Zhong.Footnote 60 For example, if the insurer is overly concerned about moral hazard and applies coverage at 60 per cent of the historical mean, only 5 per cent of farmers would purchase the insurance at a fair rate based upon their subjective beliefs.
Notes
4 Sun (2008).
9 E.g. Chang (2009).
See also Zering et al. (1987).
E.g. Chen and Chang (2005); Ye (2007).
We focus in this paper on corn, but we also find of 576 farms that grew wheat 76.04 per cent viewed subjective means higher, and 77.26 per cent viewed subjective risk lower than the historical record.
See Lewin (1996); Rabin (1998) and Kahneman (2003).
Houston (1964) p. 514.
Malcolm et al. (1959) developed PERT to study the critical paths in the development and manufacture of the Polaris Fleet Ballistic Missile programme. The main task of PERT was to examine randomness along nodes of a critical path to provide estimates of a range over which the project will be completed. Malcolm et al., ibid. sought a simple means by which engineers could simply state shortest time, longest time and most likely time for any task to be completed at any node.
The Beta distribution for a crop yield y is defined by
where
 is the Beta function, α1, α2 are shape parameters, and 0⩽t⩽1.0 is an index counter.
This formulation of the PERT distribution differs from that originally presented in Malcolm et al., op. cit.who defined the beta distribution,
 , with
  and
and 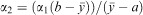
E.g. Bewley et al. (2010).
Turvey and Zhao (1999; from Zhao, 1992).
We also collected data on wheat but report here only the corn results. We found that the story line in terms of our objectives was the same for corn as wheat, so that reporting wheat results would add little to the paper except length.
Whether we use the assumed correlations or assume that farms are independent will not affect the distributions we generate in that the mean, median, mode, skewness and standard deviation will be identical.
Henan Province Government website: www.henan.gov.cn/zwgk/system/2010/07/02/010201989.shtml.
All simulations used the same seed value and can therefore be directly compared.

 is the Beta function, α1, α2 are shape parameters, and 0⩽t⩽1.0 is an index counter.
 , with
  and
and 
References
Akerlof, G.A. (1970) ‘The market for “lemons”: Quality uncertainty and the market mechanism’, Quarterly Journal of Economics 84 (3): 488–500.
Barrett, C.B., Barnett, B.J., Carter, M.R., Chantarat, S., Hansen, J.W., Mude, A.G., Osgood, D., Skees, J.R., Turvey, C.G. and Ward, M.N. (2007) Poverty Traps and Climate Risk: Limitations and Opportunities of Index-based Risk Financing (September 2007), IRI Technical Report No. 07-02. Available at SSRN: www.ssrn.com/abstract=1141933.
Bewley, J.M., Boehlje, M.D., Gray, A.W., Hogeveen, H., Kenyon, S.J., Eicher, S.D. and Schutz, M.M. (2010) ‘Assessing the potential value for an automated dairy cattle body condition scoring system through stochastic simulation’, Agricultural Finance Review 70 (1): 126–150.
Boyd, M., Pai, J., Qiao, Z. and Ke, W. (2011) ‘Crop insurance principles and risk implications for China’, Human and Ecological Risk Assessment: An International Journal 17 (3): 554–565.
Buzby, J.C., Kenkel, P.L., Skees, J.R., Pease, J.W. and Benson, F.J. (1994) ‘A comparison of subjective and historical yield distributions with implications for multiple peril crop insurance’, Agricultural Finance Review 54 (1): 15–23.
Cai, J., de Janvry, A. and Sadoulet, E. (2011) Social networks and insurance take-up: Evidence from a randomized experiment in China, Research Paper No. 8. University of California, Berkeley, from www.ilo.int/public/english/employment/mifacility/download/repaper8.pdf, accessed 24 April 2012.
Camerer, C.F. and Lovallo, D. (1999) ‘Overconfidence and excess entry: An experimental approach’, American Economic Review 89 (1): 306–318.
Chang, H.-J. (2009) ‘Rethinking public policy in agriculture—Lessons from history, distant and recent’, Journal of Peasant Studies 36 (3): 477–515.
Chen, C.C. and Chang, C.C. (2005) ‘The impact of weather on crop yield distribution in Taiwan: Some new evidence from panel data models and implications for crop insurance’, Agricultural Economics 33 (S3): 503–511.
Clop-Gallart, M.M. and Juárez-Rubio, F. (2007) ‘Elicitation of subjective crop yield’, Spanish Journal of Agricultural Research 5 (1): 16–24.
Cohen, A. and Einav, L. (2007) ‘Estimating risk preferences from deductible choice’, American Economic Review 97 (3): 745–788.
Edwards, W. (1954) ‘The theory of decision making’, Psychological Bulletin 51 (4): 380–417.
Einav, L., Finkelstein, A. and Cullen, M.R. (2010a) ‘Estimating welfare in insurance markets using variation in prices’, The Quarterly Journal of Economics 125 (3): 877–921.
Einav, L., Finkelstein, A. and Schrimpf, P. (2010b) ‘Optimal mandates and the welfare cost of asymmetric information: Evidence from the U.K. annuity market’, Econometrica 78 (3): 1031–1092.
Ellsberg, D. (1961) ‘Risk, ambiguity, and the savage axioms’, The Quarterly Journal of Economics 75 (4): 643–669.
Fang, H., Keane, M.P. and Silverman, D. (2008) ‘Sources of advantageous selection: Evidence from the Medigap insurance market’, Journal of Political Economy 116 (2): 303–350.
Feng, W. (2004) ‘Market failure and institution supply of agriculture insurance in China’, Journal of Finance, (Chinese) 2004-4, from www.en.cnki.com.cn/Article_en/CJFDTOTAL-JRYJ200404016.htm.
Fischhoff, B., Slovic, P. and Lichtenstein, S. (1977) ‘Knowing with certainty: The appropriateness of extreme confidence’, Journal of Experimental Psychology: Human Perception and Performance 3 (4): 552–564.
Gardner, B.L. and Kramer, R.A. (1986) ‘Experience with crop insurance programs in the United States’, in P. Hazell, C. Pomareda and A. Valdes (eds.) Crop Insurance for Agricultural Development, Baltimore: The Johns Hopkins University Press.
Glauber, J. (2004) ‘Crop insurance reconsidered’, American Journal of Agricultural Economics 86 (5): 1179–1195.
Han, L., Li, D., Moshirian, F. and Tian, Y. (2010) ‘Insurance development and economic growth’, The Geneva Papers on Risk and Insurance—Issues and Practice 35 (2): 183–199.
Heath, C. and Tversky, A. (1991) ‘Preference and belief: Ambiguity and competence in choice under uncertainty’, Journal of Risk and Uncertainty 4 (1): 5–28.
Heimfarth, L.E. and Musshoff, O. (2011) ‘Weather index-based insurances for farmers in the North China plain: An analysis of risk reduction potential and basis risk’, Agricultural Finance Review 71 (2): 218–239.
Hertwig, R. and Ortmann, A. (2005) ‘The cognitive illusion controversy: A methodological debate in disguise that matters to economists’, In R. Zwick and A. Rapoport (eds.) Experimental Business Research, U.S.: Springer, pp. 113–130.
Houston, D.B. (1964) ‘Risk, insurance and sampling’, Journal of Risk and Insurance 31 (4): 511–538.
Hui, L., Liu, R. and Lu, Y. (2008) ‘Empirical study on farmer's agricultural insurance demand—A case study in Lianshui’, Journal of Catastrophology, Chinese, 2008-03, from www.en.cnki.com.cn/Article_en/CJFDTOTAL-ZHXU200803027.htm.
Just, R.E., Calvin, L. and Quiggin, J. (1999) ‘Adverse selection in crop insurance: Actuarial and asymmetric information incentives’, American Journal of Agricultural Economics 81 (4): 834–849.
Kahneman, D. (2003) ‘Maps of bounded rationality: Psychology for behavioral economics’, The American Economic Review 93 (5): 1449–1475.
Kahneman, D. and Tversky, A. (1972) ‘Subjective probability: A judgment of representativeness’, Cognitive Psychology 3 (3): 430–454.
Kahneman, D. and Tversky, A. (1979) ‘Prospect theory: An analysis of decision under risk’, Econometrica 47 (2): 263–292.
Kahneman, D. and Tversky, A. (1996) ‘On the reality of cognitive illusions’, Psychological Review 103 (3): 582–591.
Knight, F.H. (1921) Risk, Uncertainty and Profit, Boston: Houghton Mifflin.
Kong, R., Turvey, C.G., He, G., Ma, J. and Meagher, P. (2011) ‘Factors influencing Shaanxi and Gansu farmers’ willingness to purchase weather insurance’, China Agricultural Economic Review 3 (4): 423–440.
Lewin, S.B. (1996) ‘Economics and psychology: Lessons for our own day from the early twentieth century’, Journal of Economic Literature 34 (3): 1293–1323.
Li, W., Liu, R. and Fang, L. (2009) ‘Rating crop area yield insurance at county level’, Ecological Economy, (Chinese), 2009-07, from www.en.cnki.com.cn/Article_en/CJFDTOTAL-STJJ200907008.htm.
Machina, M.J. (1982) ‘Expected utility analysis without the independence axiom’, Econometrica 50 (2): 227–323.
Malcolm, D.G., Roseboom, J.H., Clark, C.E. and Fazar, W. (1959) ‘Application of a technique for research and development program evaluation’, Operations Research 7 (5): 646–669.
McClelland, G.H., Schulze, W.D. and Coursey, D.L. (1993) ‘Insurance for low-probability hazards: A bimodal response to unlikely events’, Journal of Risk and Uncertainty 7 (1): 95–116.
Pease, J.W., Wade, E.W., Skees, J.S. and Shrestha, C.M. (1993) ‘Comparisons between subjective and statistical forecasts of crop yields’, Applied Economic Perspectives and Policy 15 (2): 339–350.
Pfeffer, I. (1956) Insurance and Economic Theory, Homewood, IL: Richard D. Irwin, Inc.
Rabin, M. (1998) ‘Psychology and economics’, Journal of Economic Literature 36 (1): 11–46.
Ramaswami, B. (1993) ‘Supply response to agricultural insurance: Risk reduction and moral hazard effects’, American Journal of Agricultural Economics 75 (4): 914–925.
Ramirez, O. and Carpio, C.A. (2012) ‘Premium estimation inaccuracy and the actuarial performance of the US crop insurance program’, Agricultural Finance Review 72 (1): 117–133.
Sai, T., Yulian, W. and Xiaofeng, H. (2010) ‘An empirical study of agricultural insurance—Evidence from China’, Agriculture and Agricultural Science Procedia 1: 62–66.
Sherrick, B.J. (2002) ‘The accuracy of producers’ probability beliefs: Evidence and implications for insurance valuation’, Journal of Agricultural and Resource Economics 27 (1): 77–93.
Sherrick, B.J., Barry, P.J., Ellinger, P.N. and Schnitkey, D.G. (2004) ‘Factors influencing farmers’ crop insurance decisions’, American Journal of Agricultural Economics 86 (1): 103–114.
Shi, H. (2008) ‘Empirical study on influence of financial subsidy on farmers’ agricultural insurance decision: Evidence from Zhejiang province in China’, Technology Economics (Chinese), 2008-09, from www.en.cnki.com.cn/Article_en/CJFDTOTAL-JSJI200809017.htm.
Simon, H.A. (1955) ‘A behavioral model of rational choice’, The Quarterly Journal of Economics 69 (1): 99–118.
Skipper Jr, H.D. (1997) Foreign insurers in emerging markets: Issues and concerns, Occasional Paper 97–2, Center for Risk Management and Insurance, International Insurance Foundation, Washington, DC.
Spinnewijn, J. (2012) Heterogeneity, demand for insurance and adverse selection, (February 2012). CEPR Discussion Paper No. DP8833. Available at SSRN: www.ssrn.com/abstract=2013824.
Sun, X. (2008) ‘Crop insurance knowledge, trust on government and demand for crop insurance-An empirical study of peasant households’ willingness-to-pay in Huai’an, Jiangsu Province’, Journal of Nanjing Agricultural University (Social Science Edition), 2008-1, from www.en.cnki.com.cn/Article_en/CJFDTOTAL-NJNS200801008.htm.
Sun, X. and Zhong, F. (2008) ‘The welfare economic analysis of crop insurance subsidy’, Issues in Agricultural Economy (Chinese), 2008: 2, from www.en.cnki.com.cn/Article_en/CJFDTotal-NJWT200802001.htm.
Turvey, C.G. (1992) ‘An economic analysis of alternative farm revenue insurance policies’, Canadian Journal of Agricultural Economics 40 (3): 403–426.
Turvey, C.G. (2012) ‘Whole farm income insurance’, Journal of Risk and Insurance 79 (2): 515–540.
Turvey, C.G. and Kong, R. (2010) ‘Weather risk and the viability of weather insurance in China's Gansu, Shaanxi, and Henan provinces’, China Agricultural Economic Review 2 (1): 5–24.
Turvey, C.G. and Zhao, J. (1999) Parametric and non-parametric crop yield distributions and their effects on all-risk crop insurance premiums, Working paper No. 34/29, Department of Agricultural Economics and Business, University of Guelph, Ontario.
Tversky, A. and Kahneman, D. (1974) ‘Judgment under uncertainty: Heuristics and biases’, Science 185 (4157): 1124–1131.
Tversky, A. and Kahneman, D. (1981) ‘The framing of decisions and the psychology of choice’, Science 211 (4481): 453–458.
Tversky, A. and Kahneman, D. (1983) ‘Extensional vs. intuitive reasoning: The conjunction fallacy in probability judgment’, Psychological Review 90 (4): 293–315.
Tversky, A. and Kahneman, D. (1986) ‘Rational choice and the framing of decisions’, Journal of Business 59 (4): S251–S278.
Umarov, A. and Sherrick, B.J. (2005) Farmers’ subjective yield distributions: Calibration and implications for crop insurance valuation, Selected paper presented at the American Agricultural Economics Association (AAEA) Annual Meeting Providence, Rhode Island, 24–27 July.
Wallsten, T.S., Budescu, D.V., Erev, I. and Diederich, A. (1997) ‘Evaluating and combining subjective probability estimates’, Journal of Behavioral Decision Making 10 (3): 243–268.
Willett, A.H. (1951) The Economic Theory of Risk and Insurance, Philadelphia: University of Pennsylvania Press.
Winters, L.A. (1990) ‘The so-called “non-economic” objectives of agricultural support’, OECD Economic Studies No. 13, Winter 1989–1990.
Woodard, J.D. and Sherrick, B.J. (2011) ‘Estimation of mixture models using cross-validation optimization: Implications for crop yield distribution modeling’, American Journal of Agricultural Economics 93 (4): 968–982.
World Bank (2005) Managing Food Price Risks and Instability in an Environment of Market Liberalization, Washington DC: Agricultural and Rural Development Department.
Ye, X.-L. (2007) ‘An analysis on asymmetric information and effective supply of agricultural insurance’, Commercial Research (Chinese), 2007-02, from www.en.cnki.com.cn/Article_en/CJFDTOTAL-BUSI200702037.htm.
Zering, K.D., McCorkle Jr, C.O. and Moore, C.V. (1987) ‘The utility of multiple peril crop insurance for irrigated, multiple-crop agriculture’, Western Journal of Agricultural Economics 12 (1): 50–59.
Zhang, Y., He, W. and Shi, H. (2007) ‘Market failures, policy-oriented agricultural insurance and localization schemas: Comparative study of the agricultural insurance at Zhejiang, Shanghai and Suzhou’, Issues in Agricultural Economy (Chinese), 2007-06, from www.en.cnki.com.cn/Article_en/CJFDTOTAL-NJWT200706010.htm.
Zhao, J. (1992) ‘Crop insurance premiums and yield distributions: An application of non-parametric test and kernel estimation’, MSc Thesis, University of Guelph, August.
Acknowledgements
We would like to thank two anonymous reviewers for their very helpful comments. This research was partially supported by W.I. Myers endowment funds, Cornell University, and the China National Nature Science Fund with grant number 70873096 and Humanities and Social Science Fund of China Education Department with grant number 07JA790027.
Author information
Authors and Affiliations
Rights and permissions
About this article
Cite this article
Turvey, C., Gao, X., Nie, R. et al. Subjective Risks, Objective Risks and the Crop Insurance Problem in Rural China. Geneva Pap Risk Insur Issues Pract 38, 612–633 (2013). https://doi.org/10.1057/gpp.2012.42
Received:
Accepted:
Published:
Issue Date:
DOI: https://doi.org/10.1057/gpp.2012.42