
Abstract
The present research work amis to develop a controlled vibratory system for improving the performance of slotting process based on the vibration-assisted milling technique. In addition, the establishment of a statistical model for predicting the process efficiency was a key aim target.
In the current investigation, an ultrasonic vibratory device was designed to provide vibration oscillations in the cutting feed direction to the 7075 aluminum alloy workpiece side at 34.7 kHz frequency and 10 μm amplitude. A LabView code has been developed to control the input vibration parameters. A full factorial design of experiments with 4 factors and 2 levels was conducted. An in-depth statistical analysis is then implemented to study the effect of machining and vibration parameters on the process performance. Then, a statistical model for predicting the process response in terms of cutting force, surface roughness, and machining accuracy has been established.
Some experiments showed a significant reduction in cutting force up to 50% in the feed direction. Additionally, an improvement in workpiece surface roughness was recorded. Regarding the machined surface accuracy, introducing ultrasonic vibrations significantly reduces the produced slot width error compared to Conventional Milling (CM).
The developed statistical model shows a very well agreement with the experimental results. Therefore, the developed VAM technique is suitable for manufacturing parts that require high geometrical and dimensional accuracy.
Introduction
Transport industry including automotive, aerospace, and marine structures, are relying on 7075 aluminum alloy as essential material for more than 80 years due to its high strength-to-weight ratio and high corrosion resistance [1,2,3]. While aluminum alloys has an acceptable cutting forces response compared to the other metallic alloys such as steel and titanium alloys, it has some defects regarding the surface roughness and geometrical accuracy [4, 5]. Hence, VAM process has been introduced to improve the machining performance from several aspects such as machined surface accuracy, surface roughness, and tool life [6,7,8]. The challenge to characterise and optimise the wide range of machining and vibration parameters during VAM attracted researchers to investigate and develop the unique promising technique of VAM.
In this concern, Ding et al. established 2 dimensions vibration platform to investigate the vibration-assisted micro end-milling process. The study’s outcomes pointed out that utilising the 2 dimensions vibration enhanced the prolongation of tool life. It was recommended that larger amplitude and higher frequency were more helpful for reducing the tool wear [9].
To address the effect of cutting speed during VAM, Zarchi et al. derived a formula of the critical cutting speed in 1D VAM in which the positive impact of VAM turns on to be a negative aspect. Experimentally, a 1D VAM setup has been fabricated to deliver the ultrasonic vibration to the workpiece side in the feed direction. It was observed that cutting forces reduced significantly as the cutting speed was below the critical cutting speed [10]. Afterwards, the authors studied the influence of feed rate and milling strategy (up or down) during the side milling process. Results concluded that the workpiece surface quality had been improved in VAM when high cutting speeds, low feed rates, and up milling technique were used [11]. Janghorbanian et al. investigated the tool life during the process of VAM. The experimental results showed that, at cutting speeds between 500 and 2000 rpm, the tool life in VAM was less than in CM. However, the tool life in VAM increased significantly when the cutting speed was higher than 3150 rpm due to the change in the tool wear mechanism [12].
Regarding the high machining temperature issue, Luo and Maroju experimently investigated the impact of vibration assistance on cutting temperature. It was found that the increase in cutting parameters led to the increase of cutting temperature while introducing vibration assistance decreased significantly the cutting temperature [8, 13]. Elhami et al. studied the impact of introducing a concentrated plasma heat source during ultrasonic-assisted milling of hardened AISI 4140. They developed an analytical model in which the vibration effect on instantaneous chip thickness was considered. Consequently, the temperature field in the workpiece and reduction in cutting forces due to thermal softening can be predicted by the model [14].
To investigate the VAM cutting mechanism mathematically, Ding et al. developed a 2D Vibration-Assisted Micro End Milling (2D VAMEM) cutting force model that estimated the chip thickness based on the tooltip trajectory. The model has been validated experimentally through a 2D vibrating worktable and an aluminum alloy workpiece. The established cutting force model results showed a reasonable agreement with the experimental investigation [15]. Moreover, an integrated model was proposed to simulate the surface generation during the 2D VAMEM. It was recognised that the surface roughness was improved with the increase in the feed rate. Experimentally, it was realised that the proposed model precisely present the investigated 2D VAMEM process [16].
Although it can be concluded that the machining process can benefit from introducing ultrasonic vibration, there is an impedimental research gap regarding the desired optimal combination of different process parameters (vibration and machining) and the interaction effect between them. Moreover, The previous literature did not consider measuring the product geometrical and dimensional accuracy despite its significant impact on the product assembly process.
Consequently, the current investigation is anchored with the following principles: Firstly, an ultrasonic-assisted milling system was designed to provide the workpiece with ultrasonic vibrations in the feed direction. The vibration frequency and amplitude values were controlled through a developed LabView code. Secondly, a full factorial design of the experiment was established to investigate the effect of interactions between investigated parameters in addition to the main effects of these parameters. Cutting force, surface roughness, and machined surface accuracy were observed, and an in-depth analysis of the results was conducted. Finally, a statistical model for predicting the observed VAM process responses was established and validated with some extra experiments.
The current investigation presents a VAM technique that can be applied to manufacturing industries that require precision and high accuracy. In addition, the developed statistical model is an essential tool that successfully controls the use of the VAM process according to the applied vibration and machining parameters.
Kinematics of 1-Direction Vibration-Assisted Milling
Fundamentally, the tool edge trajectory in Conventional Milling (CM) is generated by the tool rotary motion and the machine work table feed motion. Thus, the exact tooltip locus for 2 flutes milling cutter in the CM process is originally considered, as shown in Fig. 1(a). Solid and dashed curves illustrate the 2 flutes trajectories. The tooltips position can be mathematically described as follows [17]:
Where xi and yi are the Cartesian coordinates of the tool edge position, i indicates the two cutting edges (0 and 1), Vf is the cutting feed in (mm/s), n is the spindle rotational speed in (rev/min), R is the tool radius in (mm), and t is the cutting time (sec).

Fundamentals of tooltip trajectory (a) CM (b) VAM (c, d, and e) different amplitude value
Consequently, When a sinusoidal vibration signal with fx frequency in (Hz) and Ax amplitude in (µm) is applied to the milling process in the feed direction (X-axis direction), the relative tool tip trajectory can be expressed as follows [18] :
Where φx is the initial vibration phase angle. According to Eq. (2), distinctive adjacent tool paths are generated, as shown in Fig. 1(b).
Moreover, the effective cutting amplitude is the amplitude at which the effect of interrupted cutting mechanism occurs because the vibration amplitude becomes larger than the feed per tooth. Thus, the calculation of the effective cutting amplitude is necessary to select the suitable amplitude level during the experiments. The effective cutting amplitude should be higher or at least equal to the feed per tooth, which can be determined according to the following equation [19]:
Where aeff is the effective cutting amplitude in (µm), vf is the cutting feed in (mm/min). Figure 2 illustrates the relation between cutting feed and the rotational speed using which the selection of effective amplitude leads to the interrupted cutting mechanism.

Effective amplitude
Experimental Procedure
The current research work developed an ultrasonic-assisted milling system to provide ultrasonic vibration to the workpiece side. A LabView code was established to control the vibration frequency and amplitude. The design of the experiment was implemented to investigate the effect of the cutting parameters on the machined surface. Cutting force, surface roughness, and geometrical accuracy of the machined surface were observed, and the results were analysed.
Experimental Setup
The experimental work was implemented on a DMG-MORI ECOMILL 600 V Machining Centre. A vibration generation system consisted of NI PXI-1031, including Data Acquisition System (DAQ Sys.), EPA 104–115 Piezo Linear Amplifier and an electrical control circuit. The vibration waves were transferred to the workpiece side through an ultrasonic piezoelectric transducer. The applied working frequency during the experiments was set at 34.7 kHz, and the vibration wave amplitude was 10 μm. A Lab view code was established to control the applied vibration parameters, as shown in Fig. 3(a). A sample of the amplitude-time plot response of the vibration system is given in Fig. 3(b). The details of transducer design and calibration process can be found in reference [20].
Moreover, cutting forces were measured using Kistler dynamometer type 9272 equipped with a charge amplifier and DAQ Sys. The measuring range for feed and normal to feed forces is -5 to 5 kN, while it is -5 to 20 kN for the axial force. The used workpiece material was 7075 aluminum alloy rectangles (Al) of 60 mm×50 mm×10 mm. The used cutting tool was a 4 mm diameter carbide endmill with 2 flutes (DORMER Inc.). All details of the experimental setup are presented in Fig. 4.
To investigated and compare the slotting process performance in both Conventional Milling (CM) and Ultrasonic Milling (USM), the slot dimensional and geometrical accuracy, in addition to the machined surface roughness were observed. The surface roughness Ra and Rz values were measured using (Surface Roughness Tester TR-200), where 3 readings were measured along 15 mm of the slot length. In addition, a microscope (Olympus LEXT OLS4100) was used to observe the surface topography.
The actual-depth of-cut (DOC), width, and flatness error for the machined slot were measured to represent the process accuracy. The measurements were performed by a Coordinate Measuring Machine (CMM) (Mitutoyo CRYSTA - Apex S 544) of resolution: 0.0001 mm and a microscope (MARVISION MM 320) of resolution = 0.001 mm.

(a) LabView Code Block Diagram (b) amplitude-time plot

Experimental setup
Design of Experiments
According to 4 factors and 2 levels full factorial design of experiments, the machining trials were implemented. The investigated input parameters of the process were the spindle speed (rpm), the feed motion (mm/min), the depth of cut (mm) and the ultrasonic vibration parameters. This proposed design of the experimental technique is the most efficient because it includes all possible combinations of the investigated factors levels. The total number of tests were 48, in which each experiment was replicated three times randomly. The selected slot milling parameters and their levels are given in Table 1. Moreover, dry cutting conditions were applied during all the experiments. To implement the statistical analysis and to explore the significant process parameters and their interaction behaviour, Minitab software has been used.
Results and Discussion
Recording the cutting forces during CM and USM is essential to predict the required cutting power, obtain tight tolerances, and achieve minimum tool wear [21]. The slotting process forces combine three components: feed Fy, the normal to feed Fx, and the axial Fz. The force directions are along X, Y, and Z directions illustrated in Fig. 1(a). A sample of the recorded cutting forces in USM and CM is presented in Fig. 5. It can be seen that the force components are reduced in USM due to the effect of the interrupted cutting mechanism between the tool and workpiece.

Force component in USM and CM (feed = 5 mm/min, speed = 6000 rpm, DOC = 0.1 mm)
In the current investigation study, the mean value of each force component in X, Y, and Z directions was measured three times along the slot length. Additionally, the slot quality and accuracy were presented in terms of actual DOC, flatness error, and surface roughness.
Feed and Normal to Feed Forces (Fy, Fx)
From the measurement of the feed force Fy and the normal to feed force Fx, it was observed that both force components have very similar behaviour. Therefore, the dissection of both forces is gathered in the same section. The normal to feed force Fx in the case of USM and CM for the desired experimental parameters is given in Fig. 6(a), while the feed force Fy is illustrated in Fig. 6(b).
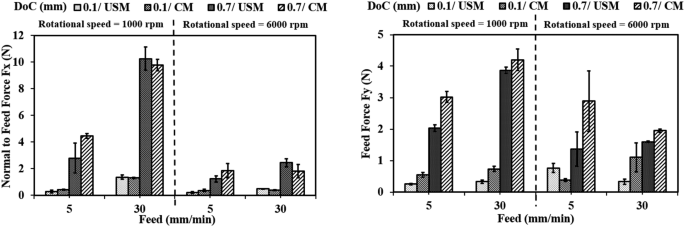
(a) Normal to feed force Fx (b) Feed force Fy in case of USM and CM
Generally, there is a noticeable reduction in the cutting forces in the X and Y direction in the case of USM. In conventional milling, The low rotational speed increases the cutting forces because the tool-workpiece interaction process increases. The increase in the rotational speed leads to an increase in the cutting velocity, which causes a higher shear rate and heat generation. Thus, the shear strength of the material is reduced due to the thermal softening resulting from the generated heat in the shear zone [22].
The same behaviour is expected to occur in USM, but the reduction in the cutting forces in X and Y directions is expected to be higher than that of CM because it is accompanied in USM by the interrupted cutting mechanism. In particular, the feed force Fy has been significantly reduced in USM because the vibration is applied in the feed direction. At a low level of feed, DOC, and spindle speed, it was observed that, by applying USM, the reduction in force was up to 50% and 30% in feed and normal to feed forces, respectively, when compared to CM. In contrast, at a high level of cutting feed and DOC and low level of spindle speed, the feed force is decreased by 7% while there is an increase in the normal to feed force by 5% in USM when compared to CM. The contribution effects of machining and vibration parameters on the horizontal forces Fx and Fy are illustrated in Fig. 7(a) and (b) respectively.

The normal probability plot (a) Normal to feed force Fx (b) Feed force Fy
In Fig. 7, the depth-of-cut (C) is found to be the dominant parameter for both Fx and Fy forces, and it is then followed by the feed (A). The interaction effect of the depth-of-cut and the feed (AC) is also significant for both Fx and Fy forces. The effect of ultrasonic vibration (D) significantly affects the force in the feed direction while it can be found in the interaction with the feed (AD) in the normal to feed direction. Accordingly, the regression equations to predict the normal to feed Fx and the feed Fy forces with R2 of 96.21% and 87.77%, respectively, are presented as follows:
The main effect and interaction plots for the horizontal force components Fx and Fy are presented in Fig. 8. In the conducted experiments, the ultrasonic vibration were applied in the feed direction, and that can be directly observed as Fy is declining in Fig. 8(b). The effect of vibration on Fx is not so high as shown in Fig. 8(a) and this pattern is reasonable because vibration direction is normal to the Fx direction. Although, the major interaction impact on the cutting forces behaviour is due to the interaction between feed and DOC, the interaction between feed and other machining parameters as well as feed and vibration are affected the cutting forces behaviour in limited pattern as shown in Fig. 8(c, d).
Moreover, it can be observed from the contour plot in Fig. 9(a) and (b) that the effect of ultrasonic vibration on Fx reduction occurs at a DOC 0.4 mm with a lower reduction in force value. The same behaviour is found for Fy with a much higher force reduction, as shown in Fig. 9(c) and (d). This contour plot is developed according to the regression model given in Eqs. (4) and (5). Experimental validation of the developed stastical model has been done at cutting speed of 6000 rpm, feed rate of 10 mm/min, and 0.4 mm DOC. The experimentaly validated results are illustrated in Fig. 9.

The main effect and interaction plots (a,c) Normal to feed force Fx (b,d) Feed force Fy

The contour plots in USM and CM (a,b) Normal to feed force Fx (c,d) Feed force Fy
Axial Force (Fz)
Overall, the influence of ultrasonic vibration on the axial cutting force (Fz) is totally different compared to its effect on the horizontal force components (Fx and Fy) as illustrated Fig. 10. This behaviour would be referred to the fact that the higher DOC the larger contact area between the cutting tool and the aluminum workpiece, which is a material characterized by its high plasticity, so that a large amount of the applied vibration energy is consumed by damping in the workpiece material [23]. The vibration absorption by the workpiece material decreases the interrupted cutting mechanism and leads to an extra contact between the cutting tool and the workpiece resulting from the application of vibration.
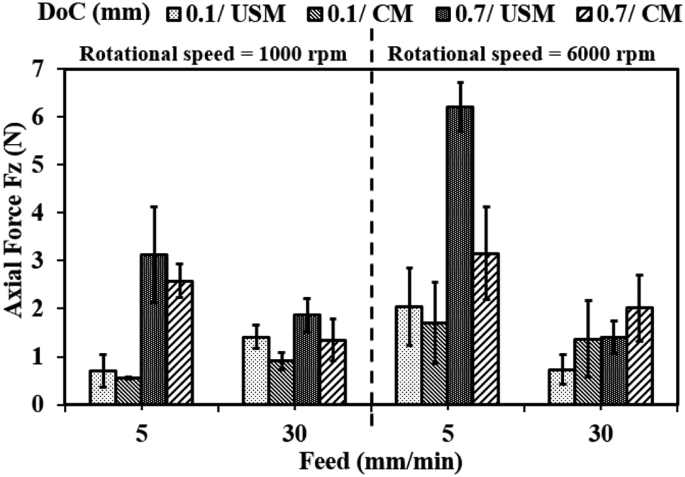
Axial cutting force (Fz) in case of USM and CM
However, at high levels of cutting speed (6000 rpm) and feed (30 mm/min), the introduction of ultrasonic vibration contributes to the reduction of the axial cutting force by a percentage of 45% and 30% for 0.1 and 0.7 mm DOC, respectively due to the effect of thermal softening at higher cutting speed [22]. Moreover, it can be observed from Fig. 11(a) that DOC (C) has the main effect on the axial force Fz and it is then followed by cutting speed (B). The effect of ultrasonic vibration (D) occurs in the interaction with feed and speed (ABD). Moreover, Fig. 11(b) shows the main effects of the machining and vibration parameters on the axial force value. Form the analysis of Fz results, it is statistically estimated at 0.4 mm DOC that the force value will be much higher in USM than CM for moderate and high cutting speeds and for low and moderate cutting feed. Consequently and based on the proposed regression model, the contour plots of Fz in the case of USM and CM are presented in Fig. 12 and Fz for o.4 mm DOC is investigated experimentally.

The axial force Fz (a) the normal probability plot (b) the main effect plot
Consequently, the regression model for estimate the axial cutting force (Fz) with R2 of 72.26% is given as follows:

The contour plots of axial cutting force Fz in (a) USM and (b) CM
Cutting Chips Formation
The cutting forces behaviour in USM and CM at various cutting parameters can be interpreted through the chip geometry formation, as shown in Fig. 13. The increase in the DOC depth-ofcut extended the contact length between the tool and the workpiece, which led to an enlargement in the chip cross-sectional area, and the cutting forces are increased [24]. For instance, when the DOC changed from 0.1 to 0.7 mm, the average chip cross-sectional area increases from 120 × 1000 μm to 950 × 1600 μm at n = 1000 rpm and f = 5 mm/rev. Moreover, a high level of cutting feed (30 mm/min) increases the material removal rate and results in a greater cutting forces. Introducing the ultrasonic vibration improves the slotting process characteristics through the interrupted cutting mechanism. This leads to reducing the toolworkpiece interaction, which consequently, decreases the chips size and the cutting forces.

The cutting chip geometry in USM and CM at different cutting parameters
Surface Roughness and Topography
In the current investigation, average roughness Ra of the slot bottom surface were measured at three distinct profiles across 15 mm of the slot length with cut off distance of 2.5 mm using a surface roughness tester (TR-200). The average of the recorded surface roughness Ra and Rz at different cutting conditions are presented in Fig. 14(a) and (b) respectively. Generally, the surface roughness Ra and Rz in USM was observed to have less value than in CM in most cases. Introducing the USM in the experiments reduces the contact time between the tool and the workpiece which produces better surface roughness [25]. Moreover, increasing the spindle speed to 6000 rpm produces smooth surface at low cutting depth of 0.1 mm and high feed rate of 30 mm/min.
Regarding the process parameters, it can be observed from Fig. 15(a) that DOC (C) has the main effect on the surface roughness Ra. The effect of ultrasonic vibration (D) appears in the interaction with feed and speed (ABD) as well as with feed interaction (AD). Furthermore, Fig. 15(b) shows the main effects of the machining and vibration parameters on the surface roughness value. On one hand, increasing the DOC from 0.1 to 0.7 mm leads to an increase in the surface roughness Ra that is referred to the increase of the axial cutting force Fz due to the large contact between the tool and workpiece as well as high friction.
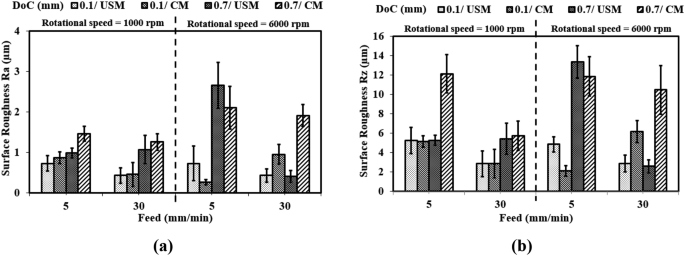
Surface Roughness (a) Ra and (b) Rz in case of USM and CM

Roughness Average Ra (a) normal probability plot (b) main effect plot
On the other hand, the lower DOC contributes in improving the surface topography, as shown in Fig. 16(a) and (b). The vibration effect on the workpiece surface is observed through the non-uniform tool marks in Fig. 16(a) and (c). The observed USM tool marks are agreed with the cutting tool path which is illustrated in Fig. 1. Similar behaviour has been documented [26]. Observed surface from Olympus has been processed by TalyMap software and presented in Fig. 17.
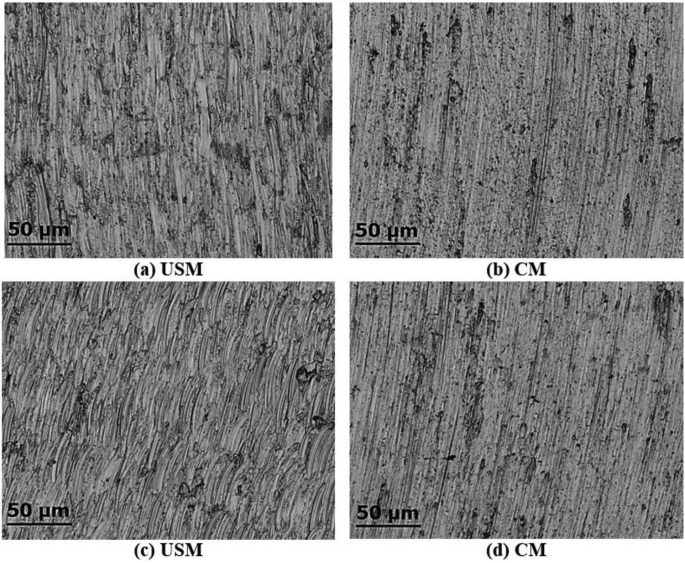
Surface topography observed by Olympus LEXT OLS4100 at (5 mm/min) feed and (6000) rpm cutting speed (a,b) DOC = 0.1 mm and (c,d) DOC = 0.7 mm

Surface roughness Ra from TalyMap software at (5 mm/min) feed and (6000) rpm cutting speed (a,b) DOC = 0.1 mm and (c,d) DOC = 0.7 mm
The conducted statistical analysis included a statistical model for surface roughness that can be used to estimate its value at different cutting conditions through the contour plot, as shown in Fig. 18. For instance, this figure presents the output bottom surface roughness attributed to the interaction between feed and speed in USM and CM at 0.4 mm DOC.

Surface roughness (a) Ra in USM (b) Ra in CM (c) Rz in USM (d) Rz in CM
Dimensional Accuracy
The variation of slot depth at different machining conditions is illustrated in Fig. 19(a). While, Fig. 19(b) shows the average measured actual slot width. For each slot, depth and width were measured nine times using the CMM and the average values were calculated. Experimental results show that there is a slight impact of USM on changing the actual slot depth. For 0.1 mm DOC, it was found that the best fit slot depth was 10% over the absolute depth value and achieved by USM at a low cutting feed of 5 mm/min and high speed of 6000 rpm. Moreover, the best fit slot depth for 0.7 actual DOC was 2% over the absolute value and produced by USM at a low cutting feed of 5 mm/min and a high speed of 6000 rpm. Therefore, it can be deduced that applying the USM at a low cutting feed and a high rotational speed would produce a better fit slot depth.
It is worth to mention that the used tool diameter is 4 mm and thus the theoretical slot width is to be 4 mm. in USM, the vibration movement is working as a sharpener for the slot wall edges which reduces the burr hight and improves the slot width accuracy [27, 28].
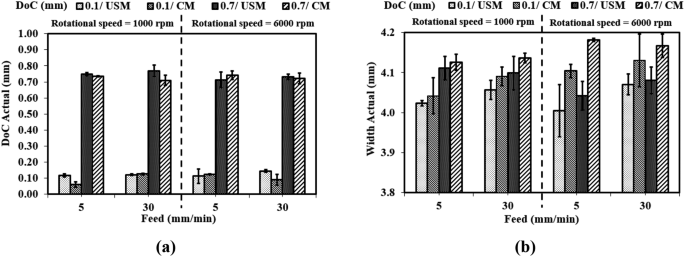
(a) Actual slot depth (DOC) and (b) Actual slot width in case of USM and CM
The slot bottom surface flatness error was obtained by conducting measurements at 11 points of the surface. This process was fully repeated three times for each slot. The average bottom surface flatness errors are plotted in Fig. 20. Generally, the flatness error in the case of USM is higher than CM.
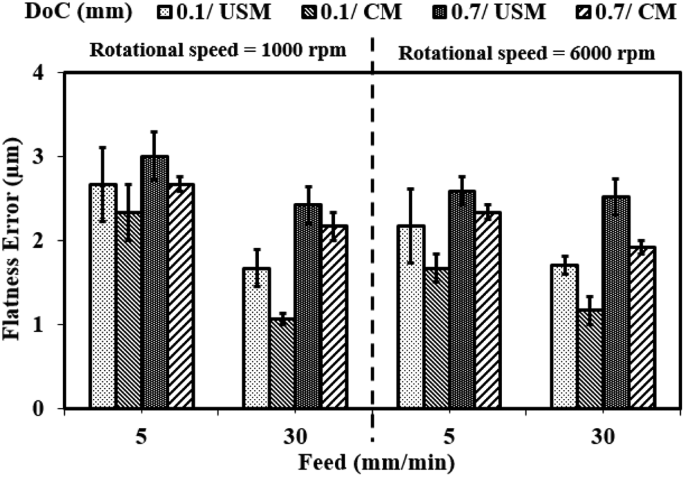
Slot flatness error in case of USM and CM
Conclusions
A comparison between CM and USM slotting performance of 7075 aluminum alloy has been made and an improvement in the product accuracy has been realised in USM. To achieve this, a vibratory device, including the piezoelectric transducer was designed, fabricated, and calibrated. Subsequently, a LabView code has been developed to control the input vibration parameters. Experimentally, full factorial design of the experiment was conducted, and statistical analysis was then implemented to study the output results. The following key findings were deduced from the experiments:
-
1.
The increase in the rotational speed leads to an increase in the cutting velocity, which causes a higher shear rate and heat generation. Thus, the shear strength of the material is reduced due to the thermal softening resulting from the generated heat in the shear zone.
-
2.
The feed force Fy significantly decreases in USM because the vibrations are applied in the feed direction due to the intermittent cutting mechanism.
-
3.
Broken chips were observed in USM compared to CM due to the effect of interrupted contact between the tool and the workpiece.
-
4.
Introducing the USM in the experiments reduces the contact time between the tool and the workpiece which produces better surface roughness.
-
5.
Applying the USM at a low cutting feed and a high rotational speed would produce a better fit slot depth.
-
6.
the vibration movement is working as a sharpener for the slot wall edges which reduces the burr hight and improves the slot width accuracy.
-
7.
The developed statistical model has been investigated experimentally, and it shows a good efficiency in predicting the process output response.
References
Dursun T, Soutis C (2014) Recent developments in advanced aircraft aluminium alloys. Mater Des (1980–2015) 56:862–871
Santos MC et al (2016) Machining of aluminum alloys: a review. Int J Adv Manuf Technol 86(9–12):3067–3080
Pham T-H et al (2020) Experimental study on the chip morphology, tool–chip contact length, workpiece vibration, and surface roughness during high-speed face milling of A6061 aluminum alloy. Proc Institution Mech Eng Part B: J Eng Manuf 234(3):610–620
Yaşar N, Boy M, Günay M (2017) The effect of drilling parameters for surface roughness in drilling of AA7075 alloy. In: MATEC Web of Conferences. EDP Sciences
Paktinat H, Amini S (2017) Ultrasonic assistance in drilling: FEM analysis and experimental approaches. Int J Adv Manuf Technol 92(5–8):2653–2665
Yassin M, Hossam M, El-Hofy H (2018) Applications and designs of vibration-assisted machining devices. Key Eng Mater 775:480–486
Bayat M, Amini S, Hadidi M (2021) Effect of ultrasonic-assisted turning on geometrical tolerances in Al 2024-T6. Mater Manuf Processes 36(16):1875–1886
Luo H, Wang Y, Zhang P (2020) Effect of cutting and vibration parameters on the cutting performance of 7075-T651 aluminum alloy by ultrasonic vibration. Int J Adv Manuf Technol 107(1):371–384
Ding H et al (2010) Experimental study on machinability improvement of hardened tool steel using two dimensional vibration-assisted micro-end-milling. Int J Mach Tools Manuf 50(12):1115–1118
Abootorabi Zarchi MM, Razfar MR, Abdullah A (2012) Investigation of the effect of cutting speed and vibration amplitude on cutting forces in ultrasonic-assisted milling. Proc Inst Mech Eng Part B J Eng Manuf 226(7):1185–1191
Zarchi MA, Razfar M, Abdullah A (2013) Influence of ultrasonic vibrations on side milling of AISI 420 stainless steel. Int J Adv Manuf Technol 66(1–4):83–89
Janghorbanian J, Razfar MR, Abootorabi MM, Zarchi (2013) Effect of cutting speed on tool life in ultrasonic-assisted milling process. Proc Inst Mech Eng Part B J Eng Manuf 227(8):1157–1164
Maroju NK, Vamsi KP, Xiaoliang J (2017) Investigations on feasibility of low-frequency vibration-assisted turning. Int J Adv Manuf Technol 91(9):3775–3788
Elhami S, Razfar M, Farahnakian M (2015) Analytical, numerical and experimental study of cutting force during thermally enhanced ultrasonic assisted milling of hardened AISI 4140. Int J Mech Sci 103:158–171
Ding H, Chen S, Cheng K (2010) Two-dimensional vibration-assisted micro end milling: cutting force modelling and machining process dynamics. Proc Institution Mech Eng Part B: J Eng Manuf 224(12):1775–1783
Ding H, Chen S-J, Cheng K (2011) Dynamic surface generation modeling of two-dimensional vibration-assisted micro-end-milling. Int J Adv Manuf Technol 53(9–12):1075–1079
Zheng L et al (2019) Modulation of surface wettability by vibration assisted milling. Precis Eng 55:179–188
Chen W et al (2019) Modelling and experimental investigation on textured surface generation in vibration-assisted micro-milling. J Mater Process Technol 266:339–350
Brehl D, Dow T (2008) Review of vibration-assisted machining. Precis Eng 32(3):153–172
Baraya MY, Hossam M (2020) Design of an electromechanical system for measuring and monitoring micro-ultrasonic amplitude of Langevin transducer. Int J Adv Manuf Technol: 1–13
Ventura C, Hassui A (2013) Modeling of cutting forces in helical milling by analysis of tool contact angle and respective depths of cut. Int J Adv Manuf Technol 68(9–12):2311–2319
Verma GC, Pandey PM (2019) Machining forces in ultrasonic-vibration assisted end milling. Ultrasonics 94:350–363
Alharbi W (2018) Development of a closed loop control system for vibratory milling. Liverpool John Moores University
Kundrák J et al (2018) Analysis of the effect of feed on chip size ratio and cutting forces in face milling for various cutting speeds. Manuf Technol 18(3):431–438
Wang S et al (2021) Experimental Research on Surface Roughness of Ultrasonic assisted grinding on 7075 aluminum Alloy. Materials Science Forum. Trans Tech Publ
Shen XH et al (2012) Ultrasonic vibration-assisted milling of aluminum alloy. Int J Adv Manuf Technol 63(1):41–49
Chen W et al (2018) Burr reduction mechanism in vibration-assisted micro milling. Manuf Lett 16:6–9
Yang Z et al (2020) Review of ultrasonic vibration-assisted machining in advanced materials. Int J Mach Tools Manuf 156:103594
Funding
Open access funding provided by The Science, Technology & Innovation Funding Authority (STDF) in cooperation with The Egyptian Knowledge Bank (EKB).
Author information
Authors and Affiliations
Corresponding author
Additional information
Publisher’s Note
Springer Nature remains neutral with regard to jurisdictional claims in published maps and institutional affiliations.
Rights and permissions
Open Access This article is licensed under a Creative Commons Attribution 4.0 International License, which permits use, sharing, adaptation, distribution and reproduction in any medium or format, as long as you give appropriate credit to the original author(s) and the source, provide a link to the Creative Commons licence, and indicate if changes were made. The images or other third party material in this article are included in the article’s Creative Commons licence, unless indicated otherwise in a credit line to the material. If material is not included in the article’s Creative Commons licence and your intended use is not permitted by statutory regulation or exceeds the permitted use, you will need to obtain permission directly from the copyright holder. To view a copy of this licence, visit http://creativecommons.org/licenses/by/4.0/.
About this article

Cite this article
Baraya, M., Yan, J. & Hossam, M. Improving and Predicting the Surface Roughness and the Machining Accuracy in Ultrasonic Vibration-Assisted Milling. J. Vib. Eng. Technol. (2024). https://doi.org/10.1007/s42417-024-01406-z
Received:
Revised:
Accepted:
Published:
DOI: https://doi.org/10.1007/s42417-024-01406-z