
Abstract
People use clothing to make personality inferences about others, and these inferences steer social behaviors. The current work makes four contributions to the measurement and prediction of clothing-based person perception: first, we integrate published research and open-ended responses to identify common psychological inferences made from clothes (Study 1). We find that people use clothes to make inferences about happiness, sexual interest, intelligence, trustworthiness, and confidence. Second, we examine consensus (i.e., interrater agreement) for clothing-based inferences (Study 2). We observe that characteristics of the inferring observer contribute more to the drawn inferences than the observed clothes, which entails low to medium levels of interrater agreement. Third, the current work examines whether a computer vision model can use image properties (i.e., pixels alone) to replicate human inferences (Study 3). While our best model outperforms a single human rater, its absolute performance falls short of reliability conventions in psychological research. Finally, we introduce a large database of clothing images with psychological labels and demonstrate its use for exploration and replication of psychological research. The database consists of 5000 images of (western) women’s clothing items with psychological inferences annotated by 25 participants per clothing item.
Introduction
People use an array of social information sources, such as physical appearance, language, and belongings, to form first impressions of others [30, 40, 88]. In response, people select and display symbols to influence which inferences are made about them [59, 60]. Clothing is one of the most common symbols used for this purpose [19, 39]. People use clothing to communicate their group memberships, jobs, and interests [4, 12, 28], as well as their emotional states [54], personality traits [6, 85]), and capabilities [3, 51]. Thus, clothing is seen as a primary tool of impression management by researchers and laypeople alike [34, 46], and psychological inferences based on clothing influence impression formation [58].
In the current work, we use computational social science methods to add to the understanding of how people make inferences based on women’s clothing items. First, we review the social scientific research on clothing-based impression formation. Then we investigate which psychological attributes people believe they can infer from women’s clothes (Study 1). Subsequently, we examine interpersonal consensus in clothing inferences (i.e., we assess interrater agreement), and determine how many human raters are needed for stable average inferences (Study 2). Lastly, we use the insights from our first two studies to build a labeled database of clothes for social scientific research, and to test whether a machine learning model can replicate (i.e., predict) human inferences from clothing (Study 3). We conclude by demonstrating the use of the database, and discussing the insights from all three studies. Importantly, note that these studies focus on how people make inferences from clothing, and are agnostic about whether these inferences are accurate (or inaccurate).
Psychological inferences from clothing
The role of clothing in impression formation is a popular topic in public discourse. Popular media devotes considerable attention to how clothing can help consumers make good impressions and ‘dress for success’ (e.g., [21]. People use clothes to attempt to convey a positive image of themselves, assuming that the way they dress affects the inferences that others will make about them [8]. In scholarly work, this theme has also received interdisciplinary attention, with much of this work rooted in evolutionary approaches to social signaling (e.g., [86]). For example, various non-human animals benefit in reproductive competition through displaying ornaments or costly behaviors [18, 72]. Humans also engage in similar forms of status signaling in their display of clothing. Nelissen and Meijers [59], for instance, observed that perceivers judge targets wearing luxury clothing brands as higher status, and also express favorable behaviors towards them across a range of social situations.
A complementary account of clothing selection, again rooted in evolutionary processes, identifies clothes as a culturally acquired indicator of group memberships. Group-specific clothing serves to strengthen group cohesion [20] and signals social resources and embeddedness to observers [70]. Clothes help to express such social identities (cf. [23]) and they are often explicitly brought in line with people’s personal identity, including self-ascribed personality, capabilities, and aesthetic preferences [12, 66].
In personality psychology, personality judgment from observable indicators, or cues (e.g., language, [69]) is often analyzed using Brunswik’s classic lens model [11]. The lens framework highlights that actual personality traits, as well as people’s judgments of personality traits, are based on the target person’s cue behaviors (e.g., wearing specific shoes, Gillath et al. 2012). However, the degree of association between the observable cue and the actual personality measurement (i.e., the cue validity) might differ from the association between cue and personality judgment (i.e., the cue utilization).
Clothing choices are often utilized as cues in person perception [46]. Similar to, for instance, music selection, wearing specific clothes may serve as a means to fulfill personal psychological needs, thereby allowing for valid associations between clothes and personality [68]. On the other hand, humans are widely known to see and rely on patterns to an unrealistic degree [13, 82] and are especially prone to this tendency in the context of person perception [73]. Accordingly, psychological work has shown repeatedly that inferences made from clothing can be unreliable (i.e., low cue validity) or even fully inaccurate [26, 55]. Clothes may be more likely to reflect the personality traits that targets hope to project, rather than the traits targets actually possess. This relatively poor accuracy is in line with research on psychological inferences from other indicators, such as facial and vocal features, where accuracy is, at best, extremely limited [57, 61, 62, 77, 81].
Despite their lack of validity, psychological inferences from clothes are very relevant in everyday life, as they steer people’s perception and subsequent behavior towards each other [40]. For example, red clothes are associated with perceived dominance (e.g., [86]) and skin revealing clothes are perceived as indicators of sexual interest [26]. However, past studies on the social psychology of clothing often relied on small, study-specific clothing samples to test general theories (e.g., three outfit options for teachers [22]; Taekwondo equipment [29]). In the current work, we address this limitation using a large database (5000 images labeled by 25 human raters each) to answer question about clothing-based inferences.
Uniting computational and social psychological approaches
Computational research on clothing to date has focused on accurate machine classification of clothing images [49], extraction of clothes from images [41], and building recommendation systems for customers [35]. While social subtleties of clothes are not considered very often yet, computational research does possess two advantages over psychological work in the field: typically large datasets and powerful analysis tools. In the current work, we utilize both these resources to answer our research questions about the nature of clothing-based inferences, the origins of their variance, and their predictability.
Uniting computational and psychological research in the field of clothing and impression formation was first proposed by Aghaei et al. [5]. In their position paper, they argued that clothing-focused research in computer science and machine learning has the methods to venture beyond superficial categorizations (e.g., into colors or cuts [49, 87]) towards processing the social signals within clothes. First steps into this direction were taken by Ma et al. [50], who demonstrated automatic extraction of semantic styles from clothing images (e.g., ‘classic’ vs. ‘modern’). Wei et al. [85] extended this line of work by extracting significant correlations between the ascribed personality traits of 300 celebrities (e.g., ‘friendly’) and their clothing styles (e.g., ‘light-colored’) from online images. Note that, like in the current work, the authors did not attempt to predict people’s actual personality traits from clothes, but rather investigated ascribed (here: inferred) characteristics. Personality inferences may be easier to predict from clothing than actual personality traits. The nature of inferences already implies that the clothes are (supposed to be) the source of the measurement variance, whereas there is no such connection between clothes and actual personality. Despite the conceptual difference between inferred and actual traits, both are extremely important in everyday interactions, as inferences steer people’s behavior towards each other [40]. Similarly, research on human faces began by testing potential connections between facial features and actual psychological characteristics, before realizing the lack of reliable relationships and transitioning to focus on inferred characteristics and the downstream consequences of such inferences [62, 81]. In the current work, we aim to use computational methods to advance research on clothing-based inferences in the same direction.
Overview of studies
As mentioned, there are four overarching goals of the present research. First, we investigate which psychological inferences are most commonly being made based on clothes (Study 1). Then we determine how much variance there is in clothing-based inferences and to which degree this variance emerges from differences in clothes versus differences in raters (Study 2). Subsequently, we utilize the insights from Study 1 and Study 2 to build a database for clothing-based research on psychological inferences. Lastly, we test whether a statistical model can be trained to replicate human-like inferences from images (Study 3).
In the current work, we focus on women’s clothes to minimize the vast diversity of existing clothes and psychological associations. This decision makes our studies much more economical, while maintaining a clearly defined target population for the database and prediction model. We concentrate on women’s clothes as they receive more attention by both researchers and laypeople [2, 6, 27, 65, 75].
Study 1: identifying common psychological inferences
The role of clothes in impression formation is an active research field across several disciplines in psychology. But what are the most prevalent traits that people infer from clothing items? In this first study, we aim to identify the traits that are commonly inferred according to both researchers and laypeople. Past literature reviews provide an overview of psychological attributes examined in clothing-focused research [19, 39, 46]. We used these reviews (and the reviewed publications) to generate a set of trait inferences made about the wearers and owners of specific clothes. This first set of traits consisted of inferences commonly examined by researchers. Additionally, we collected data on the trait inferences commonly made by participants/non-researchers. Together, these two sets informed us about which psychological inferences are considered important in research as well as in people’s daily life. In the following section, we describe how we acquired, condensed, and ultimately combined these two sets.
It is worth noting that we did not aim to build a comprehensive theoretical framework specifying all latent psychological dimensions of clothes. Such work would likely employ a factor analytic approach and condense a large set of numerical inferences into a smaller set of overarching theoretical dimensions (cf., [19]). Instead, our goal was to obtain a set of the most prevalent psychological inferences from (women’s) clothes according to social science researchers and laypeople. Note that these most common inferences might not coincide exactly with the sets of characteristics mentioned in general models of psychological traits (e.g., Big Five [90]) or states (e.g., basic emotions [64]). This is because specific contexts lead to different levels of prevalence for different psychological inferences (cf., dimensions in Big Five versus dimensions of face-based inferences [79]. Therefore, we conducted a dedicated entry study to identify the most prevalent inferences from clothing.
Given the large number of strategies to determine a most relevant subset, we used methods from Aaker [1], who developed a taxonomy for personality inferences about corporate brands, as a guideline. We modified this procedure to allow an integration of open-ended responses from participants and previous publications on clothing-based inferences. The overall procedure to identify the most prevalent inferences consisted of three steps: first, two sets of words describing psychological inferences from clothes were collected. These words (e.g., ‘smart’, ‘happy’) were provided by participants through online surveys and by researchers through past publications in the field. Second, the two lists of words were aggregated into two lists of topics (e.g., ‘happy’ and ‘joyful’ might be assigned to a ‘positive mood’ topic). Third, the topics that were commonly mentioned in, both online surveys and past publications were identified as the most relevant subset. This procedure allowed us to utilize basic textual data to answer our entry question: Which psychological inferences are commonly being made from clothes according to both researchers and laypeople?
Commonly investigated inferences in academic research
We identified 53 empirical research papers and 3 literature reviews that described psychological inferences that people make based on clothing. We concentrated our search on papers cited in or citing the 3 review papers and conducted an unstructured check for major oversights through Google Scholar. From these papers, we extracted 756 traits (394 unique words). While this is likely not a complete sample of research papers or trait inferences, it allowed us to find the most common clothing-based inferences. The top row in Table 1 shows the words that were mentioned most frequently in the scientific publications.
Common inferences among laypeople
We generated an additional set of common inferences (according to laypeople) by asking 201 participants on Prolific Academic (125 female, 74 male, 2 other; Mage = 33.5, SD = 10.8), which psychological attributes can be predicted from clothes. Each participant was asked to provide up to 10 open answers, resulting in a total of 1620 answers (460 unique answers). The bottom row in Table 1 shows the most common inferences mentioned by participants.
Identifying the most relevant subset
Our goal was to identify a subset of traits based on two criteria: first, the included traits should be mentioned by both researchers and participants. Second, the included traits should appear relatively often in both lists. The simplest approach to satisfy these criteria would be to sort the terms according to their frequency (as in Table 1) and look for terms with relatively high counts in both sets. However, this approach would not account for the presence of synonyms, meaning that important constructs might be overlooked (e.g., because some constructs may be described frequently using a multitude of different terms, resulting in relatively low counts). Similarly, academic language may differ from participants’ language, potentially leading to difficulties in matching latent overlap between the two groups of traits.
Given these challenges, we introduced two intermediate text processing steps to examine, spot, and compare mentioned concepts (benefits of such methods for research synthesis are described by Ref. [16]). First, we used a pretrained word2vec model (semantic space generated by Ref. [53]) to convert each mentioned word into a sequence of numerical coordinates. This numerical representation (often called embeddedness) of each word was constructed in the original training process of the word2vec model. More precisely, each word received scores on 300 variables computed from the word’s relative co-occurrence with other words (see word2vec script in supplementary materials). After this transformation of words to numerical coordinates, we used k-means clustering, to define word clusters or ‘topics’ (in the 300-dimensional space) and simultaneously assign cluster memberships to each word. We estimated 100 clusters (as a compromise between cluster uniqueness and differentiability), as we expected that the most important topics would be identifiable at this degree of complexity. Note that these steps were merely introduced to support our human selection of traits and the manual matching between research and participant content. While it would be possible to fully automate the process, we preferred human decision-making for the final matching between both lists.
Condensing the two word-frequency lists to two topic-frequency lists allowed us to better spot the targeted overlap between the researcher terms and laypeople terms. For each identified topic, we computed a simple count describing how often this topic was mentioned (through one of its indicator words) by researchers and participants, respectively. Then we examined the 20 most commonly mentioned topics in each of the two lists and manually searched for overlap. Table 2 shows the five overarching inferences which were mentioned relatively often by both researchers and participants. The final selection of common psychological inferences consisted of five traits: happiness, sexual interest, intelligence, trustworthiness, and confidence. This set of inferences strongly resembles inferences that people draw from faces [63], which fall into the overarching dimensions trustworthiness (also including attributes like happiness) and dominance (broadly related to attributes of strength and potency). Inferences of sexual interest seem to be more specific to clothing. More general models of person perception, for instance, the prominent distinction of warmth (here trustworthiness and happiness) and competence (here confidence and intelligence) in social cognition research [24] are also strongly reflected in the list of clothing-based inferences.
Study 2: sources of variance in trait inferences from clothing
As described in our review of previous literature, psychological inferences from clothes often turn out to be inaccurate. The question remains to which degree people agree in their inferences, meaning whether independent raters would form the same inferences from the same piece of clothing (regardless of their accuracy). Alternatively, the source of variance in inferences might lie within the specific rater (as opposed to the clothes) leading to reliable patterns for an individual rater, but inconsistent ratings for a single piece of clothing when collected by different raters. To answer the question whether inferences lie ‘in the eye of the beholder’ versus in the characteristics of the observed clothes, Study 2 quantifies the contribution of both sources of variance. Our approach is similar to research that quantifies the interrater reliability for face-based inferences, which vary considerably across individual raters (e.g., [32]).
Additionally, quantifications of interrater agreement allow us to estimate how many raters are needed to generate stable average inferences for clothes. Intuitively, low interrater agreement entails the need to collect many inferences per piece of clothing, whereas high agreement allows for a lower number of raters for a stable average. Knowledge about this critical quantity is necessary for constructing a useful database of clothing-based inferences in Study 3. Similarly, it is useful to know how much noise can be expected in the averaged inference scores when training a statistical model to re-predict these scores as also planned for Study 3 [42]. That is, if the reliability of the averaged scores is low, then the achievable prediction accuracy will inevitably be low as well.
Methods
In short, Study 2 answers two interrelated questions. The first is the question of the determinants of clothing-based inferences (i.e., do they lie in the clothes or the observer?), and the second is how many raters are needed to obtain reliable measures of clothing-based inferences. We answer the first question by collecting clothing-based inferences from independent raters, specify ‘raters’ and ‘pieces of clothing’ as higher-level variables in a multi-level model, and estimating the relative variance explained by these variables (cf., methodology of [32]). In other words, we ask to what extent the ratings of clothing items are based on the differences between clothing items versus differences between individual raters.
We answer the second question by iteratively including more raters per piece of clothing and judging at which point the confidence interval around a ‘true’ average inference (estimated based on a much larger sample of raters) becomes sufficiently small. This iteratively shrinking confidence interval has been labeled the corridor-of-confidence [33]. Naturally, a threshold for sufficiently narrow confidence intervals is somewhat subjective; therefore, we add a more intuitive, supporting metric: the correlation coefficient between average inferences and the ‘true’ average inferences. A higher correlation indicates that the average inferences of the subsample are closer in line with the true average inferences. Iteratively increasing the number of raters also increases this correlation coefficient to a point where social scientists would evaluate it as a reliable measurement (here we chose r = 0.8). Further details are given in “Results” section.
Rater sample
To quantify interrater reliability and a corridor of confidence for clothing-based inferences, we collected data from a labeling task with a sample of clothing items and a sample of raters. We collected responses from 400 raters (250 female, 146 male, 2 other, 2 missing; Mage = 35.4, SD = 12.6) using Prolific Academic.
Clothing sample
We obtained an initial sample of 5000 images of clothing items by scraping eight large shopping websites (The Gap, Topshop, Esprit, Primark, H&M, Zara, Prada, and Gucci). We chose websites representing the largest retailers from the USA and Europe from a diverse price range. Thus, our database represents the clothes commonly worn in Western countries at the time of data collection (autumn 2019). We further obtained images from Vestiaire Collective, a second-hand website, to account for psychologically unique signals from non-new clothes. We downloaded all available article images from the shopping websites using Python scripts primarily involving the selenium package for accessing web elements [56]. The supplementary materials include an annotated Python script showing how to download the images. We manually sorted out falsely included images not showing clothes. Table 3 depicts the distribution of the six most common clothing categories across the six most common colors.
We used a white background for each image (unless the piece of clothing was white itself, in which case we used a gray background to enhance visibility). We only included upper and lower body outerwear, which are commonly visible in social interactions (i.e., we excluded underwear, socks, and swimwear). Further, we excluded shoes and accessories such as scarfs, hats, and jewelry to minimize complexity in the dataset and the resulting strain on the prediction models. Out of the 5000 available photos, we used 200 randomly selected images in Study 2. We aimed to collect 80 ratings per image on all five traits as 80 ratings clearly go beyond the common amounts of raters per stimuli in psychological research [17, 45, 52]. While there was some random dropout, we obtained a relatively stable number of ratings per image (minimum = 79, median = 82, maximum = 86).
Procedure
Each participant was presented with a subset of 40 randomly selected images. For each image, participants were asked to indicate their inference of each of the five selected attributes on a 10-point scale ranging from 0 (not at all) to 10 (very much). Afterwards, participants were asked about their belief in clothing-based inferences and face-based inferences respectively (7-point scales with three items from [36]). An example item is “I can learn something about a person’s personality just from looking at his or her face (/clothes)”. The rating task was written in Python and administered using oTree [15].
Results
Generally, people believed slightly more in the validity of clothing-based inferences than in the validity of inferences from neutral faces (d = 0.34, Welch’s t(401) = 6.038, p < 0.001). Also, the belief in clothing-based inference correlated positively with belief in face-based inference (r = 0.35, p < 0.001).
Regarding the clothing ratings, there were bell-shaped distributions of participant inferences as depicted in Fig. 1. There were no strong floor or ceiling effects, but sometimes a slight dominance of the neutral scale midpoint (e.g., for perceptions of sexual interest), likely indicating that there were many low-signal clothing items.
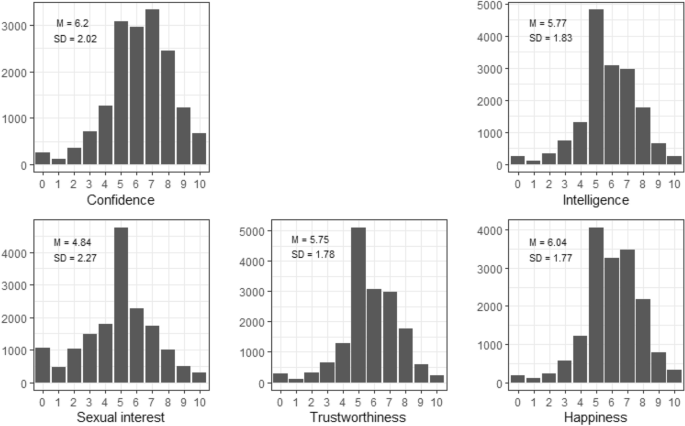
Distribution of participants’ psychological inferences from clothes
Regarding the level of interrater agreement, our results suggest that the level of agreement is comparable to the results of studies on agreement in face-based inferences [32]. In multilevel models predicting the clothing-based inferences, the variance explained by the respective piece of clothing ranged from 5.8% (trustworthiness) to 16.9% (sexual interest). The variance explained by individual rater tendencies was slightly higher, again mirroring research in face-based research (see Fig. 2). For example, Hehman et al. [32] estimated that face stimuli explain only about 5–10% of rating variance in perceived intelligence, whereas interrater differences accounted for 3–4 times more variance. Our results suggest that when people infer psychological attributes from clothes, interrater differences are more important than the actual characteristics of the clothes.

Variance in ratings accounted for by clothes and raters, respectively. The bars depict the variance explained within individual ratings (ICC2, 1). Variance explained by “other” factors includes error variance and the interaction between clothing and rater (not computable with our study design). The reliability of average ratings (estimating how much of the true variance between clothes can be captured by average ratings) is naturally higher with G(q, k) lying between 0.86 (happiness) and 0.94 (sexual interest; for more information on G as a measure of explained variance and alternative to ICC in rating tasks, see [67])
To probe how many raters are needed to generate reliable mean inferences, we examined each trait’s corridor of confidence. That is, we took a subsample of raters and plotted the deviation of their mean inference against the full-sample mean inference (i.e., based on all 80 raters) across a range of sample sizes (with larger subsamples of raters naturally leading to smaller deviations). These deviations can be regarded as residuals indicating how far off the subsample of raters was from the actual average score. As such residual sizes are not normalized and might thus be difficult to interpret, we also provide an alternative form of the corridor of confidence by plotting the correlation between sub-sample inferences and full-sample inferences across the same range of sub-sample sizes. The corridors of confidence for the most reliable trait (sexual interest) and least reliable trait (trustworthiness) are depicted in Fig. 3.

Corridors of confidence for residuals and bootstrap sample—full-sample correlation for bootstrapped rater samples of different sizes. Each plot is based on 60,000 bootstrap samples
As shown in all panels of Fig. 3, higher numbers of raters allowed for a better approximation of the average inferences obtained by the full sample of raters. With 25 raters (see the dotted lines), the mean’s deviation from the full-sample mean was usually less than 0.4 scale points on the 10-point scales (in our study, standard deviations were between 0.502 and 0.956). More intuitively, the average inference of 25 raters always correlated with over 0.8 with the inferences of the full rater sample. As mentioned above, most social scientist would consider this a reasonably reliable approximation. Therefore, in Study 3, we decided to recruit 25 raters per image.
Study 3: building a database and testing the predictability of clothing-based inferences
In our final study, we collected data for a fully labeled clothing image database. Additionally, we aimed to test whether it is possible to train a statistical model to replicate psychological inferences from images. We employed a convolutional neural network (for an introduction to these models, see [7]), a predominant approach in image-based machine learning that commonly outperforms other image-based prediction models, conditional on large sample sizes [14, 47, 48]. Accordingly, research on clothing recognition, classification, and synthesis has predominantly relied on Deep Convolutional Neural Networks (DNNs; [49, 84, 89]). Consequently, we also targeted this family of models to address the current problem. However, building a DNN from scratch requires a large quantity of training data, which is often out of the budget of research projects. In such a case, a common practice is to deploy a pre-trained model with pre-initialized coefficients and to fine-tune it for a new task (e.g., AlexNet [43], ResNet [31], VGG [74]). Employing this technique enables DNNs to adequately learn new tasks with less training data. Thus, we used a pretrained network (built for a general object recognition task) and fine-tuned it for the task at hand [80].
Methods
Below, we describe the full sample of clothes and raters used to generate the final dataset, as well as results from the model validation. The procedure for the collection of images and ratings was identical to Study 2.
Final image collection
As described in Study 2, we obtained 5000 images of women’s clothing items from online shops. To generate the fully labeled database, we recruited human raters to label the 4800 images that were not used in Study 2. The full database including the five commonly inferred traits from Study 1 can be accessed here: https://bit.ly/2V7X4p6.
Rater sample
We acquired ratings again from participants on Prolific Academic. Based on the results of Study 2, we aimed to obtain 25 ratings per image, with each rater evaluating a total of 40 images each. To label all 4800 images (200 were labeled for Study 2), we, therefore, aimed to collect responses from 4800 × 25/40 = 3000 participants. There are some minor deviations in the numbers of raters per image, as participants occasionally dropped out (primarily during a short server outage) and were automatically replaced by Prolific (minimum = 20 raters, 25th percentile = 24, median = 26, 75th percentile = 27, maximum = 28). The rater sample consisted of 3283 participants (1734 female, 1214 male, 20 other, 11 prefer not to say, 304 missing; Mage = 36.14, SD = 12.47).
Results
Belief in inference from clothing
Again, people believed slightly more in the validity of clothing-based inferences than in the validity of face-based inferences (d = 0.299, Welch’s t(2986) = 15.189, p < 0.001). Also, measure of belief in face-based and clothing-based inferences again correlated positively (r = 0.421, p < 0.001).
Exemplary insights from database
With the large number of clothes, it is possible to analyze correlational relationships between different clothing features (such as color) and personality inferences (see Fig. 4). For instance, we replicated the effect of clothing brightness on inferred happiness [9]. Gray clothes were seen as stronger indicators of happiness than black clothes, t(1580.7) = 6.416, p < 0.001, and white clothes were seen as happier than gray clothes, t(995.5) = − 2.239, p = 0.025) Of course, it is also possible to make new discoveries in the database. An example is that silver clothing was associated with more extreme scores on all five personality dimensions (all |t|s (≈34.5) > 4.736, all ps < 0.001).
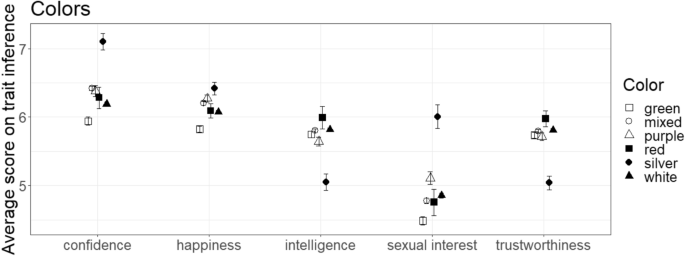
Trait inferences for all traits across six color categories
Similarly, it is possible to analyze relationships between trait inferences and different clothing cuts (see Fig. 5). For instance, we replicated the positive effect of exposed skin (here: length of skirt) on perceived sexual interest (t(275.83) = − 10.509, p < 0.001; [38]). We also observed new insights: for example, track pants were negatively associated with perceptions of intelligence and trustworthiness [t(117.74) = 10.197, p < 0.001; t(118.11) = 8.934, p < 0.001].
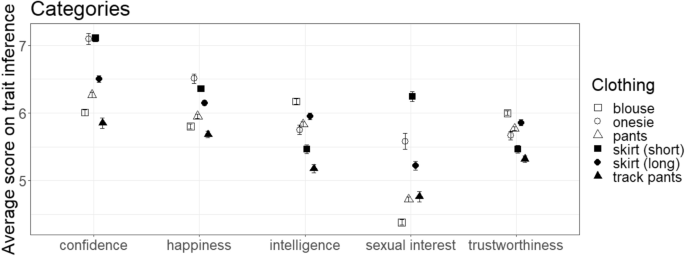
Trait inferences for all traits across six clothing categories
Model building and test accuracy
Lastly, we tested whether a statistical model can be trained to replicate human-like inferences from images of clothing. To build the prediction model, we used the keras module in Python to finetune ResNet50 (a popular object recognition network; [31]) for the current task. This convolutional neural network makes predictions based on raw pixel inputs, meaning no handcrafted features such as clothing categories or styles are used for prediction, though they may in fact be correlated with the specific features that are used in prediction. The capability of neural networks to generate their own predictive features by feeding raw data through consecutive transformation layers constitutes their main advantage over classical machine learning. The associated disadvantage is that deep networks are, similar to human vision, highly complex and their inner workings remain difficult to explain [71]. For each of the five traits, we report the out of sample prediction accuracy obtained during tenfold cross-validation. Prediction accuracies are listed in Table 4. The full training and tuning python script, as well as the final model can be obtained here: https://bit.ly/2V7X4p6.
The prediction model was able to replicate the inferences about as well as two human raters combined. While this is a good relative performance of the model (cf. medical diagnoses by a statistical model being as good as consulting two independent doctors), the absolute, practical performance of the model is medium for some traits and low for others. Note that the model performs worse for traits where the initial rater reliability is also low, suggesting that prediction is generally more difficult for these traits.
To give a better sense about the scale of our accuracy scores, one can refer to guidelines for evaluating test–retest reliabilities in psychological science, as test–retest reliabilities and our accuracy scores use the same scale. For sexual interest predictions (the trait with the highest level of model accuracy), the accuracy of the model is r = 0.503 (correlation between measured and predicted values). This is equally high as the often criticized test–retest reliability of Implicit Association Tests (correlation of measured and repeated values; [44], and clearly below conventional guidelines for good reliability, which lie at r = 0.7 or higher. Thus, future attempts at training models to reliably replicate average human inferences still have a way to go, despite initial models already performing better than a human rater.
General discussion
What psychological inferences do we make when looking at clothes? In the current work, we investigate which inferences are most commonly drawn from women’s clothing items; how strongly people overlap in their inferences; and whether statistical models can be trained to replicate human inferences from clothing. In Study 1, we found that people commonly use clothing items to make inferences about five overarching traits: happiness, intelligence, confidence, trustworthiness, and sexual interest. The first four of these attributes replicate work from face-based inferences as well as overarching dimensions in person perception [24, 63]. In contrast, the inference of sexual motivation seems to be more specific to clothing. In Study 2, we examined the consistency of trait ratings from clothing items across raters. The psychological inferences made from clothing are strongly affected by the characteristics of the observer, meaning that differences between the raters contribute more to inferences than differences between the actual clothing items. That is, much like inferences from faces, the inferred attributes often lie in the eye of the beholder. Nonetheless, there is sufficient agreement among raters to generate stable average inference scores with a minimum of 25 raters per piece of clothing. For inferences that vary more among people (e.g., the inferences of happiness and trustworthiness) the reliability of 25 averaged ratings is somewhat low.
In Study 3, we generated a database of 5000 images with inferred psychological attributes. We demonstrated that the materials from the database can be used to replicate and extend social scientific research on the psychology of clothing. Further, we tested whether deep convolutional neural networks (DNN) could be trained to re-predict human inferences for new clothing items. The achieved accuracies surpass the prediction of some other latent psychological phenomena (e.g., personality from language [76], romantic attraction from questionnaires [37], sexual orientation from faces [83]). One reason could be that the current prediction target (‘inference from picture X’) is more closely related to the used predictors (‘picture X’) compared to other prediction contexts (e.g., using facial features to predict sexual orientation). Another theoretical advantage is that the current work predicts inferences of psychological characteristics, whereas other work targets the challenging goal of predicting actual (i.e., self-reported) attributes, which differ from inferred attributes, both in conceptual terms and in their behavioral consequences.
On the other hand, the absolute accuracy of our prediction model falls behind non-psychological work in object recognition (e.g., [49]). The reason is likely that the task of such models (e.g., ‘predict whether this picture shows a human’) is less difficult than the goals here and in most psychological work, which are tied to more latent attributes of pictures. Models predicting variables measured with high reliability (e.g., clothing color) can achieve much higher accuracies than models where accuracy results are limited by noise in the target variable (e.g., personality scores [42]). In this regard, it is noteworthy that the current model delivers predictions that are usually better than labels provided by a human rater, that is, they are more consistent with the average inferences of a crowd of raters.
Interestingly, the reliability of human trait ratings and model accuracies varied across traits: Reliability and model performance were best for sexual interest and confidence, and worst for trustworthiness and happiness (with intelligence falling somewhere in between). Here, worse model performance is likely attributable to the lower levels of reliability in human perceptions of trustworthiness and happiness. But why is there less consistency in human ratings of these two traits in particular? Ratings of trustworthiness and happiness are likely seen as indicators of warmth, a fundamental dimension in person perception [24]. Warmth refers to an individual’s intentions towards others, and it is seen as closely related to morality. Perhaps people believe that these traits are harder to observe from superficial characteristics, such as clothing items. This example highlights that it is important for researchers to understand how people think about and perceive different traits, when trying to build models re-predicting people’s inferences.
Use and limitations of the database and model
The image database can be accessed and downloaded here: https://bit.ly/2V7X4p6. We hope that researchers in the social sciences use this resource to replicate analyses in published work and test new ideas about the effect of specific features (such as colors, cuts, and clothing type) and other predictors (e.g., ‘skin exposure’, ‘brand labels’) on trait inferences. It would also be interesting to examine the potential of such handcrafted features to improve the here presented prediction accuracies, which were achieved based on raw pixel values alone. Next to such analyses, researchers can relabel (part of) the data and test for changes over time, over rater samples, or the effect of certain conditions (e.g., effects of colorblindness, regional differences, fashion trends). Other interesting areas of research pertain to the interrelations of traits inferred from clothes in the tradition of the implicit personality theory [10]. In other words, it may be interesting to investigate whether the inference of one trait (e.g., intelligence) commonly entails the inference of a different trait (e.g., trustworthiness [78]).
Lastly, the database can be used as a missing puzzle piece within research on impression formation, primarily research on faces, bodies, and clothes. Disentangling the effect of these factors on first impressions through large studies with crossed stimuli (from existing databases) is in our opinion an important extension of the current research. While the database provides a large set of stimuli, we want to highlight that improved machine learning models could be even more useful given their ability to accurately label new images of clothes, thereby extending the research possibilities listed above. While the accuracies achieved here are promising, we want to highlight that the study is not sufficiently comprehensive for individual diagnosis. However, the models are still capable to enable research on larger sets of clothes in which the accuracy of individual predictions is less crucial. Further, researchers can use the provided models to save resources in labeling new clothes by replacing some raters with a prediction made by the model. Next to psychological work, we hope that the provided materials are adopted in work focused on machine learning techniques (e.g., fashion recommendation systems).
Conclusion
We found that the most prevalent psychological inferences from clothes lie on the dimensions of happiness, sexual interest, intelligence, trustworthiness, and confidence. When making psychological attributions to clothes, the observing rater has a stronger influence on the result than the actual clothes in question. Further, we generated a database of 5000 clothing images. Psychological inferences were provided by 25 raters per image. The materials enable a wide range of psychological, clothing-focused research. Lastly, we show that machine learning models can achieve better-than-human performance in replicating inferences from clothing images. The present research opens potential avenues for future interdisciplinary research in the areas of computer vision and social psychology.
Materials and software
Data and materials can be downloaded here: https://bit.ly/2V7X4p6. We used R scripts (version 3.6.1) for the data analysis and Python scripts (version 3.7.3) for building the prediction model. Both can be found in the materials linked above.
References
Aaker, J. L. (1997). Dimensions of brand personality. Journal of Marketing Research, 34(3), 347–356.
Abbey, A., Cozzarelli, C., McLaughlin, K., & Harnish, R. J. (1987). The effects of clothing and dyad sex composition on perceptions of sexual intent: Do women and men evaluate these cues differently. Journal of Applied Social Psychology, 17(2), 108–126.
Adam, H., & Galinsky, A. D. (2012). Enclothed cognition. Journal of Experimental Social Psychology, 48(4), 918–925.
Adomaitis, A., & Johnson, K. K. P. (2005). Casual versus formal uniforms: flight attendants' self-perceptions and perceived appraisals by others. Clothing and Textiles Research Journal, 23(2), 88–101.
Aghaei, M., Parezzan, F., Dimiccoli, M., Radeva, P., & Cristani, M. (2017). Clothing and people-A social signal processing perspective. In 2017 12th IEEE International Conference on Automatic Face & Gesture Recognition (FG 2017) (pp. 532–537).
Aiken, L. R, Jr. (1963). The relationships of dress to selected measures of personality in undergraduate women. The Journal of Social Psychology, 59(1), 119–128.
Albawi, S., Mohammed, T. A., & Al-Zawi, S. (2017). Understanding of a convolutional neural network. In 2017 International Conference on Engineering and Technology (ICET) (pp. 1–6).
Bardack, N. R., & McAndrew, F. T. (1985). The influence of physical attractiveness and manner of dress on success in a simulated personnel decision. The Journal of Social Psychology, 125(6), 777–778.
Boyatzis, C. J., & Varghese, R. (1994). Children's emotional associations with colors. The Journal of Genetic Psychology, 155(1), 77–85.
Bruner, J. S., & Tagiuri, R. (1954). The perception of people. In G. Lindzey (Ed.), Handbook of social psychology (Vol. 2, pp. 634–654). Cambridge: Addison Wesley.
Brunswik, E. (1956). Perception and the representative design of psychological experiments. Los Angeles, CAL: University of California Press.
Chan, C., Berger, J., & Van Boven, L. (2012). Identifiable but not identical: Combining social identity and uniqueness motives in choice. Journal of Consumer Research, 39(3), 561–573.
Chapman, L. J. (1967). Illusory correlation in observational report. Journal of Verbal Learning and Verbal Behavior, 6(1), 151–155.
Chatfield, K., Simonyan, K., Vedaldi, A., & Zisserman, A. (2014). Return of the devil in the details: Delving deep into convolutional nets. arXiv preprint arXiv:1405.3531
Chen, D. L., Schonger, M., & Wickens, C. (2016). oTree—An open-source platform for laboratory, online, and field experiments. Journal of Behavioral and Experimental Finance, 9, 88–97.
Christ, A., Penthin, M., & Kröner, S. (2019). Big data and digital aesthetic, arts, and cultural education: Hot spots of current quantitative research. Social Science Computer Review, 0894439319888455, 1–23.
Clifford, S., Iyengar, V., Cabeza, R., & Sinnott-Armstrong, W. (2015). Moral foundations vignettes: A standardized stimulus database of scenarios based on moral foundations theory. Behavior Research Methods, 47(4), 1178–1198.
Cronk, L. (2005). The application of animal signaling theory to human phenomena: some thoughts and clarifications. Social Science Information, 44(4), 603–620.
Damhorst, M. L. (1990). In search of a common thread: Classification of information communicated through dress. Clothing and Textiles Research Journal, 8(2), 1–12.
Daniel, K. (1996). Dimensions of uniform perceptions among service providers. Journal of Services Marketing, 10(2), 42–56.
Esquire, (2019). Esquire dress code: A man's guide to personal style. New York, NY: Hearst.
Dunbar, N. E., & Segrin, C. (2012). Clothing and teacher credibility: An application of expectancy violations theory. ISRN Education, 2012, 1–12.
Feinberg, R. A., Mataro, L., & Burroughs, W. J. (1992). Clothing and social identity. Clothing and Textiles Research Journal, 11(1), 18–23.
Fiske, S. T., Cuddy, A. J., & Glick, P. (2007). Universal dimensions of social cognition: Warmth and competence. Trends in Cognitive Sciences, 11, 77–83.
Gillath, O., Bahns, A. J., Ge, F., & Crandall, C. S. (2012). Shoes as a source of first impressions. Journal of Research in Personality, 46(4), 423–430.
Grammer, K., Renninger, L., & Fischer, B. (2004). Disco clothing, female sexual motivation, and relationship status: Is she dressed to impress? Journal of Sex Research, 41(1), 66–74.
Guéguen, N. (2012). Color and women attractiveness: when red clothed women are perceived to have more intense sexual intent. Journal of Social Psychology, 152(3), 261–265.
Guy, A., & Banim, M. (2000). Personal collections: Women's clothing use and identity. Journal of Gender Studies, 9(3), 313–327.
Hagemann, N., Strauss, B., & Leißing, J. (2008). When the referee sees red…. Psychological Science, 19(8), 769–771.
Hansen, K., Rakić, T., & Steffens, M. C. (2018). Foreign-looking native-accented people: More competent when first seen rather than heard. Social Psychological and Personality Science, 9(8), 1001–1009.
He, K., Zhang, X., Ren, S., & Sun, J. (2016). Deep residual learning for image recognition. In Proceedings of the IEEE conference on computer vision and pattern recognition (pp. 770–778).
Hehman, E., Sutherland, C. A., Flake, J. K., & Slepian, M. L. (2017). The unique contributions of perceiver and target characteristics in person perception. Journal of Personality and Social Psychology, 113(4), 513.
Hehman, E., Xie, S. Y., Ofosu, E. K., & Nespoli, G. (2018). Assessing the point at which averages are stable: A tool illustrated in the context of person perception. PsyArXiv. https://doi.org/10.31234/osf.io/2n6jq.
Howlett, N., Pine, K., Orakçıoğlu, I., & Fletcher, B. (2013). The influence of clothing on first impressions: Rapid and positive responses to minor changes in male attire. Journal of Fashion Marketing and Management: An International Journal, 17(1), 38–48.
Hwangbo, H., Kim, Y. S., & Cha, K. J. (2018). Recommendation system development for fashion retail e-commerce. Electronic Commerce Research and Applications, 28, 94–101.
Jaeger, B., Evans, A. M., Stel, M., & van Beest, I. (2019). Who judges a book by its cover? The prevalence, structure, and correlates of physiognomic beliefs. Manuscript in preparation. https://psyarxiv.com/8dq4x
Joel, S., Eastwick, P. W., & Finkel, E. J. (2017). Is romantic desire predictable? Machine learning applied to initial romantic attraction. Psychological Science, 28, 1478–1489.
Johnson, K. K., Ju, H. W., & Wu, J. (2016). Young adults’ inferences surrounding an alleged sexual assault: Alcohol consumption, gender, dress, and appearance schematicity. Clothing and Textiles Research Journal, 34(2), 127–142.
Johnson, K. K., Lennon, S. J., & Rudd, N. (2014). Dress, body and self: Research in the social psychology of dress. Fashion and Textiles, 1(1), 1–24.
Johnson, K. K., Yoo, J. J., Kim, M., & Lennon, S. J. (2008). Dress and human behavior: A review and critique of published research. Clothing and Textiles Research Journal, 26(3), 3–22.
Kalantidis, Y., Kennedy, L., & Li, L. J. (2013). Getting the look: Clothing recognition and segmentation for automatic product suggestions in everyday photos. In Proceedings of the 3rd ACM conference on International conference on multimedia retrieval (pp. 105–112).
Kosinski, M., Bachrach, Y., Kohli, P., Stillwell, D., & Graepel, T. (2014). Manifestations of user personality in website choice and behaviour on online social networks. Machine Learning, 95, 357–380.
Krizhevsky, A., Sutskever, I., & Hinton, G. E. (2012). Imagenet classification with deep convolutional neural networks. In Proceedings of the 25th International Conference on Neural Information Processing Systems (pp. 1097–1105).
Lane, K. A., Banaji, M. R., Nosek, B. A., & Greenwald, A. G. (2007). Understanding and using the Implicit Association Test: IV: What we know (so far) about the method. In B. Wittenbrink & N. Schwarz (Eds.), Implicit Measures of Attitudes (pp. 59–102). New York: Guilford Press.
Langner, O., Dotsch, R., Bijlstra, G., Wigboldus, D. H., Hawk, S. T., & Van Knippenberg, A. D. (2010). Presentation and validation of the Radboud Faces Database. Cognition and Emotion, 24(8), 1377–1388.
Lennon, S. J., Johnson, K. K., Noh, M., Zheng, Z., Chae, Y., & Kim, Y. (2014). In search of a common thread revisited: What content does fashion communicate? International Journal of Fashion Design, Technology and Education, 7(3), 170–178.
Li, Z., Sun, Y., Wang, F., & Liu, Q. (2015). Convolutional neural networks for clothes categories. In CCF Chinese Conference on Computer Vision (pp. 120–129). Springer, Berlin, Heidelberg.
Liu, T., Abd-Elrahman, A., Morton, J., & Wilhelm, V. L. (2018). Comparing fully convolutional networks, random forest, support vector machine, and patch-based deep convolutional neural networks for object-based wetland mapping using images from small unmanned aircraft system. GIScience and Remote Sensing, 55(2), 243–264.
Liu, Z., Luo, P., Qiu, S., Wang, X., & Tang, X. (2016). Deepfashion: Powering robust clothes recognition and retrieval with rich annotations. In Proceedings of the IEEE conference on computer vision and pattern recognition (pp. 1096–1104).
Ma, Y., Jia, J., Zhou, S., Fu, J., Liu, Y., & Tong, Z. (2017). Towards better understanding the clothing fashion styles: A multimodal deep learning approach. In Thirty-First AAAI Conference on Artificial Intelligence. San Francisco.
Maier, M. A., Elliot, A. J., Lee, B., Lichtenfeld, S., Barchfeld, P., & Pekrun, R. (2013). The influence of red on impression formation in a job application context. Motivation and Emotion, 37(3), 389–401.
Marchewka, A., Żurawski, Ł., Jednoróg, K., & Grabowska, A. (2014). The Nencki Affective Picture System (NAPS): Introduction to a novel, standardized, wide-range, high-quality, realistic picture database. Behavior Research Methods, 46(2), 596–610.
Mikolov, T., Chen, K., Corrado, G., & Dean, J. (2013). Efficient estimation of word representations in vector space. arXiv preprintarXiv:1301.3781
Moody, W., Kinderman, P., & Sinha, P. (2010). An exploratory study: Relationships between trying on clothing, mood, emotion, personality and clothing preference. Journal of Fashion Marketing and Management: An International Journal, 14(1), 161–179.
Moor, A. (2010). She dresses to attract, he perceives seduction: A gender gap in attribution of intent to women’s revealing style of dress and its relation to blaming the victims of sexual violence. Journal of International Women's Studies, 11(4), 115–127.
Muthukadan, B. (2018). Selenium with Python. https://selenium-python.readthedocs.io/
Nathanson, C., Paulhus, D. L., & Williams, K. M. (2006). Personality and misconduct correlates of body modification and other cultural deviance markers. Journal of Research in Personality, 40(5), 779–802.
Naumann, L. P., Vazire, S., Rentfrow, P. J., & Gosling, S. D. (2009). Personality judgments based on physical appearance. Personality and Social Psychology Bulletin, 35(12), 1661–1671.
Nelissen, R. M. A., & Meijers, M. H. C. (2011). Social benefits of luxury brands as costly signals of wealth and status. Evolution and Human Behavior, 32(5), 343–355.
Nezlek, J. B., Mochort, E., & Cypryańska, M. (2019). Self-presentational motives and public self-consciousness: Why do people dress a certain way? Journal of Personality, 87(3), 648–660.
Oleszkiewicz, A., Pisanski, K., Lachowicz-Tabaczek, K., & Sorokowska, A. (2017). Voice-based assessments of trustworthiness, competence, and warmth in blind and sighted adults. Psychonomic Bulletin & Review, 24(3), 856–862.
Olivola, C. Y., Funk, F., & Todorov, A. (2014). Social attributions from faces bias human choices. Trends in Cognitive Sciences, 18(11), 566–570.
Oosterhof, N. N., & Todorov, A. (2008). The functional basis of face evaluation. Proceedings of the National Academy of Sciences, 105(32), 11087–11092.
Ortony, A., & Turner, T. J. (1990). What's basic about basic emotions? Psychological Review, 97(3), 315.
Pentecost, R., & Andrews, L. (2010). Fashion retailing and the bottom line: The effects of generational cohorts, gender, fashion fanship, attitudes and impulse buying on fashion expenditure. Journal of Retailing and Consumer Services, 17(1), 43–52.
Piacentini, M., & Mailer, G. (2004). Symbolic consumption in teenagers' clothing choices. Journal of Consumer Behaviour: An International Research Review, 3(3), 251–262.
Putka, D. J., Le, H., McCloy, R. A., & Diaz, T. (2008). Ill-structured measurement designs in organizational research: Implications for estimating interrater reliability. Journal of Applied Psychology, 93(5), 959–981.
Qiu, L., Chen, J., Ramsay, J., & Lu, J. (2019). Personality predicts words in favorite songs. Journal of Research in Personality, 78, 25–35.
Qiu, L., Lin, H., Ramsay, J., & Yang, F. (2012). You are what you tweet: Personality expression and perception on Twitter. Journal of Research in Personality, 46(6), 710–718.
Sosis, R. (2004). The adaptive value of religious ritual: Rituals promote group cohesion by requiring members to engage in behavior that is too costly to fake. American scientist, 92(2), 166–172.
Samek, W., Montavon, G., Vedaldi, A., Hansen, L. K., & Müller, K. R. (2019). Explainable AI: interpreting, explaining and visualizing deep learning. Cham: Springer Nature.
Sanz, J. J., & García-Navas, V. (2011). Nest ornamentation in blue tits: is feather carrying ability a male status signal? Behavioral Ecology, 22(2), 240–247.
Sherman, J. W., Kruschke, J. K., Sherman, S. J., Percy, E. J., Petrocelli, J. V., & Conrey, F. R. (2009). Attentional processes in stereotype formation: A common model for category accentuation and illusory correlation. Journal of Personality and Social Psychology, 96(2), 305.
Simonyan, K., & Zisserman, A. (2014). Very deep convolutional networks for large-scale image recognition. arXiv preprint arXiv:1409.1556
Smith, J. K., Liss, M., Erchull, M. J., Kelly, C. M., Adragna, K., & Baines, K. (2018). The relationship between sexualized appearance and perceptions of women’s competence and electability. Sex Roles, 79(11–12), 671–682.
Schwartz, H. A., Eichstaedt, J. C., Kern, M. L., Dziurzynski, L., Ramones, S. M., Agrawal, M., et al. (2013). Personality, gender, and age in the language of social media: The open-vocabulary approach. PLoS ONE, 8(9), e73791.
Scherer, K. R. (1978). Personality inference from voice quality: The loud voice of extroversion. European Journal of Social Psychology, 8(4), 467–487.
Stolier, R. M., Hehman, E., Keller, M. D., Walker, M., & Freeman, J. B. (2018). The conceptual structure of face impressions. Proceedings of the National Academy of Sciences, 115(37), 9210–9215.
Sutherland, C. A. M., Oldmeadow, J. A., Santos, I. M., Towler, J., Michael Burt, D., & Young, A. W. (2013). Social inferences from faces: Ambient images generate a three-dimensional model. Cognition, 127(1), 105–118.
Tajbakhsh, N., Shin, J. Y., Gurudu, S. R., Hurst, R. T., Kendall, C. B., Gotway, M. B., et al. (2016). Convolutional neural networks for medical image analysis: Full training or fine tuning? IEEE Transactions on Medical Imaging, 35(5), 1299–1312.
Todorov, A., Olivola, C. Y., Dotsch, R., & Mende-Siedlecki, P. (2015). Social attributions from faces: Determinants, consequences, accuracy, and functional significance. Annual Review of Psychology, 66, 519–545.
Walker, A., Turpin, M. H., Stolz, J. A., Fugelsang, J., & Koehler, D. (2019). Finding meaning in the clouds: Illusory pattern perception predicts receptivity to pseudo-profound bullshit. Judgment and Decision Making, 14(2), 109–119.
Wang, Y., & Kosinski, M. (2018). Deep neural networks are more accurate than humans at detecting sexual orientation from facial images are. Journal of Personality and Social Psychology, 114, 246–257.
Wang, W., Xu, Y., Shen, J., & Zhu, S. C. (2018). Attentive fashion grammar network for fashion landmark detection and clothing category classification. In Proceedings of the IEEE Conference on Computer Vision and Pattern Recognition (pp. 4271–4280).
Wei, Z., Yan, Y., Huang, L., & Nie, J. (2017). Inferring intrinsic correlation between clothing style and wearers’ personality. Multimedia Tools and Applications, 76(19), 20273–20285.
Wiedemann, D., Burt, D. M., Hill, R. A., & Barton, R. A. (2015). Red clothing increases perceived dominance, aggression and anger. Biology Letters, 11(5), 20150166.
Xiao, H., Rasul, K., & Vollgraf, R. (2017). Fashion-mnist: a novel image dataset for benchmarking machine learning algorithms. arXiv preprint arXiv:1708.07747
Zebrowitz, L. A. (2017). First impressions from faces. Current Directions in Psychological Science, 26(3), 237–242.
Zhu, S., Urtasun, R., Fidler, S., Lin, D., & Change Loy, C. (2017). Be your own Prada: Fashion synthesis with structural coherence. In Proceedings of the IEEE International Conference on Computer Vision (pp. 1680–1688).
Zuckerman, M., Kuhlman, D. M., Joireman, J., Teta, P., & Kraft, M. (1993). A comparison of three structural models for personality: the big three, the big five, and the alternative five. Journal of Personality and Social Psychology, 65(4), 757–768.
Author information
Authors and Affiliations
Corresponding author
Ethics declarations
Conflict of interest
On behalf of all authors, the corresponding author states that there is no conflict of interest.
Additional information
Publisher's Note
Springer Nature remains neutral with regard to jurisdictional claims in published maps and institutional affiliations.
Rights and permissions
Open Access This article is licensed under a Creative Commons Attribution 4.0 International License, which permits use, sharing, adaptation, distribution and reproduction in any medium or format, as long as you give appropriate credit to the original author(s) and the source, provide a link to the Creative Commons licence, and indicate if changes were made. The images or other third party material in this article are included in the article's Creative Commons licence, unless indicated otherwise in a credit line to the material. If material is not included in the article's Creative Commons licence and your intended use is not permitted by statutory regulation or exceeds the permitted use, you will need to obtain permission directly from the copyright holder. To view a copy of this licence, visit http://creativecommons.org/licenses/by/4.0/.
About this article

Cite this article
Rosenbusch, H., Aghaei, M., Evans, A.M. et al. Psychological trait inferences from women’s clothing: human and machine prediction. J Comput Soc Sc 4, 479–501 (2021). https://doi.org/10.1007/s42001-020-00085-6
Received:
Accepted:
Published:
Issue Date:
DOI: https://doi.org/10.1007/s42001-020-00085-6