
Abstract
The light-duty vehicle (LDV) sector is undergoing many changes, including technological advancements (e.g., vehicle electrification, automation), new business models (e.g., ride-hailing), and government regulations and policies (e.g., fuel economy (FE) standards, zero-emission vehicle mandates, infrastructure investments, and incentives to encourage adoption of alternative fuel vehicles). Despite significant uncertainty, these developments, combined with demographic growth, will influence the future LDV fleet size and composition, and consequently the oil demand from LDVs. This paper provides a review of changes in the LDV sector and an assessment of their impact on oil demand. It takes into account the impact of LDV fleet growth, increasing penetration of electric vehicles (EVs) and alternative fuels (focus on biofuels), and improvements in internal combustion engine vehicles’ (ICEV) FE. Our analysis indicates that oil demand in 2040 could remain unchanged relative to 2016, but depending on the development of certain trends, demand could shrink or increase by ~6 million barrels per day (±25% relative to 2016). Our findings suggest that ICEV FE improvements could have a much greater impact on oil demand than the emergence of EVs. Moreover, preliminary research indicates that automation and shared mobility could reinforce the economic attractiveness of EVs, thereby increasing their penetration and impact on oil demand. Because of uncertainties in the development of these two trends by 2040 and difficulties in quantifying the complex interactions, we have not captured these effects in our model. Therefore, the range of uncertainty on the oil demand evolution could be even higher than our model indicates.
Introduction
The transportation sector forms the backbone of the overall global oil demand. In 2016, oil demand from the transportation sector was ~52 million barrels per day of oil equivalent (MBDOE), of which ~76% (40 MBDOE) was from road transportation [1]. Within the road transportation sector, light-duty vehicles (LDVs) were the largest consumers of oil, accounting for between 24 and 24.4 MBDOE [1, 2]. The global LDV fleet size was estimated to be around ~1 billion vehicles in 2016, and it is expected to grow by almost 85–100% by 2040 [1,2,3,4,5].
In this paper, LDVs are categorized into two segments. The first includes traditional fuel internal combustion engine vehicles (ICEVs) that use diesel or gasoline as fuel. ICEVs include hybrids which use an internal combustion engine and include a battery that can be recharged while driving (typically while the vehicle decelerates or is in braking mode). The battery is most often used to power the vehicle during low-speed driving conditions. Traditional fuel ICEVs accounted for ~95% of the LDV fleet in 2016 [6]. The remaining ICEV fleet included natural gas vehicles (NGVs), and ICEVs that can run on biofuels (flex-fuels). These segments accounted for ~5% of the total global fleet [6].
The second LDV segment comprises electric vehicles (EVs), which consist of battery electric vehicles (BEVs) and plug-in hybrid electric vehicles (PHEVs). PHEVs differ from regular hybrid vehicles by the fact that their batteries can be recharged via pre-installed electric plugs, allowing the batteries to recharge from a regular electrical supply source. EVs accounted for < 1% (3 million cars) of the global fleet in 2017 [1, 7].
The paper discusses the key trends and growth in the LDV sector that will influence the size and composition of the LDV fleet and consequently impact the demand for oil from the LDV sector. The paper identifies and discusses five key evolutions, their state of the art and future challenges, and uses them to model 2040 LDV oil demand scenarios.
The changing LDV sector: key trends and evolutions
The entire LDV sector is evolving, driven by the rapidly changing technologies, demographics, and global and domestic policies. The key trends paving the way for future evolutions in the LDV sector are:
Demographic trends, including the fast-growing middle-class in emerging markets (which will lead to an increase in the number of people able to own a vehicle), increased urbanization, and city expansion. The increasing densification of the population in megacities will result in significant traffic congestion.Footnote 1
Technological improvements, including improvements in EV battery capacity, cost and performance, and the rise of various technologies impacting vehicles (e.g., the development of lightweight materials for vehicles) and the transportation ecosystem (e.g., ubiquitous internet connectivity, artificial intelligence).
Government policies and regulations driven primarily by local air pollution and/or climate change concerns. These include increasingly strict environmental regulations related to the LDV sector, such as stringent fuel economy and greenhouse gas [GHG] emissions regulations, plans to ban diesel vehicles in major cities, and the possibility of banning the use of ICEVs altogether in some cities. Other initiatives include direct financial incentives to increase the attractiveness of “clean” vehicles, investments in EV charging stations, and geopolitical and industrial policies to encourage EVs.
Evolutions in the electricity generation sector, including rapid developments in renewables such as solar and wind. The latter have become progressively cheaper to install and operate and could contribute to a reduction in average electricity prices and electricity generation-related carbon emissions.
Consumer behavior, including indications in some regions of a decreasing attachment to cars as an owned asset, often in response to the cost of vehicle ownership or other available alternatives for mobility (e.g., public transportation and ride-hailing).
These trends contribute to five key evolutions in the LDV market landscape:
ICEV fuel economy improvements: Governments use standards and regulations to drive ICEV fuel economy improvements in order to reduce emissions and fuel consumption in the transportation sector. In response to these fuel economy standards and tighter emissions controls, manufacturers and other relevant stakeholders are encouraged to find new ways to improve vehicle efficiencies. In the medium term, experts expect that manufacturers will be able to achieve most fuel economy improvements through enhancements to engine technology and hybridization [8].
Penetration of alternative fuels: The use of alternative fuels such as biofuels (including mainly bioethanol and biodiesel) in transportation is growing, but they represent a small share of global fuel consumption. Advanced biofuels (made from cellulosic material, algae, and other substances) have disruptive potential, but remain many years away from adoption due to containment, technological, and cost considerations. Current expectations are that the main application for biofuels will be as a blend with fossil fuels for LDV engines. Fuel cell electric vehicles (FCEVs) currently represent a very small market, with only a few thousand vehicles on the roads concentrated in very few markets such as in the United States (California) and Japan [9, 10]. National FCEV targets in key markets (e.g., in the USA, Japan, and China) do not exceed a combined handful million vehicles by 2030, indicating that the outlook of FCEVs remains relatively weak over the next decade or two [10].
Vehicle electrification: EVs consist of BEVs and PHEVs. BEVs are propelled solely by an electric motor using chemical energy stored in rechargeable battery packs. PHEVs integrate a combustion engine, a battery, and an electric motor. Typically, their batteries can be recharged while driving or through an electrical supply. Two types of factors drive the speed of EV adoption: those that contribute to increasing the attractiveness of EVs and others that contribute to decreasing the attractiveness of ICEVs. Even though the current trend is supportive of EV uptake, many uncertainties remain concerning the achievability of most forecasted improvements (e.g., battery cost improvements, changing mineral prices, or the sustainability of current enablers such as government subsidies).
Vehicle automation: The wide range of autonomous driving capabilities can be broadly divided into driver assistance and high/full vehicle autonomy. Driver assistance refers to the automation of a small number of activities that a driver typically performs (e.g., automatic emergency brake and autonomous cruise control). High/full vehicle autonomy refers to the automation of a higher number of driving activities, or in some cases all driving activities. In the case of full automation, the vehicle can drive itself with little or no human interaction.
Growth of shared mobility: Shared mobility alternatives have become popular in recent years. As urbanization increases and the number of LDVs grows in many developing countries, shared mobility becomes more effective. These changes are attributable to the impact of technology, ease of access, economics, and policy measures on human behavior. As households do not typically use cars for long periods of the day, shared mobility can be an effective alternative.
These developments could disrupt the future energy landscape in the LDV segment, depending on their speed and scope. This paper addresses each of these five evolutions.
The five significant evolutions
Improvement in ICEV fuel economy
The three largest car markets—the United States (US), the European Union (EU), and China—have been using national fuel economy standards and GHG emission standards for LDVs (Fig. 1) to drive ongoing enhancements in fleet fuel economy and reduce the carbon emissions of new passenger cars and light trucks [11,12,13,14].

Fuel efficiency targets and forecast improvements
In the US, the 2016 unadjusted fleet fuel economy and GHG target for new passenger cars was 36.2 mpg (6.5 L per 100 km [L/100 km]) and 225 grams of carbon dioxide per mile (gCO2/mi) respectively. Pending consideration by the current administration, this was expected to increase by ~50% by 2025, to 55.2 mpg (4.3 L/100 km) and 147 gCO2/mi [8, 13, 14]. In light of these standards, CO2 emissions have decreased by 22%, and fleet fuel economy has increased by 5.4 mpg, or 28%, with an average annual improvement of about 0.5 mpg per year since model year (MY) 2004 vehicles [15].
In China, fuel economy standards are based on a weight classification system in which vehicles must conform to the standard for their class. The 2015 fuel consumption target was 6.9 L/100 km. This target has been tightened to ~5 L/100 km by 2020 [8, 13].
The EU has changed from a voluntary standard to a mandatory one, currently according to a weight-based-limit value curve. The 2015 CO2 emission target for new cars was 130 gCO2/km (corresponding to fuel consumption of around 5.6 L/100 km of petrol or 4.9 L/100 km of diesel) [8, 13]. The emission target for 2030 has been set at 59 gCO2/km [16].
There are significant ongoing efforts to improve the fuel economy of ICEVs. Leading automakers, sometimes supported by oil companies, are investing in new technologies such as gasoline compression ignition (GCI) that could result in a 24.6% reduction in energy consumption and a 22.8% reduction in GHG emissions [17]. Saudi Arabia’s national oil company, Saudi Aramco, claims that a GCI engine could be operational as soon as 2019. Auto-manufacturer Mazda has also announced that it will be releasing the first commercial GCI engine by 2019. This engine promises up to 20–30% higher engine efficiency compared to the current equivalent model and up to 45% more than Mazda’s 2008 petrol engine [18]. These technological breakthroughs are expected to accelerate the speed at which manufacturers will be able to achieve fuel economy standards and meet their emissions targets. Additional vehicle fuel economy improvements are also expected through improvements in vehicle aerodynamics, tire rolling resistance, more efficient lighting and air-conditioning systems, and reductions in vehicle body weight using composite materials [8, 11, 19,20,21]. Lukoil expects that cumulative fuel savings above 50% may be achievable in new ICEVs (equivalent to more than doubling the new ICEV fuel economy) through the combination of turbocharged engines, start-stop technology, weight reduction, hybridization, and other techniques [11]. In addition, Lukoil presents fuel economy forecasts that imply that the new ICEV fleet fuel economy will improve at ~2.2% annually from 2015 until 2030. Assuming the trend continues until 2040 and that over extended periods of time the ICEV stock fuel economy improves at the same rate as the new ICEV fleet fuel economy, the estimated ICEV stock fuel economy improvement over the 2016–2040 period comes out to be around ~65–70% [11].
The dramatic expected improvement in fuel economy of ICEVs could also increase their economic attractiveness compared to alternative powertrains. This could decrease the cost of ownership of an ICEV on a per-mile basis and delay the cost crossover point with alternative fuels.
Penetration of alternative fuels
In 2016, biofuels constituted ~3% of global transport fuel consumption, and they are projected to reach ~7% by 2040 [1, 22]. Ethanol accounts for roughly 94% of the alternative fuel market, with biodiesel constituting the remainder. The US and Brazil combined account for 80% of global production and consumption. Brazil is the only country with large-scale biofuel penetration [8]. In Brazil, ethanol forms ~70% of non-diesel transport fuel, and ~90% of new vehicles have flex fuel capabilities (compatible with biofuel) [1].
There are many conflicting views on the benefits and drawbacks of traditional, first-generation biofuels (Fig. 2). Constraints include competition with food crops for land, high water usage, limited processing capacity, low conversion efficiency, a limited amount of biomass being converted to fuel, low yield per hectare (mainly for biodiesel), low energy efficiency, and high production costs [1, 8].

Conflicting views on the benefits and drawbacks of traditional, first-generation biofuels
Advanced biofuels offer the benefits of having less environmental impact and not competing with food crops for resources [8]. However, their widespread adoption requires substantial technological and operational advances, and experts do not expect near-term disruptions from biofuels (Fig. 3) [1, 8, 23].

Signposts for the development of biofuels
The US is the largest producer and consumer of biofuels, with Brazil the second largest producer [1]. Growth in Brazilian biofuels has been driven by government policy and infrastructure investments that started in the 1980s. In other countries, widespread switching remains unlikely due to infrastructure, cost, and supply constraints. For example, while the US has increased its blending limit to 15%, the lack of fueling stations, the vehicle fleet composition, and the higher price of blended fuel in the US compared to gasoline prices have prevented widespread biofuel adoption [23]. China is also the world’s fourth largest producer and consumer of ethanol, although less than 20% of it is used in transport [1].
The widespread adoption of biofuels will require a broad political commitment, including the introduction of land reforms, better irrigation, advancement of biotechnologies, improved plant yields, more efficient use of fertilizers, and transport infrastructure improvements [8]. Globally, moderate blending mandate increases are anticipated until 2040 [24, 25].
This paper assumes three biofuel penetration scenarios for light-duty vehicles (range ~4–8% by 2040).
Scenario 1: 4% biofuel share of LDV energy demand. Cheap oil prices and minimal biofuel regulations:
Low oil prices diminish the economic incentive to switch to alternative fuel sources.
In the absence of subsidies for alternative fuels, the present fuel mix is mostly preserved. Without any increases in biofuel blending mandates, almost no switching occurs.
Scenario 2: 6% biofuel share of LDV energy demand. High oil prices and incremental biofuel regulations:
High oil prices encourage the uptake of more energy-efficient vehicles and make alternative fuels more cost competitive.
Government subsidies and support for biofuels lead to some fuel switching.
Scenario 3: 8% biofuel share of LDV energy demand. Favorable renewables economics and strong biofuel regulations:
Strong biofuel blending mandates and subsidies paired with technological breakthroughs leads to improved efficiencies and significant fuel switching.
Adoption of electric vehicles
New registrations of EVs increased by ~54% in 2017, with over 1 million sales globally (of which ~67% were BEVs and ~33% PHEVs) [7, 26]. Norway has achieved the most significant penetration of EVs with a 39% sales share of EVs. In 2017, China sold half of all EVs globally (~ 580,000 EV sales) [7]. The global EV stock exceeded 3 million vehicles in 2017, having crossed 2 million EVs in 2016 [7, 27]. Although these numbers represent less than 1% of the current car fleet, sales have been rapidly increasing.
Two types of factors are driving the adoption of EVs: some that contribute to increasing the attractiveness of EVs and others that contribute to decreasing the attractiveness of ICEVs [7, 28]. Factors that contribute to increasing the attractiveness of EVs include technological advancements that make EVs more economical and user-friendly, financial incentives that reduce the costs of EVs, preferential treatment for EV owners, private and public investments in the charging infrastructure, and an increased diversity of EV models offered by auto manufacturers. Factors that contribute to decreasing the attractiveness of ICEVs include government plans to restrict or ban ICEVs from some large cities, pollution taxes, and increasingly stringent fleet fuel economy targets.
In particular, fuel economy standards are playing an increasingly important role in pushing electrification of the car fleet. The US, EU, and China have set challenging fuel economy targets for automakers to meet. Although most of the current targets can be reached via improvements in the fuel economy of ICEVs, the standards are designed in such a way that they incentivize manufacturers to achieve the targets via some percentage of electrification in their fleet. In fact, most standards are designed in a way that magnifies the gain in fuel performance of EVs by giving the manufacturers credit multipliers for selling them [29]. These credit multipliers make EVs attractive for manufacturers as it allows them to reach their fleet fuel economy targets more easily. For example, the US standards provide a 2.0 and 1.6 credit multiplier, respectively, for BEVs and PHEVs sold between 2017 and 2019 [30]. These will be reduced to 1.5 and 1.3, respectively, by 2021 [30]. The EU will assign credit gain multipliers of 2.0 in 2020 for vehicles with less than 50 gCO2/km of emissions [31]. Major automakers have already been responding to these targets by announcing significant EV-related investments and sales targets (Fig. 4) [7, 27]. However, the pace at which the original equipment manufacturers (OEMs) will expand supply will depend upon consumer acceptance of EVs.

Recent announcements from major auto manufacturers
Even though the current trend in most of the factors mentioned above is supportive for EV uptake, many uncertainties remain around the achievability of most of the forecast improvements. These include uncertainties surrounding battery cost improvements, given the increased pricing of some of its raw materials, or the sustainability of current enablers such as government subsidies. The following sub-sections provide a comprehensive analysis of the major factors that will influence the speed of EV uptake, focusing on the key forecasts from third-party studies and highlighting the critical uncertainties around the achievability of these predictions.
Opportunities and challenges for EV adoption
This section reviews the global discussions around the adoption of EVs to present a thorough perspective on this important evolution in the LDV market.
Battery costs and technology: Batteries are an essential cost component for EVs. Currently, the cost of a lithium-ion (Li-ion) battery pack (EVs predominantly use Li-ion batteries) typically accounts for more than a third of the total cost of the car [32]. Raw materials form the bulk of the battery pack cost (~ 60%) [33]. The battery pack consists of multiple cells, and various raw materials are used to manufacture the battery cell components: anode, cathode, electrolyte, and separator.
The average cost of Li-ion battery packs used in EVs fell by more than 70% from 2009 to 2016, from ~$930 per kilowatt-hour (kWh) to ~$270/kWh [13, 27]. These cost reductions have been mostly due to economies of scale, improvements in technology and manufacturing processes, and government subsidies [7, 27, 34]. Li-ion manufacturing capacity oversupply has also reinforced battery price reductions as manufacturers have cut prices to maximize plant utilization [34]. Despite increasing demand for EV batteries, further cost decreases are forecast due to continued technological improvements and significant investments in new capacity. Overall, third-party studies estimate that the cost of Li-Ion batteries could decrease to ~$100–150/kWh by 2025 and could fall below $70/kWh in the subsequent decade [28, 34].
If these claimed reductions in battery costs can be sustained, private EVs could eventually cost the same as comparable ICEVs over the lifetime of the vehicle, even without any purchase subsidy. This could occur sometime between ~2022 and ~2030, depending on the type of vehicle, the battery size, the speed of decrease in the battery cost, and the improvements in the fuel economy of ICEVs [34]. The decrease in upfront costs, and the annual savings from lower energy costs (gasoline/electricity) and lower maintenance costs, could make the total cost of EV ownership lower than that of an ICEV over the lifetime of the vehicle.
Despite the positive outlook for EV battery cost reductions, there are critical risks or uncertainties that could hinder the accuracy of the predictions mentioned above:
An increase in the price of raw materials for essential battery components: The price of some necessary raw materials for batteries has recently experienced significant volatility. Cobalt prices, for example, increased by ~90% in 2017 from ~$40,000 per tonne in February 2017 to ~$75,000 per tonne by the end of 2017 and $80,000 per tonne by January 2018 [35,36,37]. While some analysts predicted a continued surge in cobalt prices, driven by a combination of increasing demand for Li-ion cathodes and limitations in refining capacity due to environmental restrictions [34, 35], prices have recently receded to as low as ~$45,000 per tonne in early January 2019 [36, 37]. The consultancy firm Wood Mackenzie predicted an oversupply of cobalt until 2022, which would exert downward pressure on price [38]. Furthermore, based on a workshop conducted by the Oxford Institute for Energy Studies, it is anticipated that the supply chain of battery raw materials would scale in response to sudden increases in demand albeit with possible period of volatility, and that no significant risks exist in the medium term (5 years) [39]. It remains to be seen how the relationship between demand/supply dynamics and prices of critical battery components will evolve over the longer term and what impact potential price increases (if any) would have on uptake of EVs in the event that no alternative battery technologies are developed.
Raw materials supply-chain risks: A large part of the reserves for essential metals used in batteries is located in countries that suffer from some level of geopolitical instability or low development. For example, ~50% of the known reserves and current global supply of cobalt comes from the Democratic Republic of the Congo [40], often mined using outdated techniques and linked to child labor controversies [41].
Battery disposal: Fewer than 5% of lithium-ion batteries are currently recycled, leading to several challenges [42]. First, non-recycled batteries have an environmental cost because they can release toxic gases if damaged [43]. Second, their core ingredients such as lithium and cobalt are finite, and their extraction can lead to water pollution, depletion, and other environmental consequences. Reclaiming the lithium from the by-product requires many additional processes and comes at a high cost [44]. Furthermore, Li-ion batteries in electric cars currently use a variety of chemical processes, making it difficult and very costly to develop standardized recycling processes [45, 46].
Given these challenges, in June 2017 the investment bank Morgan Stanley forecast that there is a major risk of insufficient recycling infrastructure by the time the current stock of batteries are retired. Industry players seem to favor giving a second life to batteries instead of recycling them. This perspective is evidenced by important investments from Tesla, Acceleron (a hi-tech British start-up), Nissan, and others [45, 47, 48]. There are also partnerships to develop battery reuse technologies, processing plants, and alternative uses for recycled batteries such as reuse for home energy storage.
Electric vehicles performance and charging infrastructure: EV battery performance (driving range on a single charge, charging speed) and the geographical availability of charging stations are essential drivers of EV adoption. Significant advances have been achieved on both fronts recently.
Currently, the most prominent battery technology for automotive uses is lithium–nickel–manganese–cobalt. Recent improvements in battery technology, such as higher energy density, and chemistry improvements allowing faster and more efficient energy transfer, have enabled EVs to charge faster and drive longer on a single charge [27, 49, 50].
Charging technology has also become more efficient. For example, the Tesla supercharger can charge ~170 miles of range in as little as 30 min [51]. Furthermore, increased investments in charging infrastructure by governments and private sector companies (Fig. 5) in large EV markets have contributed to greater EV convenience by lowering “range anxiety.” For example, by 2017 Tesla had already installed 1332 superchargers globally and 10,900 destination chargers at locations such as hotels and restaurants [52]. These investments are easing the ability of Tesla owners to plan long trips with their EVs.

Government investment in charging infrastructure
Pushing these advances further remains challenging due to many tradeoffs between safety, lifespan, performance, storage capacity, and battery charging time [49]. Overall, EV driving ranges remain lower than those of ICEVs and slower to charge relative to refilling a fuel tank. Even though the driving range of most EVs is above the average daily driving pattern of most consumers, the fact that long trips will be interrupted by having to charge the car’s battery makes EVs less appealing to many consumers. A gap between driving expectations and needs, and the limited availability of charging stations compared to gas stations, creates so-called range anxiety. Regardless of charging station availability, slow charging time compared to refueling time adds to the inconvenience of EVs.
Finally, Li-ion battery technologies are expected to remain dominant until at least 2025. This indicates that the prospects for substantial improvements in battery technology that could favor EVs and sharply increase their uptake are unlikely in the short to medium term. Lithium–sulfur, zinc–air, lithium–air, and solid-state technologies present some advantages compared to Li-ion technologies (Table 1). However, these technologies still face technological and commercial roadblocks, and experts do not expect them to be ready for automotive applications before 2025/2030 [49, 53].
Government incentives for EVs: In most countries that have experienced high EV sales, governments have provided substantial incentives to promote them. These include financial incentives to consumers, such as direct subsidies for purchasing EVs, purchase tax exemptions, lower circulation tax, “feebate” systems, and exemptions from bridge/road tolls (Table 2). Some governments have complemented these financial incentives with an offer of preferential treatment for EVs, such as allowing them to access dedicated parking spots, use bus lanes or carpool lanes even with a single driver [27]. Consumer financial subsidies in some countries have made EVs cheaper than ICEVs [54]. For example, in Norway and the Netherlands, subsidized PHEVs are on average respectively ~20% and ~35% cheaper than their ICEV counterparts. In Norway, BEVs are on average ~15% cheaper than their ICEV counterparts [54].
Some countries are scaling back direct EV incentives, or even phasing them out, due to their increasingly burdensome cost as EV sales increase [55, 56]. This reduction of subsidies is a risk for EV uptake as EV sales remain highly dependent on them. Recent experiences in Denmark and the US show that cutting off direct EV subsidies before price parity with ICEVs has been reached could hinder the uptake of EVs. In Denmark for example, EVs were exempted from the 180% import tax (reduced to 150% in 2016) imposed on ICEVs, making the country a pocket of high EV penetration in the past few years. However, EV sales experienced a 60% quarterly fall after the government announced the phase-out of the EV tax break. Since then, the Danish government has reacted to this sharp fall in EV sales by amending EV regulation to accommodate a more gradual elimination of the incentive plan [57,58,59]. The state of Georgia was the second largest US market for EV sales after California. EV sales in Georgia fell ~85% on a quarterly basis after the state government announced the end of a $5000 tax credit to people who bought or leased an EV [60,61,62,63]. The combination of the federal tax refund on EVs and the state incentive had made EVs highly attractive compared to similar ICEVs.
In conjunction with scaling back subsidies, some countries are implementing a regulatory shift from direct EV subsidies to indirect emissions-based restrictions. The US, EU, and China are setting increasingly stringent CO2 emission targets and penalties on OEM excess emissions, and strict average fleet fuel economy targets for new LDVs. Some countries have also announced plans to ban diesel vehicles from major cities by 2025 [1, 27, 64].
Although governments in major EV markets have primarily focused their policies on direct incentives to consumers, they have also targeted other parts of the EV value chain including research and development (R&D), manufacturing (battery and car production), and EV-related services (e.g., insurance, retail services, and mechanics) [65].
Research support, in particular, has been a key enabler of lower battery costs and improvements in EV performance. This type of support has been especially effective when coupled with other instruments that accelerate the scale-up of production, such as providing support and tax incentives for battery and electric car manufacturers [65]. Germany, for example, is one of the countries with a strong focus on R&D in EV policy. The government has given 100 million euros to the Federal Ministry of Education and Research to develop information and communication technologies under the ICT 2020 funding program. This program includes research on EV energy management. In Sweden, over one-third of EV policy instruments focus on stimulating R&D. The Swedish Energy Agency has invested 260 million Swedish krona (SEK) to finance research into environmentally friendly vehicles. In France, Renault has teamed up with the French Alternative Energies and Atomic Energy Commission to work on EVs, new energies, and cleaner combustion engines. California’s EV support policies also have an upstream focus on R&D.
Government policies that provide financial support have been the backbone of the early market entry phase of EVs. However, financial subsidies and policy support could quickly become unsustainable given the forecast for growth in EV sales. This growth will require new, more sustainable mechanisms and incentive schemes, such as funding from government revenues that come from the EV value chain, rather than from government policies that use direct incentives to increase sales. National resources and public support are already overstretched, and there is societal pressure to downsize financial stimuli. As the number of EVs grows, governments may wish to look for other tools to stimulate the EV market [27]. In addition to the difficulty of sustaining financial stimulus for ever greater numbers of EVs, other types of preferential treatment, such as free access to carpool lanes and free parking, could also prove difficult to sustain. Indeed, these incentives will inevitably become less valuable to vehicle owners as EVs become more mainstream.
The EV credit is considered by some government agencies to be an inefficient method of reducing carbon emissions. For example, the US Congressional Budget Office has estimated that the EV credit system costs the federal government anywhere between $230 and $4400 for every net tonne of CO2 that the subsidy reduces, depending on the state [66]. The cost per tonne is higher in states that rely heavily on coal-based electricity generation, such as North Dakota. This cost largely exceeds the government’s forecast of the social cost per tonne of carbon emissions in 2020, which ranges from $12 to $123. The government estimates that in 2050, the social cost of a tonne of carbon emissions in the worst-case scenario would be $212 [56]. Even this figure is lower than the lower end of the current cost of EV incentives per tonne of reduced carbon emissions ($230 per tonne of reduced emissions). Recent research has found that EV adoption incentives in the US cost around $5.47 per gallon of gasoline saved, assuming a vehicle lifetime of 16 years. This suggests that the cost-effectiveness of current demand-side measures to support EV adoption has scope for improvement [67].
In areas where EVs do reduce environmental impact, subsidies only help if they lead to more EV sales than if there were no subsidies. If EVs would have been sold regardless of subsidies, those subsidies would merely be a direct wealth transfer [56, 66]. In such a case, the primary beneficiaries of the subsidies would be high-income groups. In the US, empirical findings have shown that between 2011 and 2013 only ~40% of EV purchases could be attributed to subsidies [68].
Significant uncertainties remain concerning the future global penetration of EVs, which will depend on how the main factors of EV uptake evolve, including government regulations and policies. Various third-party EV penetration forecasts/scenarios considered in our assessment, including studies from OPEC, the International Energy Agency (IEA), Bloomberg, Goldman Sachs, and Exxon Mobil, show or imply a 2040 stock penetration range for EVs of between ~7 and ~33% [1, 69,70,71,72]. It should be noted that some of those sources, such as the IEA, have modeled more aggressive scenarios to complement their more moderate scenarios or predictions. For example, while the IEA “New Policies” scenario considers an EV fleet size that implies a ~15% EV penetration by 2040, a more aggressive “Future is Electric” scenario by IEA considers that EVs would represent almost half the total fleet in 2040 [26].
In our forecast for oil demand from the LDV sector, we considered three scenarios for EV penetration in 2040, based on the ranges identified in third-party research: a low-case penetration scenario (7% EV stock penetration by 2040), a mid-case penetration scenario (18% EV stock penetration), and a high-case penetration scenario (30% EV stock penetration).
Autonomous vehicles (AVs)
There is a growing consensus among experts that the disruptive change in transportation consists of three main components, which many researchers associate with each other: vehicle electrification, automation, and shared mobility [73]. This section of the paper focuses on autonomous vehicles (AVs) while the next section focuses on shared mobility.
It should be noted that although AVs are often associated with EVs, they are not captive to the EV market. Traditional ICEVs can incorporate autonomous driving technology. Ford, for example, has been experimenting with autonomous ICEVs for some time, arguing that they will offer longer ranges and less charging, increasing their economic attractiveness compared to EVs [74,75,76].
The wide range of autonomous driving levels can be categorized into two broad segments: driver assistance and high/full vehicle autonomy [74, 77]. Driver assistance refers to the automation of a small number of activities that a driver typically performs, such as automatic emergency brake and autonomous cruise control. High/full vehicle autonomy refers to the automation of a higher number of driving activities. In the case of full automation, the vehicle can drive by itself with little or no human interaction. Industry experts often refer to five levels of autonomous driving levels (Fig. 6). Level 1 refers to simple “driver assistance” techniques (e.g., cruise control) and Level 5 refers to “full autonomy” (i.e., a vehicle that does not require a human driver, a steering wheel, or pedals). In this section, we will refer to AVs as vehicles with a very high level of automation (Level 4 or Level 5).

Levels of autonomy, adoption paths, and challenges of AVs
Key technology and regulatory milestones have shaped the autonomous driving landscape. One of the earliest and most prominent examples of the popularization of autonomous driving features is the introduction of electronic cruise control in the US during the 1960s and 1970s, enabled by technological innovation.
More recently, technological developments in the automotive industry have accelerated, and strategic partnerships have formed between automotive and technology companies (Fig. 7). Tesla's and Google’s early breakthroughs in vehicle autonomy have attracted significant interest from a variety of players [78]. Traditional vehicle OEMs have accelerated their investments in the area. For example, Ford and General Motors (GM) both announced significant investments in AVs [79, 80]. Additionally, some ride-hailing companies have established partnerships with traditional automotive firms. Uber and Daimler recently formed a partnership allowing Daimler to operate self-driving cars on Uber’s network. Uber has also announced plans to purchase over 24,000 autonomous Volvo sports utility vehicles (SUVs) to accelerate its move to a fleet-ownership business model [81, 82]. Even non-mobility related companies are entering the field. For example, Domino’s Pizza and Ford have collaborated to test consumer responses to autonomous vehicles delivering food orders [83].

a, b Developments in the AV marketplace
AVs can offer compelling benefits for users, including making travel more convenient and enjoyable by freeing up time during daily commutes or longer trips. AVs might also reduce the cost of parking and time spent looking for available parking spots if the vehicle could drive itself to open or cheaper parking locations. AVs could also use machine-learned driving behaviors such as speed and route optimization to improve the safety of travel and reduce fuel consumption.
Furthermore, industry experts predict that AVs have the potential to fundamentally change consumers’ traveling habits, inciting them to trade their privately owned vehicle for on-demand “robo-taxis” [84]. In fact, vehicle ownership could decline by as much as 43% in the US if AVs are widely adopted [85, 86]. This will mainly be because it will be more cost-effective to use a shared fleet AV instead of owning a vehicle. Some analysts anticipate that, in the coming decades, fleets of company owned AVs could constitute the majority of cars on the roads of developed countries [84].
Challenges to AV adoption
Significant challenges need to be overcome before AVs can become widely adopted. These challenges include the following:
Government regulation: Governments and regulators will play a critical role in enabling AV adoption through such measures as regulating the AV testing and approval processes, establishing new liability policies, developing the enabling infrastructure such as traffic signal communications, and regulating vehicle-to-vehicle and vehicle-to-infrastructure communications (Fig. 8).
Fig. 8 
Key technology elements required for AVs
Safety, security, liability, and insurance concerns: The prospect of AVs inevitably raises safety and security concerns, which could hinder the widespread acceptance of the technology. Safety concerns refer mostly to system reliability and the ability to respond to adverse real-life traffic circumstances. Achieving acceptable safety standards will require further technological development, and testing under real-life conditions. Auto insurance companies will need to adjust their business models in light of these developments, as some or all of the liability will transfer progressively from the driver to the car itself.
Consumer acceptance: Public opinion about AVs currently indicates significant concerns over security and the reliability of software-based systems [85]. Even if those risks were addressed from a technical perspective, it could take a while before consumers trust in the safety of AVs. For example, consumer familiarization with intermediate levels of automation such as L3 (e.g., self-driving in certain sections the highway) could be a precursor to the acceptance of AVs.
Additional cost: While some consumers show interest in AVs, many do not seem willing to spend a premium for self-driving technology. For example, a recent study in the US indicated that around 60% of consumers were unwilling to pay any premium for AV technology [85]. Adoption will likely occur when fuel savings, driver lifestyle enhancement, and safety improvements are apparent, and their perceived benefits exceed the extra cost.
Technology and infrastructure: While AV hardware, such as sensors and cameras, is already mature, software for AVs to communicate with each other and the surrounding infrastructure still requires further development and testing in real-life driving scenarios (Fig. 9).
Fig. 9 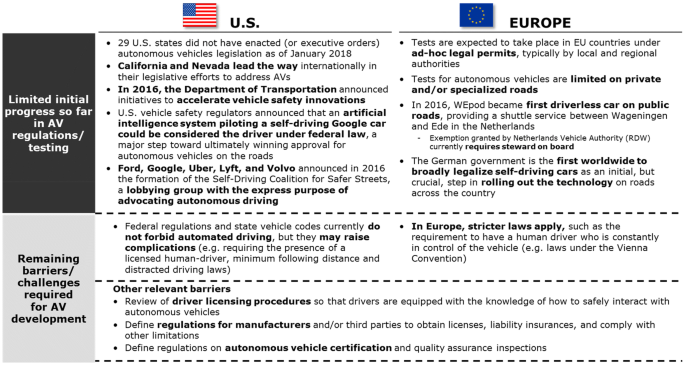
Government regulations and laws pertaining to the use of AVs
Social cost: The expected mass adoption of AVs could have a profound impact on labor demand in the transportation sector in the short to medium term. Workers in some driving occupations (e.g., taxi, Uber, and truck drivers) are sometimes older than the average worker and often have few transferable skills. The emergence of AVs may lead to difficulties for these individuals in finding alternative employment, potentially causing social problems for governments. The extent to which AVs could eliminate certain occupations, resulting in job losses and changing the mix of tasks involved in other occupations, is still unclear [87].


Industry players and experts expect that despite these hurdles, and given the anticipated improvements in technology and the announced plans of large OEMs, it is likely that AVs will be available by ~2020 and widely adopted after ~2030/2035 [72]. Major automotive manufacturers such as BMW, GM, Volvo, and Ford expect that the first L4/L5 autonomous cars will be on the market by 2019–2021 [88].
It is not clear whether the introduction of AVs would lead to an increase or decrease in oil demand [89, 90]. AVs could increase the vehicle miles traveled (VMT) by a single vehicle due to the increased convenience of travel they provide, leading to longer trips and higher car utilization. More VMT would lead to an increase in oil demand. However, AVs could also lead to higher vehicle electrification as well as increase the ICEV fuel economy while driving due to optimizations such as smarter breaking, cruise control, and automatic route optimization. The combined impact would lead to a decrease in the oil demand. Therefore, the net impact of AV technology on oil demand is unclear.
Shared mobility
Shared mobility can be categorized into three main groups: ride-hailing services, car-sharing providers, and car-pooling platforms (Fig. 10) [77, 91]. Ride-hailing services such as Uber typically offer a ride on-demand at the time and location requested by the customer, most frequently through a mobile phone application. Car-sharing services such as Zipcar provide a car without a driver, typically for a shorter period than general car rental services. The rental duration can range from a few minutes to a few hours. Carpooling services involve connecting individuals who take similar routes so that they can share a ride. Generally, shared mobility services compete with traditional taxis, public transportation, and personal car ownership.

Main categories of shared mobility services
Shared mobility services have developed rapidly over the past few years with many players entering the market. The number of trips ride-hailing firms such as Uber and Lyft have served has grown exponentially (Fig. 11) [92, 93]. From its inception until 2017, Uber achieved over 200% average yearly growth in the number of active drivers using its service, with an estimated 4 billion rides delivered in 2017. Uber has also expanded to more than 600 cities globally, reaching billions of people [92].

Growth of ride-hailing companies
Car sharing has also experienced fast growth. The number of cars used by car-sharing companies such as Zipcar and Autolib has grown sharply over the past decade. Some experts expect the number of cars used by car-sharing companies to continue to grow by ~30% annually until 2020 [94]. Major automotive manufacturers have formed partnerships with mobility companies in order to enter the car-sharing service market. For example, Daimler and Europcar (car rental company) have jointly established Car2go, a car-sharing service in which users are charged a per-minute rate, with discounted fixed rates for hourly and daily usage. BMW and Sixt (car rental company) have formed DriveNow, a car-sharing service that allows riders to book a BMW car using their mobile app and pay a per-minute rate. Both these newly formed companies have experienced significant growth in the number of registered members since 2011–2012, with a combined ~1.7 million members in 2015 [95,96,97].
Shared mobility offers an economical solution to customers who use their cars infrequently [91]. Personal car ownership is costly for infrequent drivers, as cars are typically the second most expensive asset a person purchases. Ride-hailing can enable a higher utilization of vehicles and often better time management for drivers, both of which contribute to reducing the cost of transportation.
Shared mobility is also more convenient than traditional taxis and sometimes more convenient than driving a personal car in congested cities [91]. Most services are provided through a mobile phone application, which enables “anywhere, anytime” access to the service. Ride-hailing services also offer instant price quotes, transparency regarding drivers’ identities and service ratings, and automatic invoicing, all of which are convenient and help build trust in the services. Finally, the use of on-demand shared mobility services eases some of the parking spot hassles and costs, particularly in large, congested cities.
It is unclear whether shared mobility services alone would increase or decrease the demand for oil from the LDV sector. Shared mobility could make vehicle travel accessible to more people, such as to groups that cannot afford to purchase a vehicle. It may even encourage people who use public transportation to switch to car transportation. Making vehicle travel accessible to more people would put upward pressure on oil demand from LDVs. On the other hand, shared mobility may lead to more passengers sharing a single vehicle during a trip instead of using multiple vehicles.
It should be noted that increased use of shared mobility services is not a foregone conclusion. Some users of UberPool or Lyft Line have expressed some level of discomfort or privacy concerns when sharing a ride with strangers, and it is unclear as to how consumer attitudes towards ride sharing will evolve. More passengers sharing vehicles would lead to a decrease in oil demand from LDVs. If shared vehicles were mostly EVs, as some analysts are anticipating, then the increase in shared mobility would inevitably put downward pressure on oil demand.
Synergy among the evolutions
Major market experts and players see a natural link between shared mobility, autonomous vehicles, and electric vehicles [73]. The emerging view is that the three segments have the potential to reinforce each other. Preliminary studies and analyses provide the following insights [64, 74, 77, 98, 99]:
The link between AVs and shared mobility: AVs are expected to be a game changer for shared mobility. AVs could significantly reduce the cost of shared mobility by eliminating the most significant operational cost , the human driver. Some studies estimate that autonomous taxis could operate at ~40% of the cost of a human-driven ride-hailing taxi. AVs would also allow for intelligent balancing of the driverless fleet to better service the anticipated demand. Finally, the wide adoption of AVs by mobility services companies would help accelerate their spread.
The link between shared mobility and EVs: EVs have been proven to be cheaper to maintain and operate than ICEVs (although such analyses typically do not include battery replacement and disposal costs, and consider a lifetime of ~5 years for the shared mobility car, after which it would be scrapped). Despite the higher initial cost of EVs relative to ICEVs (as is the case currently), with enough miles driven the lower operating costs for EVs would outweigh the higher initial investment on a total-cost-per-mile basis. Mobility service cars are expected to drive up to ~100–110,000 km per year, compared to 22,000 km per year for a typical privately owned vehicle. Because of more intense use, it is assumed that commercial vehicles will be written off after 300,000 km rather than after 10 years. As such, significant numbers of EVs are expected to be used in shared mobility services. Furthermore, consumer concerns over EV range and charging station availability could be mitigated by the fact that most taxi rides fall within current EV ranges, and cars could be dispatched according to customer destination, battery life, and recharging needs.
The link between EVs and AVs: EVs facilitate the rapid development and testing of driverless technology because they are modular and computerized. EVs are easier than ICEVs for computers to control and maintain because they contain fewer moving pieces—the battery, the inverter, and the electric motor. On the other hand, an ICEV is significantly more complex. It is also easier, cheaper, and safer to recharge an unmanned EV than to fill a regular tank with flammable fuel automatically.
The intersection of the three technological shifts is often referred to as “shared autonomous electric vehicles” (SAEVs). SAEVs have the potential to drastically reduce transportation costs. The intersection of the three technological shifts could favor the uptake of EVs, which would reduce oil demand from LDVs. The speed at which this could take place depends on four key factors, which all entail significant uncertainty: government regulation (especially for AVs and EVs), incentives (especially for EVs and also for infrastructure investments that enable AVs), technological improvements, and consumer acceptance (Fig. 12).

Key progress and uncertainties that will determine the uptake of SAEVs
Assessment of oil demand from LDVs in 2040
Five main factors will impact the change in global oil demand from LDVs by 2040:
Increase in the global LDV fleet size driven by non-OECD countries. We identified a fleet growth potential of ~85–100% from 2016 to 2040 through multiple third-party sources [1,2,3,4,5]. For example, the IEA Reference Technology Scenario (RTS) shows forecasts that imply that the global fleet would grow by ~85% from 2016 to 2040, reaching ~2.1 billion vehicles by 2040 [3]. The BP Energy Outlook 2017 report indicates that the global fleet might double from 2015 to 2035 [5]. Finally, OPEC WOO 2017 estimates that the global LDV fleet size would grow by almost 90% by 2040 to reach 2.03 billion vehicles [2]. In our analysis, we assumed that LDV fleet size would grow by 90% by 2040, in line with the aforementioned ranges.
Improvement in the fuel economy of ICEVs. ICEV fuel economy improvements will be driven by governments’ fuel economy targets and technological advancements. Considering these fuel economy targets, technological advancements, past improvement trends, and third-party forecasts, we assumed that the ICEV stock fuel economy could improve globally by ~40–70% by 2040.
Penetration of electric vehicles, with a wide range of possible penetration scenarios. Given the significant remaining uncertainties regarding the extent of EV uptake, we considered three scenarios for EV penetration in 2040, based on the most prevalent ranges of forecasts that we identified in various third-party studies: a low-case penetration scenario (7% EV stock penetration by 2040), a mid-case penetration scenario (18% EV stock penetration), and a high-case penetration scenario (30% EV stock penetration).
Penetration of alternative fuels (focus on biofuels) and biofuel blending mandates. In our analysis, we considered three scenarios for the share of biofuels in LDV energy demand, ranging from 4 to 8% by 2040.
Change in vehicle miles traveled. Changes in VMT will be determined by the intersection of multiple developments, including vehicle automation and shared mobility. We can safely predict that by 2040, passenger miles traveled will increase due to these technological developments, making road transportation more accessible. However, the exact changes in VMT from now until 2040 is currently unclear. We therefore make no assumptions regarding the impact of changes in VMT on oil demand.
This section provides a general overview of the methodology used for simulating the oil demand scenarios in 2040. The scenario simulation is dependent upon a variety of drivers and assumptions, all of which entail significant uncertainty. As a result, the 2040 oil demand forecast is uncertain. This paper presents the full range of outcomes (or potential scenarios) that might emerge from the uncertainties of the key drivers.
General overview of the scenario model
-
1.
The model was built to generate a range of potential outcomes for oil demand from LDVs by 2040.
-
2.
The model takes into account the impact of four main drivers of oil demand from LDVs:
-
(a)
Increased LDV fleet size.
-
(b)
Improved ICEV stock fuel economy.
-
(c)
Increased EV penetration.
-
(d)
Increased penetration of alternative fuels (focus on biofuels).
The impact of VMT was not assessed, as great uncertainties remain regarding its evolution.
-
(a)
-
3.
The model uses three boundary scenarios (maximum, average, minimum) as input values for parameters (2), (3), and (4) above, in addition to the three scenarios for the 2016 baseline oil demand from LDVs. We determined the ranges for each of those parameters based on a review of forecasts from other institutions and existing literature, referenced in various sections of this paper.
-
4.
Compounding the scenarios for each of the drivers of oil demand resulted in 81 possible scenarios for oil demand by 2040 (i.e., 3 × 3 × 3 × 3 scenarios).
The following section explains the calculation mechanisms of the model.
Step-by-step mechanics of the oil demand scenario model
-
1.
We developed three baseline scenarios for 2016 LDV oil demand following the range of forecasts from energy agencies highlighted in this paper: minimum 24, average 24.2, maximum 24.4 MBDOE.
-
2.
We incorporated the impact of a ~90% increase in the LDV fleet size, with all else being equal and assuming no changes in the fleet composition or penetration of EVs. This results in three scenarios for the increase in oil demand by 2040: minimum increase 21.6, average 21.8, maximum 22.2 MBDOE.
-
3.
We calculated the impact of an improvement in the ICEV stock fuel economy. We based our scenarios upon an assumption of an improvement in the ICEV stock fuel economy of 40–70%. The resulting scenarios indicated a minimum drop in demand of ~13.0 MBDOE, an average drop of 16.1 MBDOE, and a maximum drop of ~19.1 MBDOE.
-
4.
We included three scenarios that reflected the potential impact of increased EV penetration, based on forecast ranges from other institutions. The assessment considered the PHEV/BEV mix, driving modes, electricity generation, and oil consumption (details provided in the accompanying model as an Excel file). This stage of the analysis produces 27 scenarios based on all the above parameters and prior scenarios. The net impact of electrification ranges between a minimum of ~1 MBDOE (scenario with maximum fuel economy improvements for the ICEV fleet and minimum penetration of EVs) to a maximum of ~7.8 MBDOE (scenario with minimal fuel economy improvements for the ICEV fleet and the maximum penetration of EVs).
-
5.
We included the impact of the increased share of biofuels in LDV energy demand using IEA scenarios for biofuels as our minimum and maximum scenarios. At this stage, the analysis has a compounded 81 scenarios, with the reduction in oil demand from biofuels ranging from 0.7 to 2.5 MBDOE.
In summary, we simulated 81 scenarios using combinations of the ranges of the above parameters and found the maximum 2040 oil demand to be ~30.7 MBDOE, with the minimum oil demand ~18.9 MBDOE and the average scenario indicating ~24.4 MBDOE. The model is included as a supplementary Excel file.
Based on these ranges of assumptions, our analysis indicates that in the average scenario, oil demand from LDVs would be relatively unchanged by 2040 (Fig. 13). However, a wide range of outcomes is possible. The minimum scenario would see oil demand from LDVs shrink by ~5.3 MBDOE from the baseline of 24.2 MBDOE in 2016. The maximum scenario would see oil demand from LDVs increase by ~6.5 MBDOE from the same baseline. Outcomes outside this range would require more aggressive assumptions than this paper considers, particularly for fuel economy improvements and EV fleet penetration. In particular, in theory, EV fleet penetration could be accelerated if shared mobility and autonomous driving are very widely adopted. As we explained earlier, we did not model these effects due to significant uncertainties in the development timeline of these trends and difficulties in quantifying their impact on EV penetration.

Oil demand from LDVs: a view to 2040
Oil demand from the transportation sector: other studies
In the broader context of all transportation modes, most third-party studies expect continued growth in oil demand from the transportation sector, including air, sea, rail, and road (passenger and freight). However, these studies forecast that oil demand will grow at a slower pace (Fig. 14).

Oil demand from the transportation sector
Critical remaining uncertainties
The future of the LDV energy landscape will be defined by a number of factors, each of which entails significant uncertainty. These uncertainties could lead to a variety of possible outcomes for oil demand from the LDV sector in 2040, including outcomes that fall outside the range that we have identified in our modeling exercise.
Ultimately, governments and other key stakeholders, such as national or international oil producing companies and OEMs, will need to react to structural changes in the LDV sector by adjusting their expectations and plans. Governments will need to create new regulations consistent with the changes, while businesses will need to adjust their plans and business models to mitigate the risks arising from changes to the LDV sector and also to realize new opportunities.
To react effectively, stakeholders will first need to understand the dynamics and likely magnitude of the changes in the LDV sector. Narrowing the wide range of forecasts to a realm of likely options will provide stakeholders with greater clarity.
This study identified several areas of major uncertainty. Further research is needed to explore these areas. This would enable a better understanding of the dynamics and likely magnitude of the changes to the LDV sector and their potential impact on oil demand.
Consumer acceptance and adoption. The future LDV landscape will depend upon how fast and to what extent consumers adopt new LDV technologies and paradigms, particularly EVs, autonomous driving technologies, and vehicle/ride sharing. Even though OEMs are investing heavily in EVs and AVs, often supported by government initiatives, and technology and automotive companies are investing in shared mobility, this does not necessarily mean that most or a large percentage of consumers will transition towards these new mobility mechanisms and technologies.
Future oil prices. Multiple uncertainties surround forecasts for oil prices in 2040, including the development of fiscal policies in various jurisdictions which influence the price of gasoline and diesel at the pump. Fluctuations in and speculation about the price of oil will continue to influence the development of alternative fuels for LDVs such as biofuels, gas, and electricity. The development of biofuels and advanced biofuel technologies remains heavily correlated with oil prices: low oil prices diminish the incentive to shift towards biofuels. Similarly, the future role of gas in the LDV sector will remain dependent on the gas-to-oil price differential. Natural gas-fueled LDVs will be unattractive without a price advantage for using gas over gasoline or diesel, especially given the limited infrastructure availability for such vehicles and their shorter driving ranges. Finally, oil prices will play a major role in the uptake of EVs. A sustained low price environment for oil may significantly delay the time at which EVs achieve an unsubsidized total cost of ownership (TCO) parity with ICEVs. In a scenario of sustained low oil prices, governments may utilize fiscal policies or carbon-content-based taxes to offset the impact of lower oil prices. A low level of tax provides a weak signal to consumers of future fuel-use costs, especially given the undervaluation of lifetime operating costs known as the energy efficiency gap [100]. On the other hand, high fuel taxation may not be politically palatable in various parts of the world, as the recent fuel tax riots in France illustrate.
Technological advancement and speed of the mobility revolution. The LDV sector’s mobility evolution will be determined by the intersection of multiple technologies including EVs and AVs, and new paradigms such as shared mobility. While the uptake of EVs is expected to put downward pressure on oil demand, the net impact of AVs and shared mobility on oil demand is less clear. As discussed, they could increase or accelerate the uptake of EVs, putting further downward pressure on oil demand. On the other hand, AVs and shared mobility could boost the demand for car travel by enabling wider access to cars through lower costs, putting upward pressure on oil demand. The speed and extent of these evolutions remain subject to significant uncertainties.
The speed and extent of technological advancement will be a key driving factor for the increased penetration of EVs and other alternative fuels such as biofuels. Current trends in battery cost reductions, driving ranges, and charging speeds favor increased uptake of EVs. However, there are potential roadblocks that could reduce the pace of these trends. Supply-side scaling challenges for batteries such as cobalt may put upward pressure on battery prices, thereby making EVs less economically attractive. The development of cheap, sustainable second- and third-generation biofuel supply, such as algae-based biofuels, through technological advancements and governmental support will determine the extent of growth in biofuel adoption. The market viability of other advances in technology that result in energy efficiency gains and reduced GHG emissions is still uncertain. For example, fuel cell vehicles that offer long driving ranges with very low emissions still face important technological and infrastructure development roadblocks.
Government policy targets and their achievability. Many evolutions in the LDV sector, especially the rise of the EVs, have been driven by government interventions to address local air pollution and/or climate change concerns. These interventions have taken the form of policy commitments such as supply-side vehicle and fuel standards/mandates, the provision of preferential treatment for EVs, and financial investments such as infrastructure investments for EVs and biofuels, and purchase incentives for EVs. These investments are costly, and there are varying views on their sustainability, with direct EV purchase incentives in some countries recently scaled back. As such, the political will to sustain these policies and financial investments is not guaranteed. However, changes in energy demand and price dynamics, macroeconomic and fiscal circumstances, industrial and environmental policies including supply-side standards/mandates and driving restriction policies, and/or cost trends in technologies could lead countries to achieve their stated ambitions, including nationally determined contributions to the Paris COP-21 agreement, faster than expected.
Interaction with the existing energy system. Increases in EV uptake may cause some pressure on the existing electricity infrastructures which will require additional investments to meet the increased demand. However, those investments have been shown to be in line with historical electricity infrastructure investments and may not severely impact EV uptake [39]. Furthermore, the extent to which existing infrastructure can efficiently serve extra demand for electricity, especially capacity at peak charging times, may depend on the appropriate “economic integration” of EVs into electricity networks (e.g., the design of EV charging markets, regulations, and incentive structures). For example, using a smart charging system that promotes charging during times of excess electricity generation may alleviate network constraints and minimize the need for investments. An additional consideration is whether the use of the existing infrastructure will help to reduce carbon emissions. A carbon-emitting electricity generation infrastructure (e.g., heavily dependent on coal) could ultimately make EVs highly polluting. Technologies currently under development, such as smart grids, will help address some of these challenges. Significant uncertainty remains regarding the overall level of investment needed in various geographies, and whether and when those investments will be undertaken.
This paper has endeavored to create a comprehensive view of how the trends and evolutions in the LDV sector will change the fleet size and composition of LDVs and the consequent demand for oil. The results presented in this paper suggest that, for the next two decades at least, oil will likely remain the primary fuel for LDVs. The fuel economy of ICEVs is increasing, and uncertainties remain regarding the scale of electric, autonomous, and shared vehicle adoption. As such, an appropriate action plan for the next two decades for key stakeholders, including governments, entrepreneurs, OEMs, and oil producers among others, would be to develop a basket of solutions that take into account a range of projected technological, social, and economic conditions, rather than rely on specific outcomes.
Notes
Traffic congestion may push some governments to increasingly encourage alternatives to LDVs such as public transport and cycling. However, this paper does not focus on the growth of such alternatives to LDVs as their evolution and impact is highly uncertain and differs across countries.
References
International Energy Agency: World Energy Outlook. https://www.iea.org/weo2017/ (2017). Accessed Oct 2018
Organization of the Petroleum Exporting Countries: World Oil Outlook. https://www.opec.org/opec_web/flipbook/WOO2017/WOO2017/assets/common/downloads/WOO%202017.pdf (2017). Accessed Oct 2018
International Energy Agency: Energy technology perspectives. http://www.acs-giz.si/resources/files/Energy_technology_perspectives.pdf (2017). Accessed Oct 2018
International Transport Forum: ITF transport outlook. https://www.ttm.nl/wp-content/uploads/2017/01/itf_study.pdf (2017). Accessed Dec 2018
British Petroleum: BP Energy Outlook. https://www.bp.com/content/dam/bp/pdf/energy-economics/energy-outlook-2017/bp-energy-outlook-2017.pdf (2017). Accessed Oct 2018
Organization of the Petroleum Exporting Countries: World Oil Outlook. https://www.opec.org/opec_web/static_files_project/media/downloads/publications/WOO%202016.pdf (2016). Accessed Oct 2018
International Energy Agency: Global EV Outlook. https://www.connaissancedesenergies.org/sites/default/files/pdf-actualites/globalevoutlook2018.pdf (2018). Accessed Jan 2019
World Energy Council: Global transport scenarios 2050. http://www.wec-france.org/DocumentsPDF/Etudes_CME/wec_transport_scenarios_2050.pdf (2011). Accessed Oct 2018
Kane, M.: There are 6,500 hydrogen fuel cell cars worldwide (half in California). https://insideevs.com/there-is-only-6500-hydrogen-fuel-cell-cars-in-the-world-half-in-california-report/ (2018). Accessed Mar 2019
International Energy Agency: Hydrogen: tracking clean energy progress. https://www.iea.org/tcep/energyintegration/hydrogen/ (2018). Accessed Mar 2019
LUKOIL: Major trends in global oil market to 2030. http://www.lukoil.ru/FileSystem/PressCenter/78037.pdf (2017). Accessed Oct 2018
Cazzola, P.: Current global fuel economy levels and projections. https://wedocs.unep.org/bitstream/handle/20.500.11822/25177/CurrentGlobalFuelEconomyLevels.pdf?sequence=1&isAllowed=y (2018). Accessed Oct 2018
Yang, Z., Bandivadekar, A.: Light-Duty Vehicle greenhouse gas and fuel economy standards. https://www.theicct.org/sites/default/files/publications/2017-Global-LDV-Standards-Update_ICCT-Report_23062017_vF.pdf (2017). Accessed Oct 2018
Global Fuel Economy Initiative: International comparison of light-duty vehicle fuel economy 2005–2015. https://www.globalfueleconomy.org/media/418761/wp15-ldv-comparison.pdf (2017). Accessed Oct 2018
United States Environmental Protection Agency: Light-duty vehicle CO2 and fuel economy trends. https://www.epa.gov/fuel-economy-trends/download-report-co2-and-fuel-economy-trends (2018). Accessed Oct 2018
Pausch-Homblé, K.: CO2 emission standards for cars and vans: Council confirms agreement on stricter limits. https://www.consilium.europa.eu/en/press/press-releases/2019/01/16/co2-emission-standards-for-cars-and-vans-council-confirms-agreement-on-stricter-limits/ (2019). Accessed Jan 2019
Hao, H., Liu, F., Liu, Z., Zhao, F.: Compression ignition of low-octane gasoline: life cycle energy consumption and greenhouse gas emissions. Appl. Energy 181, 391–398 (2016)
Ogbac, S.: Mazda to launch compression-ignition gas engine bby 2019. https://www.motortrend.com/news/mazda-to-launch-compression-ignition-gas-engine-by-2019/ (2017). Accessed Sept 2018
Posada, F., Blumberg, K., Miller, J., Hernandez, U.: Evaluation of next-phase greenhouse gas regulations for passenger vehicles in Mexico. https://www.theicct.org/sites/default/files/publications/Mexico-OMEGA_ICCT_white-paper_26052017_vF_corr.pdf (2017). Accessed Oct 2018
International Energy Agency, European Conference of Ministers of Transport: Making cars more fuel efficient. https://www.itf-oecd.org/sites/default/files/docs/05cars.pdf (2005). Accessed Oct 2018
Energy and Environmental Analysis, I.: Technologies to improve light-duty vehicle fuel economy. http://www.h-dsystems.com/FuelEcon_NAS.pdf (2007). Accessed Oct 2018
Biofuel.org.uk: Major biofuel producers by region. http://biofuel.org.uk/major-producers-by-region.html (2018). Accessed Oct 2018
International Energy Agency: World Energy Outlook. https://www.iea.org/newsroom/news/2016/november/world-energy-outlook-2016.html (2016). Accessed Oct 2018
Jayasinghe, S.: China’s new ethanol use mandate will create opportunities for US exports. https://www.agmrc.org/renewable-energy/renewable-energy-climate-change-report/renewable-energy-climate-change-report/november-2017-report/chinas-new-ethanol-use-mandate-will-create-opportunities-for-us-exports/ (2017). Accessed Oct 2018
Mason, J., Aizhu, C., Gu, H., Pullin, R.: China sets 2020 target for nationwide ethanol use to cut corn stocks. https://www.reuters.com/article/china-lng-japan/cnooc-resells-floating-lng-cargo-to-japan-amid-lacklustre-winter-demand-idUSL3N1ZL2ZC (2017). Accessed Sept 2018
International Energy Agency: World Energy Outlook. https://www.iea.org/weo2018/ (2018). Accessed Jan 2019
International Energy Agency: Global EV Outlook. https://www.iea.org/publications/freepublications/publication/GlobalEVOutlook2017.pdf (2017). Accessed Oct 2018
Wood Mackenzie: The rise of the electric car: how will it impact oil, power and metals. https://www.woodmac.com/reports/gas-markets-the-rise-of-the-electric-car-how-will-it-impact-oil-power-and-metals-10987 (2017). Accessed Sept 2018
Global Fuel Economy Initiative: Electric vehicles, ICE fuel economy and vehicle efficiency regulations. https://www.globalfueleconomy.org/media/460864/electric-vehicles-summary.pdf (2017). Accessed Oct 2018
Bolon, K.: Review of technical assessment and role of off-cycle credits. Paper presented at the ITB Advanced Thermal Management Conference, Novi MI, 2017
Lutsey, N.: Integrating electric vehicles within US and European efficiency regulations. https://www.theicct.org/sites/default/files/publications/Integrating-EVs-US-EU_ICCT_Working-Paper_22062017_vF.pdf (2017). Accessed Oct 2018
Internal Economic Development Council: creating the clean energy economy. https://www.iedconline.org/clientuploads/Downloads/edrp/IEDC_Electric_Vehicle_Industry_Summary.pdf (2013). Accessed Oct 2018
Qnovo: The cost components of a lithium battery. https://qnovo.com/82-the-cost-components-of-a-battery/ (2016). Accessed Oct 2018
Curry, C.: Lithium-ion battery costs: squeezed margins and new business models. https://data.bloomberglp.com/bnef/sites/14/2017/07/BNEF-Lithium-ion-battery-costs-and-market.pdf (2017). Accessed Oct 2018
Barrera, P.: Tight cobalt supply will keep boosting prices. https://investingnews.com/daily/resource-investing/critical-metals-investing/cobalt-investing/tight-cobalt-supply-boosting-prices/ (2017). Accessed Oct 2018
TradingEconomics: Cobalt. https://tradingeconomics.com/commodity/cobalt (2019). Accessed Jan 2019
Investment Mine: 5 year cobalt prices and price charts. http://www.infomine.com/investment/metal-prices/cobalt/5-year/ (2019). Accessed Jan 2019
WoodMackenzie: Growth in electric vehicles to transform the lithium and cobalt industries. https://www.woodmac.com/news/editorial/growth-in-electric-vehicles-to-transform-lithium-and-cobalt-industries/ (2018). Accessed Jan 2019
Oxford Institute for Energy Studies: Electricity, electric vehicles, and public policy: eight key takeaways. https://www.oxfordenergy.org/wpcms/wp-content/uploads/2019/02/Electricity-Electric-Vehicles-and-Public-Policy-8-Key-Takeaways.pdf (2019). Accessed Mar 2019
Kay, A.: Top cobalt production by country. https://investingnews.com/daily/resource-investing/critical-metals-investing/cobalt-investing/top-cobalt-producing-countries-congo-china-canada-russia-australia/ (2018). Accessed Oct 2018
Azevedo, M., Campagnol, N., Hagenbruch, T., Hoffman, K., Lala, A., Ramsbottom, O.: Lithium and cobalt: a tale of two commodities. https://www.mckinsey.com/industries/metals-and-mining/our-insights/lithium-and-cobalt-a-tale-of-two-commodities (2018). Accessed Sept 2018
Patel, P.: Simple, energy-efficient recycling process for lithium-ion batteries. https://spectrum.ieee.org/energywise/energy/environment/simple-energyefficient-recycling-process-for-lithiumion-cathodes (2018). Accessed Oct 2018
Nedjalkov, A., Meyer, J., Köhring, M., Doering, A., Angelmahr, M., Dahle, S., Sander, A., Fischer, A., Schade, W.: Toxic gas emissions from damaged lithium-ion batteries—analysis and safety enhancement solution. Batteries 2(1), 5 (2016)
GLOBAL 2000 Verlagsges.m.b.H.: Lithium—friends of the Earth Europe. https://www.foeeurope.org/sites/default/files/publications/13_factsheet-lithium-gb.pdf (2013). Accessed Oct 2018
Bacon, R.: The problem with recycling electric vehicle batteries. https://evrater.com/ev-battery-disposal (2018). Accessed Oct 2018
Battery University: Battery recycling as a business. https://batteryuniversity.com/learn/article/battery_recycling_as_a_business (2018). Accessed Oct 2018
Gardiner, J.: The rise of electric cars could leave us with a big battery waste problem. https://www.theguardian.com/sustainable-business/2017/aug/10/electric-cars-big-battery-waste-problem-lithium-recycling (2017). Accessed Oct 2018
Harvey, J.: Metal recyclers prepare for electric car revolution. https://uk.reuters.com/article/us-batteries-recycling-analysis/metal-recyclers-prepare-for-electric-car-revolution-idUKKBN1DH1DS (2017). Accessed Oct 2018
The Boston Consulting Group: Batteries for electric cars challenges, opportunities and the outlook for 2020. https://www.bcg.com/documents/file36615.pdf (2010). Accessed Oct 2018
Young, K., Wang, C., Wang, L.Y., Strunz, K.: Electric vehicle battery technologies. In: Garcia-Valle, R., Peças Lopes, J.A. (eds.) Electric Vehicle Integration into Modern Power Networks, pp. 15–56. Springer, New York (2013)
Muller, J.: ChargePoint’s new stations promise fast charge in minutes for your electric car. https://www.forbes.com/sites/joannmuller/2017/01/05/chargepoints-new-stations-promise-fast-charge-in-minutes-for-your-electric-car/#5b02ae94492d (2017). Accessed Oct 2018
Tesla: Charge on the road. https://www.tesla.com/supercharger (2017). Accessed Jan 2018
Leis, J.: Energy management in the age of disruptions. https://www.bain.com.kw/contentassets/c9e23498cae04786abe078ef4d72f10e/bain_brief_energy_management_in_the_age_of_disruptions.pdf (2017). Accessed Oct 2018
Yang, Z., Slowik, P., Lutsey, N., Searle, S.: Principles for effective electric vehicle incentive design. https://www.theicct.org/sites/default/files/publications/ICCT_IZEV-incentives-comp_201606.pdf (2016). Accessed Oct 2018
Slowik, P., Lutsey, N.: Evolution of incentives to sustain the transition to a global electric vehicle fleet. https://www.theicct.org/sites/default/files/publications/EV%20Evolving%20Incentives_white-paper_ICCT_nov2016.pdf (2016). Accessed Oct 2018
Bosworth, R.C., Patty, G., Crabtree, M.: The current state of electric vehicle subsidies: economic, environmental, and distributional impacts. https://strata.org/pdf/2017/ev-full.pdf (2017). Accessed Sept 2018
Hanley, S.: Denmark Rethinks EV incentives after market collapses. https://cleantechnica.com/2018/05/01/denmark-rethinks-ev-incentives-after-market-collapses/ (2018). Accessed Oct 2018
Kane, M.: Denmark plug-in vehicles sales tank as subsidies vanish. https://insideevs.com/denmark-electric-car-sales-tank-as-subsidies-vanish/ (2017). Accessed Oct 2018
Levring, P.: Denmark Is killing Tesla (and other electric cars). https://www.bloomberg.com/news/articles/2017-06-02/denmark-is-killing-tesla-and-other-electric-cars (2017). Accessed Oct 2018
Sheinin, A.G.: Electric vehicle sales fizzle after Georgia pulls plug on tax break. https://www.ajc.com/news/state–regional-govt–politics/electric-vehicle-sales-fizzle-after-georgia-pulls-plug-tax-break/HC0We2aNiekLEn6VoNsa6M/ (2015). Accessed Oct 2018
Walton, R.: Georgia electric vehicle sales shrink 80% in wake of tax credit repeal. https://www.utilitydive.com/news/georgia-electric-vehicle-sales-shrink-80-in-wake-of-tax-credit-repeal/434092/ (2017). Accessed Oct 2018
Badertscher, N.: Electric car sales hit the brakes as tax credit axed and fee added. https://www.politifact.com/georgia/statements/2015/nov/02/don-francis/electric-car-sales-hit-brakes-tax-credit-axed-and-/ (2015). Accessed Oct 2018
Caputo, M.: Georgia EV sales sputter without tax credit. https://www.marketplace.org/2016/01/08/world/georgia-ev-sales-sputter-without-tax-break (2016). Accessed Oct 2018
British Petroleum: BP Energy Outlook. https://www.bp.com/en/global/corporate/energy-economics/energy-outlook.html (2018). Accessed Oct 2018
van der Steen, M., Van Schelven, R.M., Kotter, R., van Twist, M.J.W., van Deventer MPA, P.: EV policy compared: an International Comparison of Governments’ Policy Strategy towards E-mobility. In: Leal Filho, W., Kotter, R. (eds.) E-Mobility in Europe: Trends and Good Practice, pp. 27–53. Springer, Cham (2015)
Congressional Budget Office: Effects of federal tax credits for the purchase of electric vehicles. https://www.cbo.gov/publication/43576 (2012). Accessed Oct 2018
Sheldon, T., Dua, R.: Gasoline savings from clean vehicles adoption. Energy Policy 120, 418–424 (2018)
Li, S., Tong, L., Xing, J., Zhou, Y.: The market for electric vehicles: indirect network effects and policy design. J. Assoc. Environ. Resour. Econo. 4(1), 89–133 (2017)
Organization of the Petroleum Exporting Countries: World Oil Outlook. https://woo.opec.org/pdf-download/ (2018). Accessed Oct 2018
ExxonMobil: 2017 Outlook for Energy: a view to 2040. https://cdn.exxonmobil.com/~/media/global/files/outlook-for-energy/2017/2017-outlook-for-energy.pdf (2017). Accessed Oct 2018
Bloomberg New Energy Finance: Electric vehicles to accelerate to 54% of new car sales by 2040. https://about.bnef.com/blog/electric-vehicles-accelerate-54-new-car-sales-2040/ (2017). Accessed Oct 2018
Goldman Sachs: Future of oil demand: not the drivers you may think (2017). https://360.gs.com/research/portal//?st=1&action=action.binary&d=24479721&fn=/document.pdf&a=8c54c95e2d52423b8eca1eae4f32dc19
Sperling, D., Pike, S., Chase, R.: Will the transportation revolutions improve our lives—or make them worse? In: Sperling, D. (ed.) Three Revolutions: Steering Automated, Shared, and Electric Vehicles to a Better Future, pp. 1–20. Island Press, Washington (2018)
United States Energy Information Administration: Autonomous vehicles: uncertainties and energy implications. https://www.eia.gov/outlooks/aeo/pdf/AV.pdf (2018). Accessed Oct 2018
Coppola, G., Dey, E.: Another big challenge for autonomous car engineers: energy efficiency. https://www.autonews.com/article/20171011/MOBILITY/171019855/another-big-challenge-for-autonomous-car-engineers-energy-efficiency (2017). Accessed Oct 2018
Stewart, J.: Self-driving cars use crazy amount of power, and it’s becoming a problem. https://www.wired.com/story/self-driving-cars-power-consumption-nvidia-chip/ (2018). Accessed Oct 2018
Hannon, E., McKerracher, C., Orlandi, I., Ramkumar, S.: An integrated perspective on the future of mobility. https://www.mckinsey.com/business-functions/sustainability-and-resource-productivity/our-insights/an-integrated-perspective-on-the-future-of-mobility (2016). Accessed Oct 2018
Hepler, L.: Apple, Google, Tesla and the race to electric self-driving cars. https://www.greenbiz.com/article/apple-google-tesla-and-race-electric-self-driving-cars (2015). Accessed Oct 2018
Abuelsamid, S.: Ford reorganizes autonomous vehicle deployment efforts into new business unit. https://www.forbes.com/sites/samabuelsamid/2018/07/25/ford-reorganizes-autonomous-vehicle-deployment-efforts-into-new-business-unit/#7607fc975963 (2018). Accessed Oct 2018
Shepardson, D.: GM to make production versions of self-driving Cruise AVs in Michigan. https://www.autonews.com/article/20180315/MOBILITY/180319809/gm-to-make-production-versions-of-self-driving-cruise-avs-in-michigan (2018). Accessed Oct 2018
Gibbs, S.: Uber plans to buy 24,000 autonomous Volvo SUVs in race for driverless future. https://www.theguardian.com/technology/2017/nov/20/uber-volvo-suv-self-driving-future-business-ride-hailing-lyft-waymo (2017). Accessed Oct 2018
Kalanick, T.: Uber and Daimler join forces on self-driving cars. https://www.uber.com/newsroom/uber-daimler-self-driving-cars/(2017). Accessed October 2018
Ford Motor Company: Domino’s® and Ford begin consumer research of pizza delivery using self-driving vehicles. https://media.ford.com/content/fordmedia/fna/us/en/news/2017/08/29/dominos-ford-begin-research-pizza-delivery.html (2017). Accessed Oct 2018
Palmer, K., Teter, J., Kamiya, G.: Automation, connectivity, electrification, and sharing (ACES). https://www.iea.org/media/workshops/2018/aces/WorkshopSummary.pdf (2018). Accessed Oct 2018
Schoettle, B., Sivak, M.: A survey of public opinion about autonomous and self-driving vehicles in the US, the UK, and Australia. http://cdn.theatlantic.com/assets/media/img/posts/UMTRI-2014-21.pdf (2014). Accessed Oct 2018
Schoettle, B., Sivak, M.: Driverless vehicles: fewer cars, more miles. http://www.umtri.umich.edu/what-were-doing/news/driverless-vehicles-fewer-cars-more-miles (2015). Accessed Oct 2018
Beede, D.N., Powers, R., Ingram, C.: The employment impact of autonomous vehicles. SSRN (2017). https://doi.org/10.2139/ssrn.3022818
Forsgren, K., Shah, D., Lum, D.: The road ahead for autonomous vehicles. https://www.spglobal.com/en/research-insights/articles/The-Road-Ahead-for-Autonomous-Vehicles (2018). Accessed Oct 2018
Jackson, F.: Could TaaS offset EV impact on oil demand Growth? https://www.forbes.com/sites/feliciajackson/2018/07/11/could-taas-offset-ev-impact-on-oil-demand-growth/#4476b4bc4686 (2018). Accessed Oct 2018
Bjornstad, E.: Self-driving cars and better gas mileage. https://www.bellperformance.com/blog/self-driving-cars-and-better-gas-mileage (2017). Accessed Oct 2018
Equiterre: Shared Mobility: Removing Regulatory Barriers In Canadian Cities. https://equiterre.org/en/news/shared-mobility-removing-regulatory-barriers-in-canadian-cities (2017). Accessed Oct 2018
Smith, C.: 110 Amazing Uber stats and facts (2017) by the numbers. https://expandedramblings.com/index.php/uber-statistics/ (2018). Accessed Jan 2018
Smith, C.: 50 Interesting Lyft statistics and facts (December 2018) by the numbers. https://expandedramblings.com/index.php/lyft-statistics/ (2018). Accessed Jan 2018
The Economist: The driverless, car-sharing road ahead. https://www.economist.com/business/2016/01/09/the-driverless-car-sharing-road-ahead (2016). Accessed Sept 2018
car2go: car2go growing in the global carsharing business. https://www.car2go.com/media/data/usa/microsite-press/files/car2go-growing-in-the-global-carsharing-business.pdf (2017). Accessed Sept 2018
BMW Group: Investor presentation. https://www.bmwgroup.com/content/dam/bmw-group-websites/bmwgroup_com/ir/downloads/en/2015/2015-11-BMW-Group-Investor-Presentation.pdf (2015). Accessed Oct 2018
SIXT: SIXT meets the automotive world. https://about.sixt.com/websites/sixt_cc/English/2699/directors-dealings-details.html?newsID=1526843 (2015). Accessed Sept 2018
Mui, C.: The virtuous cycle between driverless cars, electric vehicles and car-sharing services. https://www.forbes.com/sites/chunkamui/2016/02/08/the-virtuous-cycle-between-driverless-cars-electric-vehicles-and-car-sharing-services/#76db2b057143 (2016). Accessed Sept 2018
World Economic Forum, Bain&Company: Electric vehicles for smarter cities: the future of energy and mobility. http://www3.weforum.org/docs/WEF_2018_%20Electric_For_Smarter_Cities.pdf (2018). Accessed Oct 2018
Gerarden, T.D., Newell, R.G., Stavins, R.N.: Assessing the energy-efficiency gap. J. Econ. Lit. 55(4), 1486–1525 (2017). https://doi.org/10.1257/jel.20161360
Acknowledgements
The authors would like to thank Dr. Chay Allen, KAPSARC, for his editorial advice.
Author information
Authors and Affiliations
Corresponding author
Rights and permissions
Open Access This article is distributed under the terms of the Creative Commons Attribution 4.0 International License (http://creativecommons.org/licenses/by/4.0/), which permits unrestricted use, distribution, and reproduction in any medium, provided you give appropriate credit to the original author(s) and the source, provide a link to the Creative Commons license, and indicate if changes were made.
About this article

Cite this article
Albrahim, M., Zahrani, A.A., Arora, A. et al. An overview of key evolutions in the light-duty vehicle sector and their impact on oil demand. Energy Transit 3, 81–103 (2019). https://doi.org/10.1007/s41825-019-00017-7
Received:
Accepted:
Published:
Issue Date:
DOI: https://doi.org/10.1007/s41825-019-00017-7