
Abstract
The use of fossil fuel-based vehicles may gradually be replaced by electric vehicles in the future. The trend indicates that the number of users of electric vehicles, especially electric cars, continues to increase. Indonesia is well-positioned to take advantage of this opportunity as it has the world’s largest nickel reserves, an essential raw material for making electric vehicle batteries (EVB). The study examines the economic and environmental implications if Indonesia were to successfully set up electric vehicle (EV) production rather than exporting such raw materials overseas. We use an input–output model to estimate electric vehicle production’s economic and environmental impacts in Indonesia. This study assumes that nickel, which is usually exported, is absorbed by domestic economic activities, including being used in manufacturing batteries and electric vehicles in Indonesia. Our estimates include direct and indirect output, value-added, and employment changes. The same model is also used to estimate changes in emissions’ environmental costs. It is evident from the results that batteries and EV production are economically beneficial. Additional value-added is Rp. 100.57 trillion, 1.5% of GDP in 2010. At the same time, 538,658 additional jobs were created, which is about a 0.5% increase. Lastly, EV production will have extra external costs of emissions, around Rp. 2.23 trillion, or an increase of about 0.6%. Based on these findings, it is concluded that electric vehicle production increases productivity, gross value-added, and job creation with a relatively small impact on the environment. A limitation of this study is that we assumed EVs were produced for export only, and we did not assume a reduction in economic activities in the supply chain of conventional vehicles.
Graphical Abstract
Economic and Environmental Impact of Electric Vehicles Production in Indonesia.

Introduction
In the last decade, a transition from fossil fuel vehicles to electric-based vehicles in the last decade gained momentum. According to the International Energy Agency (2021), global energy use will continue to grow in all major end‐use sectors. The total final consumption (TFC) will increase by around 20% in 2020–50. The demand for fossil fuels will decrease, and the shift will be toward electricity, renewable power, and hydrogen. In 2050, electricity’s share will rise from 20 to 30% (Fig. 1). Transport accounts for the largest reduction in energy demand, thanks to a shift toward electric vehicles (EV), which are up to three times more energy-efficient than conventional internal combustion engines. According to International Energy Agency (2021), over 60% of the clean energy technology equipment market predicted will be battery-based in 2050. With over 3 billion electric vehicles on the road and three terawatt-hours of battery storage in 2050, batteries will play a key role in the new energy economy. They will also become the single largest source of demand for critical minerals, such as lithium, nickel, and cobalt (International Energy Agency 2021).

Source: International Energy Agency, (2021)
Final energy consumption by source and sector in the Net Zero Emission by 2050 Scenario.
Several countries worldwide have experienced a rapid increase in sales of electric vehicles over the last decade, especially in North America, Europe, and Asia. One of the determining factors for the success of electric vehicles in penetrating the market is the existence of policy support from the government (Yang et al. 2016).
Electric batteries are a critical component of an electric vehicle. They are the sources of energy to run the engine. This energy source is what distinguishes electric vehicles from conventional petrol-based vehicles. There are two types of electric batteries that are widely used today, lithium-ion (Li-ion) and nickel metal hydride (NiMH). Li-ion batteries use the metal elements lithium and cobalt as electrodes, while NiMH uses nickel. A global shift from petrol-based vehicles to electric vehicles will require a massive growth in the use of these metals. The EU released a detailed study, which projected that EVs would be the most significant driver of nickel demand over the next two decades, and the amount of nickel used in EV batteries will rise exponentially (Fraser et al. 2021). Based on Fraser et al. (2021), nickel demand for EVs is projected to rise from 92kt in 2020 to 2.6 Mt in 2040 globally. Karabelli et al. (2020) show that global e-mobility demand will boost battery production by 2030 to around 1725 GWh, with Ni being the dominant raw material in lithium-ion batteries. Currently, nickel use in batteries’ represents 4% of the annual global production. Karabelli et al. (2020) expect nickel demand for batteries would rise to 34% of current mining production in 2030.
Table 1 presents ten countries with the world’s largest nickel resources and reserves. The table shows that the ten countries have 77% of the global nickel resources and 90% of the world’s nickel reserves. It also shows that Indonesia has an important position as having the world’s second largest resource and the country with the largest reserves in the world. Indonesia’s nickel reserves are around 24% of the world’s total, of which 70% are in the form of nickel limonite. Indonesia is rich in these raw materials, an essential raw material in the EVs supply chain. This condition indicates that Indonesia has the potential to be superior in the global EV supply chain, especially in providing raw materials for the production of EV batteries.
To support its electric vehicle (EV) ambition and encourage the production of value-added products, including processing minerals such as nickel ore, the government has issued a policy through Presidential Decree No. 55/2019 regarding the acceleration of the program for battery electric vehicles for road transportation. This Presidential Decree was followed by the Ministry of Energy and Resources Regulation No. 11/2019 concerning the nickel ore export ban with the content below 1.7% Ni, which, combined with a ban on exports of high grade nickel in 2014, brought all exports of nickel ore to a halt by Indonesia. These documents show that Indonesia is ambitious to become Asia’s production hub for electric vehicles.
The main objective of this study is to examine the economic and environmental impact of electric vehicle production in the case of Indonesia. This objective is motivated by the desire to explore the implications of government policies as discussed above.
This paper’s structure is organized as follows—Section 2 first reviews earlier studies on the environmental and economic impacts of EV production. Section 3 explains that we used an input–output approach in this paper and describes the construction of the required database. Finally, Sect. 4 presents the results of this study, and Sect. 5 ends with a discussion and conclusions.
Literature reviews
Numerous studies have examined the economic and environmental impacts of producing and using electric vehicles in different countries. According to Winebrake and Green's (2009), plug-in electric vehicle usage in the USA will reduce gasoline demand by more than 41 billion gallons a year, household gasoline spending by about $118 billion, and household fuel costs by about $118 billion. This effect would increase the US economic output by $23 to $94 billion and create between 162 and 863 thousand jobs. Winebrake et al. (2017) also conclude that the transition from gasoline to electric vehicles had positive economic and job creation effects on the US economy.
Meanwhile, Mase’s (2020) study on the effects of electric vehicle production on Japanese industrial output has found positive and negative impacts of producing electric vehicles compared to internal combustion engine (ICE) vehicles. The effects depend on whether the supplier of electric engines for electric vehicles comes from a domestic source or from abroad. When electrical components were produced in Japan, the impact on the total industrial output was 1.1 trillion yen; however, when electrical components came from abroad, the impact was 4.9 trillion yen. Another study from Ribeiro (2020) for the case of the European Union shows that in the long term, investing in electric vehicles is profitable, both economically and environmentally. The shift will reduce fossil fuel dependence, increase GDP, and improve air quality.
International Energy Agency (IEA) data indicate that there were 4.79 million battery electric vehicles worldwide in 2019 (IEA 2020). According to IEA (2020), the number of EVs is growing rapidly, at about 36% annually, suggesting that there will be around 245 million EVs on the planet by 2030 (under the IEA scenario for sustainable development). Currently, nickel cobalt aluminum (NCA) and nickel manganese cobalt (NMC) are the most commonly used EV battery types, with nickel usage at 80% and 33%, respectively (Yusgiantoro et al. 2021). Thus, nickel is and will be one of the essential materials in the development of EV batteries. Therefore, Indonesia has an excellent opportunity to become one of the main players in the global EV supply chain, because 24% of global nickel reserves are in Indonesia, which makes Indonesia the country with the largest nickel reserves in the world.
However, the adoption of electric vehicles does not necessarily reduce emissions. Several studies have concluded that the environmental impact of developing electric vehicles will depend on the mix of power generation and its carbon intensity (Karplus et al. 2009). Hawkins et al. (2013) concluded that electric vehicles powered by coal-based electricity could reduce emissions such as PM2.5 but increase CO2 emissions. Doucette and McCulloch (2011) and ERIA (2020) find that countries like India, China, and Indonesia will not benefit from electric vehicle penetration unless they decarbonize their power plants. Furthermore, a study by Liu and Hildebrant (2012) in South Africa shows that air pollution rates are much worse. Every kilometer traveled by an electric vehicle produces 35–50 times more sulfur oxides than a conventional vehicle. Meanwhile, the carbon footprint of electric vehicles is estimated to be 17–16% higher than that of conventional vehicles. The reason for this is that 90% of the electricity in this country is generated using coal.
Moreover, several studies indicate that using electric vehicles combined with lower-carbon power generation will help reduce emissions drastically. ERIA (2020) found that deploying electric vehicles in Thailand, Malaysia, and Vietnam will significantly reduce emissions. In line with ERIA (2020), a study by Wu and Zhang (2017) for the case of Brazil claims that switching to electric vehicles can significantly reduce emission levels in the country. According to Wu and Zhang (2017), this emission reduction is possible due to Brazil’s low-carbon power generation; 75% of Brazil’s electricity comes from hydroelectricity, a cleaner energy source than fossil fuels.
In general, the literature above shows that the production and adoption of electric vehicles positively impact the economy. On the other hand, the literature also indicates that the production and adoption of electric vehicles will not reduce emissions significantly if there is no support from a policy of generating electricity with a more environmentally friendly energy mix as a supporting infrastructure for electric vehicles.
Methodology and data
We use the input–output analysis to examine the economic and environmental impacts of electric vehicle production in Indonesia. The economic impact can be seen in output, value-added, and employment changes. To estimate the environmental impact of this electric vehicle production, we add emission vectors based on the input–output sector classification. In addition, two new sectors were also included: the electric vehicle battery (EVB) sector and the electric vehicle (EV) sector, based on input coefficients, labor inputs, and emission levels found in previous reports and studies. The following chart summarizes the methodological steps involved in answering the research questions of this study (Fig. 2).

Research methodological flowchart
The next section will provide a more detailed discussion of the methodological steps of the study.
Rationale for choosing an input–output approach
There are at least three main approaches used to estimate the broad or general socioeconomic impact of economic change: the input–output (I–O) model, the social accounting matrix (SAM) model, and the computable general equilibrium (CGE) model. The IO approach is the most commonly used of these models and the least expensive but suffers from the constraints of fixed prices, fixed coefficients for inputs, outputs, and extensions which can only be assumed in short-term time frames. SAM is an extension of the IO model but relates, among others, an income paid to employees at different skill levels to final consumption, which allows assessing distributional impacts. The use of CGE models allows for overcoming many of the constraints of the IO model. Such models allow for assessing multi-directional sectoral impacts and can capture dynamic effects by taking into account a.o. price and substitution elasticities (White and Patriquin 2003). Using a CGE model would give a complete insight into economic change. CGEs have more extensive data requirements, such as price and substitution elasticity’s for the new battery and EV production sectors. Such data are difficult to obtain, and our more straightforward IO approach, which is much easier to implement, still gives a good, static first-order analysis of the implications for the Indonesian economy.
Principles of the input–output approach
In IO analysis, a fundamental assumption is that the inter-industry flows from sector i to sector j in a specific period (usually a year) depends entirely on the total output of sector j for that same period. (Miller and Blair 2009; Heinuki 2017). With the set of fixed technical coefficients, the balanced equation for the IO model is expressed as:
where z is the gross output vector, A is the input coefficients matrix, and y is the final demand vector. The input coefficients aij are obtained as aij = dij/zj, where dij denotes the domestic intermediate supply of intermediate inputs i (in million rupiahs) to industry j.
Equation (1) can be rewritten to be (I–A) X = y, where I denotes the identity matrix. Expressing the gross outputs in terms of final demands yields X = (I–A)−1 y as the solution of the input–output model where (I–A) −1 is the Leontief inverse (L). Since the model is linear, we can rewrite it as ∆X = (I–A)−1∆y = L∆y giving the extra gross outputs corresponding to an arbitrary vector ∆y of extra final demand (e.g., electric vehicles).
Value-added (VA) is the primary input which is the part of the overall input. Following the basic assumptions used in preparing the I-O table, the relationship between VA and output is linear. It implies that an increase or decrease in output will be followed proportionally by an increase and decrease in VA. The relationship can be described in the following equation:
where V is value-added, and \(\widehat{V}\) is the diagonal matrix of value-added.
To see the impact of ∆y on employment creation, the employment coefficient vector (e) is constructed as ej/xj, where ej denotes the employment opportunity provided by the sector j, and we get the change in employment due to the change in domestic final demand as follows:
Similarly, the impact on pollution and related external costs can be calculated. If emissions per unit output of a sector and the external costs of each emission are known and combined to a pollution coefficient (p), the changes in external cost from such emissions can be calculated as follows:
Δp in Eq. (4) is treated as a function of final demand, i.e., the total pollution from all sources supported by the economy in order to reach the final demand.
Construction of the basic Indonesian extended Input–Output table
In estimating the economic and environmental impact of electric vehicle production, we used the Indonesian Input–Output Table (IIOT) of 2010 from the Indonesian Central Bureau of Statistics (BPS). Since the IIOT has no environmental extensions, we used emission information on Indonesia from EXIOBASE, a comprehensive Global Multi-regional Environmentally Extended Input–Output (GMRIO) database developed by a European research consortium (Stadler et al. (2018). We mapped this emission data on the common, aggregated version of IIOT and EXIOBASE of 86 sectors and aggregated the highly detailed emission set from EXIOBASE to emissions of 34 individual substances. We further calculated the external costs related to the emissions of each sector and will in this study further express environmental impacts as externalities. This procedure has been described in detail in Pirmana et al. (2021), and we refer further to this reference.
Addition of a battery and EV production sector to the Indonesian input–output table
We want to analyze the economy-wide impact of a diversion of raw materials exported to the production of car batteries and EVs in Indonesia. However, the IIOT (nor EXIOBASE) contains specific production sectors. We, therefore, constructed two new sectors in the 86 sector IIOT. The input and output coefficients of these sectors were estimated as follows (details are provided in Appendix): We concentrate here on the coefficients of monetary inputs, including value-added creation, labor input, and environmental extensions of battery and EV production, assuming these sectors will have only batteries and EVs as output.
Input coefficients
-
1.
The initial input structures for the electric vehicle sector and the battery for electric vehicles are taken from the conventional vehicle sector and conventional battery industries from the original IIOT.
-
2.
Next, modifications were made to the input structure by utilizing information from the results of studies/publications related to the input structure of the two new sectors.
-
3.
For the motor vehicle industry, modification of the input structure of conventional vehicles is carried out by utilizing information on the cost structure of electric vehicle production from a study conducted by ERIA (2020) (see Figure A1 in Appendix 1). Based on ERIA (2020) information, we estimate the electric vehicle industry’s input structure by mapping the sector classification related to the cost structure of the electric vehicle industry in the 86 IIOT classification and put the input structure values into the related sectors.
-
4.
The modification of the input coefficient from the conventional battery industry to the input structure of the electric vehicle battery is carried out by utilizing some information from various relevant sources (e.g., Sakti 2015; Qnovo 2016; Tsiropoulos et al. 2018; Campbell 2019).
-
5.
According to Tsiropoulos et al. (2018), the breakdown of the total cost of EV batteries consists of material costs, operating surplus, capital, and labor cost. The material costs consist of raw materials and other materials costs. To obtain an estimate of the input coefficient for each raw material, we multiply the share of each input by the proportion of the total raw material cost for producing the EV battery, using information from Campbell (2019) with assumptions for the raw material cost per 64 kWh EV battery. As for the proportions of other materials, the distribution of the input coefficients is based on the classification of sectors related to the production of EV batteries from the study of Sanfelix et al. (2016). The study contains a detailed list of inventory components to the industrial sector in the manufacture of cells, battery control units, and modules (see Appendix 2 for details).
-
6.
As for the output row, the final demand is only accounted for, assuming there is no intermediate demand for electric vehicles and batteries for electric vehicles by each industry.
-
7.
The input coefficients include imports. To accurately determine the inducement of domestic production, we deducted the inducement of imports by subtracting the input structure in the total transaction table from the inputs originating from imports.
-
8.
The electric vehicle body is assumed to be the same as a conventional vehicle.
Labor input
Since the IIOT does not contain employment tables, we created an employment table for each sector based on the National Labor Force Survey (SAKERNAS) from the Indonesian Central Bureau of Statistics. However, the statistics on the number of employees are categorized into only 63 industries. Therefore, to split into 88 industries in the input–output tables in this study, generally, we estimate them with the following procedure (see the detailed procedure in Appendix 3).
-
1.
The total labor income in the input–output table is divided by the number of employees of the SAKERNAS database statistics to calculate income per employee.
-
2.
We estimate the income per employee in the SAKERNAS and the input–output category based on the Indonesia employment table with the more detailed industry category. By multiplying the income per capita in the SAKERNAS category by the income ratio among industries in Indonesia, we get the income by sector, reflecting wage differences among industries.
-
3.
Next, we divide the labor income by the income per employee to calculate the number of employees in the input–output category.
-
4.
Lastly, we treated them by multiplying the adjustment factor so that the total number of employees in the input–output category matches the number in the SAKERNAS category. Then, the employment intensities are calculated based on the estimated employment table. Furthermore, the changes in employment induced by final demand are measured by multiplying those of production by employment intensities.
-
5.
The employment intensities for the new sectors are assumed to be the same as the employment intensities of conventional electric vehicles and the conventional battery sector.
Environmental extensions
Besides input and employment coefficients, to estimate the environmental impact of battery and EV production, the study also needs the coefficient of the external cost from emissions. As mentioned above, the procedure to estimate the external cost value has been described in Pirmana et al. (2021), and we refer further to this reference. The value of the coefficient of external costs of emissions for the two new sectors is assumed to be the same as the coefficient of the conventional vehicle and the conventional battery industry.
Scenario assumptions
With an input–output table now available for Indonesia that includes a battery and EV production sectors, the economic and environmental impacts of the production of electric vehicles are carried out using the following assumptions:
-
In line with the government’s policy prohibiting nickel ore export, this study assumes that this nickel ore is 100% absorbed by domestic economic activities.
-
The electric vehicle batteries produced are assumed to be of the NCA type (the type of battery with the highest nickel content)
-
In this study, the production of electric vehicles is assumed only to be exported and not to substitute the use of conventional vehicles in the country, so there is no reduction in the production of conventional vehicles and petrol use.
-
The analysis is limited to the production phase. The modeling in this study does not involve an impact analysis on the use phase of the produced EVs since it is assumed that all EVs are exported, and we focus on impacts in Indonesia.
Results and discussion
Figure 3 depicts the overall results of the economic and environmental impacts of EV production in Indonesia. To absorb nickel ore into domestic activities, including as an input in EV production, the economy must generate a final demand for EVs of around Rp. 135.35 trillion. Furthermore, assuming the electric vehicle to be produced is a Tesla Model 3 with a unit price of $23,300 or Rp. 212 million (converted using the $/Rp exchange rate in 2010). Every year, approximately 639,672 electric vehicles are produced.

Source: Authors calculation
Economic and environmental impact of electric vehicle production.
According to our calculations, using nickels in new economic activities benefits the Indonesian economy. In this study, we assumed Indonesia would expand its economic activities, so this was a logical outcome.
The following industries would benefit the most from nickel use in their manufacturing processes:
Manufacturing of automobiles, trailers, and semi-trailers; mining of aluminum ores and concentrates; mining of chemicals and fertilizer minerals; salt production; and other mining and quarrying sectors.
The motor vehicle, trailer, and semi-trailer manufacturing sector will see a 22% increase in output, which is possible because the vehicle body produced by this sector is one of the inputs required to manufacture electric vehicles. Meanwhile, the mining of aluminum ores and concentrates is about 19.6%; and the mining of chemical and fertilizer minerals sector is around 4.2% (Table 2).
The additional output created in the economy due to the final demand of the electric vehicle sector is Rp. 244.75 trillion (1.88%). The highest additional output in the economy from the final demand for the electric vehicle sector is the electric vehicle sector itself and the sectors directly related to the EV production chain (Table 3).
The ten sectors with the highest additional output account for about 86% of the total additional output in the economy. More than half of the additional output came from the EV sector, contributing 135.35 trillion or almost 55% of the total additional output. Electric vehicle battery is the second largest sector, with an additional output of 10% of the total additional output, followed by the manufacture of motor vehicles, trailers, and semi-trailers sector of 9.2%; manufacture of rubber and plastic products of 2.8%; and mining of chemical and fertilizer minerals, production of salt, other mining and quarrying n.e.c., about 2.3%.
In terms of added value, driven by the final demand for the EV sector, the additional value-added in the Indonesian economy was Rp. 100.57 trillion, or approximately 1.5%. Looking at the changes in value-added by sectors in Table 4, over 88 sectors, almost 75% of the additional value-added comes from the top ten sectors. The electric vehicle sector contributes about 47% of the additional value-added created in the economy, followed by the manufacture of motor vehicles, trailers, and semi-trailers sector at 11%; electric vehicle battery about 9%; mining of chemical and fertilizer minerals, production of salt, other mining and quarrying n.e.c. of 4.5%.
Another economic impact of EV production is the creation of new jobs. EV production creates 538,658 new jobs in the economy, representing a 0.5% increase. Approximately, 85% of the additional employment comes from the ten industries with the greatest increase in employment (Table 5). The electric vehicle battery and the electric vehicle sector contributed 8% and 6%, respectively, to additional employment in the economy.
Sectors such as the sale, maintenance, repair of motor vehicles, motor vehicles parts, motorcycles, motorcycles parts, and accessories and the wholesale trade, except for the motor vehicles and motorcycles sector, are in the top ten sectors with additional output, added value, and labor, as a result of the production of electric vehicles in Indonesia. However, if we look at the percentage of the total effect, it is only small on the overall impact. Moreover, in this study, the production of electric vehicles is intended only for export purposes and not intended to replace the use of conventional domestic vehicles. So the addition of the electric battery and electric car industries does not significantly change the economic structure, especially when viewed from the technical coefficient of the Indonesian economy, as indicated by the distribution of technical coefficients before the addition of the two sectors. The existence of a new sector does not significantly impact other sectors. In addition, the magnitude of the export of electric vehicles is still relatively small compared to the entire economy.
The main motivation for developing electric vehicles in Indonesia is to reduce emissions and the number of fuel imports, as outlined in the release of the 2019 Presidential Decree (ERIA 2020). However, this study only estimates the environmental impacts of emissions in the production phase expressed as external costs concerning the assumption that all EVs are exported. The final demand for the EV sector turned out to cause additional external costs from emissions with a monetary value of Rp. 2.2 trillion or only 0.6%. We can conclude that in comparison with the total new emissions in the economy, the additional direct emissions resulting from the processing of nickel ore in domestic activities are relatively small (see Supplementary Information for details).
The top ten sectors with additional external costs from emissions account for about 89% of the total additional external costs due to the final demand for the EV sector (Table 6). Of the ten highest sectors, the top three consecutively are rubber and plastic products sector, the manufacturing of basic iron, steel, ferro-alloys, and first products thereof, and the electricity sector contributes to almost 75% of the total additional external costs. The six sectors in the top ten additional external costs from emissions in Table 6 are also in the ten sectors with the highest external costs in the economy due to final demand before the electric vehicle and electric vehicle battery sectors existed (see Pirmana et al. 2021). Meanwhile, the activities of the two new sectors also generated external costs from emissions, from the electric vehicle sector of 78.60 billion (3.5%) and the electric vehicle battery industry of 7.76 billion (0.4%).
If we break down this additional emission based on the type of pollutant, SOx, CO2, and NOx are the primary sources of additional emissions due to the final demand in the EV sector (Table 7). The additional emissions from these three pollutants accounted for 58% of the total additional emissions, with SOx contributing around 26%, CO2 at 18%, and NOx at 14%.
This paper examines the impact of the nickel export ban policy and the policy to accelerate the development of electric vehicles as part of Indonesia’s ambition to become the country’s electric vehicle production hub, particularly in Asia. It may be the first attempt to explore this policy’s economic and environmental impacts, hence enriching the existing literature and, in particular, providing an initial overview of the positive or negative impacts of the policies adopted.
EVs have no direct emissions, which, if they replace traditional vehicles domestically, can potentially reduce external costs, depending on the carbon intensity of electricity used. Using EVs domestically may lead to lower production of conventional vehicles and lower the gains in jobs and value-added. Such wider use of EVs exists in the roadmap to accelerate the development of Indonesian electric vehicles. However, the limitation of this study is related to the simulation scenario, which only looks at the impact of the production phase of electric vehicles, not with a simulation that accommodates the impact of the policy on the phase of using electric vehicles to replace/reduce the use of conventional vehicles. We also realize that developing the industry in the context of only battery raw materials cannot be justified until other back-end scenarios. However, these possibilities must be explored and disseminated through research articles and other exploratory studies. Future studies should also include a more detailed assessment of these economic and environmental impacts from the standpoint of the usage phase, which can also overcome the limitations of the approach used in this study, for example, by using simulations based on a computable general equilibrium (CGE) approach. The CGE approach allows the calculation results to be used to determine the gain and pain in the economy resulting from changes or policies at the macro- and sectoral levels.
Conclusions
This study is an initial attempt to analyze the economic and environmental impacts of electric vehicle production in Indonesia. In conclusion, we found that electric vehicle production positively boosts output, value-added growth, and job creation. Based on the calculation results, additional output, value-added, and labor due to the final demand for the electric vehicle sector, respectively, amounted to 1.87%, 1.5%, and 0.5%. It should be noted that the simulation of this study uses the 2010 input–output tables. The Indonesian economy’s current outputs and value-added generated is about 2.25 times higher than in 2010. Stimulating EV production in Indonesia would still contribute to economic growth, given that it comes just from one sector. The ambition of the Indonesian government to use its large nickel reserves to stimulate fast-growing upstream user industries, like battery and EV production, to locate themselves in Indonesia hence makes sense. However, on the negative side, this study finds that additional battery and EV production lead to additional external costs from emissions, albeit in insignificant amounts.
The following are the main findings of this study:
-
Several sectors in the economy will experience output growth in line with the production of electric vehicles in Indonesia. The manufacturing of motor vehicles, trailers, and semi-trailers and the mining of aluminum ore and concentrates sectors are the two sectors with the highest growth if there is electric vehicle production activity in Indonesia.
-
Besides the new output from the electric vehicles and the electric vehicle battery sectors, the significant additional output in the Indonesian economy also comes from the additional output in its conventional vehicle sector, with a contribution of 9%. The additional output from these three sectors to the additional output in the economy is around 86%.
-
Suppose there is a production of electric vehicles in the Indonesian economy; the significant additional value-added will also come from the electric vehicle sector, battery production for electric vehicles, and the conventional vehicle sector. Approximately, 67% of the additional value-added in the economy comes from these three sectors.
-
The production of electric vehicles in Indonesia will generate an additional 0.5% of jobs. 14% of the additional jobs in the economy come from the electric vehicle and electric vehicle battery sectors.
-
The existence of the electric vehicles industry in Indonesia has only led to a relatively small increase in emissions. The increase is only 0.6%. Only 4% of the additional emissions originally come from the electric vehicle sector and the electric vehicle battery sector. In addition, based on the type of pollutant, the primary sources of these additional emissions are SOx, CO2, and NOx.
Data availability
All data generated or analyzed during this study are included in this published article [and its supplementary information files].
References
Campbell C (2019) Lithium-ion Battery Cells: Cathodes and Cost. https://thedeepdive.ca/lithium-ion-battery-cells-cathodes-and-costs. Accessed 12 September 2021
Doucette RT, McCulloch MD (2011) Modeling the prospects of plug-in hybrid electric vehicles to reduce CO2 emissions. Appl Energy 88(7):2315–2323. https://doi.org/10.1016/j.apenergy.2011.01.045
ERIA (2020) The Influence on Energy and the Economy of Electrified Vehicle Penetration in ASEAN. ERIA Research Project Report 2020, No. 14. https://www.eria.org/publications/the-influence-on-energy-and-the-economy-of-electrified-vehicle-penetration-in-asean/. Accessed 17 October 2021
Fraser J, Anderson J, Lazuen J, Lu Y, Heathman O, Brewster N, Bedder J, Masson O (2021) Study on future demand and supply security of nickel for electric vehicle batteries, Publications Office of the European Union, Luxembourg, ISBN 978-92-76-29139-8, https://doi.org/10.2760/212807, JRC123439
Hawkins TR, Singh B, Majeau-Bettez G, Strømman AH (2013) Comparative environmental life cycle assessment of conventional and electric vehicles. J Ind Ecol 17(1):53–64. https://doi.org/10.1111/j.1530-9290.2012.00532.x
Hienuki S (2017) Environmental and Socio-Economic Analysis of Naphtha Reforming Hydrogen Energy Using Input-Output Tables: A Case Study from Japan”. Sustainability 2017(9):1376. https://doi.org/10.3390/su9081376
International Energy Aagency (2020), Global EV Outlook 2020, IEA, Paris https://www.iea.org/reports/global-ev-outlook-2020
International Energy Agency (2021) Net Zero by 2050: A Roadmap for the Global Energy Sector, OECD Publishing, Paris, https://doi.org/10.1787/c8328405-en. Accessed 27 April 2022
Karabelli D, Kiemel S, Singh S, Koller J, Ehrenberger S, Miehe R, Weeber M, Birke K P (2020) Tackling xEV Battery Chemistry in View of Raw Material Supply Shortfalls. Frontiers in Energy Research, 8. https://doi.org/10.3389/fenrg.2020.594857
Karplus VJ, Paltsev S, Reilly JM (2009) Prospects for Plug-in Hybrid Electric Vehicles in the United States and Japan: A General Equilibrium Analysis. Joint Program Report Series Report 172. http://globalchange.mit.edu/publication/14349
Liu X, Hildebrandt D, Glasser D (2012) Environmental impacts of electric vehicles in South Africa. South African Journal of science, 108(1), 1–6. https://doi.org/10.4102/sajs.v108i1/2.603
Lowe M, Tokuoka S, Trigg T, Gereffi G (2010) Lithium-ion Batteries for Electric Vehicles: The U.S. Value Chain. https://doi.org/10.13140/RG.2.1.1421.0324
Mase T (2020) Impacts of producing electrically driven vehicles on Japan industrial output. 27th International Input-Output Association Conference. https://criepi.denken.or.jp/en/serc/researchers/profile/t-mase.html. Accessed 22 September 2021
Miller RE, Blair PD (2009) Input-Output Analysis: Foundations and Extensions, 2nd edn. Cambridge University Press, Cambridge
Pillot C (2017) The rechargeable battery market and main trends 2016–2025. In Proceedings of the 33rd Annual International Battery Seminar & Exhibit, Fort Lauderdale, FL, USA (Vol. 20). http://cii-resource.com/cet/FBC-TUT8/Presentations/Pillot_Christophe.pdf. Accessed 18 October 2021
Pirmana V, Alisjahbana AS, Yusuf AA, Hoekstra R, Tukker A (2021) Environmental costs assessment for improved environmental-economic account for Indonesia. J. Clean. Product. 280, 124521. https://doi.org/10.1016/j.jclepro.2020.124521
Qnovo (2016). The Cost Components of a Lithium Ion Battery. Retrieved from https://qnovo.com/82-the-cost-components-of-a-battery
Revindo MD, Alta A (2020) Trade and Industry Brief. Seri Analisis Ekonomi, LPEM, Universitas Indonesia. Retrieved from https://www.lpem.org/wp-content/uploads/2020/01/TIB-Januari-2020.pdf
Ribeiro AFCMO (2020) Electric cars impact in the economic growth and the CO2: case of European Union. Dissertação de Mestrado. Universidade de Lisboa. Instituto Superior de Economia e Gestão. https://www.repository.utl.pt/handle/10400.5/21097. Accessed 23 November 2021
Sakti A, Michalek JJ, Fuchs ERH, Whitacre JF (2015) A techno-economic analysis and optimization of Li-ion batteries for light-duty passenger vehicle electrification. J Power Sources 273:966–980. https://doi.org/10.1016/j.jpowsour.2014.09.078
Sanfélix J, De la Rúa C, Schmidt JH, Messagie M, Van Mierlo J (2016) Environmental and Economic Performance of an Li-Ion Battery Pack: A Multiregional Input-Output Approach. Energies, 9(8). https://doi.org/10.3390/en9080584
Stadler K, Wood R, Bulavskaya T, Södersten CJ, Simas M, Schmidt S, Usubiaga A, Acosta-Fernández J, Kuenen J, Bruckner M, Giljum S, Lutter S, Merciai S, Schmidt JH, Theurl MC, Plutzar C, Kastner T, Eisenmenger N, Erb KH, de Koning A, Tukker A (2018) EXIOBASE 3: Developing a time series of detailed environmentally extended multi-regional input-output tables. J Ind Ecol 22(3):502–515. https://doi.org/10.1111/jiec.12715
Tsiropoulos I, Tarvydas D, Lebedeva N (2018) Li-ion batteries for mobility and stationary storage applications. EUR 29440 EN, Publications Office of the European Union, Luxembourg, ISBN 978–92–79–97254–6, doi:https://doi.org/10.2760/87175, JRC113360. https://publications.jrc.ec.europa.eu/repository/handle/JRC113360
White B, Patriquin M (2003) A Regional Economic Impact Modeling Framework Paper Presented to the XII World Forestry Congress, September 21–28, Québec City, Canada. http://cfs.nrcan.gc.ca/pubwarehouse/pdfs/26898.pdf. Accessed 23 October 2021
Winebrake JJ, Green E, EPRI (2009), Regional Economic Impacts of Electric Drive Vehicles and Technologies: Case Study of the Greater Cleveland Area. EPRI and The Cleveland Foundation: Palo Alto, CA. https://www.epri.com/research/products/1018579. Accessed 16 October 2021
Winebrake JJ, Green E, Carr E (2017) Plug-in Electric Vehicles. Economic Impacts and Employment Growth. Energy and Environmental Research Associates. https://caletc.aodesignsolutions.com/assets/files/EERA-PEV-Economic-Impacts-and-Employment-Growth.pdf
Wu Y, Zhang L (2017) Can the development of electric vehicles reduce the emission of air pollutants and greenhouse gases in developing countries? Transp Res Part d: Transp Environ 51:129–145. https://doi.org/10.1016/j.trd.2016.12.007
Yang Z, Slowik P, Lutsey N, Searle S (2016) Principles for Effective Electric Vehicle Incentive Design. The International Council on Clean Transportation Retrieved from https://www.theicct.org/sites/default/files/publications/ICCT_IZEV-incentives-comp_201606.pdf
Yusgiantoro LA, Hanan A, Sunariyanto BP, Swastika MB (2021) Mapping Indonesia’s EV Potential in Global EV Supply Chain; Purnomo Yusgiantoro Center: Daerah Khusus Ibukota Jakarta, Indonesia. https://doi.org/10.33116/br.004
Acknowledgements
This research was funded by the Lembaga Pengelola Dana Pendidikan (LPDP), grant number PRJ-1461/LPDP.3/2016, Ministry of Finance, Republic of Indonesia, is part of the first author's doctoral scholarship at the Institute of Environmental Sciences (CML), Faculty of Science, Leiden University, Netherlands.
Author information
Authors and Affiliations
Corresponding author
Additional information
Publisher's Note
Springer Nature remains neutral with regard to jurisdictional claims in published maps and institutional affiliations.
Electronic supplementary material
Below is the link to the electronic supplementary material.
Appendices
Appendix 1
Information to adjust the input coefficient of the electric vehicle sector
The following are the steps in calculating the electric vehicle input coefficient (See detail in Supplementary Information):
-
1.
The new coefficients for the electric vehicle sector are derived from existing input coefficients of the conventional motor vehicle manufacturing sector from the Indonesian input–output table for 86 sectors.
-
2.
The domestic share is taken from the ratio of the domestic inputs to total inputs from the cost structure of the conventional vehicle industry, where the input is divided into inputs from domestic sources and imports.
-
3.
Adjustment of the input coefficients column is carried out by utilizing information on input structure for electric vehicles from ERIA (2020) in Fig.
Fig. 4 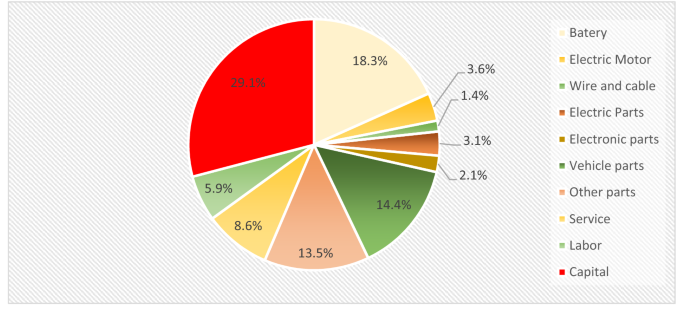
Source: Adopted from ERIA 2020
Input structures for electric vehicle sectors.
4 or see SI in worksheet EV cost structures cell A8. Based on ERIA (2020), the electric vehicle sector’s input structure consists of about 65% intermediate inputs, and primary input (VA) is about 35%. Figure 4 shows the breakdown of these EV input structures.
-
4.
Next, an adjustment is made from the total intermediate input of the conventional vehicle industry to the intermediate input of the electric vehicle industry by changing the share of the total intermediate input of the conventional vehicle industry to the total intermediate input of the electric vehicle industry. The same is also done for the intermediate input component originating from imports. The consequence is that there is a change in the share of the intermediate input component of conventional vehicles, which is the basis for the cost structure of the Indonesian electric vehicle industry.

Appendix 2
Information to adjust the input coefficient of the electric vehicle battery sector
The following are the steps for calculating the input EVB structure in this study:
-
1.
Domestic share is taken from the ratio of domestic inputs to total inputs from the cost structure of the conventional battery industry in table IIOT 86.
-
2.
Information to structure the EVB input is obtained from several sources. Initial information is taken from the study of Tsiropoulos et al. (2018). Based on their study, the breakdown of the total cost of the battery for intermediate inputs (materials) is 64%, and for primary inputs is 36% (see Fig.
Fig. 5 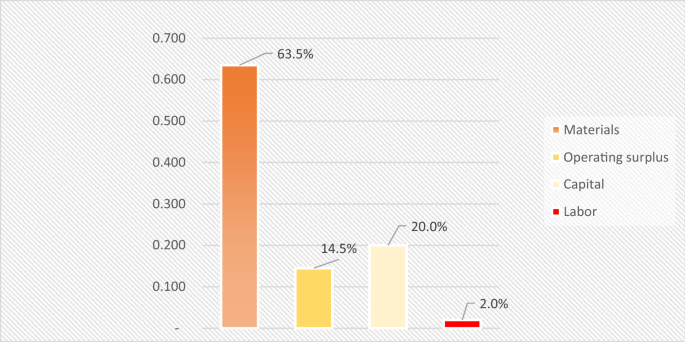
Source: Adopted from Tsiropoulos et al. (2018)
Breakdown of the total cost of the battery in key components.
5). However, in Tsiropoulos et al. (2018) study, the intermediate inputs from raw materials and other materials are not separated. In this study, we utilize the information from studies conducted by Lowe et al. (2010), Sakti et al. (2015), and Pillot (2017), which state that the proportion of raw materials is 50–52% of the total cost of producing an EV battery. Meanwhile, detailed information regarding the composition of raw materials for producing EV batteries is taken from Campbell (2019), as shown in Table
Table 8 Raw material costs per 64kWh EV Battery 8.
-
3.
After we know the share of each raw material cost to the total costs structure, adjustments are made from the total intermediate input of the conventional battery to the intermediate input of the electric vehicle battery industry. The adjustment is made by changing the share of the total intermediate input of the conventional battery industry to the total intermediate input of the electric vehicle battery industry. The same steps are also performed for the intermediate input components from imports. Consequently, there is a change in the share of the intermediate input components of a conventional battery. This result is the basis for the cost structure of the electric vehicle battery industry in Indonesia.

Appendix 3
Creating an employment table
To analyze the ripple effect of electric vehicle production activity on employment, we created an employment table for each sector based on the International Labor Organization (ILO) ILOSTAT database because IIOT does not contain an employment table. However, the number of employees who fall into the category is only for 63 industries. Therefore, to split into 88 industries in the input–output tables in this study, we estimate them with the following procedure. First, for each industry (i) in the ILO category, the total labor income (Yij) in the input–output table is divided by the number of employees (Li) of the ILO statistics to calculate income per employee (wi).
Next, we estimate the income per employee in the ILO category (\({w}_{i}^{J}\)) and the input–output category (\({w}_{ij}^{J}\)) based on the Indonesia employment table with the more detailed industry category. By multiplying the income per capita in the ILO category by the ratio of income among industries in Indonesia, we get the income (wij), reflecting wage differences among industries.
Then, we divide the labor income by the income per employee to calculate the number of employees (Lij) in the input–output category.
Finally, we treated them by multiplying the adjustment factor (ai) so that the total number of employees in the input–output category matches the number in the ILO category. In this study, we use Leij as the number of employees in the ILO category.
Then, the employment intensities are calculated based on the estimated employment table. The changes in employment induced by final demand are measured by multiplying those of production by employment intensities.
Rights and permissions
Open Access This article is licensed under a Creative Commons Attribution 4.0 International License, which permits use, sharing, adaptation, distribution and reproduction in any medium or format, as long as you give appropriate credit to the original author(s) and the source, provide a link to the Creative Commons licence, and indicate if changes were made. The images or other third party material in this article are included in the article's Creative Commons licence, unless indicated otherwise in a credit line to the material. If material is not included in the article's Creative Commons licence and your intended use is not permitted by statutory regulation or exceeds the permitted use, you will need to obtain permission directly from the copyright holder. To view a copy of this licence, visit http://creativecommons.org/licenses/by/4.0/.
About this article

Cite this article
Pirmana, V., Alisjahbana, A.S., Yusuf, A.A. et al. Economic and environmental impact of electric vehicles production in Indonesia. Clean Techn Environ Policy 25, 1871–1885 (2023). https://doi.org/10.1007/s10098-023-02475-6
Received:
Accepted:
Published:
Issue Date:
DOI: https://doi.org/10.1007/s10098-023-02475-6