Abstract
Urban tourism has developed into one of the most efficient and effective economic and recreational activities in the modern era since the late second half of the twentieth century. Although attention to urban tourism development is increasing, this paper indicates that no comprehensive study has yet combined the two subjects of tourism development and branding for spatial modeling. Thus, for assessing urban tourism potential (AUTP), a novel hybrid modeling approach combining K-mean, fuzzy logic, and an artificial neural network (ANN) was used. The findings indicate that in Tabriz metropolis, areas 3 and 7 and the southwestern portion of region 6 have the most significant potential for urban tourism. In contrast, areas 4, 8, and 10 located within the worn-out urban fabric have the least potential for tourism. Subsequently, by examining the correlation between urban tourism conditioning factors (UTCFs) and tourism maps, it was determined that factors including distance from the catering centers, distance from the fault, quality of construction materials, distance from the historical centers, distance from the health centers, maximum temperature, and distance from the parking are the most critical in terms of increasing urban tourism's potential and branding. The analyses conducted in this study provide valuable and practical information for developing future strategies urban tourism. To this end, recommendations have been made to enhance tourism destination service delivery and management through branding.
1 Introduction
Tourism has grown exponentially in recent decades due to advancements in the travel process, transportation industry, and revenue growth. Tourism is one of the most dynamic economic sectors today, having a significant impact on society's economic, social, and cultural activities [1]. Since the 1980s, urban management has taken on a new form, characterized by a liberal [2] urban policy grounded in economics and creative consumption. The surge in interest in urban tourism has significantly altered tourism trends and methods [3]. Today, urban areas worldwide are among the most important destinations for tourism [4]. Thus, cities cultivate elegance and competition to attract economic development and prosperity. However, the development of tourism in many countries has been threatened by neoliberal strategies. Tourism can have a lasting positive impact on the environment, society, culture, politics and economy if it is carefully managed. Hence, in the twenty-first century, the tourism industry has become a way for societies to thrive and countries to overtake and compete. As a result, governments have considered the development of sustainable and beneficial tourism as a multifaceted mechanism, which can play a colorful role in the development of territorial space. Thus, by attracting capital, tourists and by expanding tourism markets in line with technological advancements, tourism could attract foreign competition and establish social welfare while branding the local area [5]. Urban tourism management and planning are integrated into governments' macro-socio-economic policies, allowing local managers to impact the tourism industry directly [6]. Hence, as a critical activity of local governments, tourism policy should be explained in terms of a society's economic and social goals, resulting in a balanced relationship between tourism supply and demand [7]. Frequently, unplanned tourism in cities results in the degradation of the natural environment, cultural heritage, laws, and culture of the community, plus detrimental effects on the citizens' quality of life [8]. As a result, one of the primary goals of urban planners is to identify potential tourism areas to implement space policies in cities that predict the desired level of social welfare consistent with the sustainable development of tourism [9]. Consequently, cities with standard spaces and amenities can attract a large number of tourists. Because the space of cities should be attractive not only for its citizens but also for tourists and express the special identity and characteristics of that city. Recent years have been an exciting time for tourists interested in urban tourism [10]. While the global coronavirus outbreak significantly reduced domestic and international tourism and posed a severe threat to the industry [11]. Consequently, the COVID-19 virus has been the most influential crisis to affect countries, organizations, and various economic sectors since World War II [12]. Although, short- or long-term measures and adequate planning are considered critical in compensating for the epidemic's damage and mitigating its negative consequences through tourism development [13]. Hence, branding potential tourism destinations in cities are crucial for economic differentiation today, affecting physical growth and economic competition [14].
As a complementary process, branding the potentials of urban tourism endows the city with a distinct identity and contributes significantly to the competitiveness approach in cities, which is now referred to as the primary link in the economic structure [15]. Hence, in the field of tourism, there is a powerful tool in the hands of officials that can help attract visitors, tourists and investors and bring economic growth and prosperity to the city [16]. The city brand raises the growing understanding, recognition and respect of being in a place as a resident, tourist, businessman or student, focusing on helping all public, private and non-private organizations whose livelihood depends on the image and reputation of the city. Until the 1990s, few studies on the identification of potential tourism areas had been published. However, numerous studies on the development and expansion of the tourism process at regional, national, and international levels have been presented more recently. Pearce [17] developed an integrated trend for urban tourism in a study by identifying thematic cells in terms of region, city, national, and international levels plus its various aspects, including supply and demand. Asadi [18] conducted a three-phase study on the optimal policies for urban tourism in Iran (entry levels, implementation, and decision making). While providing management approaches at urban and regional levels may be one of the study's strengths, using questionnaire techniques and presenting results using non-spatial analysis (survey and descriptive) are significant weaknesses. Liaghat et al. [19] examined the identification of coastal tourism hotspots, emphasizing the importance of urban tourism development. However, the use of expert weights based upon personal judgments casts doubt on the study's findings.
Blasco and Prats [20] used a consumer-based approach to examine the zoning of a tourist destination, utilizing GIS techniques and hierarchical cluster analysis based on time intervals between attractions. In another study, Li et al. [21] investigated the ability of GIS and statistical methods to identify functional areas of tourism by examining the existence of a spatial relationship between various elements of urban tourism. The study mapped hotels, analyzed land use characteristics, and investigated a variety of Hong Kong's tourist attractions. However, the study suffered from a lack of consideration for other essential aspects of urban tourism, including social, environmental, and other related factors.
Ghaed Rahmati and Daneshmandi [22] used a descriptive-analytical method to identify new urban tourism destinations in Isfahan. The study categorized urban tourism destinations into four categories: natural, historical and cultural, recreational, and residential, a valid and reliable classification for presenting urban tourism data. Brouder [23] examines the improvement of new processes for the development of tourism after the COVID-19 epidemic. The results of his study indicate the emergence of new routes and the evolution of tourism if sufficient institutional innovation is created on both sides of tourism demand and supply. Soliku et al. [24] while proposing short-term and long-term strategies to resist the destructive socio-economic and environmental effects of COVID-19 epidemic on the tourism sector, proposes support for affected local companies with the aim of diversifying the local economy and promoting domestic tourism. Although the lack of spatial and thematic maps and an emphasis on statistical and descriptive methods prevents managers and tourists from fully comprehending the state of urban tourism, Ong and Smith [25] sought to better understand the dynamics of urban tourism by modeling space and examining the evolution of tourism in two historic cities. The study's primary objectives were to describe tourism's spatial and temporal evolution, emphasizing case studies and comparative analysis.
A review of the studies mentioned above reveals that various outcomes have been presented in determining potential tourism areas and implementing management policies, each of which is valuable in its own way. However, these studies used statistical and descriptive methods and approached the subject cross-sectionally and one-dimensionally. As a result of the critical nature of defining tourism areas, new, efficient, and comprehensive approaches to introducing tourism-prone areas and branding them are even more essential. Thus, the purpose of this study is to create potential tourism maps for Tabriz metropolis and its branding, social, physical, environmental, and meteorological factors using GIS techniques and merged artificial neural network (ANN) learning models. Consequently, from the innovations of this research is the use of spatial factors related to tourism and modeling with a combined approach.
2 Materials and methods
2.1 Study area
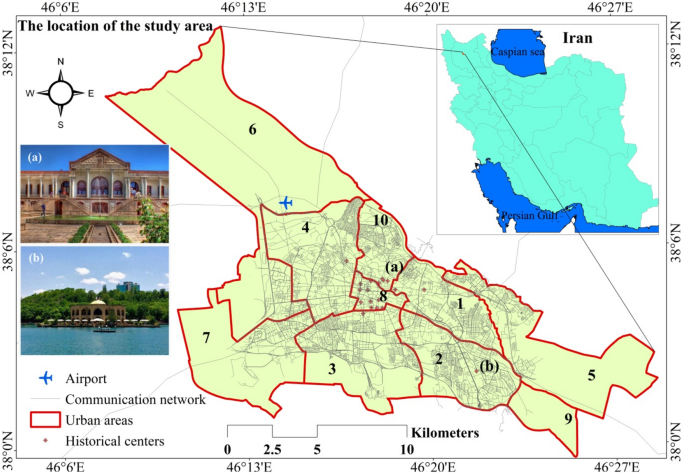
The study area is Tabriz metropolis, the capital of East Azerbaijan province and one of Iran's major cities. It is the largest city in the country's northwestern region and serves as the administrative, communication, commercial, political, industrial, cultural, and military hub for the region, located at 46° 18′ E and 38° 04′ N (Fig. 1). Tabriz's metropolis covers an area of 23,745 Km2, has a population of 1,724,369 people, and is divided into 10 municipal districts, according to the 2016 population and housing census. Today, the city's moderate climate, ample water resources, fertile soil, springs, and abundant mineral resources have resulted in the growth of residential, manufacturing, industrial, service, and agricultural areas. Summers in Tabriz metropolis are dry and hot, influenced by the region's high altitudes, while winters are cold due to the region's mountainous topography. Among the reasons for selecting Tabriz metropolis as a study area is its significant tourism potential, owing to its historical, cultural, and recreational attractions. As a result of these attractions, the city of Tabriz metropolis has attracted a large number of domestic and international tourists. Figure 1 illustrates two of this city's historical and recreational attractions (a-b).
In addition, the geopolitical location of this city has caused it to become a bridge between Iran and Europe. On the other hand, the fertility of the soil, temperate climate, sufficient water, plains and alluvial fans at the foot of the mountain, springs and mineral resources have made this city a hub for the development of residential, service, medical and industrial homes. Thus, the growing growth of the city in terms of tourism development was increasing until it suddenly declined with the spread of the Corona virus. As far as, according to field studies and documents available at the time of the corona virus outbreak in Tabriz metropolis, economic sectors such as tourism, foreign trade, capital market, foreign exchange market, housing market, small businesses, public businesses, commodity prices and production domestic gross are severely were affected.
2.2 Methodology
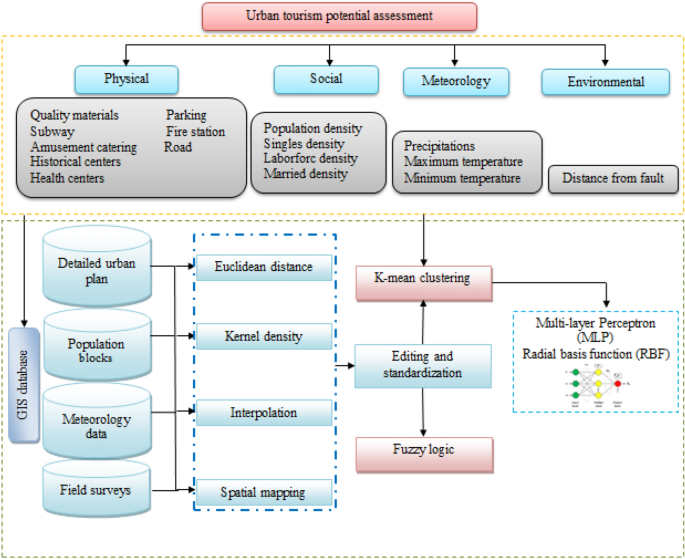
The methodological flowchart of this study is shown in Fig. 2. The research methodology used in this study is based on the purpose of the applied type, and the resources gathered are from the library, field, and spatial data of the study area. Initially, factors of Meteorology (Precipitations, Maximum temperature, Minimum temperature), Physical (Quality materials, Distance from Subway station, Distance from Amusement catering centers, Distance from Historical centers, Distance from Health centers, Distance from Parking, Distance from Fire station, Distance from Road), Social (Population density, Singles density, Laborforc density, Married density), and Environmental (Distance from fault) were chosen as conditioning factors affecting the potential for urban tourism. The Arc GIS 10.4 software was then used to create numerous functions as raster maps using the available spatial and descriptive data. Because the study is modeling-based, the K-mean clustering method was used to create an training database for neural network models (ANNs). Following that, a training database was created using the output map generated by the K-mean model, which was divided into five classes. Afterward, the maps were standardized using fuzzy logic in the range between 0 and 1 based on the increase or decrease in each factor (the effect of each factor on tourism potential). The implementation of MLP and RBF learning models using conditioning factors and training data is one of the study's primary stages, with each stage producing a tourism potential map. Finally, potential tourist destinations were branded using output maps.
2.3 Urban tourism conditioning factors (UTCFs)
Until now, researchers and various tourism organizations attempted to ascertain the factors that influence tourism. However, there has been no consensus among researchers on the use of factors affecting tourism in the world, and local conditions have been decisive in this regard. Nevertheless, this could be because different urban areas have different tourism sources. Obviously, in the tourism industry, these indicators will be determined by visitors and through expert opinion. The data collection method used in this study was divided into two categories: library and field. The urban tourism conditioning factors affecting the identification of potential tourism areas in Tabriz's metropolis are classified into four broad categories in this study: Meteorology, Physical, Social, and Environmental (Table 1).
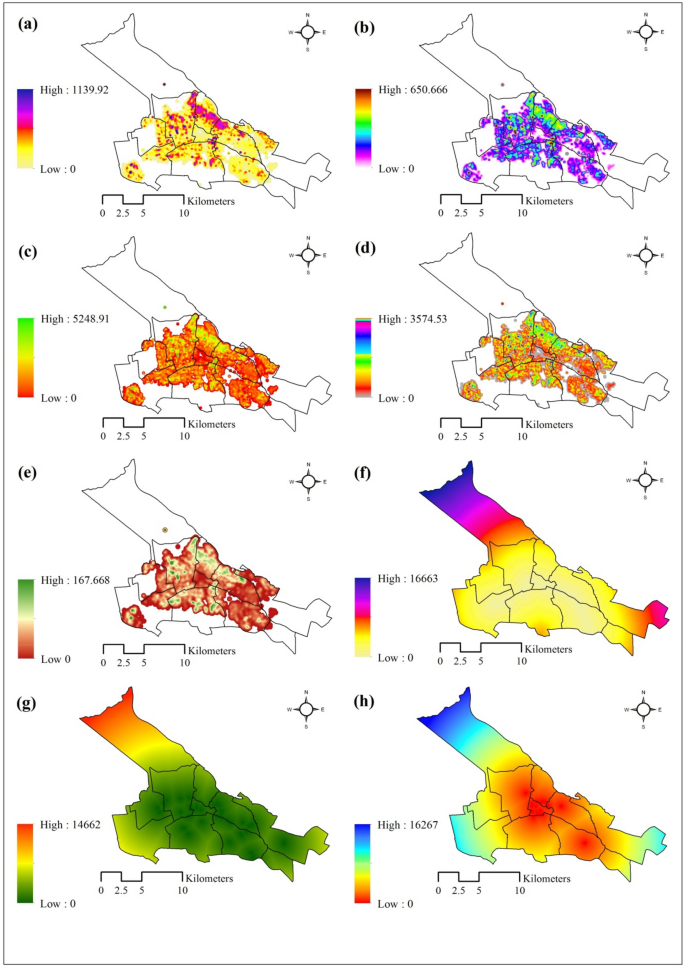
Crowding due to the density of individuals, families, and homes are detrimental to tourists, because it increases the insecurity coefficient. Thus, some tourists' concerns about population insecurity and dislike for noise and crowds are motivated by their negative emotions and feelings toward a tourist destination [26]. To this end, population density maps were used as one of the influential factors in selecting tourist destinations in this study. Additionally, the factors of single or married citizens' density and labor force density were significant in tourist satisfaction [27]. Thus, the marriage and employment of a community's citizens are inextricably linked to tourists' sense of security and satisfaction in a tourist city. The social factors map was created using the 2016 Iranian population and housing census data, and population blocks were created using the density function in Arc GIS 10.4 (Fig. 3a–d).
The quality of construction materials used to transform potentials into tourism hotspots in cities is critical. Because they will be where tourists spend most of their time and activities, the quality of land uses, particularly buildings, is essential for urban tourism [28]. Accordingly, a density map relating to the quality of construction materials in Tabriz's metropolis was created using 2016 census data expressed in terms of density per hectare (Fig. 3e). So that by expert opinion and experience of previous earthquakes, concrete frame materials, iron and brick were classified in resistant type and mud, wood and stone in non-resistant type.
Undoubtedly, public transportation stations in cities play a role in determining tourist destinations. Due to the ease with which urban terminals, railways, and airports can be accessed, the construction of tourism centers adjacent to subway stations is one of the management policies addressed when discussing urban tourism [29]. The map depicting the distances from subway stations in Tabriz metropolis was created using the station locations and the Euclidean distance function in the Arc GIS 10.4 software (Fig. 3f).
Tourism development in cities with cultural and historical significance can attract tourists interested in the region's resources and natural beauty. Urban tourism destinations will be promoted close to cultural capitals, historical sites, dining, and entertainment complexes [30]. Thus, the presences of these centers can effectively double an area's attractiveness to tourists. As a result, spatial maps were created in this study using Euclidean distances for monuments and catering centers (Fig. 3g–h).
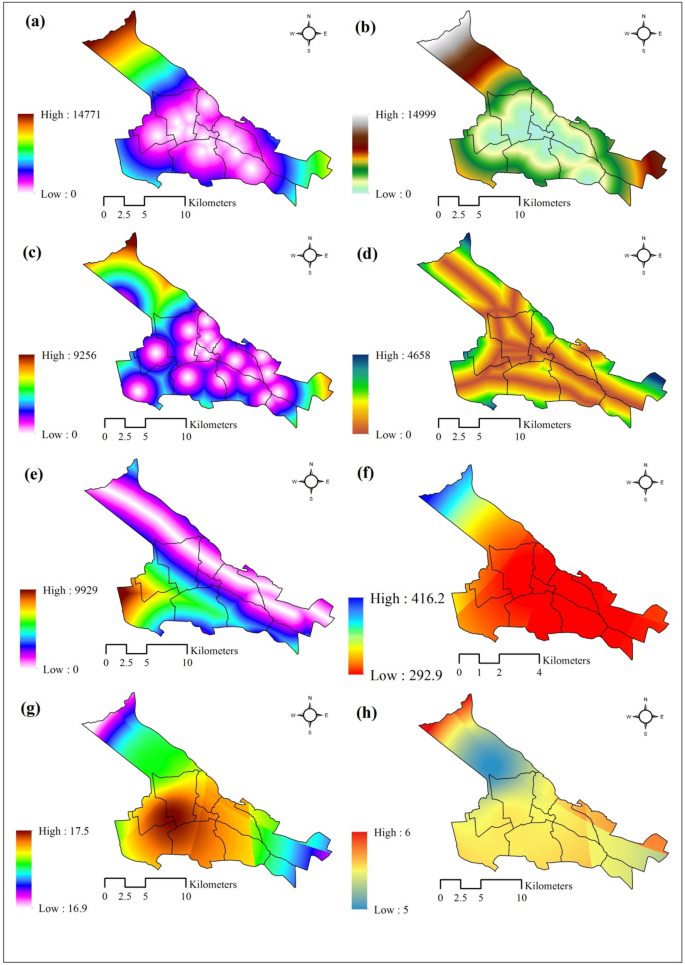
Current tourism policies must incorporate the relationship between tourism and health care. Several factors contribute to this connection, including health tourism [31], tourists' sense of security and easy access to medical facilities. Therefore, the closer a location is to medical and health care facilities, the greater the potential for tourism [32]. In addition, the need to understand the individual behaviors of patients with Covid-19 and the need for hospitalization doubles the importance of proximity to health centers with the aim of reducing transfer time [33]. This study created a map depicting the distance to health centers ranging from 0 to 14,771 m (Fig. 4a).
The presence of a large number of tourists in an area erodes the area's values and attractiveness [34]. Consequently, managing the transportation system for tourists and residents will be a significant infrastructural challenge in metropolitan areas, and parking will be provided to address this issue. Therefore, in addition to wasting time and energy, locating a parking space for tourists can decrease fuel consumption, car oil usage, and environmental pollution [35]. Hence, the rapid access of tourist attractions to parking lots will increase tourism potential. The locations of all public parking lots in Tabriz's metropolis were recorded using GPS, and then a distance map was created accordingly (Fig. 4b).
Tourists' sense of security and comfort is a critical factor that local managers should consider when selecting tourist destinations [36]. Increased tourist accessibility to major roads and fire stations improves a tourist destination's reliability and security. Tourists are they more inclined to vital centers, city exits, and transportation terminals because the main roads are broader and safer to drive on.
In contrast, the closer a location is to existing faults, the less secure it is during an earthquake [37]. Therefore, the location and construction of urban tourism centers near faults directly affect tourist safety. The Euclidean distance function created distance maps of Tabriz metropolis fire stations, faults, and major roads (Fig. 4c–e).
Climate change can be detrimental to urban tourism [38]. Despite the critical nature of urban tourism and its economic benefits, meteorological factors are still excluded from tourism studies. Tourists, in general, react to rainfall that affects specific aspects of tourism. Additionally, the high or low temperature of an area affects tourists' attitudes [39]. Thus, in this study, precipitation (Rain), maximum temperature, and minimum temperature factors were calculated using meteorological data for ten years (2012–2021). So that meteorological data were used as an annual average for each of the factors. The Inverse distance weighting (IDW) method was then used to create the map of meteorological factors in Arc GIS 10.4 software (Fig. 4f–h).
2.4 Background of the models
2.4.1 K-means clustering
The K-means algorithm is capable of unsupervised classification by merging inputs via a clustering process. This technique uses what is known as the K clustering capability, which divides an n-dimensional image into exclusive K clusters. After initializing K centroids (meaning), the KMEANS method is used to cluster the pixels corresponding to the input factors (raster layers). The pixels corresponding to the input factors (raster layers) will approach the cluster whose center is the most central [40]. In general, this is a novel algorithm for minimizing SSE (sum of square errors) that calculates the distance between the pixels and the cluster center using the Euclidean distance. The distance between a pixel and a cluster center is calculated as follows:
where \(d_{ik}\) denotes the distance between the \(i - th\) pixel and the \(k - th\) centroid; Xin denotes the vector (\(X1\),\(X2\), …,\(X_{n}\)) of the \(i - th\) pixel; and \(C_{kn}\) denotes the vector (\(C1\),\(C2\), …,\(C_{n}\)) of the \(k - th\) centroid, where n denotes the number of bends.
The input bands in this study are the same raster layers of the classified factors used to implement the K-means algorithm.
2.4.2 Fuzzy logic
Fuzzy sets are sets or classes that lack precise boundaries and in which the transition between set members and incomplete members of a phenomenon in the set is gradual [41]. Imagining fuzzy sets facilitates the development of a conceptual framework that is similar in many ways to the frameworks used in conventional sets [42]. Fuzzy logic emphasizes linguistic variables and aims to provide an argumentative foundation for approximate reasoning via false propositions. In general, fuzzy logic is based on the presentation of a theory in terms of uncertainty [43]. Thus, the researcher can mathematically explain numerous concepts and ambiguous variables and provide a foundation for reasoning, inference, control, and decision-making using this theory.
Initially, this method selects the relevant factors. Based on these factors, the entire region is divided into appropriate units (value one or zero) or inappropriate units (value zero or false). The performance of a fuzzy set's membership function will then be expressed. In this study, suitability or unsuitability will be determined based on the extent of tourism potential. So that values 1 have the highest potential and values 0 have the lowest potential. Therefore, the shape of the membership function must be carefully designed and selected, as it can affect the fuzzy system's performance. Fuzzy logic includes four fuzzy set membership functions: Sigmoidal, J-Shaped, Linear, and User-defined.
Due to its simplicity, a linear membership function was used in this study. In general, a fuzzy set is a collection of elements that share similar properties and are defined by a specific unit ranging from 0 to 1 [44]. A zero value indicates that it is not a member of that set, whereas one suggests it is a full member. As a result of each factor's unique unit of measurement, fuzzy logic was used to standardize all factors in the range 0 to 1. Generally, fuzzy factorization will be performed using both incremental and decrease functions. The shape of an incremental function increases uniformly. This function will be used for layers that find more favorable conditions by increasing the numerical values of each factor, and the fuzzy number tends to 1. On the other hand, in the decrease function, the condition will revert to the undesirable state, i.e., 0. This is another standardization method used in this study for modeling.
2.4.3 Multi-layer perceptron (MLP)
The last decade has seen increased computational intelligence to solve problems that lack a definite solution or are difficult to solve. The human biological neural network inspires artificial neural networks (ANNs), and research on neural networks has been accompanied by an understanding and study of the human brain's structure and learning function [46]. There is no requirement for a set of special rules to solve the problem in this computational method, and the primary reliance is on the system's gradual training and learning [47]. Multi-layer perceptron networks (MLPs) are a type of artificial neural network algorithm widely used and successful for modeling and forecasting [48]. This model comprises an input layer, one or more hidden layers, and an output layer. It is based on training rules and a "back-propagation" network. With a two-by-two classification approach, the perceptron network associates the input value X (a vector of real numbers) with the output value f (x) (a scalar with binary values):
where \(x\) is the weight vector with real values and \(\omega . x + b\) is the internal product of the weight vector and the input vector.
2.4.4 Radial basis function neural network (RBFNN)
RBFNN is a type of neural network that utilizes the radial function neural network to perform supervised classification [49]. As with MLP, this model consists of an input layer, a hidden layer, and an output layer [50]. Thus, one of the RBF model's potential capabilities is the use of radial (Gaussian) base functions within the hidden layer. The input is modeled as a vector of real numbers by the hidden layer wi an active nonlinear RBF function, plus the linear output layer with a linear function. The result of connecting the hidden layer to the input layer and the hidden layer to the output layer in an RBF network is through two sets of weights. Thus, the weights attached to the input layer contain the parameters for the basic functions, and the weights attached to the hidden layer are also used to generate network outputs:
where \(k\) is the number of radial base functions, \(x\) denotes the input vector, \(w_{ni}\) represents the weight relationship between the base function and the output layer, and \(\varphi_{i}\) is the radial basis function.
3 Results and discussion
3.1 Standardization of UTCFs
Spatial analysis establishes a strong connection between humans and their environment to identify and develop tourism capabilities. The spatial elements that comprise the environment are identified through this process and its commonly used methods. While establishing relationships between the elements, a thorough analysis of the surrounding environment is conducted. It is a collection of tools, techniques, and methods applied to geographic information systems science. The final modeling was carried out in this study using two different learning models: MLP and RBF. As a result, problem-solving begins after identifying the factors affecting tourism (independent variables) and preparing training sites (dependent variables). These factors are represented in GIS as distinct raster layers. Spatial modeling with ANN, particularly in studies involving a mixture of quantitative and qualitative data sources, necessitates standardization of the layer measurement scales. Thus, scale standardization enables meaningful comparisons of data.
Standardization can be accomplished in various ways, but a common method is to use a linear process to rescale the values in the raster map between the minimum and maximum values. Because the linear function is widely used in fuzzy sets due to its simplicity and need for output monitoring. The fuzzy method was used to standardize the factors in this study, and all values for raster layers were between 0 and 1 (Table 2). Because in human decisions, relative terms such as approximately, to some extent, and others are infrequently used, absolute numbers are frequently used. Thus, a fuzzy theory expresses imprecise concepts and is a common set developed within mathematical expressions. Therefore, the maximum membership value (1) corresponds to the full tourism potential, while the minimum membership value (0) corresponds to the minimum tourism potential (lowest tourism potential). Two control points are required in the linear function to express the performance of the fuzzy set membership when the "uniform increase" or "uniform decrease" patterns are selected. Therefore, in the first case, points a and b; and in the second case, points c and d are selected. Following that, when selecting the "symmetric" curve, all four control points a, b, c, and d must be used. Based on the type of impact of each factor on the tourism potential, fuzzy operations were performed in IDRISI software. The sum of the pixels of each factor also remained constant after standardization and fuzzy.
3.2 Preparation of the training database
The artificial neural network (ANN) is a collection of learning models that enables nonlinear linking between variables in the input and output datasets [51]. In this set, the modeling process is based on a learning path that can provide estimated values for output variables based on the input data. The objective is for trained models to be sufficiently generalizable to new and unknown data. Hence, data sets of training are required to use MLP and RBF models. Initially, training data is used to develop appropriate network weights that accurately represent the relationship between input and output. Therefore, the inventory map (training sites) is critical to the outcome of potential tourism modeling.
Collecting, analyzing, selecting, and pre-processing training data is the first step in training neural networks. However, one of the challenges ahead will be compiling a set of training data for various studies. Considering that this study's objective is to identify areas with high tourism potential and that hot spots (high potential) will not be identified naturally, the basic map generated by integrating classification factors (UTCFs) was used to create training sites. Additionally, no such study has been conducted in Tabriz metropolis to date, allowing this study to use the location of tourist attractions as a training ground. As a result, the proposed method in this study is a novel process for determining tourist areas, which was previously used in a similar sample [52] and then [50] to identify earthquake vulnerability points in urban areas.
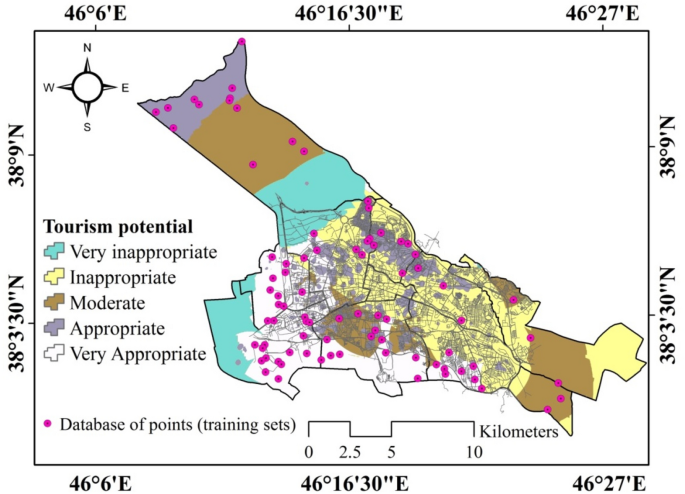
Given that the basis for building the training data set was the clustering model, the input in the K-means model was standardized factors by the classification method and the output of the model was a map classified into five classes. After classifying the K-means map into five possible classes as Very Inappropriate, Inappropriate, Moderate, Appropriate and Very Appropriate, 30 points from each classes were randomly selected as training sites (hotspots) (Fig. 5).
3.3 Urban tourism potential mapping (UTPM)
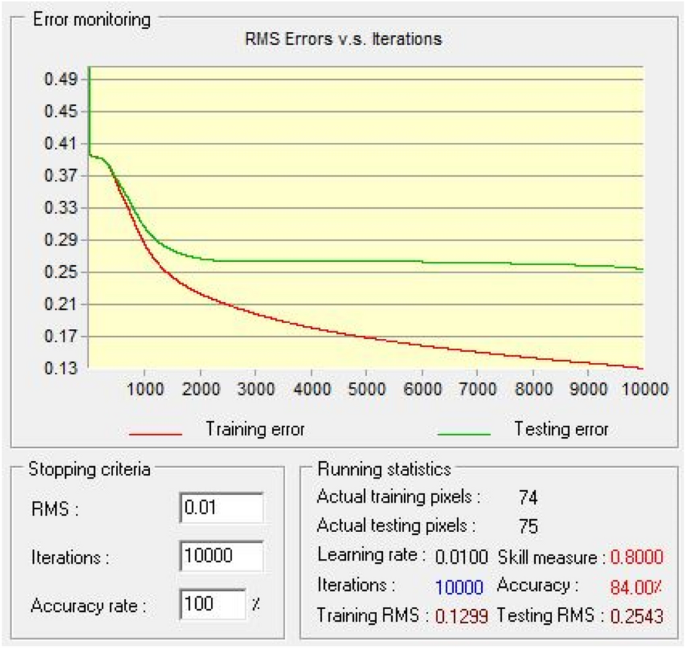
The objective of neural network models is to create and implement models that can learn from training data. As a result, such models can take input data and, using a mathematical model to make decisions based on the database, generate outputs in the form of predictive maps. MLP and RBF were created and implemented in this study using a supervised learning method based on a training data set. A result is obtained and compared to the target in the set of training sites for each input vector. The training sets used to build the models represent a classified pixel used to fit the parameters and factors during the learning process. By combining supervised learning and optimal factor integration, these models can generate accurate predictive maps (UTCFs). The back-propagation algorithm (BP) reduced the error between the model and the actual data while teaching the MLP model. The input of neural network models were two sets of independent data (factors affecting tourism potential) and dependent data (training points). Model execution modules were also set based on default values. This process is repeated until the error rate is minimized and the accuracy is maximized. From the accuracy rate (100%) set to run the model, an accuracy of 84.00% was observed (Fig. 6).
As with the MLP model, the RBF model considered the number of factors analyzed as raster layers and model input in the IDRISI Selva software. Additionally, the file associated with the training site was used to implement the model as a raster layer with five classes. The method for sampling training data for stratified sampling must be determined before the RBF model can be implemented. Because the RBF network is a multi-layer neural network for classification problems, a hidden layer is required to implement it. This hidden layer includes a statistical conversion function called the radial basis function (RBF). As a result, its default number was 16. The clustering process is continued in this model until a specified percentage of pixels migrating to the new centroids equal the set default, i.e., 1.0%. The RBFNN model calibration parameters are listed in Table 3.
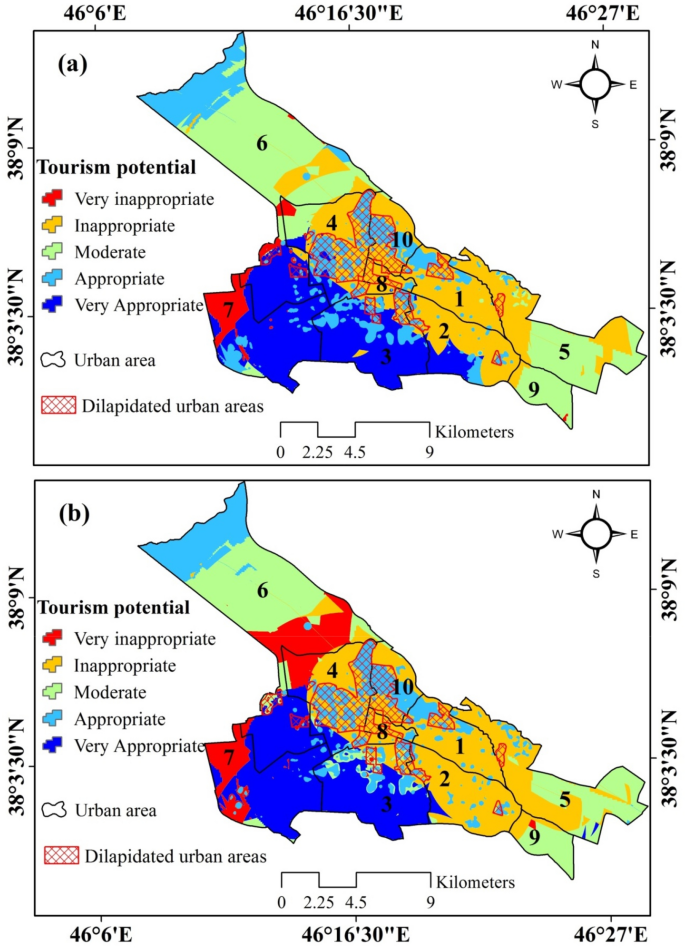
The output of the two hybrid models (Fuzzy-MLP and Fuzzy-RBF) is in the form of maps classified into five potential tourism classes, ranging from Very Inappropriate to Very Appropriate (Fig. 7 a–b).
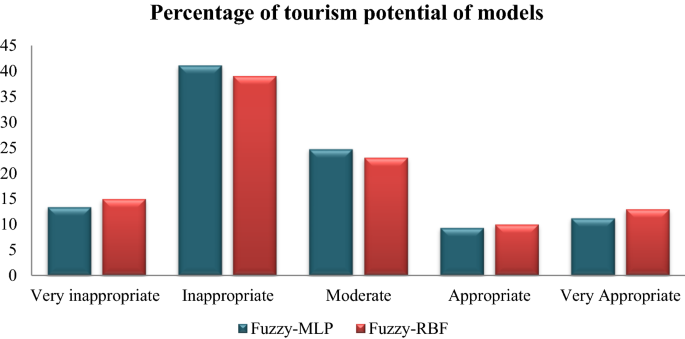
According to the RBF model, most of Tabriz's metropolis falls between Very inappropriate and Inappropriate tourism potential. These areas total approximately 97,146,500 m2, or 54% of the total area (Fig. 8). Furthermore, approximately 53,481,400 m2 of Tabriz's metropolitan area is located in an area with medium potential, accounting for 23% of the city's total area.
However, only 23% of the city's tourism potential from areas 3, 7, and the northern and southwest portions of 6 is Appropriate or Very Appropriate. Additionally, as illustrated the highest tourism potential of Tabriz metropolis in the MLP model is associated with areas 3 and 7, which account for 98,908,400 m2 of the city's total area (Fig. 8), contrasting with the RBF model's results of approximately 5,008,100 m2 in the Appropriate and Very Appropriate classes.
Although the conditions for this model with a difference of 152,177 m2 are almost identical to those for the RBF model, in general, urban tourism has the greatest potential in regions 3, 7, and 6. In contrast, the least potential exists in areas 1, 2, 4, 5, and the southern portions of 6, 8, 9, and 10. Among the neighborhoods mentioned above, Areas 4, 8, and 10 frequently have a worn texture and a crowded, dense atmosphere.
3.4 Branding
The branding process is a deliberate effort to establish a product, business, industry, individual, institution, group, city, province, or country's manufacturing, images, and meaning in the minds of its audience. As a result, cities worldwide must communicate their unique characteristics, culture, and prosperous economic situation to the rest of the world in the age of globalization. The city's branding must be carried out so that culture, history, economic development, social development, infrastructure and architecture, landscapes, and environment all come together to form a marketable identity accepted by most people [53].
After identifying potential urban tourism areas, this study will focus on branding the Tabriz metropolis. Given the metropolis of Tabriz's cultural-historical, commercial, service, and tourist character, it can be stated that branding urban tourism destinations is a powerful tool in the hands of officials, enabling them to attract visitors, tourists, and investors, as well as achieve sustainable growth and development for this metropolis. In terms of tourism, each municipality has a unique reputation based on its capacity, facilities, and activities that set it apart from other cities. This reputation, referred to as an urban tourism brand, is a composite of each city's historical identity, social characteristics, and symbols of civilization, commercial activities, amenities, entertainment, and potential tourism capacities.
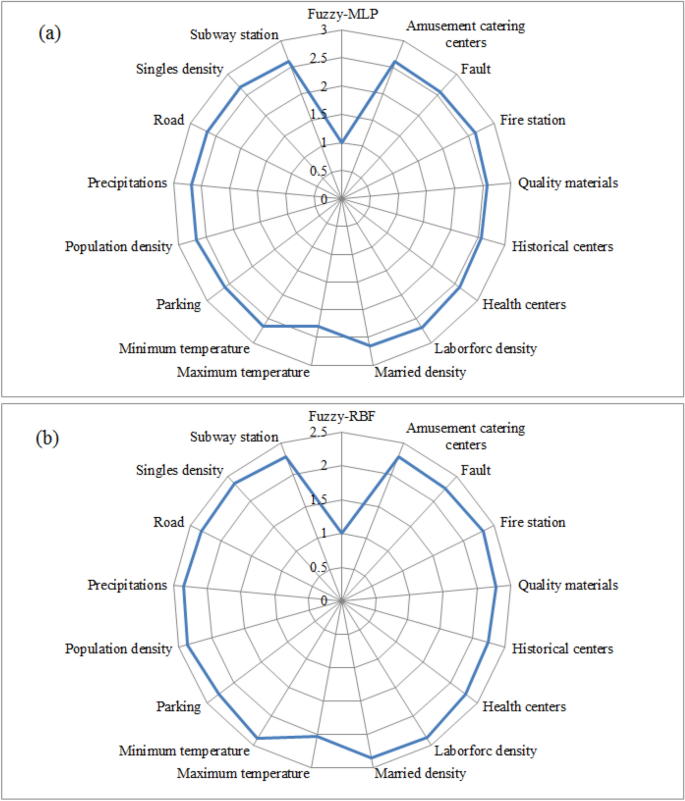
The correlation between the factors affecting urban tourism modeling (UTCFs) and two output models (Fuzzy -MLP and Fuzzy -RBF) was determined to ascertain the factors affecting the branding of potential tourism areas in the Tabriz metropolis. Thus, the stronger the correlation between each factor and the output model, the greater the impact on tourism modeling and mapping. As a result, a correlation between 16 influential factors and two hybrid models was extracted using the Band Collection Statistics command in ArcGIS 10.4 software (Fig. 9).
Correlation analysis indicates that all factors significantly impact tourism in Tabriz metropolis; however, distance from the catering centers, distance from the faults, quality of construction materials, distance from the historical centers, distance from the health centers, maximum temperature, and distance from the parking have the highest correlation with two hybrid models. The results indicate that physical criteria have a more significant impact on the potential for urban tourism than other criteria. The results of the study [28, 31] corroborate the findings of this study.
So that the correlation of factors with the two models Fuzzy -MLP and Fuzzy -RBF is similar. In terms of meteorological factors, this correlation is quite clear, because in the regions with the lowest temperature, there is less potential for tourism in the two combined models. This also applies to the distance from the fault lines. Because in the southern parts of region 7, the lowest tourism potential corresponds to the closest distance to the fault. Pixels related to the density of buildings with high quality materials in areas 3, 4 and 10 are significantly consistent with similar values in tourism potential maps in these areas. Proximity to historical and health centers in Fig. 9a-b also shows the similarity of the pixels classified in the two hybrid models for the above factors and the high potential of tourism. The purpose of identifying the most influential factors on urban tourism in Tabriz metropolis was to introduce the most important drivers for tourism branding, reinforce the strengths of these factors through branding, and take a practical step toward tourism development. The studies in Table 3 corroborate our findings regarding the importance of brand factors. The conceptual model for branding potential tourism areas will be summarized in two stages: brand recognition and brand planning. The first step in branding urban tourism is to determine which elements should be branded [54]. In the second step, a branding strategy should be developed that is appropriate for the environment's capacity and demand.
Therefore, it is critical to consider what the city wishes to be known for and what tourists expect. Accordingly, a brand cannot be defined for a location that is devoid of attractions and potentials. Tourism maps and designated hotspots may prove beneficial in the second step of branding as target areas. In this regard, branding strategies have been explained to increase tourist satisfaction and develop potential tourism destinations that compete with global brands based on Tabriz's strengths (Table 4).
4 Conclusion
Today, urban tourism is widely recognized as a critical and influential factor in a country's urban development and revenue generation. While this role generates necessary revenue for the city, it also contributes to developing essential equipment and infrastructure. As a result, identifying areas with high tourism potential can aid with industry planning and evaluation. Meanwhile, cities that have created a distinct tourism brand become more well-known to the public and attract a significant share of tourism, business, investment, respect, and attention. The desired criteria and factors were first selected and converted to raster layers using the Arc GIS 10.4 software to identify potential tourism areas in Tabriz metropolis.
Using fuzzy logic to standardize the maps and implementing the K-mean model, an training database for implementing the combined Fuzzy-MLP and Fuzzy-RBF models was created. The final tourism maps were created to demonstrate the desirability of tourism spaces, with different areas of Tabriz metropolis being identified based on their existing infrastructure. Based on the findings, the two hybrid models have significant similarities in the classification of suitable and unsuitable pixels for urban tourism. So that tourism has a high potential in Tabriz's areas 3 and 7. In contrast, zones 1, 2 and 8 are in the inappropriate and medium potential classes. Additionally, the correlation between each factor and the final maps was determined to identify tourism branding indicators. Among these factors, distance from the catering centers, distance from the faults, quality of construction materials, distance from the historical centers, distance from the health centers, maximum temperature, and distance from the parking had the most significant impact on modeling and correlation with the two hybrid models.
References
Tapak, L., Abbasi, H., & Mirhashemi, H. (2019). Assessment of factors affecting tourism satisfaction using K-nearest neighborhood and random forest models. BMC research notes, 12(1), 1–5.
Clavé-Mercier, V. (2017). L’entrepreneurialisme urbain comme mode d’animation: l’espace public madrilène disputé. Ambiances. Environnement sensible, architecture et espace urbain, (3). https://doi.org/10.4000/ambiances.981
Chebli, A., Chabou Othmani, M., & Ben Said, F. (2020). Market segmentation in urban tourism exploring the influence of personal factors on tourists’ perception. Journal of Tourism and Services, 11(20), 74–108.
Gretzel, U., & Koo, C. (2021). Smart tourism cities: A duality of place where technology supports the convergence of touristic and residential experiences. Asia Pacific Journal of Tourism Research, 26(4), 352–364.
Streimikiene, D., Svagzdiene, B., Jasinskas, E., & Simanavicius, A. (2021). Sustainable tourism development and competitiveness: The systematic literature review. Sustainable development, 29(1), 259–271.
Pasquinelli, C., & Bellini, N. (2017). Global context, policies and practices in urban tourism: An introduction. In N. Bellini, C. Pasquinelli (Eds.), Tourism in the city (pp. 1–25). Cham: Springer. https://doi.org/10.1007/978-3-319-26877-4_1.
Calle-Vaquero, M. D. L., Garcia-Hernandez, M., & Mendoza de Miguel, S. (2021). Urban planning regulations for tourism in the context of overtourism Applications in historic centres. Sustainability, 13(1), 70.
Panasiuk, A. (2020). Policy of sustainable development of urban tourism. Polish Journal of Sport and Tourism, 27(2), 33–37.
Musavengane, R., Siakwah, P., & Leonard, L. (2020). The nexus between tourism and urban risk: Towards inclusive, safe, resilient and sustainable outdoor tourism in African cities. Journal of Outdoor Recreation and Tourism, 29, 100254.
Novy, J. (2019). Urban tourism as a bone of contention: Four explanatory hypotheses and a caveat. International Journal of Tourism Cities, 5(1), 63–74. https://doi.org/10.1108/IJTC-01-2018-0011.
Uğur, N. G., & Akbıyık, A. (2020). Impacts of COVID-19 on global tourism industry: A cross-regional comparison. Tourism Management Perspectives, 36, 100744.
Selim, M., Aidrous, I., & Semenova, E. (2020). International tourism: Prospects for development in the post coronavirus world (egyptian example). International Journal of Management (IJM), 11(7), 1145–1155. http://www.iaeme.com/IJM/issues.asp?JType=IJM&VType=11&IType=7
Goh, H. C. (2021). Strategies for post-Covid-19 prospects of Sabah’s tourist market–Reactions to shocks caused by pandemic or reflection for sustainable tourism? Research in Globalization, 3, 100056.
Jenkins, C. L. (2015). Tourism policy and planning for developing countries: Some critical issues. Tourism Recreation Research, 40(2), 144–156.
Bustomi, T., & Avianto, B. N. (2021). City branding of the “music-design-culinary” as urban tourism of Bandung, West Java. International Journal of Tourism Cities, 8(1), 53–69. https://doi.org/10.1108/IJTC-06-2020-0123
Braun, E., & Zenker, S. (2010). Towards an integrated approach for place brand management, 50th congress of the European regional science association: Sustainable regional growth and development in the creative knowledge economy, 19–23, Jönköping, Sweden, European Regional Science Association (ERSA), Louvain-la- Neuve.
Pearce, D. G. (2001). An integrative framework for urban tourism research. Annals of tourism research, 28(4), 926–946.
Asadi, R. (2011). Strategies for development of Iran urban tourism. Australian Journal of Basic and Applied Sciences, 5(9), 1933–1943.
Liaghat, M., Shahabi, H., Deilami, B. R., Ardabili, F. S., & Seyedi, S. N. (2013). A multi-criteria evaluation using the analytic hierarchy process technique to analyze coastal tourism sites. Apcbee Procedia, 5, 479–485.
Blasco, D., Guia, J., & Prats, L. (2014). Tourism destination zoning in mountain regions: A consumer-based approach. Tourism Geographies, 16(3), 512–528.
Li, M., Fang, L., Huang, X., & Goh, C. (2015). A spatial–temporal analysis of hotels in urban tourism destination. International Journal of Hospitality Management, 45, 34–43.
Ghaed Rahmati, S., & Daneshmandi, N. (2018). Analysis of urban tourism spatial pattern (case study: Urban tourism space of Isfahan city). Human Geography Research, 50(4), 945–961.
Brouder, P. (2020). Reset redux: Possible evolutionary pathways towards the transformation of tourism in a COVID-19 world. Tourism Geographies, 22(3), 484–490.
Soliku, O., Kyiire, B., Mahama, A., & Kubio, C. (2021). Tourism amid COVID-19 pandemic: impacts and implications for building resilience in the eco-tourism sector in Ghana’s Savannah region. Heliyon, 7(9), e07892.
Ong, J. L. T., & Smith, R. A. (2021). Modelling urban tourism in historic Southeast Asian Cities. Urban Science, 5(2), 38.
Vu, H. Q., Muskat, B., Li, G., & Law, R. (2020). Improving the resident–tourist relationship in urban hotspots. Journal of Sustainable Tourism, 29(4), 595–615.
Khan, A. H., Haque, A., & Rahman, M. S. (2013). What makes tourists satisfied? An empirical study on Malaysian Islamic tourist destination. Middle-East Journal of Scientific Research, 14(12), 1631–1637.
Lerario, A., & Di Turi, S. (2018). Sustainable urban tourism: Reflections on the need for building-related indicators. Sustainability, 10(6), 1981.
Zheng, M. C. (2015). How a map with a tour route recommendation promotes circuitous tourism. Journal of Asian Architecture and Building Engineering, 14(2), 363–370.
Nowacki, M., & Zmyślony, P. (2013). The measurement of city image: Urban tourism market segmentation. Current Issues of Tourism Research, 1(1), 10–18.
Teymouri, I., & Ghanezadeh, S. (2020). Exploring the affecting factors on special Brand health tourism value and its effect on health tourist’s loyalty in Tabriz. Urban Tourism, 7(1), 161–171.
Shirshamsi, A., Mirabi, V., Hasanpour, E., & Ranjbar, M. (2021). The effect of e-marketing on the development of the tourism industry case study: Yazd city. Urban Tourism, 7(4), 35–47. https://doi.org/10.22059/jut.2021.315495.864.
Tenforde, M. W., Rose, E. B., Lindsell, C. J., Shapiro, N. I., Files, D. C., Gibbs, K. W., Prekker, M. E., Steingrub, J. S., Smithline, H. A., Gong, M. N., Aboodi, M. S., Matthew C. Exline, M. C., Henning, D. J., Wilson, J. G., Khan, A., Qadir, N., Stubblefield, W. B., Patel, M. M.,…, Kim, S. S. (2020). Characteristics of adult outpatients and inpatients with COVID-19—11 academic medical centers, United States, March–May 2020. Morbidity and Mortality Weekly Report, 69(26), 841.
Łapko, A. (2014). Urban tourism in Szczecin and its impact on the functioning of the urban transport system. Procedia-Social and Behavioral Sciences, 151, 207–214.
Al-Jabi, M., & Sammaneh, H. (2018, June). Toward mobile ar-based interactive smart parking system. In 2018 IEEE 20th International Conference on High Performance Computing and Communications; IEEE 16th International Conference on Smart City; IEEE 4th International Conference on Data Science and Systems (HPCC/SmartCity/DSS) (pp. 1243–1247). IEEE.
Moghani, B., Soleimani Dameneh, M., & Sabahi Goraghani, Y. (2018). Assessing the Domestic Tourists’ Sense of Security and Comfort (Case Study: The Coastal City of Bandar Ganaveh). urban tourism, 4(4), 107–121.
Yariyan, P., Zabihi, H., Wolf, I. D., Karami, M., & Amiriyan, S. (2020). Earthquake risk assessment using an integrated Fuzzy Analytic Hierarchy Process with Artificial Neural Networks based on GIS: A case study of Sanandaj in Iran. International Journal of Disaster Risk Reduction, 50, 101705.
Atzori, R., Fyall, A., & Miller, G. (2018). Tourist responses to climate change: Potential impacts and adaptation in Florida’s coastal destinations. Tourism Management, 69, 12–22.
Lyons, S., Mayor, K., & Tol, R. S. (2008). The climate preferences of Irish tourists by purpose of travel (No. 225). ESRI Working Paper.
Bhavani, M. S. (2019). Distributing 5G cell sites optimally using K-means and spectral clustering.
McBratney, A. B., & Odeh, I. O. (1997). Application of fuzzy sets in soil science: Fuzzy logic, fuzzy measurements and fuzzy decisions. Geoderma, 77(2–4), 85–113.
Usery, E. L. (2020). A conceptual framework and fuzzy set implementation for geographic features. In Geographic objects with indeterminate boundaries (pp. 71–85). CRC Press.
Zadeh, L. A. (1983). The role of fuzzy logic in the management of uncertainty in expert systems. Fuzzy sets and systems, 11(1–3), 199–227.
Yariyan, P., Avand, M., Soltani, F., Ghorbanzadeh, O., & Blaschke, T. (2020). Earthquake vulnerability mapping using different hybrid models. Symmetry, 12(3), 405.
Guerra-Montenegro, J., Sanchez-Medina, J., Laña, I., Sanchez-Rodriguez, D., Alonso-Gonzalez, I., & Del Ser, J. (2021). Computational Intelligence in the hospitality industry: A systematic literature review and a prospect of challenges. Applied Soft Computing, 102, 107082.
Yariyan, P., Avand, M., Omidvar, E., Pham, Q. B., Linh, N. T. T., & Tiefenbacher, J. P. (2020). Optimization of statistical and machine learning hybrid models for groundwater potential mapping. Geocarto International, 1–35. https://doi.org/10.1080/10106049.2020.1870164
Yariyan, P., Ali Abbaspour, R., Chehreghan, A., Karami, M., & Cerdà, A. (2021). GIS-based seismic vulnerability mapping: a comparison of artificial neural networks hybrid models. Geocarto International, 1–24. https://doi.org/10.1080/10106049.2021.1892208
Pham, Q. B., Afan, H. A., Mohammadi, B., Ahmed, A. N., Linh, N. T., Vo, N. D., Moazenzadeh, R., Yu, P. S., & El-Shafie, A. (2020). Hybrid model to improve the river streamflow forecasting utilizing multi-layer perceptron-based intelligent water drop optimization algorithm. Soft Computing, 24(23), 18039–18056.
Corsini, G., Diani, M., Grasso, R., De Martino, M., Mantero, P., & Serpico, S. B. (2003). Radial basis function and multilayer perceptron neural networks for sea water optically active parameter estimation in case II waters: A comparison. International Journal of Remote Sensing, 24(20), 3917–3931.
Yariyan, P., Karami, M., & Ali Abbaspour, R. (2019). Exploitation of MCDA to learn the radial base neural network (RBFNN) aim physical and social vulnerability analysis versus the earthquake (case study: Sanandaj City, Iran). International Archives of the Photogrammetry, Remote Sensing & Spatial Information Sciences.
Hussain, H. I., Kamarudin, F., Thaker, H. M. T., & Salem, M. A. (2019). Artificial Neural Network to model managerial timing decision: Non-linear evidence of deviation from target leverage. International Journal of Computational Intelligence Systems, 12(2), 1282.
Alizadeh, M., Ngah, I., Hashim, M., Pradhan, B., & Pour, A. B. (2018). A hybrid analytic network process and artificial neural network (ANP-ANN) model for urban earthquake vulnerability assessment. Remote Sensing, 10(6), 975.
Chan, A., Suryadipura, D., & Kostini, N. (2021). City image: City branding and city identity strategies. Review of Integrative Business and Economics Research, 10, 330–341.
Chekalina, T. (2015). A value co-creation perspective on customer-based brand equity modelling for tourism destinations: A case from Sweden (Doctoral dissertation, Mittuniversitetet).
Author information
Authors and Affiliations
Corresponding author
Additional information
Publisher's Note
Springer Nature remains neutral with regard to jurisdictional claims in published maps and institutional affiliations.
Rights and permissions
About this article
Cite this article
Dadashpour Moghaddam, M., Ahmadzadeh, H. & Valizadeh, R. A GIS-Based Assessment of Urban Tourism Potential with a Branding Approach Utilizing Hybrid Modeling. Spat. Inf. Res. 30, 399–416 (2022). https://doi.org/10.1007/s41324-022-00439-4
Received:
Revised:
Accepted:
Published:
Issue Date:
DOI: https://doi.org/10.1007/s41324-022-00439-4


