Abstract
The study optimized the chromium removal capacity of Fe2O3 nanoparticles through the infusion of cobalt using a single-step synthesis method. This approach not only enhanced their magnetic properties but also employs less-chemical synthesis techniques, ultimately yielding highly magnetic CoFe2O4 nanoparticles and less impurities. The prepared materials underwent comprehensive testing, encompassing examinations of their optical properties, structure, chemical composition, and surface characteristics using various analyticals methods. In a span of 90 min under visible light exposure, CoFe2O4 nanoparticles exhibit the ability to remove more that 90% of chromium. This was corroborated through analysis using Inductively Coupled Plasma-Optical Emission Spectroscopy (ICP-OES). Moreover, the study illustrates that increased temperatures amplify the endothermic process of chromium adsorption. Positive ΔH°, negative ΔS°, and heightened Cr(IV) adsorption are linked to the temperature effects on solubility, mobility, and dissolved oxygen. Both Langmuir (R2 = 0.95, RL = 0.055) and Freundlich models (R2 = 0.98, n = 0.69) suggest favorable adsorption. The efficient Cr(IV) adsorption by CoFe2O4 nanocomposite is attributed to a rapid reaction rate and substantial capacity, following pseudo-second order kinetics (rate constant 0.01 g mg−1 min−1, R2 = 0.99).
Graphical abstract
Introduction
Heavy metals, including chromium, found in industrial effluents have a significant impact on water pollution and adverse health effects. Chromium is mainly produced by industrial processes, such as metallurgy, electroplating, tanning, wood preservation and petroleum refining [1,2,3]. In the aquatic environment, chromium is mainly present in Cr3+ and Cr6+ oxidation states. In addition to being carcinogenic, Cr6+ species exhibit toxicity levels approximately one hundred times greater than those of Cr3+. Furthermore, Cr6+ exhibits a greater degree of mobility as a result of its low adsorption on inorganic surfaces [4,5,6]. Excessive inhalation or absorption of Cr6+ water may cause cancer, tissue damage, and dermatitis. Cr3+ and Cr6+ are permissible levels in the environment at 5 ppm and 0.05 ppm, respectively; however, water concentrations range from 10–100 ppm due to their increased use [7]. The presence of this pollutant in water necessitates treatment before use. Various methods, such as reduction, precipitation, ion exchange, reverse osmosis, electrodialysis, and adsorption processes, have been employed to treat water containing chromium [8,9,10,11]. Although many of these methods are effective in removing Cr6+, they are often costly or inefficient. Due to the ability to remove a wide variety of chemical pollutants, advanced oxidation technologies such as photocatalysis have received considerable attention [6]. A number of significant advantages of photocatalysis have recently attracted increasing attention due to their environmental friendliness, high efficiency, and cost-effectiveness. Photocatalysis occurs when semiconductor catalysts are exposed to light and facilitate the acceleration of photoreactions [12, 13]. It is believed that both photo-oxidation and photo-reduction occur due to electron–hole pairs forming on the photocatalyst’s surface during photon absorption. Free radicals result from this process and are essential for detoxifying pollutants [14, 15]. Metal oxide nanoparticles have been successfully used as photocatalysts to remove pollutants from wastewater but due to their primary activation occurring in the ultraviolet (UV) region, which is characterized by a wide bandgap, these semiconductors can only absorb a 4% fraction of sunlight [16,17,18]. As a result of this need, several approaches have been explored for highly active photocatalytic materials driven by visible light. These methods include embedding metal ions within a semiconductor and coupling semiconductors with narrow band gaps [19,20,21]. Recent advancements have introduced a range of advanced materials, including metal sulphides and their complex heterojunctions. Simultaneously, the field has experienced the introduction of Metal–Organic Frameworks (MOFs), biochar materials and MXene, expanding the diversity of innovative materials [22,23,24,25]. Notably, cobalt ferrite (CoFe2O4) has gained recognition as a highly versatile material, proving effective in various applications such as photocatalysis, drug delivery, wastewater treatment, cancer treatment, and sensor technologies. CoFe2O4 has excellent mechanical hardness and cost-effectiveness, as well as exceptional strength and magnetic properties [26,27,28,29]. The nanoparticles possess a narrow band gap, which makes them sensitive to visible light exposure and allows them to align with the solar spectrum [30]. The unique properties of CoFe2O4 have been investigated in several studies to reduce hexavalent chromium through photocatalysis. Using CoFe2O4/BiOBr/Graphene composites, Li et al. developed a Z-scheme photocatalyst capable of reducing hexavalent chromium and degradation of organic dyes in visible light [31]. Emadian et al. investigated the potential of a magnetically separable CoFe2O4/ZrO2 nanocomposite for the photocatalytic reduction of hexavalent chromium under visible light irradiation [32]. For the same application, Ibrahim et al. studied the magnetically separable TiO2/CoFe2O4/Ag nanocomposites under UV and artificial solar light [33].
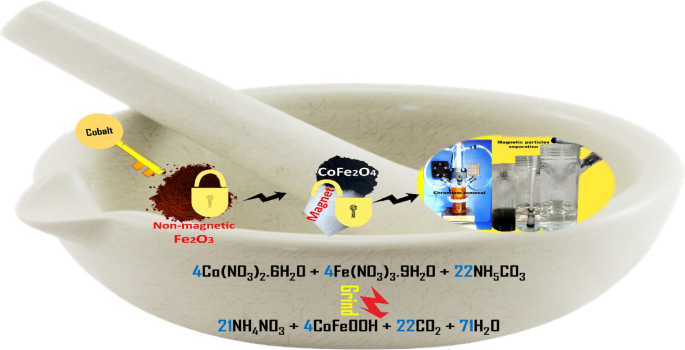
Examining alternative approaches, this study aims to address the prevalent challenges of cost and inefficiency associated with current methods in treating chromium-containing effluents. The focus is on the unique synthesis method and resulting properties of CoFe2O4 nanoparticles, offering a promising solution for efficient reduction of hexavalent chromium. The magnetic nature of the photocatalyst facilitates easy separation from the solution, addressing a key challenge in practical applications. The synthesis process involves a straightforward single-step grinding procedure, transforming non-magnetic Fe2O3 nanoparticles into highly magnetic ones by incorporating cobalt. The resulting CoFe2O4 nanoparticles are then assessed for their ability to reduce concentrated Cr(IV).
Experimental
Materials
All materials and solvents were obtained from commercial sources: Sisco Research Laboratories Pvt. Ltd, India, Sigma Aldrich, and Abhishek Enterprise Pvt. Ltd. Materials were used without any modification. In particular, the chemicals used included Iron (III) nitrate nonahydrate, (Fe(NO3)3.9H2O) (extra pure, 99.9%), ammonium bicarbonate, NH4HCO3 (extra pure AR, 99.9%), cobalt(II) nitrate hexahydrate, Co(NO3)2xH2O (ACS reagent, 98%), and potassium dichromate (ACS reagent, 99.0%). All measurements were performed with milli-Q water and spectroscopic-grade solvents.
Characterization instruments
To record optical absorbance spectra, a JASCO-670 UV/VIS/NIR spectrometer (made in Japan). was used. For FT-IR spectra, a JASCO FT-4700 spectrometer (made in Japan) was used. Images of transmission electrons were captured with the Talos F200i S/TEM electron microscope (HRTEM-200 kV). As part of the quantitative elemental analysis and elemental mapping process, this device was equipped with an EDAX Bruker X Flash 6 30 EDS detector. The Raman spectra were recorded by a RENISHAW InVia Raman Microscope. The X-ray diffraction pattern of the samples was measured using a Cu–K light source X-ray diffractometer (GNR APD 2000 PRO). At room temperature, the VSM Lake Shore Model-7410 Series was used to study magnetic properties. In order to assess the effectiveness of photocatalytic chromium removal, both inductively coupled plasma optical emission spectroscopy (ICP-OES) using the Perkin Elmer Optima 5300 DV ICP-OES and a UV–Vis spectrometer were used. Utilizing a Micromeritics ASAP2020, N2 adsorption on the solid was measured, and this data was employed to determine the (BET) specific surface area.
Synthesis of CoFe2O4 nanoparticles
Fe2O3 nanoparticles were synthesized by mechanically grinding 0.6 g ammonium bicarbonate with 1 g iron nitrate nonahydrate using a mortar and pestle. This was done in accordance with Eq. 1. The FeOOH residue obtained was washed successively with ethanol and distilled water and dried at 100 °C before being calcined at 300 °C for two hours [34]. Similarly, the preparation of magnetic CoFe2O4 nanoparticles was achieved by grinding simultaneously 1 g iron nitrate nonahydrate, 1.08 g ammonium bicarbonate, and 0.72 g of cobalt (II) nitrate hexahydrate simultaneously (Eq. 2), followed by washing and calcination at 300 °C.
Results and discussion
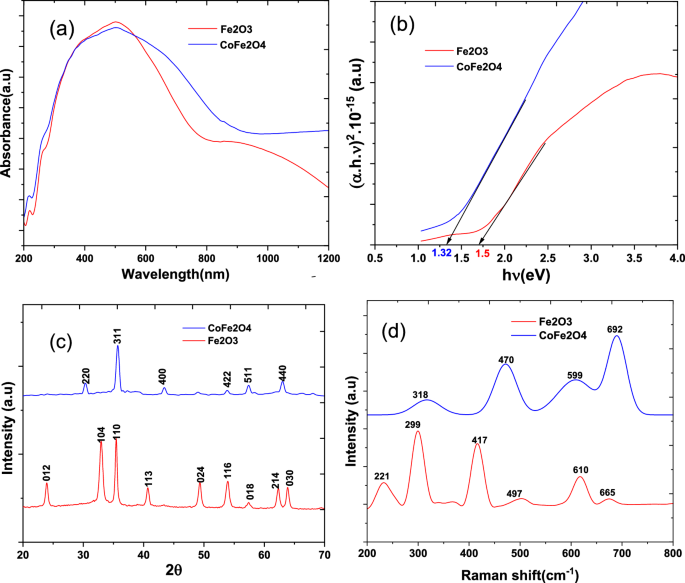
UV–vis diffuse reflectance spectroscopy (DRS) was employed to analyse the light absorption properties of the synthesized photocatalyst, as depicted in Fig. 1a. Displaying enhanced absorption characteristics, the CoFe2O4 nanocomposite shows maximum absorbance at approximately 500 nm in the visible region. This contrasts with the pristine Fe2O3 nanoparticles, highlighting the nanocomposite's exceptional efficiency in capturing visible light. Efficiently converting solar energy into chemical energy is facilitated by the heightened light absorption capacity of CoFe2O4 nanocomposites. To determine the optical band gap of the samples, Tauc's equation is used. Extrapolation lines for Fe2O3 and CoFe2O4 samples are shown in Fig. 1b. In CoFe2O4 nanoparticles, cobalt significantly decreased the band gap. As a result of cobalt incorporation into magnetic CoFe2O4 nanoparticles, Fe2O3 bandgaps were reduced from 1.5 eV to 1.32 eV. This provides strong evidence that CoFe2O4 nanoparticles have been successfully formed. In line with previous research, this combination leads to nanocomposites with enhanced photon absorption capacity in visible light [15].
X-ray diffraction (XRD) was used to analyse the crystal structure, phase, and purity of the synthesized material. Figure 1c illustrates the X-ray diffraction pattern, which exhibits distinct peaks. There are perfectly aligned peaks at (012), (104), (110), (113), (124), (116), (214), (300), and (208) which indicate that the material is composed of a pure hematite α-Fe2O3) structure. Alternatively, the XRD pattern also exhibits peaks at (220), (311), (400), (422), (511), and (440) corresponding to spinel-like CoFe2O4 nanoparticles (JCPDF 22–1086).
Raman spectroscopy is an effective method for understanding nanoparticle atomic structure. Figure 1d displays an analysis of the Raman spectrum obtained from synthesized composites. Raman peaks were observed at 221 cm−1, 287 cm−1, 405, 493 cm−1, 608 cm−1, and 610 cm−1. These peaks can be attributed to hematite α-Fe2O3 reported in a previous study [34]. Additionally, a Raman peak at 665 cm−1 indicates ferric oxide traces. These Raman peaks are similar to those reported by another researcher [35]. However, the Raman spectrum of the CoFe2O4 sample indicates a cubic spinel structure composed of cobalt ferrite. Approximately 318 cm−1, 470 cm−1, 599 cm−1 and 692 cm−1 of the spectrum correspond to active Raman vibrational modes (A1g + Eg + 3T2g), respectively [36]. In addition, the Raman spectra recorded for the cobalt ferrite compound indicate that it is free of impurities such as α-Fe2O3.
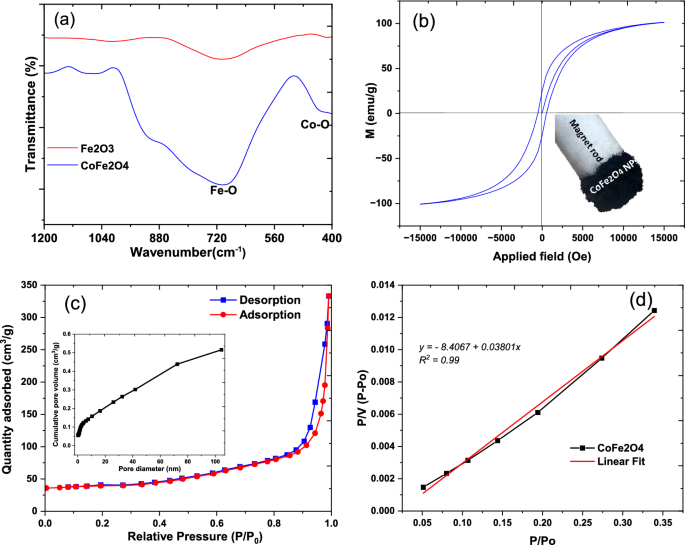
To measure the synthetic specimens using FTIR spectroscopy, a range of 1200 to 400 spectral ranges were employed. Figure 2a illustrates the FTIR spectra of synthesized Fe2O3 and CoFe2O3. A distinct peak at 426 cm−1 can be attributed to the stretching vibrations of Co–O bonds in the CoFe2O4 sample. The broad peak in the spectrum in each sample ranges from 1000 to 510 cm−1 with a maximum of 680 cm−1 [32]. It indicates stretching vibrations of Fe–O bonds. It is clear from the spectral features observed that the synthesized materials are bonded and that they contain Co–O and Fe–O bonds.
The field-dependent behavior (M-H curve) of CoFe2O4 was studied using a vibrating sample magnetometer (VSM). As shown in Fig. 2b and Table 1, the synthesized samples were characterized by their coercivity, saturation, remanence, and squareness ratios. Interestingly, the cobalt-doped nanocomposite, CoFe2O4, exhibits a saturation point of 101.11 emu/g, exceeding the value reported by Emadian in a previous study of 49.17 emu/g [32]. Furthermore, CoFe2O4 has a widening hysteresis loop, which suggests that this material is a hard magnetic material [37].
The N2 adsorption–desorption curve, presented in Fig. 2c, reveals a hysteresis curve indicative of a type IV Brunauer–Emmett–Teller (BET) adsorption isotherm. This BET isotherm pattern signifies an initial monolayer adsorption, succeeded by multilayer adsorption. Following the creation of the initial monolayer, the adsorption gradually increases, indicating the formation of multilayers of dye molecules. Such behaviour is typical in porous materials with diverse pore diameters. The accompanying hysteresis loop further underscores the mesoporous structure of the nanocomposite [38]. The CoFe2O4 nanocomposite’s specific surface area was calculated to be 75 m2/g, while its pore volume and diameter were found to be 0.05548 cm3/g. The determined pore diameter of 12 nm, as analysed by Barrett-Joyner-Halenda (BJH), indicates the presence of mesopores on the catalyst’s surface, as illustrated in the inset of Fig. 2c. This is consistent with the typical range of mesopores, which falls between 2 and 50 nm [39]. The correlation coefficient of 0.99 for the BET isotherm highlights the model’s robustness and accuracy in describing the observed adsorption behaviour. This strong correlation indicates a positive relationship between the experimental data and the theoretical predictions, confirming the BET model’s suitability for explaining the adsorption process under the investigated conditions (Fig. 2d).
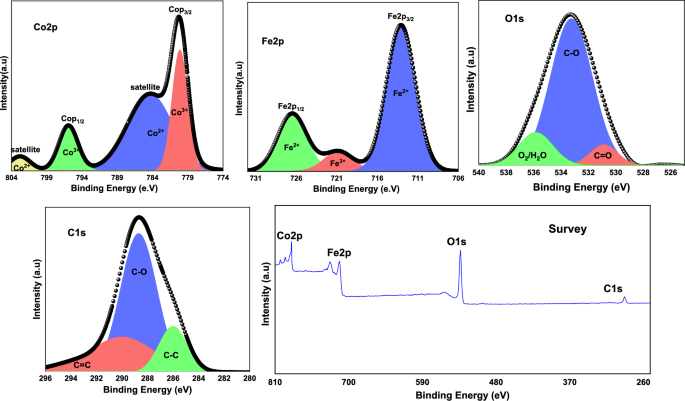
The chemical composition and oxidation state of CoFe2O4 were determined using XPS analysis. Figure 3 illustrates high-resolution spectral data for Fe2p, Co2p, O1s, and C1s.
Fe2p spectra show two peaks: Fe2p1/2 at 712.95 eV and Fe2p3/2 at 726.40 eV, indicating Fe2+. An additional peak at 721 eV indicates Fe3+ chemical structure [37, 40]. The Co spectrum clearly displayed emerging peaks at 780 and 795 eV, corresponding to Co2p3/2 and Co2p1/2, respectively, thus verifying the presence of Co3+. The presence of two satellite peaks indicates that the cobalt is also present in a 2+ oxidized state [41]. Furthermore, the O1s spectrum showed three distinct peaks: one at 530 eV resulting from C=O, another at 533 eV resulting from C–O, and a third peak at 535 eV due to physically adsorbed O2/H2O [42]. It can be seen that the C1s spectrum in the composite exhibits a distinct peak at 289 eV, which is consistent with the C binding energy seen in hydrocarbons. This peak is likely to be the result of surface contamination from air exposure [43].
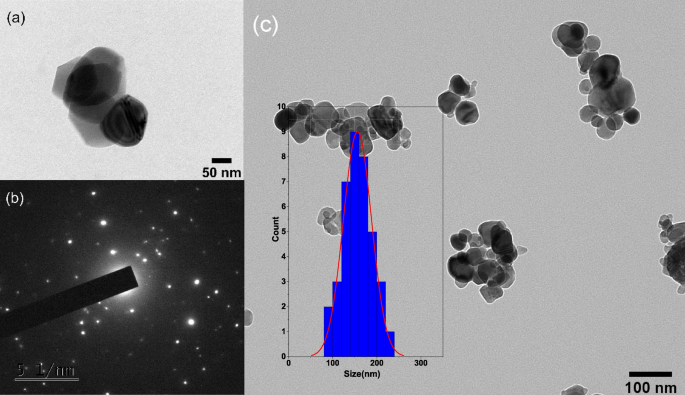
As shown in Fig. 4a, c, high-resolution transmission electron microscopy was used to examine the surface morphology and size of the nanoparticles. Cobalt and iron nanoparticles are bonded together in a spherical shape, with an average size of 150 nm. CoFe2O4 nanoparticles are also shown to be composed of several crystallographic phases as shown in Fig. 4b, indicating that these nanoparticles are composed of various crystal structures or polymorphs. Several factors have contributed to this phase variation, including synthesis conditions, postprocessing methods, and impurities in the sample [44]. As shown by Yuan et al., the presence of multiple crystallographic phases indicates that a nanoparticle has a high crystallinity level and is well-formed. The presence of several crystallographic phases can also significantly influence nanoparticle properties, such as electronic, optical, and catalytic properties. As a result, these nanoparticles have significant potential for numerous applications [45].
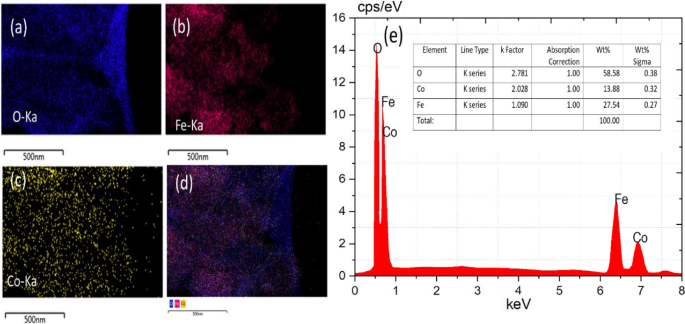
The mapping images in Fig. 5a–d as well as the EDS analysis illustrated in Fig. 5e confirmed the purity of the hybrid CoFe2O4 nanoparticles. The sample contained both Fe and Co elements, indicating high purity. CoFe2O4 nanoparticles contained 58.58% Fe, 13.88% Co, and 27.54% O.
Photocatalytic activity measurements
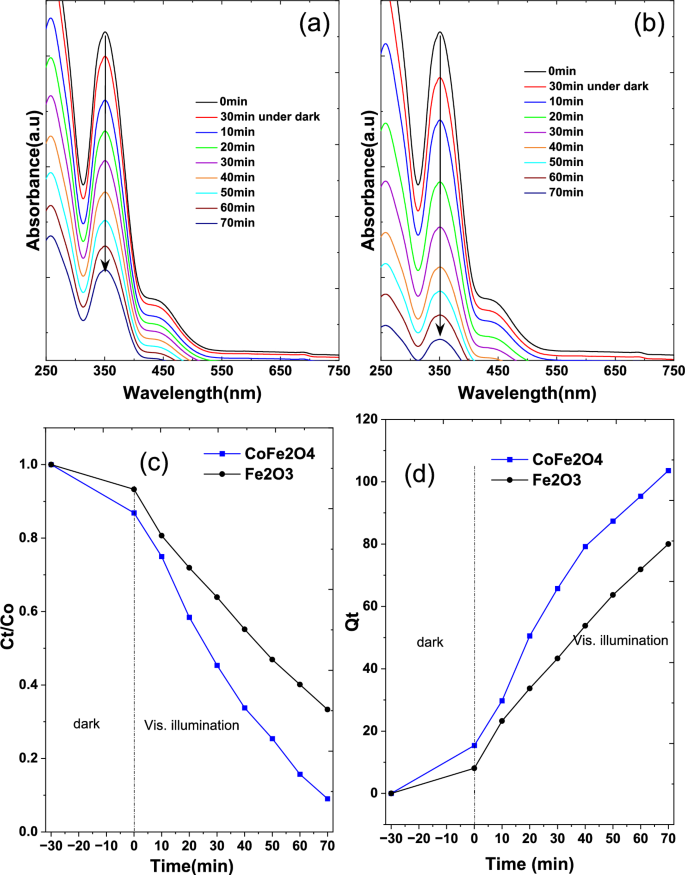
As reported in a previous work, the photocatalytic performance of the nanoparticles was investigated to remove potassium dichromate (K2Cr2O7) in a photocatalytic reactor with visible light irradiation (High-pressure mercury lamp, 125 W) at room temperature. The photocatalytic reaction was carried out in 500 ml closed flasks containing 200 ml of a chromium solution. Before irradiation, the suspension was magnetically stirred for 30 min in the dark to achieve an adsorption–desorption equilibrium. The reaction was monitored by taking 1 mL aliquots from the flask at regular intervals and measuring the absorbance [37]. As time progressed, the absorbance peak was progressively reduced. A photocatalyst’s removal efficiency is expressed in Eqs. 3 and 4.
where Ci, Ct, and Ce represent the concentrations of the dye solution at the beginning, at time t, and at equilibrium, respectively, measured in milligrams per liter (mg/L), Qe (mg/g) signifies the maximum adsorption capacity of the nanocomposite, V and m the volume and the mass of the Cr(IV) and the catalyst respectively [46].
Effect of pH
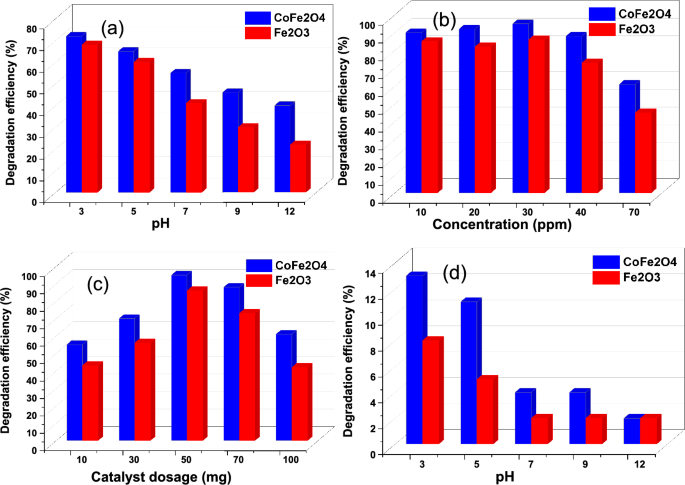
A significant factor influencing pollutant removal is the solution pH. Cr(VI) photoreduction efficiency was evaluated at different pH levels (3, 5, 7, 9, and 12) using a photocatalyst dose of 50 mg and a Cr(VI) concentration of 40 ppm (Fig. 6a). As the pH of the solution decreased, the reduction in Cr(VI) increased. At pH 3, the highest removal efficiency was observed. Specifically, CoFe2O4 had 72% photoreduction efficiency at pH 3, while Fe2O3 was 68%. These results indicate that Cr(VI) photoreduction occurs better under acidic conditions. This hypothesis was also confirmed by Emadian's study, as the zeta potential analysis demonstrated that at pH > 6, the surface of the CoFe2O4 nanoparticles become positively charged due to the presence of H+ ions. It is therefore believed that more Cr(VI) is reduced to Cr(III) at pH > 6 than at pH < 6 [31, 32]. In the presence of acidic conditions, chromium reduction is more efficient due to increased surface protonation and electrostatic interactions between the charged photocatalyst surface and the Cr(VI) present [49,50,51].
Effect of chromium concentration
The study included tests with different concentrations of heavy metals (10, 20, 30, 40, and 70 ppm) to examine their effect on photocatalytic removal for 90 min. All experiments were conducted with a constant catalyst mass of 50 mg at pH 3. As the concentration of heavy metal solution increased (Fig. 6b), the rate of photocatalytic removal decreased. Accordingly, this phenomenon may be attributed to the increased adsorption of heavy metal molecules on the surface of the composites, which attenuates the particle activity. This reduced the efficiency of the photocatalyst removal response. Furthermore, increasing the initial heavy metals concentration led to an increased likelihood of free radical interactions with heavy metals atoms. However, a higher heavy metal concentration also resulted in significant radiation absorption by the heavy metal molecules. This led to a decrease in the penetration of irradiation into the semiconductor. As a result, free radical concentrations decreased, resulting in a reduction in photocatalytic removal efficiency [47, 48]. In this study, the highest percentage of removal was observed at 30 ppm.
Effect of catalyst dosage
The impact of composite dosage on the removal of heavy metals under visible light conditions was investigated, as illustrated in Fig. 6c. The photoreduction process was accelerated when the number of particles increased. A dosage of 50 mg of nanomaterials and 30 ppm heavy metals yielded the highest elimination rate in 90 min time at pH 3. In contrast, when the dosage of the catalyst is greater than 50 mg, the removal rate begins to decrease, which emphasizes the critical role that catalyst dosage plays in the photocatalytic removal of heavy metals. The reduction in removal rate with higher catalyst dosage can be attributed to the increased opacity of the suspension caused by an abundance of nanoparticles. In turn, this high degree of opacity hinders light penetration and the effective interaction between photons and heavy metal contaminants. In addition, exceeding the ideal concentration of photocatalysts can cause nanoparticles to coagulate and reduce their surface area. As a result, fewer photons are retained, resulting in slower removal of the photocatalyst [47, 49,50,51].
Adsorption test at different pH
Under dark conditions, the chromium adsorption capacity of the catalysts shown in Fig. 6d was evaluated at different pH levels (3, 6, 7, 9 and 12). As the pH increased to 12, the dark adsorption of chromium on the surface decreased to approximately 2%. The higher concentration of H+ ions in an acidic environment is attributed to the higher adsorption rate in an acidic environment during the photocatalytic reduction process, which accelerates the photoreaction, as indicated by Eqs. (5) and (6). According to Eq. (6), a basic medium has a low concentration of H+ ions, which slows down the reaction. In addition, the formation of Cr(OH)3 can contribute to reduction efficiency by precipitating on the surface of the photocatalyst, thereby covering the active sites and preventing light penetration, as described in Eq. (7). Based on our study, pH = 3 was found to be the most effective pH for Cr(VI) photoreduction [32].
Effect of time
The removal efficiency of hexavalent chromium by CoFe2O4 nanoparticles was found to be notably higher than that of Fe2O3 nanoparticles, based on UV absorbance readings tracked over time. Specifically, after 70 min, CoFe2O4 nanoparticles achieved an 90% removal efficiency, whereas Fe2O3 nanoparticles showed a lower efficiency of 76.65% (Fig. 7a–c). Notably, CoFe2O4 nanoparticles exhibited high catalytic activity under visible light. When observing Cr(IV) adsorption over time for a constant adsorbent quantity of 50 mg, both CoFe2O4 and Fe2O3 nanoparticles demonstrated similar chromium removal, as depicted in Fig. 7d.
Adsorption thermodynamics
Thermodynamic factors crucial for assessing spontaneity in sorption techniques include Gibbs free energy (G°), enthalpy (H°), and entropy (ΔS°). The mathematical expressions for G° and the change in Gibbs free energy (ΔG°) are outlined in Eqs. 8 and 9, respectively. Subsequently, Vant Hoff's equation is derived from these equations, as given in Eq. 10, with Kad provided in Eq. 11 [38, 52].
where enthalpy (ΔH°) and entropy (ΔS°), represented by R, T, and Kad as the gas constants, reaction temperature, and adsorption equilibrium constant. Furthermore, Ce (mg/L) and Cad (mg L−1) is the equilibrium solute concentration, and the concentration of the adsorbed solute.
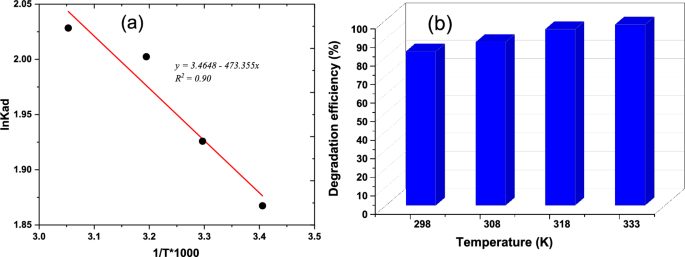
Figure 8a illustrates the relationship between ln Kad and 1/T, providing the thermodynamic parameters for adsorption. The slope and intercept of this plot, as shown in Table 2, determine ΔH° and ΔS°, respectively. In the photocatalytic experiment, a composite of 50 mg was mixed with a 30 ppm chromium concentration, and the experiment ran for 70 min with temperatures varying from 298 to 333 K. The positive ΔH° value observed indicates endothermic adsorption, while the negative ΔS° implies a reduction in the degree of freedom of the adsorbed substance. The increasing G° with temperature suggests that adsorption becomes more favourable at higher temperatures. These findings align with similar results obtained by AL-Othman et al. [53].
The rise in temperature is associated with an increase in adsorption, as depicted in Fig. 8b, leading to a higher amount of Cr(IV) adsorption. This heightened adsorption can be attributed to an increased affinity or attraction between the adsorbent material and the molecules being absorbed. As per Balarabe et al., the solubility and mobility of Cr(IV) molecules experience an increase with rising temperatures, facilitating more effective interaction with the active sites on the adsorbents’ surfaces. Simultaneously, the increase in temperature results in a decrease in dissolved oxygen in the solution, preventing the nanoparticles from undergoing oxidation [34].
Adsorption isotherm
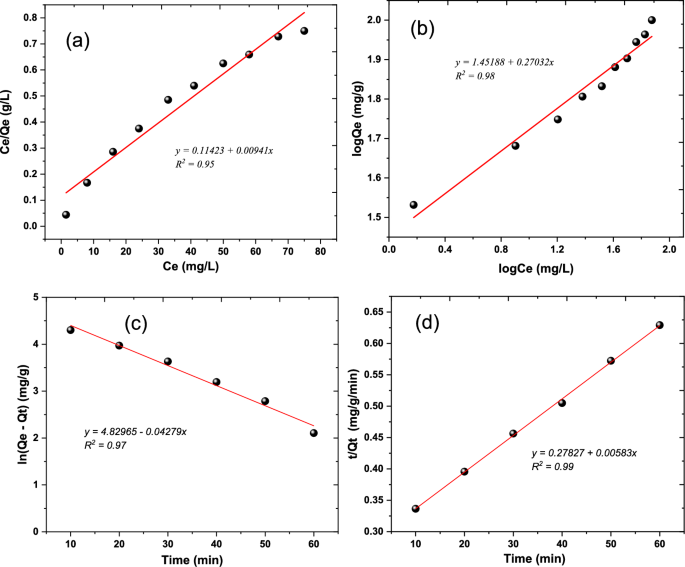
Widely utilized for data fitting, adsorption isotherm models are employed to examine the correlation between adsorbed quantity (Qe) and equilibrium aqueous concentration (Ce). Among these models, the Langmuir and Freundlich equations are the most commonly used (Eqs. 12, 13). The Langmuir model suggests that adsorbate molecules are taken up on a homogeneous surface through monolayer adsorption without interactions between the adsorbed molecules. In contrast, the Freundlich model is suitable for non-ideal adsorption on heterogeneous surfaces, where heterogeneity arises from the presence of different functional groups on the surface and various interactions between the adsorbent and adsorbate [54]. In this study, isotherm evaluations were carried out by employing variable initial concentrations of Cr(IV) ranging from 10 to 100 mg L−1 at a temperature of 318 K, utilizing 50 mg of the synthesized nanocomposite. Experimental data were used to fit the isotherm models of Langmuir and Freundlich. Linear adjustments of these models are depicted in Fig. 9a&b, with corresponding parameter values detailed in Table 3.
where Ce represents the equilibrium concentration of the solute in the liquid phase (mg/L). Qe is the amount of solute adsorbed per unit weight of adsorbent at equilibrium (mg/g). Qmax is the maximum adsorption capacity (mg/g). K is the Langmuir adsorption equilibrium constant (L/mg). Kf is the Freundlich adsorption equilibrium constant (mg^(1–1/n) L^(1/n)/g). n is the Freundlich exponent, which is an empirical parameter characterizing the adsorption intensity.
As per Table 3, the Langmuir model exhibited a determination coefficient (R2) of 0.95. The separation factor (RL), used to assess the favourability of an adsorption process (0 < RL < 1 for favourable, RL > 1 for unfavourable, RL = 0 for irreversible), yielded values ranging from 0.055. This suggests that the adsorption process is favourable within the studied concentration range [55]. The same Table 3 reveals that the Freundlich model yielded an R2 of 0.98. The heterogeneity factor, represented by the parameter n, is utilized to assess the nature of the adsorption process—physical (n > 1), chemical (n < 1), or linear (n = 1). With an n value of 0.69, it indicates that the chemical process is favourable [56].
Adsorption kinetics
Efficient adsorption relies on a rapid reaction rate, a brief contact time, and a substantial adsorption capacity. The kinetics of Cr(IV) adsorption by the CoFe2O4 nanocomposite, depicted in Fig. 9c&d, were examined using pseudo-first order (PFO) and pseudo-second order (PSO) kinetic equations, specifically Eqs. 14&15 [53]. The investigation revealed that the adsorption adhered to PSO kinetics, with a rate constant of 0.01 g mg−1 min−1, as evidenced by the highest correlation coefficient (R2) of 0.99.
where Qe and Qt represent the quantities of Cr(VI) at equilibrium and time t, respectively, measured in mg/g. The pseudo-first-order and pseudo-second-order adsorption rate constants are denoted as k1 (min−1) and k2 (g mg−1 min−1), respectively.
Catalyst reusability
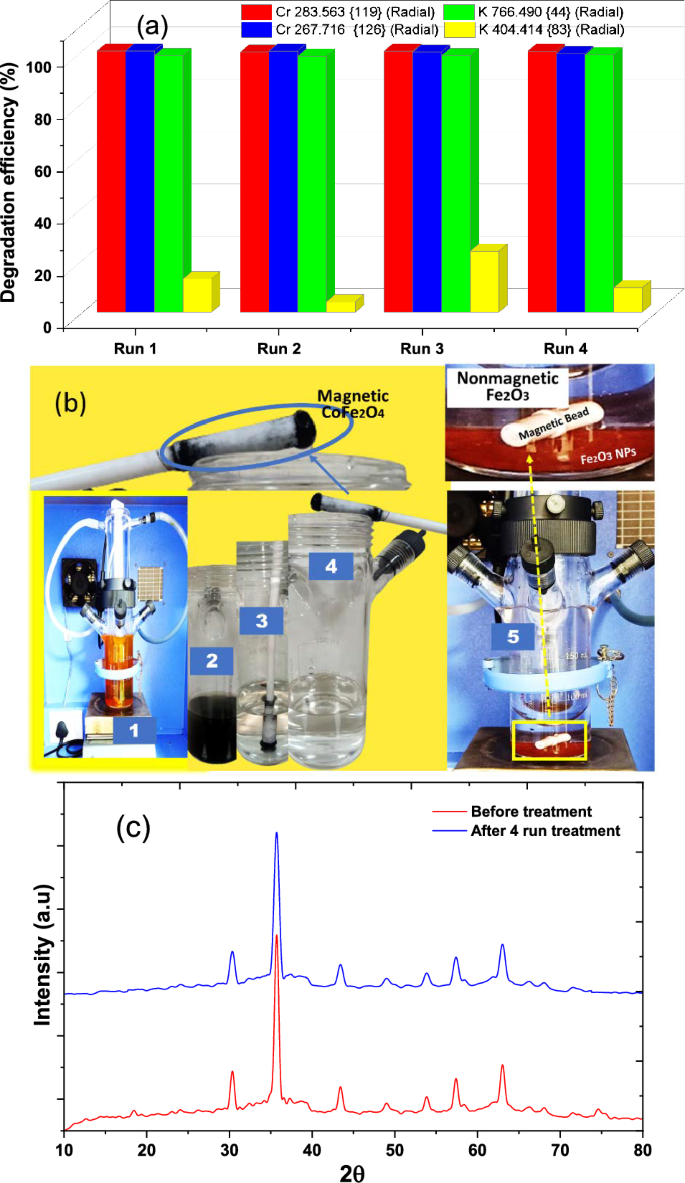
The efficiency of photocatalytic removal of chromium by CoFe2O4 nanoparticles and their reusability were confirmed through a four-cycle study, each lasting 90 min. The removal percentage of potassium dichromate solution was analyzed using ICP-OES after each cycle. Remarkably, approximately 99% removal was achieved for Cr 119, Cr 126, and K 44, with a 10% removal for K 83 after 90 min (Fig. 10a). The ICP results confirm the effective removal of chromium from the solution throughout the treatment process, and the nanoparticles displayed recyclability over four treatment cycles without significant alterations. The successful removal of chromium showcased the efficient magnetic collection of CoFe2O4 nanoparticles, evident from their inherent magnetic properties as depicted in Fig. 10b (2–4). Within just five minutes of immersing a bar magnet into the treated solution, the CoFe2O4 nanoparticles were promptly gathered. Contrastingly, Fig. 10b (5) emphasizes the nonmagnetic nature of Fe2O3 nanoparticles, rendering them resistant to collection using a bar magnet due to their lack of magnetic responsiveness. Building on this, the magnetic properties of spinel CoFe2O4, in conjunction with its high surface area, make it an ideal nanocatalyst for efficient contaminant removal. The oxidation–reduction activity of Co and Fe ions in this magnetic nanoparticle enables the breakdown of contaminants through their oxidation–reduction reactions. The specific arrangement of ions in the crystal lattice provides catalytic sites, facilitating processes such as organic pollutant removal. Additionally, depending on the conditions, spinel CoFe2O4 may exhibit photocatalytic properties, further enhancing its ability to remove contaminants. This dual functionality positions spinel CoFe2O4 as a versatile and effective material for environmental remediation applications [26,27,28,29, 57].
a Reussibility of CoFe2O4 nanoparticles for 4 cycles, b 1-Photocatalytic reactor containing a mixture of dichromate potassium solution and nanoparticles, 2–4-magnetic separation of treated solution and magnetic nanoparticles of CoFe2O4, 5-nonmagnetic Fe2O3 nanoparticles settle in to the treated sample and c XRD analysis after 4 cycles of treatment for CoFe2O4 nanoparticles
The X-ray diffraction analysis conducted on the nanomaterials following four cycles of treatment closely resembles the characteristics of the fresh sample, as illustrated in Fig. 10c. Moreover, the photocatalytic reduction of Cr(IV), as indicated in Table 4, showcases a remarkably efficient and noteworthy removal response when compared to analogous studies utilizing diverse nanocomposites.
Conclusion
In conclusion, this comprehensive study underscores the successful single-step and facile synthesis of CoFe2O4 magnetic nanoparticles, showcasing their outstanding photocatalytic chromium removal capabilities under visible light. Spectroscopic and microscopic analyses reveal these nanoparticles’ uniform distribution, emphasizing their practical applicability. The exceptional efficiency of CoFe2O4 nanoparticles in chromium effluent removal underscores the crucial role of magnetic properties in nanoparticle separation techniques, facilitating their practical collection post-remediation. Furthermore, the comparison with non-magnetic Fe2O3 nanoparticles emphasizes the importance of tailoring separation methods to nanoparticle characteristics. By effectively addressing the challenge of isolating different types of nanoparticles, this study contributes to advancing environmentally friendly technologies and practices. The optimized chromium removal capacity and the enhanced understanding of temperature effects on chromium adsorption further strengthen the potential applications of CoFe2O4 nanocomposites in water treatment processes.
Data availability
All data are included in the article.
References
Sodhi V, Sohpal VK (2011) Treatment of chromium(VI) containing aqueous effluent of tanneries and electroplating units by membrane process
Gheju M, Iovi A, Balcu I (2008) Hexavalent chromium reduction with scrap iron in continuous-flow system: Part 1: effect of feed solution pH. J Hazard Mater 153:655–662. https://doi.org/10.1016/J.JHAZMAT.2007.09.009
Gong Y, Liu X, Huang L, Chen W (2010) Stabilization of chromium: an alternative to make safe leathers. J Hazard Mater 179:540–544. https://doi.org/10.1016/J.JHAZMAT.2010.03.037
Tafese Bezuneh T, Haile Fereja T, Li H, Jin Y (2023) Solid-phase pyrolysis synthesis of highly fluorescent nitrogen/sulfur codoped graphene quantum dots for selective and sensitive diversity detection of Cr(VI). Langmuir 39:1538–1547. https://doi.org/10.1021/acs.langmuir.2c02966
Costa M (2003) Potential hazards of hexavalent chromate in our drinking water. Toxicol Appl Pharmacol 188:1–5. https://doi.org/10.1016/S0041-008X(03)00011-5
Losi ME, Amrhein C, Frankenberger WT (1994) Environmental biochemistry of chromium
Poornima K, Karthik L, Swadhini SP et al (2010) Degradation of chromium by using a novel strains of Pseudomonas species. J Microb Biochem Technol 2:95–99. https://doi.org/10.4172/1948-5948.1000031
Djellabi R, Su P, Elimian EA et al (2022) Advances in photocatalytic reduction of hexavalent chromium: from fundamental concepts to materials design and technology challenges. J Water Process Eng 50:103301. https://doi.org/10.1016/J.JWPE.2022.103301
Liu Z, Yu Y, Zhu X et al (2022) Semiconductor heterojunctions for photocatalytic hydrogen production and Cr(VI) reduction: a review. Mater Res Bull 147:111636. https://doi.org/10.1016/J.MATERRESBULL.2021.111636
Lu S, Shen L, Li X et al (2022) Advances in the photocatalytic reduction functions of graphitic carbon nitride-based photocatalysts in environmental applications: a review. J Clean Prod 378:134589. https://doi.org/10.1016/J.JCLEPRO.2022.134589
Wang X, Pehkonen SO, Ray AK (2004) Photocatalytic reduction of Hg(II) on two commercial TiO2 catalysts. Electrochim Acta 49:1435–1444. https://doi.org/10.1016/J.ELECTACTA.2003.10.030
Pandikumar A, Jothivenkatachalam K (2019) Photocatalytic functional materials for environmental remediation, (1st ed)
Singh P, Shandilya P, Raizada P et al (2020) Review on various strategies for enhancing photocatalytic activity of graphene based nanocomposites for water purification. Arab J Chem 13:3498–3520. https://doi.org/10.1016/J.ARABJC.2018.12.001
Mohamed RM, McKinney DL, Sigmund WM (2012) Enhanced nanocatalysts. Mater Sci Eng R Rep 73:1–13. https://doi.org/10.1016/J.MSER.2011.09.001
Balarabe BY, Maity P (2022) Visible light-driven complete photocatalytic oxidation of organic dye by plasmonic Au-TiO2 nanocatalyst under batch and continuous flow condition. Colloids Surf A Physicochem Eng Asp 655:130247. https://doi.org/10.1016/J.COLSURFA.2022.130247
Yaou Balarabe B, Maity P (2024) A polymer-Au/TiO2 nano-composite based floating catalyst for photocatalytic dye degradation under natural sunlight. J Photochem Photobiol A Chem. https://doi.org/10.1016/j.jphotochem.2023.115405
Yaou Balarabe B (2023) Green synthesis of gold-titania nanoparticles for sustainable ciprofloxacin removal and phytotoxicity evaluation on aquatic plant growth. Hybrid Advances 4:100107. https://doi.org/10.1016/j.hybadv.2023.100107
Balarabe BY, Maity P (2022) Visible light-driven complete photocatalytic oxidation of organic dye by plasmonic Au-TiO2 nanocatalyst under batch and continuous flow condition. Colloids Surf A Physicochem Eng Asp. https://doi.org/10.1016/j.colsurfa.2022.130247
Balarabe BY, Maity P, Teixeira ACSC, Iwarere SA (2023) h-BN nanosheet-modified Ag2WO4 nanocomposite for improved photocatalytic dye removal: insights into catalyst stability and reusability. Inorg Chem Commun. https://doi.org/10.1016/j.inoche.2023.111560
Yaou Balarabe B, Paria S, Sekou Keita D et al (2022) Enhanced UV-light active α-Bi2O3 nanoparticles for the removal of methyl orange and ciprofloxacin. Inorg Chem Commun. https://doi.org/10.1016/j.inoche.2022.110204
Yaou Balarabe B, Irédon A, Hassimi M et al (2023) Effective removal of emerging organic pollutants using hybrid Ag@ZnO supported reduced-graphene oxide nanocomposite under visible light. Hybrid Advances 4:100114. https://doi.org/10.1016/j.hybadv.2023.100114
Sajid MM, Khan SB, Javed Y et al (2021) Bismuth vanadate/MXene (BiVO4/Ti3C2) heterojunction composite: enhanced interfacial control charge transfer for highly efficient visible light photocatalytic activity. Environ Sci Pollut Res 28(29):35911–35923. https://doi.org/10.1007/s11356-021-13315-9
Gadore V, Mishra SR, Ahmaruzzaman M (2023) Metal sulphides and their heterojunctions for photocatalytic degradation of organic dyes—a comprehensive review. Environ Sci Pollut Res 30(35):90410–90457. https://doi.org/10.1007/s11356-023-28753-w
Dey AK, Mishra SR, Ahmaruzzaman M (2023) Solar light–based advanced oxidation processes for degradation of methylene blue dye using novel Zn-modified CeO2@biochar. Environ Sci Pollut Res 30(31):53887–53903. https://doi.org/10.1007/s11356-023-26183-2
Mishra SR, Gadore V, Ahmaruzzaman M (2023) A critical review on In2S3-based nanomaterial for emerging contaminants elimination through integrated adsorption-degradation technique: effect of reaction parameters and co-existing species. J Hazard Mater Lett. https://doi.org/10.1016/j.hazl.2023.100087
Kalam A, Al-Sehemi AG, Assiri M et al (2018) Modified solvothermal synthesis of cobalt ferrite (CoFe2O4) magnetic nanoparticles photocatalysts for degradation of methylene blue with H2O2/visible light. Results Phys 8:1046–1053. https://doi.org/10.1016/J.RINP.2018.01.045
Liu Z, Feng H, Xue S et al (2018) The triple-component Ag3PO4-CoFe2O4-GO synthesis and visible light photocatalytic performance. Appl Surf Sci 458:880–892. https://doi.org/10.1016/J.APSUSC.2018.07.166
Melo RS, Banerjee P, Franco A (2018) Hydrothermal synthesis of nickel doped cobalt ferrite nanoparticles: optical and magnetic properties. J Mater Sci Mater Electron 29:14657–14667. https://doi.org/10.1007/s10854-018-9602-2
Zeng Y, Guo N, Song Y et al (2018) Fabrication of Z-scheme magnetic MoS2/CoFe2O4 nanocomposites with highly efficient photocatalytic activity. J Colloid Interface Sci 514:664–674. https://doi.org/10.1016/J.JCIS.2017.12.079
Ghobadifard M, Mohebbi S (2018) Novel nanomagnetic Ag/β-Ag2WO4/CoFe2O4 as a highly efficient photocatalyst under visible light irradiation. New J Chem 42:9530–9542. https://doi.org/10.1039/c8nj00834e
Li M, Song C, Wu Y et al (2019) Novel Z-scheme visible-light photocatalyst based on CoFe2O4/BiOBr/Graphene composites for organic dye degradation and Cr(VI) reduction. Appl Surf Sci 478:744–753. https://doi.org/10.1016/j.apsusc.2019.02.017
Emadian SS, Ghorbani M, Bakeri G (2020) Magnetically separable CoFe2O4/ZrO2 nanocomposite for the photocatalytic reduction of hexavalent chromium under visible light irradiation. Synth Met. https://doi.org/10.1016/j.synthmet.2020.116470
Ibrahim I, Kaltzoglou A, Athanasekou C et al (2020) Magnetically separable TiO2/CoFe2O4/Ag nanocomposites for the photocatalytic reduction of hexavalent chromium pollutant under UV and artificial solar light. Chem Eng J. https://doi.org/10.1016/j.cej.2019.122730
Yaou Balarabe B, Illiassou Oumarou MN, Koroney AS et al (2023) Photo-oxidation of organic dye by Fe2O3 nanoparticles: catalyst, electron acceptor, and polyurethane membrane (PU-Fe2O3) effects. J Nanotechnol. https://doi.org/10.1155/2023/1292762
Rackauskas S, Nasibulin AG, Jiang H et al (2009) A novel method for metal oxide nanowire synthesis. Nanotechnology. https://doi.org/10.1088/0957-4484/20/16/165603
Kharat PB, Somvanshi SB, Kounsalye JS, et al (2018) Temperature dependent viscosity of cobalt ferrite/ethylene glycol ferrofluids. In: AIP conference proceedings. American Institute of Physics Inc.
Balarabe BY, Bowmik S, Ghosh A, Maity P (2022) Photocatalytic dye degradation by magnetic XFe2O3 (X: Co, Zn, Cr, Sr, Ni, Cu, Ba, Bi, and Mn) nanocomposites under visible light: a cost efficiency comparison. J Magn Magn Mater 562:169823. https://doi.org/10.1016/J.JMMM.2022.169823
Mishra SR, Roy P, Gadore V, Ahmaruzzaman M (2023) A combined experimental and modeling approach to elucidate the adsorption mechanism for sustainable water treatment via In2S3-anchored chitosan. Sci Rep. https://doi.org/10.1038/s41598-023-45506-4
Yadav N, Yadav G, Ahmaruzzaman M (2023) Fabrication of surface-modified dual waste-derived biochar for biodiesel production by microwave-assisted esterification of oleic acid: optimization, kinetics, and mechanistic studies. Renew Energy 218:119308. https://doi.org/10.1016/J.RENENE.2023.119308
Narsimulu D, Rao BN, Nagaraju G et al (2020) Enhanced energy storage performance of nanocrystalline Sm-doped CoFe2O4 as an effective anode material for Li-ion battery applications. J Solid State Electrochem 24:225–236. https://doi.org/10.1007/s10008-019-04484-2
Singh H, Kumar Sinha A, Gupta SM, et al (2015) Two step solid state synthesis and Synchrotron X-ray characterizations of ceramic Co3TeO6; an improper multiferroic two step solid state synthesis and synchrotron X-ray characterizations of ceramic Co3 TeO6 ; an improper multiferroic*
Zhang S, Zeng M, Li J et al (2014) Porous magnetic carbon sheets from biomass as an adsorbent for the fast removal of organic pollutants from aqueous solution. J Mater Chem A Mater 2:4391–4397. https://doi.org/10.1039/c3ta14604a
Mao J, Zhao B, Zhou J et al (2019) Identification and characteristics of catalytic quad-functions on Au/Anatase TiO2. ACS Catal 9:7900–7911. https://doi.org/10.1021/acscatal.9b02090
Rosado G, Valenzuela-Muñiz AM, Miki-Yoshida M, Gómez YV (2020) Facile method to obtain anatase and anatase-brookite nanoparticles (TiO2) with MWCNT towards reducing the bandgap. Diam Relat Mater 109:108015. https://doi.org/10.1016/J.DIAMOND.2020.108015
Yuan Y, Wood SM, He K et al (2015) Atomistic insights into the oriented attachment of tunnel-based oxide nanostructures. ACS Nano 10:539–548. https://doi.org/10.1021/acsnano.5b05535
Samrot AV, Sahithya CS, Jenifer Selvarani A et al (2019) Surface-engineered super-paramagnetic iron oxide nanoparticles for chromium removal. Int J Nanomedicine 14:8105–8119. https://doi.org/10.2147/IJN.S214236
Jegatha Christy A, Umadevi M (2013) Novel combustion method to prepare octahedral NiO nanoparticles and its photocatalytic activity. Mater Res Bull 48:4248–4254. https://doi.org/10.1016/j.materresbull.2013.06.072
Gondal MA, Saleh TA, Drmosh QA (2012) Synthesis of nickel oxide nanoparticles using pulsed laser ablation in liquids and their optical characterization. Appl Surf Sci 258:6982–6986. https://doi.org/10.1016/j.apsusc.2012.03.147
Fox MA, Dulay MT (1993) Heterogeneous photocatalysis
Duraiswami D, Revathi S (2007) Photocatalytic degradation of tatrazine dye using TiO2 catalyst: salt effect and kinetic studies oxidation reaction view project conversion of bio-glycerol into other value added products view project
Torki F, Faghihian H (2017) Photocatalytic activity of NiS, NiO and coupled NiS–NiO for degradation of pharmaceutical pollutant cephalexin under visible light. RSC Adv 7:54651–54661. https://doi.org/10.1039/c7ra09461b
Salman M, Athar M, Farooq U (2015) Biosorption of heavy metals from aqueous solutions using indigenous and modified lignocellulosic materials. Rev Environ Sci Biotechnol 14:211–228
AL-Othman ZA, Ali R, Naushad M, (2012) Hexavalent chromium removal from aqueous medium by activated carbon prepared from peanut shell: adsorption kinetics, equilibrium and thermodynamic studies. Chem Eng J 184:238–247. https://doi.org/10.1016/J.CEJ.2012.01.048
Deng H, Yang L, Tao G, Dai J (2009) Preparation and characterization of activated carbon from cotton stalk by microwave assisted chemical activation—application in methylene blue adsorption from aqueous solution. J Hazard Mater 166:1514–1521. https://doi.org/10.1016/J.JHAZMAT.2008.12.080
Weber TW, Chakravorti RK (1974) Pore and solid diffusion models for fixed-bed adsorbers
Pezoti O, Cazetta AL, Souza IPAF et al (2014) Adsorption studies of methylene blue onto ZnCl2-activated carbon produced from buriti shells (Mauritia flexuosa L.). J Ind Eng Chem 20:4401–4407. https://doi.org/10.1016/J.JIEC.2014.02.007
Mishra SR, Gadore V, Ahmaruzzaman M (2023) Inorganic–organic hybrid quantum dots for AOP-mediated photodegradation of ofloxacin and para-nitrophenol in diverse water matrices. NPJ Clean Water. https://doi.org/10.1038/s41545-023-00291-5
Lv Z, Tan X, Wang C et al (2020) Metal-organic frameworks-derived 3D yolk shell-like structure Ni@carbon as a recyclable catalyst for Cr(VI) reduction. Chem Eng J 389:123428. https://doi.org/10.1016/J.CEJ.2019.123428
Zhang G, Chen D, Li N et al (2018) Preparation of ZnIn2S4 nanosheet-coated CdS nanorod heterostructures for efficient photocatalytic reduction of Cr(VI). Appl Catal B 232:164–174. https://doi.org/10.1016/J.APCATB.2018.03.017
Lara MA, Jaramillo-Páez C, Navío JA et al (2019) Coupling of WO3 with anatase TiO2 sample with high 001 facet exposition: effect on the photocatalytic properties. Catal Today 328:142–148. https://doi.org/10.1016/J.CATTOD.2018.11.012
Othman Ali I, Mostafa AG (2015) Photocatalytic reduction of chromate oxyanions on MMnFe2O4 (M=Zn, Cd) nanoparticles. Mater Sci Semicond Process 33:189–198. https://doi.org/10.1016/J.MSSP.2015.01.030
Zhang G, Chen D, Li N et al (2018) SnS2/SnO2 heterostructured nanosheet arrays grown on carbon cloth for efficient photocatalytic reduction of Cr(VI). J Colloid Interface Sci 514:306–315. https://doi.org/10.1016/J.JCIS.2017.12.045
Mishra SR, Gadore V, Ahmaruzzaman M (2023) Insights into persulfate-activated photodegradation of tinidazole and photoreduction of hexavalent chromium through β-In2S3 anchored on Ag-doped fish scale-derived HAp composite quantum dots. J Clean Prod. https://doi.org/10.1016/j.jclepro.2023.139221
Acknowledgements
We are grateful for the assistance provided by the National Forensic Sciences University. The authors would also like to thank Ms Manka Marycleopha from the School of Forensic Sciences, National Forensic Sciences University, India for the necessary assistance on some of the analysis during the revision of the manuscript.
Funding
Open access funding provided by University of Pretoria.
Author information
Authors and Affiliations
Corresponding author
Ethics declarations
Conflict of interest
The authors declare that they have no conflict of interest.
Ethical approval
There are no human or animal subjects included in this article.
Additional information
Publisher's Note
Springer Nature remains neutral with regard to jurisdictional claims in published maps and institutional affiliations.
Supplementary Information
Below is the link to the electronic supplementary material.
Rights and permissions
Open Access This article is licensed under a Creative Commons Attribution 4.0 International License, which permits use, sharing, adaptation, distribution and reproduction in any medium or format, as long as you give appropriate credit to the original author(s) and the source, provide a link to the Creative Commons licence, and indicate if changes were made. The images or other third party material in this article are included in the article's Creative Commons licence, unless indicated otherwise in a credit line to the material. If material is not included in the article's Creative Commons licence and your intended use is not permitted by statutory regulation or exceeds the permitted use, you will need to obtain permission directly from the copyright holder. To view a copy of this licence, visit http://creativecommons.org/licenses/by/4.0/.
About this article
Cite this article
Yaou Balarabe, B., Bomokayi, P., Adjama, I. et al. Unlocking the magnetic potential of Fe2O3 nanoparticles by single-step synthesis of cobalt-infused nanomaterials for chromium removal. Nanotechnol. Environ. Eng. 9, 239–253 (2024). https://doi.org/10.1007/s41204-024-00366-9
Received:
Accepted:
Published:
Issue Date:
DOI: https://doi.org/10.1007/s41204-024-00366-9


