
Abstract
Advanced laboratory system of rock permeability test associated with constant flow pump, and constant head permeability techniques were developed to measure permeability and specific storage of rock for supercritical CO2. The laboratory system was designed to be capable in reproducing similar physical condition of deep aquifer within high pressure and high temperature where CO2 tends to be in supercritical state. To analyze the result of permeability tests, mathematical models of constant flow pump and constant head permeability techniques were modified to deal with two-phase flow drainage displacement of CO2-water in rock. For the examination of its applicability, experimental tests and numerical analysis were undertaken. The accuracy of the obtained specific storage was validated by employing a ratio of the specific storage of the rock specimen to the storage capacity of the pump used in the permeability test. It was found that the specific storage of low permeability sandstone for storing supercritical CO2 is 1.63 × 10⁻⁴ 1/Pa, while large permeability sandstone has the specific storage for supercritical CO2 at 1.12 × 10⁻⁷ 1/Pa. This finding suggested that advanced experimental system of constant flow pump and constant head permeability technique can be used as repeatable, accurate and standardized laboratory test in measuring specific storage of sedimentary rock for CO2 in supercritical state.
Introduction
It has been widely believed that, over the past several 100 years, CO2 emission into the atmosphere has increased steadily and become a major contributing factor to global warming [6]. The increase of CO2 is mainly attributed from burning coal, oil and natural gas for electrical generation, transportation, industrial and domestic needs [8]. Even, in modern agriculture and irrigation system, the use of fossil fuel for ground water pumping of irrigation has been practiced in many countries, releasing a huge amount of CO2 emission [9, 19–23, 26]. The growing of CO2 concentration in atmosphere will disrupt global climate, which in turn raising the sea level, causing floods in lowered level areas and damaging the ecosystem.
Multi approaches are urgently needed to reduce CO2 emission to atmosphere. They include efficient production and use of energy; exploration of non-fossil fuel energies such as solar power, wind energy, biomass; and development of technologies of disposing CO2 emission such as CO2 ocean storage, CO2 mineral carbonation, and carbon capture and geological storage (CCGS) [8]. The latter, CCGS, is considered the most promising option to reduce atmospheric CO2 emission among due to large storage capacity expected to deal with the increasing anthropogenic CO2 emissions, and its readiness for being applied in similarity with the enhanced oil recovery (EOR) technique experienced in petroleum industries [8, 14]. CCGS is initiated with CO2 capture which is a process of capturing CO2 produced from combustion of fossil fuels in power plant and natural gas processing. CO2 capture involves three distinctive systems, such as post-combustion, pre-combustion, and oxy-combustion systems [7]. Those systems utilize several gas separating technologies, including the application of sorbent/solvent, membranes, or cryogenic distillation techniques. To illustrate a simple mechanism of gas separating technique, CO2-containing gas is circulated to get contacted intimately with a liquid absorbent or solid sorbent which is capable of capturing the CO2. Afterward, the sorbent loaded with the captured CO2 is then transported to a different vessel, where it releases the CO2 through the process of heating or pressure decreasing [8]. The sorbent is then sent back to capture more CO2 within a cyclic process. All CO2 capture systems for large scale CCGS are costly, so that recent studies still undergo to reduce the cost of CO2 capture. In next phase of CCGS, the captured CO2 is liquefied and then transported through pipeline network to a storage site where it is injected into deep geological formation to be retained away from the atmosphere for a very long time [7].
However, prior to large scale implementation of CCGS, detail studies are fundamentally required to obtain a good understanding about the physical and chemical behavior of water-CO2 multiphase flow in deep geological formation. In addition, specific storage of rock formation in retaining CO2 has become critical since this will be a key factor in determining the volume of CO2 emission that could be injected and stored in a certain type of deep geological formation. Specific storage is the capacity of rock specimen to release fluid from the pores as a response of declined fluid pressure. Accurate, repeatable, and reliable measurement of specific storage of rock for CO2 with standardized and comparable laboratory experiments remains a research subject [12]. One of laboratory tests utilized for measuring permeability with considering specific storage of rock is constant flow pump technique, introduced by Olsen et al. [13] and Brace et al. [2]. In this technique, a constant rate of flow is generated to precisely control pore fluid transport processes in a rock specimen. The flow of fluid through the rock specimen drives a hydraulic head that transiently increases and subsequently stabilizes to steady state with a constant head gradient imposed across the rock specimen. Using Darcy’s law, the corresponding permeability can be determined based on the steady state data collected. However, due to steady condition is difficult to be achieved within a short period of time, specially for the condition of a large specimen or a large pump system, Morin and Olsen [11] developed a mathematical model to analyze its transient pressure response by considering the storage capacity of the specimen. This enables the determination of the permeability in early testing time. Later, Esaki et al. [5] enhances the accuracy and efficiency of the mathematical model by considering the effect of storage capacity of the pump system. Song et al. [17] introduced more straightforward mathematical model of the technique with less tedious numerical simulation to solve the model.
Constant flow pump permeability technique is generally employed for measuring permeability and specific storage of rock in a standard pressure and temperature. For measuring specific storage of rock at the condition of high pressure and high temperature, the permeability technique, however, necessitates such advanced development in its experimental system. The development will enable the constant flow pump permeability technique to measure permeability and specific storage of rock with similar physical condition of deep reservoir expected for geological CO2 storage. In addition, the constant flow pump permeability technique is based on a single-phase flow permeability test. It needs to be extended for two-phase flow permeability test so that it is able to deal with two-phase flow in CO2-water in deep reservoir. To fill those two research gaps, this paper presents an advanced laboratory system of rock permeability and specific storage test, employing the constant flow pump permeability, and the constant head permeability techniques. Its experimental system is capable to create high temperature and high pressure to maintain physical characteristic of CO2 in supercritical phase, within similar physical condition of deep reservoir, expected for geological CO2 storage. Their extended mathematical models from a single-phase flow to two-phase flow-based permeability test are also presented. The validity and applicability of the techniques are explained in the last section of this paper.
Advanced experimental system of permeability test
It must be noted that physical characteristic of CO2 depends on its temperature and pressure. In existing CO2 injection fields such as reservoir at the depth 800–1100 m in Sleipner North Sea Project, it is found that the temperatures and pressures at reservoir of those fields are beyond the critical point of 31.1 °C and 7.39 MPa (Fig. 1), indicating CO2 in supercritical phase [16]. Hence, experimental system of permeability test must be able to reproduce such similar physical condition of reservoir, and the phase of supercritical CO2 can be maintained during the experiment of measuring permeability and specific storage of rock for CO2.

CO2 phases in the existing CO2 injection fields (after [16])
The use of standard permeability test cannot be performed because it is still vulnerable to unstable temperature due to seasonal weather, and heat induced by laboratory apparatus, which in turn affecting the physical property of CO2 during the test. Therefore, in this study, experimental system was set up to deal with high pressure and high temperature (Fig. 2). Indoor laboratory temperature was isolated by constructing a greenhouse chamber, and the temperatures of permeability test apparatus were controlled by installing several devices as follows:

Adapted from Mitani et al. [10]
Schematic diagram of rock permeability test with newly developed laboratory system.
-
Thermostatic room designed by Koito Limited Inc. to control temperature in the experimental chamber. This chamber is able to control temperature room from 15 to 25 °C with ±0.1 °C errors;
-
Hemathermal circulation tank, and cylinder pump jackets manufactured by ISCO. The temperature in the pump jackets were controlled by circulating water at the desired temperature using a hemathermal circulation tank (manufactured by NCB-1200 EYERA);
-
Constant temperature water tanks. The temperature of the syringe pipes connecting the syringe pump and pressure vessel was controlled by submerging the syringe pipes in a bath with circulated water at desired temperature;
-
Temperature controller for pressure vessel. A temperature controller TJA-550 (manufactured by As ONE) was utilized to control the temperature of pressure vessel;
-
Thermocoupler and heater bars were attached on the specimen to control and measure the specimen temperature (Fig. 3); and
Fig. 3 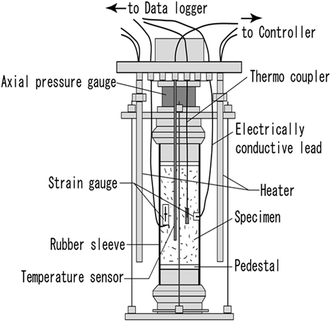
Rock specimen with strain measurement devices and temperature controller
-
Remote measurement and data acquisition system.

Pore size characteristics of rock specimens
Several samples of Ainoura sandstone and Berea sandstone were employed as rock sample for permeability and specific storage test. Ainoura sandstones were obtained from Nagasaki Prefecture Japan while Berea Sandstones were commercially obtained from Ohio, USA. Pore size distributions of those sandstone were investigated using mercury intrusion porosimeter. In this way, pore size was characterized by applying various levels of pressure to a sandstone sample immersed in mercury. The pressure, which is required to intrude the mercury into the pores of the sandstone is inversely proportional to the size of the pores. Only slight pressure is required to intrude mercury into large macropores, whereas much greater pressures are required to force mercury into small pores. From the pressure versus intrusion data, pore volume and pore throat size distribution were generated using the Washburn equation. It can be seen in Table 1 that the Ainoura sandstones are dominated by micropores (pores with the diameter below 1 μm), at a range of 51.06–64.7 %, while Berea sandstone is dominated by macropores (pores with the diameter above 3 μm), at 76.32 %. As portion microporosity in the Ainoura sandstones are so high, it creates a high capillary pressure at a range of 18.2–27.5 kPa pressure threshold. This is much higher than that of the Berea sandstone with a 3.21 kPa pressure threshold (Table 1). The pore size distribution in the Ainoura sandstones is more heterogeneous with bi-modal distribution. On the other hand, pore size distribution in the Berea sandstone is homogeneous with uni-modal distribution (Fig. 4). The pore throat size of 1000 nm or 1–2 μm dominate the Ainoura sandstones with pore volume at 0.005 cm3/g. On the other hand, the dominant pore throat size in Berea sandstone is 10 μm with 0.025 cm3/g pore volume. In addition, cumulative pore volume of the Berea sandstone is significantly larger than that of the Ainoura sandstone 2, 0.12 against 0.07 cm3/g, but it is lower than that of the Ainoura sandstone 1 at 0.15 cm3/g. High microporosity of the Ainoura sandstones resulted in higher capillary pressures at 27.5 kPa capillary pressure threshold (Fig. 5), higher than the Berea sandstone with 3.21 kPa. In general, the Ainoura sandstones have bi-modal distribution whereas the Berea sandstone has uni-modal distribution. This indicates that pore characteristic of the Ainoura sandstones are more heterogeneous than the Berea sandstone.

a Pore size distribution of the Ainoura sandstones 1 and 2, and b pore size distribution of the Ainoura sandstone and the Berea sandstone

Capillary pressures of a the Ainoura sandstones 1 and 2, and b the Ainoura sandstone and Berea sandstone
Method of permeability test
Two different permeability test methods were undertaken including constant flow pump and constant head permeability techniques. In constant flow pump technique, supercritical CO2 at constant flow rate was injected into the rock specimen and the generated hydraulic pressures were measured continuously. On the other hand, at constant head technique, a constant differential head across rock specimen was maintained during the injection of supercritical CO2 into rock specimen, so that inflow and outflow of supercritical CO2 can be driven.
Constant flow pump permeability technique
Figure 6 illustrates the experimental system of the injection of supercritical CO2 into the Ainoura sandstone using the flow pump permeability test. The procedure of experimental test of CO2 injection into the rock specimen can be divided into three steps: preparation, setting temperature and pressure, and CO2 injection. The period of preparation and setting temperature and pressures comprised about 85 % of total period of experimental test. Rock specimen was dried for a whole day before placing into the container. Subsequently, the rock specimen was saturated with water. Vacuum pump was employed to discharge the bubbles out from the specimen. The temperature controller loaded 35 °C at the cylinder jackets whereas the temperature controller sets 36 °C at the water tank. In the same time, the temperature of pressure vessel was set at 38 °C. An electric heater was used to control the temperature in the greenhouse chamber at 35 °C, and the thermostatic room at 20 °C.

Schematic diagram of experimental test of CO2 injection
Once the temperatures becoming stable, the rock specimen was placed in the tri-axial chamber. The confining pressure at the tri-axial chamber was loaded by increasing its pressure up to the predetermined pressure. Afterward, initial pore pressure was loaded on the rock specimen using the upstream syringe pump. The predetermined pressure and temperature over the rock specimen were kept stable over 24 h and any leakage that might be occurred in the system was checked. If the pressure and temperature remain stable, the upstream pump was switched to constant flow rate mode, ready for permeability test. Measurements of pressure at the upstream and downstream of the rock specimen was continuously undertaken, monitored and recorded with a data logger connected to a PC. The measurements were undertaken by employing the pressures of two gauges with resolution of 50 cm H2O or 0.0049 MPa, manufactured by Research Institute Tokyo. Besides that, longitudinal and axial strains of the rock specimen were also measured. A simple software was developed for data acquisition system, and also for remotely controlling the syringe pumps. The precision of the measurement can be seen from the record of the pressure in outlet and inlet of the rock specimen for every 2 s. Therefore, around 24 million of pressure data during the experiment can be obtained.
Prior to CO2 injection into rock specimen, intrinsic permeability of the rock specimen was measured at laboratory standard condition. Temperatures at pressure vessel, syringe pump and the water tank were set to 20 °C. The confining pressure in the tri-axial chamber was set to 20 MPa. Purified water with a constant flow rate of 3 μl/min was injected into the rock specimen with fully saturated condition in order to generate a 10 MPa pore pressure. The differential pressure of the upstream and downstream gauges was measured. Once it reached a steady state, the differential pressure can be used to determine hydraulic conductivity of the rock specimen using Darcy’s law.
After injection of the purified water for measuring hydraulic conductivity, the pressure in the upstream pump was set back to 10 MPa. The water in the upstream pump was discharged and replaced by CO2. The temperature was increased up to 35 °C by setting the temperatures at the syringe pumps, pipes and pressure vessel up to 35, 36, and 38 °C correspondingly. CO2 was injected to the specimen in the same flow rate (3 μl/min). During the injection of CO2 into rock specimen, the generated differential hydraulic pressures across the rock specimen (Ainoura sandstone) were measured. The injection of CO2 increased the hydraulic pressure both in the downstream and upstream of the specimen. However, it is clear that the differential pressure between the upstream and the downstream exhibited such three stages of CO2 flowing through the specimen (Fig. 7). First stage, the differential pressure increased transiently and stabilized at a certain level. The similarity pattern and closed magnitude with the results obtained from the previous permeability test with water injection, indicated this stage is the period of the displaced water flow. In the second stage, the differential pressure suddenly increased again achieving higher level before it stabilized over certain times. This stage suggested that the injected CO2 has already penetrated the bottom of the specimen and begun displacing the saturated water out from the specimen pores. A drop of the downstream pressure associated with the effect of capillary pressure, has led to a transient increase of the differential pressure. Effect capillary pressure is a result of the specimen pores retained the saturated water until the injected CO2 pressure exceeded the pore-water holding pressure. This phenomenon is what Richardson et al. [15] and Dana and Skoczylas [4] suggested as capillary end effect or capillary pressure effect, which occur on two-phase displacement flow in sandstone. In the third stage, the differential pressure slowly decreased since the injected CO2 was able to penetrate the bottom of the rock specimen. Such stepwise slowly decrease of the differential pressure was observed at this stage, implying the process of CO2-water displacement in the specimen occurred in more bypass rather than sweep flow. This is consistent with what Bennion and Bachu [1] suggested as the characteristic of flow in bi-modal pore characteristics.

Measured differential hydraulic pressure across rock specimen during CO2 injection
Constant head permeability technique
Before the injection of CO2, water was injected into the rock specimen to measure hydraulic conductivity. The initial condition was generated by applying confining pressure of 20 MPa and the pore pressure of 10 MPa on the rock specimen. The temperature was set to be 20 °C. A constant differential pressure was applied and purified water was injected into the rock specimen. At an equilibrium, either the inflow or outflow was used to determine the hydraulic conductivity based on Darcy ‘Law. It was found that the average hydraulic conductivity for the Ainoura sandstone is 2.57 × 10⁻⁸ cm/s, while that for the Berea sandstone is 2.95 × 10⁻⁶ cm/s.
After injection of the purified water for measuring hydraulic conductivity, the pressure in the upstream pump was set back to 10 MPa. The water in the upstream pump was discharge and replaced by CO2. The temperature was increased up to 35 °C by setting the temperatures at the syringe pumps, pipes and pressure vessel up to 35, 36, and 38 °C correspondingly. CO2 was injected to the specimen in the same flow rate (3 μl/min).
The injection of CO2 into the rock specimen was then conducted in which constant differential pressure across the rock specimen was controlled at 2000 cm H2O for Ainoura sandstone and 300 cm H2O for Berea sandstone, respectively.
Figure 8 shows the inflow and outflow at the rock specimen during the test. It was observed that the inflow and outflow at the specimen increased transiently at the beginning period of the injection. The Berea sandstone is obviously easy to achieve steady condition, while the Ainoura sandstone remained unstable even after 100-h period of CO2 injection. At the Berea sandstone, the flow of CO2 increased transiently. At period of 50 h, it begun to decrease, and then achieved a steady state. Nonetheless, it seems a bit increased due to the effect of the compressibility of the upstream pump. In contrast, the inflow to and outflow of CO2 from the Ainoura sandstone were fluctuated, and still being unsteady until the experiment ended (Fig. 8b). As it is expected, high permeability of the Berea sandstone contributes to the steady flow, faster than the Ainoura sandstone which has a lower permeability.

Inflow and outflow measured in the Berea sandstone (a) and the Ainoura sandstone (b)
Mathematical model of constant flow pump permeability technique
The mathematical model of the flow pump permeability technique can be described as one-dimensional transient flow of a compressible fluid through a saturated porous and compressible medium. This model combines the principle of fluid mass in a deformable matrix and Darcy’s law for laminar flow through a hydraulic isotropic rock matrix [24]. Since the experimental system of CO2 injection into low permeable rock saturated with water can be described as a two-phase flow drainage displacement process, volumetric balance can be employed.
Therefore, the flow rate of the injected fluid is equal to the total flow rate of the displaced and displacing fluid, after breaking through. Due to the compressibility of the displacing fluid (supercritical CO2), the flow rate of the injected fluid is the total of the displaced fluid and the displacing fluid at time t, minus volume absorbed within the compressible pump system per unit time interval. The system included the entire space of the flow pump cylinder, the space in the lower pedestal, and the tubing connecting the flow pump to the test cell.
This model also led to the change of the boundary conditions shown in Eq. 4 and 4a. The schematic diagram and boundary conditions associated with the modified mathematical model are depicted in Fig. 9.

Schematic diagram of the theoretical model of constant flow pump permeability test
The governing equation is defined as follows:
Initial condition:
Boundary conditions:
where H hydraulic pressure, MPa; H w hydraulic pressure of water, MPa; H n hydraulic pressure of CO2, MPa; k hydraulic conductivity, cm/s; z vertical distance along the specimen, cm; t time from the start of the experiment, s; S s specimen’s specific storage, 1/Pa; K intrinsic permeability of the specimen, cm2; k rw relative permeability of water, fraction; k rn relative permeability of CO2, fractio;, L the length of the specimen, cm; μ w dynamic viscosity of water, Pa.s; μ nw dynamic viscosity of CO2, Pa.s; ρ w density of water, g/cm3; ρ n density of CO2, g/cm3; A the cross-sectional area of the specimen, cm2; Q (t) flow in the specimen at time t, cm3/s; Q n (t) flow of CO2 in the specimen at time t, cm3/s; Q w (t) flow of water in the specimen at time t, cm3/s; g gravity acceleration, cm/s2
Since \(\frac{{{\text{d}}H_{w} }}{{{\text{d}}z}} = \frac{{{\text{d}}H_{n} }}{{{\text{d}}z}} - \frac{{{\text{d}}H_{c} }}{{{\text{d}}z}}\), Eq. 4a can be described as: \(Q(t) = \left( {\frac{{k_{\text{rn}} }}{{\mu_{n} }}\rho_{n} + \frac{{k_{\text{rw}} }}{{\mu_{w} }}\rho_{w} } \right)\frac{{{\text{d}}H_{n} }}{{{\text{d}}z}}gKA - \frac{{k_{\text{rw}} }}{{\mu_{w} }}\rho_{w} \frac{{{\text{d}}H_{c} }}{{{\text{d}}z}}gKA\quad t > \, 0.\)
Hence, the displacing non-wetting fluid pressure gradient becomes:
In which
where q CO2 flow rate into the upstream of the specimen at time t, cm3/s; C e storage capacity of the flow pump system, i.e., the change in volume of the permeating fluid in upstream permeating system per unit change in hydraulic head, cm3/cm H2O.
The complete analytical solution for constant flow permeability technique is given as follows:
where \(\delta = \frac{{C_{e} }}{{AS_{s} }}\), and β n is the root of following equation: \(\tan \varphi = \frac{1}{{\delta \beta^{2} }}\left( {k_{\text{rw}} + k_{\text{rn}} \frac{{\mu_{w} \rho_{n} }}{{\mu_{n} \rho_{w} }}} \right).\)
The roots were obtained using the Newton–Raphson Method [3].
The hydraulic gradient distribution within the specimen can be further derived by differentiating Eq. (5) with respect to variable z:
Mathematical model for constant head permeability technique
Schematic diagram of the mathematical model and boundary conditions for constant head permeability technique are illustrated in Fig. 10. The model is based on the theoretical model developed by Zhang [25], describing one-dimensional transient flow of a compressible fluid through a saturated porous and compressible medium [11].

Schematic diagram and boundary condition of constant head permeability test
The governing equation:
Initial condition:
Boundary conditions:
The governing equation with initial and boundary conditions can be solved using the method of separation of variables.
Hydraulic head in position z at time t is as follows:
The hydraulic gradient i(z,t) within the specimen can be derived by differentiating the Eq. 11 with respect to the variable z:
The flow rates at z = 0 (flow out) and z = L (flow in) can be obtained as follows:
In the experimental system, the outflow at the specimen is assumed to equal to the total outflow of CO2 and water. It is noted that solubility effects in this model are neglected.
Therefore, inflow rate at time t with a constant differential head, ΔH, can be described as
Numerical analysis to solve the mathematical models
In the mathematical models, there are three unknown parameters including k rw, k rn, and S s . As the analytical method to determine the parameters is impossible to undertake, numerical method of history matching was employed to solve the equations. In this way, the experimental data were fitted with the corresponding theoretical data. For instance, at constant flow pump permeability technique, first guess of k rw, k rCO 2 and S s were inputted into the theoretical data of hydraulic pressure gradient, i (L,t) at time t and then fitted to the corresponding experimental data of hydraulic pressure gradient, i′(L,t) (Fig. 11). Similarly, at the constant head permeability technique, theoretical data of outflow from rock specimen Q′(L,t) was matched with the corresponding experimental data of outflow Q(L,t) (Fig. 12). The fitting required many iterations to obtain best fit of the experimental and theoretical data.

Fitting of the experimental data to experimental and theoretical hydraulic pressure gradient of Ainoura 1A (a), Ainoura 1B (b) and Ainoura 2 (c) based on constant flow pump permeability technique

Fitting of the experimental data of inflow to the theoretical data of inflow of supercritical CO2 in the Berea sandstone and Ainoura sandstone based on constant head permeability technique
Results of experimental and numerical analysis
By fitting the theoretical data to experimental data, the parameters of relative permeability and specific storage on the rock specimens for supercritical CO2 can be obtained.
CO2-water relative permeability
Figure 13 presents the CO2-water relative permeability of the Ainoura and Berea sandstones. It was found that relative permeability curves of Ainoura sandstone obtained using constant flow pump permeability technique is consistently similar with the relative permeability curve obtained using constant head permeability techniques. Until the end of the experiment, relative permeability to water at the Berea sandstone is 0.3 whereas the relative permeability to CO2 is 0.0355. In the Ainoura sandstone, the relative permeability to water is 0.22 while the relative permeability to CO2 is 0.014. This indicates a lower displacement efficiency of the saturated water by the injected CO2 in Ainoura sandstone, while a moderate displacement efficiency is found in Berea Sandstone. The result may be attributed to pore size distribution of Ainoura sandstone is more heterogeneous and dominated by micropores than Berea sandstone. Another factor that might be contributing to low relative permeability of CO2 in Ainoura sandstone is the capillary pressure effect. By having a large fraction of micropores (more than 50 %), the Ainoura specimens yielded relatively high capillary pressure.

CO2-water relative permeabilities vs CO2 saturation in rock specimens measured using constant flow pump (FP) and constant head permeability techniques
Specific storage of rock for supercritical CO2
Figure 14 presents specific storage of the Ainoura and Berea sandstone specimens. It was observed that the injection of CO2 increased the specific storage of the specimen. Such a transient increase of specific storage beyond certain saturation was found at the same period of the significant increase of volumetric strain of the specimen. This suggested that the change of specific storage beyond certain CO2 saturation is more pronounced as a mechanical response rather than just a hydraulic process. During the displacement of the saturated water by the injected CO2, the specific storage of the rock specimens increased. The change of specimen’s volume due to flow of CO2 is more pronounced in the Ainoura sandstone rather than in the Berea sandstone. The specific storage of the Ainoura sandstone was estimated at around 0.016 1/cm H2O or 0.000163 1/Pa. In comparison, the specific storage of the Berea sandstone is accounted for 0.000011 1/cm H20 or 1.12 × 10⁻⁷ 1/Pa. The Ainoura sandstone appeared to have larger specific storage than the Berea sandstone (Fig. 15). It was found that specific storage of Ainoura sandstone measured with constant flow pump permeability technique is larger than that measured by constant head permeability technique at 0.0003 1/cm H2O. This implies that driving supercritical CO2 by injecting it at constant flow rate is more effective than just creating differential pressure to generate inflow of supercritical CO2 into rock.

Specific storage and volumetric strains versus CO2 saturation in Ainoura sandstone measured using constant flow pump permeability technique

Comparison of specific storage of rock specimens for supercritical CO2 measured in constant flow pump (FP), and constant head (CH) permeability technique
Validity of the measured specific storage
The validity of the specific storage obtained from the numerical analysis was also examined. The accuracy of specific storage of rock specimen is much affected by the storage capacity of the pump system. Tokunaga and Kameya [18] introduced a dimensionless parameter, δ′, described as the ratio of the pump’s storage capacity to the specimen’s specific storage:
They suggested that the parameter S s would have sufficient accuracy if the ratio, δ′, is less than 0.3. In the numerical analysis, the ratio of the obtained S s to the measured C e was found to be between 0.00078 and 0.0187. This clearly shows the ratios are below the ambient ratio of 0.3. However, the ambient ratio to examine accuracy of specific storage may be insufficient to implement in a transient flow from CO2-water drainage displacement system in reservoir condition. Further sensitivity analysis and poro-elasticity measurement to examine the accuracy of specific storage will be a subject of future investigation. Nonetheless, as preliminary validation to the numerical analysis, the use of ambient ratio of Tokunaga and Kameya [18] was found acceptable.
While the results presented in this paper were encouraging, the quality of the experimental test was restricted by the capability of reproducing reservoir condition for the injection of CO2 into low permeable rock and effectively measuring its permeability and storage capacity. One would anticipate that somewhat more reliable experimental test would result by incorporating such 3D mapping of CO2 migration through the rock specimen. This can be conducted by installing computer tomography (CT) scan. However, as this device is too expensive for standard laboratory test, the use of separator in the outlet of specimen and downstream pump could become alternative. Despite it requires extensive technical works, the use of separator would enhance the estimation of relative permeability and saturation for CO2 and water as the outflows of CO2 and water from the rock specimen are measured. This would be developed in future research.
Conclusions
This paper presented the measurement of specific storage of rock for CO2 by developing constant flow pump and constant head permeability technique in advanced experimental system which can create similar physical condition of deep aquifer within high pressure and high temperature. Conclusions can be described as follows:
-
CO2-water relative permeability obtained through constant flow pump permeability technique is well agreement with that obtained using constant head permeability technique.
-
Specific storage obtained with constant flow pump permeability technique seems to be larger than that with constant head permeability technique.
-
The specific storage of Ainoura Sandstone for storing supercritical CO2 is 0.016 1/cmH2O or 1.63 × 10⁻⁴ 1/Pa within the experimental conditions applied.
-
Berea Sandstone has a specific storage at 0.000011 1/cmH20 or 1.12 × 10⁻⁷ 1/Pa, much lower than Ainoura sandstone.
-
A transient increase of specific storage beyond certain saturation takes place at the same period of the significant increase of volumetric strain of the specimen.
-
The change of specimen’s volume due to flow of CO2 is more pronounced in the Ainoura sandstone rather than in the Berea sandstone.
References
Bennion DB, Bachu S (2005) Relative permeability characteristics for supercritical CO2 displacing water in a variety of potential sequestration zones in the western Canada Sedimentary Basin, SPE 99547, SPE Annual Technical Conference and Exhibition. Society of petroleum Engineers, Dallas, Texas
Brace WF, Walsh JB, Frangos WT (1968) Permeability of granite under high pressure. J Geophys Res 73(6):2225–2236
Carslaw HS, Jaeger JC (1959) Conduction of heat in solids. Oxford University Press, London, p 510
Dana E, Skoczylas F (2002) Experimental study of two-phase flow in three sandstones. I. Measuring relative permeabilities during two-phase steady-state experiments. Int J Multiph Flow 28:1719–1736
Esaki T, Zhang M, Takeshita A, Mitani Y (1996) Rigorous theoretical analysis of flow pump permeability test. Geotech Test J 19(3):241–246
IPCC (2000) Special Report on Emission Scenarios. Cambridge University Press, Cambridge, UK
IPCC (2001) Climate Change 2001: Mitigation. The third assessment report of the intergovernmental panel on climate change. In: Metz B, Davidson O, Swart R, Pan J (eds). Cambridge University Press, Cambridge
IPCC (2005) IPCC special report on carbon dioxide capture and storage. In: Metz B, Davidson O, de Connick H, Loos M, Meyer (eds). Cambridge University Press, New York, p 195–276
Khasraghi MM, Sefidkouhi MAG, Valipour M (2015) Simulation of open- and closed-end border irrigation systems using SIRMOD. Arch Agron Soil Sci 61(7):25–31
Mitani Y, Arsyad A, Ikemi H, Kuze K, Oura S (2011) A new flow pump permeability test applied on supercritical CO2 injection to low permeable rocks. Int J Jpn Committee Rock Mech 7:25–31
Morin RH, Olsen HW (1987) Theoretical analysis of the transient response from a constant flow rate hydraulic conductivity test. Water Resour Res 23:1461–1470
Müller N (2011) Supercritical CO2-brine relative permeability experiments in reservoir rocks—literature review and recommendations. Transp Porous Media 87(2):367–383
Olsen HW, Nichols RW, Rice TL (1985) Low-gradient permeability measurement in a Tri-axial system. Geotechnique 35:145–157
Perrin J-C, Benson SM (2010) An experimental study on the influence of sub-core scale heterogeneities on CO2 distribution in reservoir rocks. Transport in Porous Media Springer, Netherlands, pp 93–109
Richardson JG, Kerver JK, Hafford JA, Osoba JS (1952) Laboratory determination of relative permeability. Trans AIME 195:187–196
Sasaki K, Fujii T, Niibori Y, Ito T, Hashida T (2008) Numerical simulation of supercritical CO2 injection into subsurface rock masses. Energy Convers Manag 49:54–61
Song I, Elphick SC, Main IG, Ngwenya BT, Odling NW, Smyth NF (2004) One-dimensional fluid diffusion induced by constant-rate flow injection: theoretical analysis and application to the determination of fluid permeability and specific storage of a cored rock sample. J Geophys Resour 109:1–9
Tokunaga T, Kameya H (2003) Determination of specific storage of a porous material from flow pump experiments: theoretical analysis and experimental evaluation. Int J Rock Mech Min Sci 40(5):739–745
Valipour M (2013) Use of surface water supply index to assessing of water resources management in Colorado and Oregon, US. Adv Agric Sci Eng Res 3(2):631–640
Valipour M (2015) Handbook of environmental engineering problems. OMICS ebook group
Valipour M, Sefidkouhi MAG, Eslamian S (2015) Surface irrigation simulation models: a review. Int J Hydrol Sci Technol 5(1)
Valipour M (2014) Handbook of drainage engineering problems. OMICS ebook group
Yannopoulos SI, Lyberatos G, Theodossiou N, Li W, Valipour M, Tamburrino A, Angelakis AN (2015) Evolution of water lifting devices (pumps) over the centuries worldwide. Water 7:5031–5060
Zhang M, Takahashi M, Morin RH, Esaki T (2000) Evaluation and application of the transient-pulse technique for determining the hydraulic properties of low-permeability rocks—part 2: experimental application. Geotech Test J 23:91–99
Zhang M (1996) A new coupled shear and permeability test method for evaluating engineered barriers in low-level radioactive waste disposal facilities, Ph.D. thesis, Kyushu University, Japan
Zou X, Li M, Li K, Cremades R, Gao Q, Wan Y, Qin X (2015) Greenhouse gas emission from agriculture irrigation in China. Mitig Adapt Strat Glob Change 20(2):295–315
Author information
Authors and Affiliations
Corresponding author
Rights and permissions
Open Access This article is licensed under a Creative Commons Attribution 4.0 International License, which permits use, sharing, adaptation, distribution and reproduction in any medium or format, as long as you give appropriate credit to the original author(s) and the source, provide a link to the Creative Commons licence, and indicate if changes were made.
The images or other third party material in this article are included in the article’s Creative Commons licence, unless indicated otherwise in a credit line to the material. If material is not included in the article’s Creative Commons licence and your intended use is not permitted by statutory regulation or exceeds the permitted use, you will need to obtain permission directly from the copyright holder.
To view a copy of this licence, visit https://creativecommons.org/licenses/by/4.0/.
About this article

Cite this article
Arsyad, A., Mitani, Y. & Ikemi, H. Measurement of specific storage of rock for supercritical carbon dioxide using constant flow pump and constant head permeability techniques. Innov. Infrastruct. Solut. 1, 29 (2016). https://doi.org/10.1007/s41062-016-0029-4
Received:
Accepted:
Published:
DOI: https://doi.org/10.1007/s41062-016-0029-4