
Abstract
Clustering of source code is a technique that can help improve feedback in automated program assessment. Grouping code submissions that contain similar mistakes can, for instance, facilitate the identification of students’ difficulties to provide targeted feedback. Moreover, solutions with similar functionality but possibly different coding styles or progress levels can allow personalized feedback to students stuck at some point based on a more developed source code or even detect potential cases of plagiarism. However, existing clustering approaches for source code are mostly inadequate for automated feedback generation or assessment systems in programming education. They either give too much emphasis to syntactical program features, rely on expensive computations over pairs of programs, or require previously collected data. This paper introduces an online approach and implemented tool—AsanasCluster—to cluster source code submissions to programming assignments. The proposed approach relies on program attributes extracted from semantic graph representations of source code, including control and data flow features. The obtained feature vector values are fed into an incremental k-means model. Such a model aims to determine the closest cluster of solutions, as they enter the system, timely, considering clustering is an intermediate step for feedback generation in automated assessment. We have conducted a twofold evaluation of the tool to assess (1) its runtime performance and (2) its precision in separating different algorithmic strategies. To this end, we have applied our clustering approach on a public dataset of real submissions from undergraduate students to programming assignments, measuring the runtimes for the distinct tasks involved: building a model, identifying the closest cluster to a new observation, and recalculating partitions. As for the precision, we partition two groups of programs collected from GitHub. One group contains implementations of two searching algorithms, while the other has implementations of several sorting algorithms. AsanasCluster matches and, in some cases, improves the state-of-the-art clustering tools in terms of runtime performance and precision in identifying different algorithmic strategies. It does so without requiring the execution of the code. Moreover, it is able to start the clustering process from a dataset with only two submissions and continuously partition the observations as they enter the system.
1 Introduction
Learning to program requires extensive and varied practice, obtained through solving a wide range of programming assignments supported with accurate, timely, and formative feedback [2, 10, 30]. Such feedback cannot be guaranteed manually on learners’ demand, as instructors can neither verify the code attempts for all learners in a class nor are always available outside classes. Thus, scalable and automatic techniques to assess programming assignments have long been investigated to address this need and are still a target of increasing research interest [35].
The clustering of source code has been initially introduced into the automated assessment of programming assignments for plagiarism detection purposes [31]. By grouping submissions that exhibit high similarity, the space of possible cases of plagiarism reduces considerably, enabling a more thorough pairwise inspection on them [34, 50]. Multiple strategies to measure similarity have been proposed, including structural [9, 20, 33, 39], semantical [4, 5, 7], and behavioral [21, 28, 49] approaches. Eventually, clustering has emerged as a promising technique to support the generation of feedback on the correctness of solutions and how to progress after mistakes. Having solutions with similar functionality, code complexity, structure, or behavior together can, for instance, facilitate the delivery of targeted feedback on common mistakes from learners by grouping submissions that contain similar errors or misconceptions [11, 18] and enable the generation of personalized feedback to improve a program based on a solution adopting a similar strategy but correct [6, 22].
Nevertheless, clustering source code is a complex task. On the one hand, approaches often require computing an edit distance between each pair of solutions (e.g., abstract syntax tree edit distance), which is expensive. On the other hand, the quality of the clusters is highly-dependent not only on the selected representation of source code but also on the model used and the available data. Therefore, most of the proposed approaches perform poorly in providing feedback in programming courses. These either: (1) overly focus on syntax and/or require exact matching of program features, generating a large number of clusters as a consequence [14, 17]; (2) rely on expensive pairwise computations [19, 32]; (3) require a large amount of previously generated data [37, 44]; or (4) are specialized in a specific type of assignment (e.g., dynamic programming) and not generalizable [22].
This work proposes an approach and tool—AsanasCluster—to cluster correct source code submissions to programming assignments based on their algorithmic strategies. To this end, we extract the control flow graph (CFG), which encodes the execution order of individual statements of a program, and data flow graph (DFG), which describes how data variables get updated between instructions, from the submitted source code. The combined information of these representations captures the key aspects of the algorithmic strategy adopted in the original program [12], ignoring its syntax. As even computing the pairwise graph edit distance of these simplified representations would be expensive, we rather compile a vector of features from them, which is used as the input to the clustering model. This model is an incremental mini-batch k-means variant [43] of the popular Lloyd’s classic k-means algorithm [26]. Such a model moves clusters’ centers as new correct submissions enter the system, reducing training time considerably when compared to re-training the model on the complete dataset.
The ultimate goal of this clustering process is to, given an incorrect solution, determine the closest cluster considering all correct submissions up to date. From this cluster, we select a correct solution, which theoretically follows the same algorithmic strategy, to compare against the wrong program and generate personalized feedback for the student. Consequently, the runtime of the clustering process must allow for near real-time feedback, and considering feedback generation is a subsequent task. Moreover, it is important that the model solution adopts the same strategy as the incorrect one if it is a valid approach, to support students’ development in their own line of thought. Hence, we evaluate AsanasCluster on a public dataset—PROGpedia [36]—both regarding the runtimes and the effectiveness in identifying different algorithmic solution strategies.
The remainder of this paper is organized as follows. Section 2 presents some of the most important works involving the clustering of source code for the automated assessment of programming assignments. Section 3 reviews the necessary concepts for the correct understanding of this work. Section 4 describes the proposed approach. Section 5 demonstrates the effectiveness of this approach using a public dataset of real submissions to programming assignments. Finally, Sect. 6 discusses and summarizes the contributions of this work.
2 Related work
Earlier approaches for clustering source code in programming education are based on textual similarity. These approaches often involve the extraction of tokens or selection of keywords from the source code, followed by pairwise comparison using some well-known distance metric or common text mining techniques [24, 31, 34]. While such approaches can inherit much from text clustering, they are generally very sensitive to changes in code structure or formatting.
A popular program representation used in clustering approaches is abstract syntax trees (ASTs), as they capture just enough information to understand the structure of the code. Such clustering approaches compute similarity using distances in feature space [15, 16], string edit distance [42], tree edit distance [19], or normalization [41, 47]. For instance, Codewebs [32] customizes and employs a set of semantics-preserving AST transformations to normalize and cluster student submissions.
Luxton-Reilly et al. [29] claim that different solutions have distinct structural variations, which can be encoded using control flow graphs (CFGs). This means that clustering source codes by their control flow structures divide them into categories. OverCode [14] and CLARA [17] combine these structures with dynamic information on variable values to cluster solutions. However, these techniques generate a large number of clusters as they focus excessively on the syntactic details of the source code.
SemCluster [37] uses a vector representation of programs based on semantic program features, which can be used with standard clustering algorithms such as k-means. The features include control flow features and data flow features. The former describes how the problem space is partitioned into sub-spaces (i.e., the control flow paths), while the latter captures the frequency of occurrence of distinct pairs of successive values of individual variables in test executions.
Using deep learning to learn program embeddings from token sequences, ASTs, CFGs, program states, or other program representations is the recent trend in program clustering [27, 38, 40, 44, 45]. Nevertheless, training such models still requires considerable effort and a meticulous selection of inputs. Finally, other clustering approaches specialize in specific programming problems such as dynamic programming [22] and interactive programs [8].
3 Definitions
In this section, we present the concepts of control flow graph (CFG), evaluation order graph (EOG), data flow graph (DFG), and k-means clustering that form the basis of the proposed approach.
3.1 Control flow graph
A control flow graph (CFG) is a directed graph \(G = (N, E, n_0, n_f)\), where N represents the set of nodes, E is the set of directed edges (i.e., pairs of elements of N), and \(n_0, n_f\) correspond to the entry and exit nodes, respectively. The set of nodes \(N = \{n_1, n_2,...\} \cup \{n_0, n_f\}\) corresponds to basic blocks, i.e., maximal-length sequences of branch-free instructions of a program. The set of edges E represents control dependencies between the nodes. The two extra nodes \(n_0, n_f\), which represent the node through which the control enters the graph (entry node \(n_0\)) and the node through which the control exits the graph (exit node \(n_f\)), are added such that each node of the graph has at most two successors.
The CFG captures the control flow behavior of a program, considering the possible paths and decisions taken during program execution. It provides a structured representation of the control flow of the program, supporting program analysis, optimization, and the understanding of its behavior.
3.2 Evaluation order graph
The evaluation order graph (EOG) [46] is a directed graph \(G = (N, E)\), where N represents the set of nodes and E is the set of directed edges, designed to capture the order in which code is executed, similarly to a CFG, but on a finer level of granularity, i.e., including the order in which expressions and sub-expressions are evaluated. The nodes of the EOG are the same nodes as those of the abstract syntax tree of the program, whereas an edge \((n_i, n_j)\) means that \(n_j\) is evaluated after \(n_i\).
The differences between the EOG and the CFG, which connects basic blocks of statements, are only a few, particularly: methods without explicit return statements have an edge in the EOG to a virtual return node; the EOG considers opening blocks (e.g., {) as separate nodes; the EOG uses separate nodes for the if keyword and the condition; and the EOG considers a method header as a node.
3.3 Data flow graph
A data flow graph (DFG) is a directed graph \(G = (N, E)\), where N is the set of nodes and E is the set of directed edges. Each node within the set \(N = \{n_1, n_2,...\}\) denotes a distinct computational unit or instruction, whereas the directed edges \((n_i, n_j)\) for \(n_i, n_j \in N\) within the set E represent the data dependencies, i.e., the output data of \(n_i\) is consumed by \(n_j\). Such visualization enables a clear view of the data processing pipeline (i.e., the flow of data along the edges establishes the sequence in which operations should be executed), supporting the analysis and optimization of the program through the identification of parallel execution possibilities.
3.4 K-means clustering
K-means clustering method is a popular unsupervised machine learning technique for partitioning a set of observations (or data points) into k different clusters. Firstly, the k initial centroids are randomly selected, where k is a user-defined parameter. Each data point d is then assigned to the closest mean (or centroid), and the collection of points assigned to a centroid forms a cluster. Afterward, the centroid of each cluster is updated based on all points in the cluster. This iterative procedure is repeated until no changes occur in the clusters.
The method can be formally defined as follows. Consider \(D = \{ d_1,..., d_n \}\) is the set of observations to be clustered, where each \(d_i \in \mathbb {R}^m\) is represented by a m-dimensional feature vector. Then, k-means partitions the data points in D into K clusters with centroids \(C^{*} = \{C_1,...,C_k\}\) such that \(\sum _{i=1}^K\sum _{d \in C_i} dist(d, \mu _i)\) is minimal, where \(\mu _i = \frac{1}{C_i}\sum _{d \in C_i} d\) is the centroid of cluster \(C_i\) and “dist” is the distance function used. There are many distance metrics that can be used, such as the squared Euclidean distance, i.e., \(dist(d, \mu )=||d-\mu ||^2\), and the cosine distance, i.e., \(dist(d, \mu )=(d \cdot \mu ) / (||d||. ||\mu ||)\). The best one depends on the dataset composition.
Even though this problem is known to be NP-hard, such gradient descent methods generally converge to a local optimum if seeded with an initial set of k observations drawn uniformly and randomly from D [3]. Bottou et al. [3] used this property to propose an online stochastic gradient descent variant that computes a gradient descent step on one observation at a time, which makes it converge faster on large datasets but degrading the quality of clusters (due to stochastic noise). Sculley [43] proposes an optimization for k-means clustering by processing mini-batches rather than individual data points, which tend to have lower stochastic noise and are not affected in terms of cost when datasets grow large with redundant observations.
4 Clustering source code with AsanasCluster
This section introduces the design and the implementation of a tool, named AsanasCluster, to cluster correct source code solutions submitted to programming assignments in real time. This approach addresses a few gaps in existing techniques. First, it groups programs by their algorithmic strategy from a high-level perspective, which generates fewer clusters than most existing clustering approaches. Second, it extracts and relies on a vector of features from the semantic graph representations of the program, avoiding expensive pairwise computations such as the graph edit distance across the complete dataset. Lastly, it follows an incremental clustering model, meaning that solutions are assigned to clusters as they enter the system rather than all at once. Such a model not only reduces the time to discover the closest cluster to a new observation considerably but also enables this task to run with up-to-date information on submitted solutions.
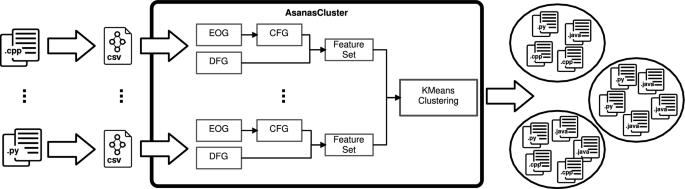
Scheme of how AsanasCluster works on a high level
The workflow of AsanasCluster is illustrated in Fig. 1. Given a set of existing solutions P to a programming assignment, for each new program p, received as input, it generates both an EOG and a DFG using an adaptation of an existing Kotlin library [13], designed to extract the code property graph (which includes the representations needed) out of source code. This step guarantees support for programs written in either Python, Java, C, or C++. The obtained EOG is transformed into a CFG through a process involving edge contraction, i.e., for every edge whose source has an out-degree of one and destination has an in-degree of one is contracted. These two final representations, DFG and CFG, are analyzed to compute the control flow and data flow features that compose the feature vector of a program, (described in Subsection 4.1). Finally, the resulting feature vector is fed into the k-means clustering algorithm implemented (refer to Subsection 4.1 for details).
4.1 Feature engineering
One key characteristic of the proposed approach lies in the representation of the program used. The clustering process aims to separate source code solutions by their algorithmic strategy, i.e., a sequence of instructions executed in a well-defined order to solve a problem or calculate a function. The flow of execution of a program, i.e., the order in which the instructions execute, is, thus, an essential aspect of the algorithmic strategy. Combining this with knowledge of the data dependencies among these instructions, the algorithmic strategy is largely covered [12]. The former information is captured by the CFG (or the EOG), whereas the latter is encoded in the DFG, as explained in Subsections 3.1 and 3.3.
To obtain these representations, we firstly adapted a Kotlin library [13], initially developed to extract the code property graph (CPG) [48] out of source code written in either Python, Java, C, or C++. The CPG is a data structure combining the AST, DFG, and EOG, designed to mine large codebases for programming patterns that represent security vulnerabilities. As this representation includes the required information, our adaptation consists of adding a feature to the library for exporting the CPG in comma-separated value (CSV) format. The exported artifact is composed of two CSV files: one containing the description of the nodes, including ID, type of construct, token, and location, and the other describing the edges, including source, location, origin (AST, EOG, or DFG), among other information of its specific origin (e.g., variable identifier for edges of the DFG). While both the EOG and the CFG encode the control flow of a program, the latter is a significantly smaller graph. Hence, before further computations, the obtained EOG is transformed into a CFG through a process involving edge contraction, i.e., every edge whose source has an out-degree of one and destination has an in-degree of one is contracted.
Clustering by the CFG and the DFG would require measuring two pairwise graph edit distances over the full dataset. These are complex operations whose computational cost grows exponentially on the graphs and dataset size. Therefore, our approach is rather feature-based. We derive a feature vector composed of numeric values calculated from the characteristics of both graphs, CFG and DFG. This vector contains 11 features, namely: connected_components, the number of connected components in the control flow graph (i.e., being an intra-procedural representation, the multiple procedures have no connection in the graph); loop_statements, the number of loop statements (e.g., for, foreach, while, and do... while) in the program; conditional_statements, the number of conditional statements (e.g., if) in the program; cycles, the number of different cycles in the control flow graph; paths, the number of different paths in the control flow graph; cyclomatic_complexity, a software metric that measures the complexity of a program by analyzing its control flow (i.e., it provides a quantitative measure of the number of possible execution paths in the program); variable_count, the number of variables used in the program, excluding variables which are never read; total_reads, the total number of read operations on variables; total_writes, the total number of write operations on variables; max_reads, the maximum number of read operations on single variable; and max_writes, the maximum number of write operations on single variable. Table 1 summarizes the features of the model.
As the order of execution of instructions has the most relevance in the algorithmic strategy of the solution, we decided to split the weight of the data flow features. Among these, the variable_count weighs more, as the others are dependent on it by definition. The summed weight of all these features is the same as that of a single control flow feature. Moreover, we have scaled the data so that it has zero mean and unit variance. For that, running means and variances are maintained for each feature. Even though, for being incremental, the exact means and variances are not known in advance, this does not have a detrimental impact in the long term.
Having a high number of features in the model makes it more difficult to manage and may even add noise, as some of these features can be redundant. To prevent this, the correlation of the 11 features of our model has been measured using Pearson’s correlation coefficient [23] on the 16 programming exercises of PROGpedia dataset [36]. The correlation coefficient has values from \(-1\) to 1: A value closer to 0 implies weaker correlation (i.e., 0 is no correlation); a value closer to 1 means stronger positive correlation; and a value closer to \(-1\) implies stronger negative correlation. Each programming exercise is analyzed separately and casts a vote on pairs with a correlation above 0.9. For pairs with half or more of the total votes, a member is eliminated. Nevertheless, in this case, no correlated pair has been identified with these conditions.
4.2 Clustering model
The values of the final feature vector are given as input to the k-means clustering algorithm implemented (see Subsection 3.4). This specific implementation starts by randomly instantiating k centroids, according to a Gaussian distribution. The value of k is the main hyper-parameter of the model and sets the limit on the number of formed clusters. As the goal is to have as many clusters as the number of algorithmic solution strategies, an adequate value would be greater or equal to the expected count of different strategies. We have limited the maximum amount of clusters to 16 as the possibility of an academic-level programming assignment having more than 16 algorithmic solution strategies can be neglected. Nevertheless, this value can be defined explicitly, per assignment.
Given a new submission, more precisely the feature vector extracted from it, we first identify the closest centroid. This is done by measuring the distance from the new observation to each centroid, using a certain distance metric, and selecting the minimum of these distances. In this case, we tried the Manhattan distance, Euclidean distance, and cosine distance in two sets of submissions to programming assignments with well-defined algorithmic solution strategies. The Euclidean distance revealed a lower average error index (0) than the Manhattan (0.3) and cosine (0.25) distances and, thus, was applied. After identifying the centroid (and cluster) to which the new observation belongs, the centroid’s position “moves” in the direction of the new element. The amount by which to move the centroid is a product of their scalar distance and the learning rate. The learning rate is the inverse of the number of solutions assigned to a cluster during the process, i.e., as the number of elements increases, the effect of new elements is reduced.
The pseudocode of this clustering process is presented in Algorithm 1. It assumes that the feature vector is provided as the solution object, ignoring the extraction of the graph representations and subsequent computation of the feature vector values. Moreover, when centroids “move,” the closest centroid is re-identified for previous solutions.
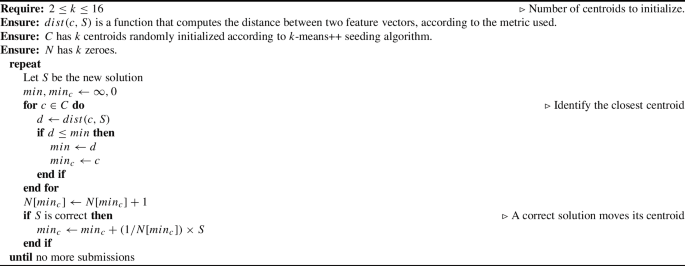
Pseudocode of the k-means clustering process
4.3 Mooshak integration
AsanasCluster aims to integrate into automated assessment engines, consuming their submissions’ data both offline (i.e., previously submitted solutions) and in real time (i.e., new submissions entering the system). To this end, AsanasCluster has two modes. One builds a clustering model from all existing submissions to a specified programming assignment. The other loads a clustering model saved into the disk and identifies the closest cluster to the given submission, including it in the model if it is an accepted solution.
Mooshak [25] is one of the existing systems providing automated assessment capabilities and the one selected for the development and testing of AsanasCluster. Mooshak uses the file system as the object database, storing and retrieving data in Tcl-code files organized in directories. Therefore, the submissions’ metadata is stored alongside the source code and extracted CSV files of the CPG in the submission folder.
For building a clustering model, AsanasCluster simply iterates the submissions’ directory and, for each submission folder, loads the CPG and processes it into the model (if accepted). When a new submission enters the system, AsanasCluster acts as the last evaluator of Mooshak, adding the submission into the model and echoing the classification of the previous evaluator. If the submission has a rejection classification, the identification of the closest cluster is also printed, and model updates get discarded.
5 Evaluation
This section presents the results of the evaluation of the accuracy and time adequacy of AsanasCluster for automated assessment of programming assignments. To this end, we have evaluated the performance of clustering on a public collection—PROGpedia [36]—of source code submitted to 16 programming assignments on Mooshak [25] in undergraduate Computer Science courses within multiple years of the 2003–2020 time span. The dataset comprises a total of 9117 submissions. As we intend to use the clustering output as input to a program repair tool, we separate the submissions not only by programming exercise but also by programming language. Only solutions written in C/C++ (C17), Java (Java 8), and Python (version 3) were considered (Note: version within parentheses means “compatible with” not an exact match). All tests run on a Dell XPS 15 9570.
5.1 Runtime
Our goal is to use AsanasCluster as an intermediate step in the automated assessment of programming assignments. While no time limit for a single evaluation is formally defined in the literature of automated assessment of programming assignments, one minute is a reasonable limit for a task that is meant to be nearly real time [1]. To evaluate the scalability of AsanasCluster, we measure the amount of time required to (1) build a clustering model with past submissions from scratch, (2) discover a new correct solution, and (3) determine the cluster of a new submitted solution. As for (1), we have built models for the set of correct solutions from PROGpedia [36], separating data by programming exercise and language. Table 2 summarizes the composition of the dataset regarding submissions, including the number of submissions and the average lines of code for each pair assignment/programming language. For (2), a new correct solution has been developed. Finally, in (3) we select randomly a wrong attempt.
Building a clustering model on a set of submissions (1) requires four steps. First, search and select the adequate solutions (i.e., accepted solutions written in the programming language of the model) from the directory containing all submissions to an assignment. Second, generate the needed semantic graph representations, i.e., the DFG and the CFG. Third, compute the feature vector from the representations. Finally, build the k-means model, processing existing observations. Table 3 presents the size of the solutions’ sets, building times, and the number of generated clusters for each pair (programming assignment, programming language).
The maximum model’s building time is 9 min and 30 s for the 152 Java submissions to programming assignment 53, which demands the implementation of a graph searching algorithm. As expected, the amount of submissions has the greatest impact on training performance when compared to the programming language or complexity of the programming assignment. However, the complexity of the solutions also affects the runtime negatively. For instance, processing the 205 submissions to programming assignment 34, which requires sorting a vector of numbers, takes less 9 s than the 152 to assignment 53.
The number of generated clusters has no noticeable correlation with either the number of submissions or the programming language. The median number of clusters for the models built is 4. The set of solutions written in C for exercise 42 has 9 clusters, which is the highest amount of clusters identified for the evaluated sets.
Table 4 depicts the time needed to (2) process a new solution into the model and (3) identify the best cluster for a new submitted solution, using the built models. On average, it takes 5,397 s to learn (2) and 4,910 s to predict the cluster of a new observation (3). There is no task running for 7 or more seconds. (6,981 is the worst case.)

2-Component PCA visualization of the clustering of implementations of graph searching (left) and sorting algorithms (right)
5.2 Error index
This analysis aims to validate the effectiveness of AsanasCluster in separating the different algorithmic strategies implemented in solutions. To this end, we consider a simple metric (1), which we named Error Index. The Error Index takes values between 0 and 1, where 0 indicates that all solutions were correctly grouped. A solution is considered wrongly grouped if it is in the cluster of a different strategy (i.e., a cluster belongs to the algorithmic strategy with most solutions in it). This metric purposely ignores the case where solutions adopting the same algorithmic strategy spread across different clusters. The reason is that we understand those solutions can still be quite distinct.
To evaluate this, we conduct two separate tasks. The first task consists of clustering a set of 100 different implementations of two graph searching algorithms, 50 depth-first search, and 50 breadth-first search. These programs were collected during an Algorithm Design and Analysis class. In the second task, we cluster a collection of 100 programs from GitHub implementing sorting algorithms, namely heap, merge, insertion, and quick sort. There are 25 samples of each sorting algorithm.
Figure 2 illustrates the 2-component principal component analysis (PCA) visualization of the resulting clusters for both tasks. (PC1 and PC2 explain 83% and 6% of the variability, respectively, in the left chart, and 60% and 24% in the right chart.) The red crosses indicate clusters’ centroids. On the left chart, there are four clusters. The green cluster contains the 50 points corresponding to the depth-first search implementations. The breadth-first search implementations are assigned to the gray cluster. On the right, four clusters match the different sorting algorithms: insertion sort (gray), heap sort (green), quick sort (blue), and merge sort (yellow). Note that some points are not visible as they share the same (or very close) values of the feature vector. In both experiments, there is one cluster corresponding to each of the different included algorithmic strategies, and solutions are split evenly by these clusters. Furthermore, the Error Index of both tasks evaluates to 0, as there is no cluster with solutions of different algorithmic strategies.
Extending the collection of the second task with one implementation of the radix sort algorithm also does not affect the Error Index. As depicted in the 2-component PCA visualization of Fig. 3 (PC1 and PC2 explain 61% and 23% of the variability, respectively), a new cluster (blue) is created with this new solution, whereas the existing clusters are not changed. However, adding a few implementations of the selection sort algorithm increases the Error Index. As its implementation is semantically similar to insertion sort, they are both assigned to the same cluster until there are enough samples to form a new cluster. For instance, including 3 implementations results in an Error Index of 0.03 (3 incorrectly grouped solutions out of 103).

2-Component PCA visualization of the clustering of implementations of sorting algorithms, adding a single radix sort implementation

2-Component PCA visualization of the clustering of implementations of sorting algorithms, adding a breadth-first search implementation
To demonstrate how AsanasCluster handles unrelated solutions submitted intentionally or accidentally, we have added a breadth-first search implementation to the clustering model of the sorting algorithms. The result is depicted in the 2-component PCA visualization of Fig. 4. (PC1 and PC2 explain 63% and 21% of the variability, respectively.) The unrelated solution is isolated in a new cluster (gray area), while other clusters remain unaffected. Therefore, the Error Index is 0.
5.3 Discussion
There are a few tools presented in the literature that introduce clustering approaches comparable to the one described in this paper, namely SemCluster [37], OverCode [14], and CLARA [17]. The evaluation of SemCluster includes a comparison with the latter tools (OverCode and CLARA). Even though calculating the similarity between two implementations with small sizes, such as those referred in Table 2, can be performed in a short period of time, clustering a new solution requires pairwise comparison between the new solution and each of the existing. The evaluation of SemCluster demonstrates this has a tremendous impact in terms of runtime of the approaches (e.g., CLARA tool can take more than 100 min for programs with less than 100 lines of code).
SemCluster reveals a better runtime performance and precision in identifying different algorithmic solution strategies than the existing tools [37]. Nevertheless, none of the proposed approaches is incremental, i.e., they require rebuilding the clustering model on every new submission. This takes much more than a minute in any of the analyzed tools, even for small size programs with less than 50 lines of code. Assuming that representations of source code are stored between model training sessions, SemCluster still has a median runtime of 18 s for the average time needed to recalculate models (i.e., when adding an element), possibly reaching 30 s.
Due to the unavailability of dataset used in [37], the evaluation of the runtime performance described in this paper applies our tool on identical tasks but using a different, publicly available, dataset [36]. This dataset contains 16 assignments of various complexities, delivered at multiple stages of undergraduate CS courses, using several distinct algorithms with implementations written in C, C++, Java, and Python. The composition of the dataset is fairly similar to the dataset used in [37], as shown in Table 2. In these conditions, our tool has median runtimes of 4 (Python) and 5 (C, C++, and Java) seconds to identify the cluster of a new solution and integrate it into the model. In the worst case, it can take up to 7 s.
Regarding the precision in identifying the different algorithmic solution strategies, SemCluster has proven its effectiveness in two tasks. Firstly, it successfully separates 100 solutions to an assignment involving sorting algorithms by 4 clusters, according to the adopted algorithm: bubble sort, quicksort, and none specifically (two clusters). Lastly, it can perfectly partition 100 programs into 2 clusters depending on the searching algorithm applied, i.e., depth-first and breadth-first search. Similarly, the experiment conducted to evaluate AsanasCluster achieved optimal results in the two tasks, as described in Subsection 5.2.
Therefore, considering its inclusion in the process of automated assessment of programming assignments, AsanasCluster can achieve better performance than the most similar tools presented in the literature. Nevertheless, the main benefits are (1) not requiring the execution of the code to extract the feature vector and (2) being able to start the clustering process from a dataset with only two submissions and recalculate clusters.
5.4 Threats to validity
Only a direct comparison with SemCluster [37] (i.e., using the same dataset) would allow us to demonstrate an improvement of the state of the art in terms of runtime and precision in separating algorithmic strategies. Unfortunately, neither the dataset nor the tool is publicly available and was not also made available upon request to the authors. We have, however, tried to select a similarly complex dataset with a few even larger solutions on average, considering the lines of code.
Furthermore, we have evaluated our approach to small-to-medium size programs typically found in introductory programming problems. While this is in line with related work, we aim to validate the extension of our approach to larger programs, as found in more advanced courses, in future work.
6 Conclusion
This paper presents a novel online approach to clustering source code for supporting the automatic assessment of programming assignments based on quantitative program features extracted from the programs’ semantic graph representations, namely the CFG and the DFG. This approach aims to (1) generate a number of clusters close to the number of different algorithmic solution strategies, (2) avoid expensive pairwise computations, and (3) learn incrementally, i.e., every solution processed becomes part of the model’s “knowledge” for subsequent observations.
Even though the evaluation presents some building times close to 10 min (see Table 3), building a model from scratch is a step performed only once (when loading the programming assignment) in online clustering approaches, with no effect on a submission’s assessment time. In fact, the assessment of a submission involves recalculating centroids including the new observation and/or determining the closest cluster, which takes under 7 s in all trials performed (see Table 4). Such a delay (below one minute) is acceptable for automated assessment of programming assignments. Furthermore, the experiments conducted to measure the precision of clustering reveal great accuracy in separating different algorithmic strategies.
Our goal is to integrate AsanasCluster as the first step of our workflow to repair incorrect student attempts. For a given programming assignment, we rely on AsanasCluster to cluster the correct student solutions. Given an incorrect student program, we identify the cluster of solutions most similar to the submitted program and compare it against one of the solutions in the selected cluster, generating the most pertaining modifications that get the student to the correct solution. Furthermore, the tool has the potential to be applied in many other automated reasoning tasks in programming education and beyond (e.g., learning analytics, similarity detection, and fault localization).
Availability of data and materials
The datasets generated and/or analyzed during the current study are available in the PROGpedia repository, https://doi.org/10.5281/zenodo.7449056.
References
Ala-Mutka, K.M.: A survey of automated assessment approaches for programming assignments. Comput. Sci. Educ. 15(2), 83–102 (2005). https://doi.org/10.1080/08993400500150747
Bennedsen, J., Caspersen, M.E.: Failure rates in introductory programming. SIGCSE Bull. 39(2), 32–36 (2007). https://doi.org/10.1145/1272848.1272879
Bottou, L., Bengio, Y.: Convergence properties of the k-means algorithms. In: Proceedings of the 7th International Conference on Neural Information Processing Systems, pp. 585–592. MIT Press, Cambridge, MA, USA, NIPS’94 (1994)
Chae, D.K., Ha, J., Kim, S.W., et al.: Software plagiarism detection: a graph-based approach. In: Proceedings of the 22nd ACM International Conference on Information & Knowledge Management, pp. 1577–1580. Association for Computing Machinery, New York, NY, USA, CIKM ’13 (2013). https://doi.org/10.1145/2505515.2507848
Chen, R., Hong, L., Lu, C., et al.: Author identification of software source code with program dependence graphs. In: Proceedings of the 2010 IEEE 34th Annual Computer Software and Applications Conference Workshops, pp. 281–286. IEEE Computer Society, USA, COMPSACW ’10 (2010). https://doi.org/10.1109/COMPSACW.2010.56
Chow, S., Yacef, K., Koprinska, I., et al.: Automated data-driven hints for computer programming students. In: Adjunct Publication of the 25th Conference on User Modeling, Adaptation and Personalization, pp. 5–10. Association for Computing Machinery, New York, NY, USA, UMAP ’17 (2017). https://doi.org/10.1145/3099023.3099065
Cosma, G., Joy, M.: An approach to source-code plagiarism detection and investigation using latent semantic analysis. IEEE Trans. Comput. 61(3), 379–394 (2012). https://doi.org/10.1109/TC.2011.223
Drummond, A., Lu, Y., Chaudhuri, S., et al.: Learning to grade student programs in a massive open online course. In: Proceedings of the 2014 IEEE International Conference on Data Mining, pp. 785–790. IEEE Computer Society, USA, ICDM ’14 (2014). https://doi.org/10.1109/ICDM.2014.142
Durić, Z., Gašević, D.: A source code similarity system for plagiarism detection. Comput. J. 56(1), 70–86 (2012). https://doi.org/10.1093/comjnl/bxs018
Elmaleh, J., Shankararaman, V.: Improving student learning in an introductory programming course using flipped classroom and competency framework. In: 2017 IEEE Global Engineering Education Conference (EDUCON), pp. 49–55. IEEE, Athens, Greece (2017). https://doi.org/10.1109/EDUCON.2017.7942823
Emerson, A., Smith, A., Rodriguez, F.J., et al.: Cluster-based analysis of novice coding misconceptions in block-based programming. In: Proceedings of the 51st ACM Technical Symposium on Computer Science Education. Association for Computing Machinery, New York, NY, USA, SIGCSE ’20, pp. 825–831 (2020). https://doi.org/10.1145/3328778.3366924
Feautrier, P.: Dataflow analysis of array and scalar references. Int. J. Parallel Prog. 20(1), 23–53 (1991). https://doi.org/10.1007/BF01407931
Fraunhofer AISEC: Code Property Graph (2023). https://github.com/Fraunhofer-AISEC/cpg. Accessed 20 May 2023
Glassman, E.L., Scott, J., Singh, R., et al.: Overcode: visualizing variation in student solutions to programming problems at scale. ACM Trans. Comput. Hum. Interact. 22(2), 25 (2015). https://doi.org/10.1145/2699751
Gross, S., Zhu, X., Hammer, B., et al.: Cluster based feedback provision strategies in intelligent tutoring systems. In: Cerri, S.A., Clancey, W.J., Papadourakis, G., et al. (eds.) Intelligent Tutoring Systems, pp. 699–700. Springer, Berlin (2012). https://doi.org/10.1007/978-3-642-30950-2_127
Gross, S., Mokbel, B., Hammer, B., et al.: Towards providing feedback to students in absence of formalized domain models. In: Lane, H.C., Yacef, K., Mostow, J., et al. (eds.) Artificial Intelligence in Education, pp. 644–648. Springer, Berlin (2013). https://doi.org/10.1007/978-3-642-39112-5_79
Gulwani, S., Radiček, I., Zuleger, F.: Automated clustering and program repair for introductory programming assignments. In: Proceedings of the 39th ACM SIGPLAN Conference on Programming Language Design and Implementation, pp. 465–480. Association for Computing Machinery, New York, NY, USA, PLDI 2018 (2018). https://doi.org/10.1145/3192366.3192387
Head, A., Glassman, E., Soares, G., et al.: Writing reusable code feedback at scale with mixed-initiative program synthesis. In: Proceedings of the Fourth (2017) ACM Conference on Learning @ Scale, pp. 89–98. Association for Computing Machinery, New York, NY, USA, L@S ’17 (2017). https://doi.org/10.1145/3051457.3051467
Huang, J., Piech, C., Nguyen, A., et al.: Syntactic and functional variability of a million code submissions in a machine learning MOOC. In: Walker, E., Looi, C. (eds.) Proceedings of the Workshops at the 16th International Conference on Artificial Intelligence in Education AIED 2013, CEUR Workshop Proceedings, vol 1009. CEUR-WS.org, Memphis, TN, USA, pp. 25–32 (2013). https://ceur-ws.org/Vol-1009/0105.pdf
Inoue, U., Wada, S.: Detecting plagiarisms in elementary programming courses. In: 2012 9th International Conference on Fuzzy Systems and Knowledge Discovery. IEEE, Chongqing, China, pp. 2308–2312 (2012). https://doi.org/10.1109/FSKD.2012.6234186
Jhi, Y.C., Wang, X., Jia, X., et al.: Value-based program characterization and its application to software plagiarism detection. In: Proceedings of the 33rd International Conference on Software Engineering. Association for Computing Machinery, New York, NY, USA, ICSE ’11, pp. 756–765 (2011). https://doi.org/10.1145/1985793.1985899
Kaleeswaran, S., Santhiar, A., Kanade, A., et al.: Semi-supervised verified feedback generation. In: Proceedings of the 2016 24th ACM SIGSOFT International Symposium on Foundations of Software Engineering. Association for Computing Machinery, New York, NY, USA, FSE 2016, pp. 739–750 (2016). https://doi.org/10.1145/2950290.2950363
Kirch, W. (ed.): Pearson’s Correlation Coefficient, pp. 1090–1091. Springer, Dordrecht (2008)
Koivisto, T., Hellas, A.: Evaluating CodeClusters for effectively providing feedback on code submissions. In: 2022 IEEE Frontiers in Education Conference (FIE). IEEE, pp. 1–9 (2022). https://doi.org/10.1109/FIE56618.2022.9962751
Leal, J.P., Silva, F.: Mooshak: a web-based multi-site programming contest system. Softw. Pract. Exp. 33(6), 567–581 (2003). https://doi.org/10.1002/spe.522
Lloyd, S.: Least squares quantization in PCM. IEEE Trans. Inf. Theor. 28(2), 129–137 (1982). https://doi.org/10.1109/TIT.1982.1056489
Luo, L., Zeng, Q.: Solminer: mining distinct solutions in programs. In: Proceedings of the 38th International Conference on Software Engineering Companion. Association for Computing Machinery, New York, NY, USA, ICSE ’16, pp. 481–490 (2016). https://doi.org/10.1145/2889160.2889202
Luo, L., Ming, J., Wu, D., et al.: Semantics-based obfuscation-resilient binary code similarity comparison with applications to software plagiarism detection. In: Proceedings of the 22nd ACM SIGSOFT International Symposium on Foundations of Software Engineering. Association for Computing Machinery, New York, NY, USA, FSE 2014, pp. 389–400 (2014). https://doi.org/10.1145/2635868.2635900
Luxton-Reilly, A., Denny, P., Kirk, D., et al.: On the differences between correct student solutions. In: Proceedings of the 18th ACM Conference on Innovation and Technology in Computer Science Education. Association for Computing Machinery, New York, NY, USA, ITiCSE ’13, pp. 177–182 (2013). https://doi.org/10.1145/2462476.2462505
Luxton-Reilly, A., Simon Albluwi, I., et al.: Introductory programming: a systematic literature review. In: Proceedings Companion of the 23rd Annual ACM Conference on Innovation and Technology in Computer Science Education. Association for Computing Machinery, New York, NY, USA, ITiCSE 2018 Companion, pp. 55–106 (2018). https://doi.org/10.1145/3293881.3295779
Moussiades, L., Vakali, A.: PDetect: a clustering approach for detecting plagiarism in source code datasets. Comput. J. 48(6), 651–661 (2005). https://doi.org/10.1093/comjnl/bxh119
Nguyen, A., Piech, C., Huang, J., et al.: Codewebs: scalable homework search for massive open online programming courses. In: Proceedings of the 23rd International Conference on World Wide Web. Association for Computing Machinery, New York, NY, USA, WWW ’14, pp. 491–502 (2014). https://doi.org/10.1145/2566486.2568023
Ohmann, T., Rahal, I.: Efficient clustering-based source code plagiarism detection using PIY. Knowl. Inf. Syst. 43(2), 445–472 (2014). https://doi.org/10.1007/s10115-014-0742-2
Ohmann, T., Rahal, I.: Efficient clustering-based source code plagiarism detection using PIY. Knowl. Inf. Syst. 43(2), 445–472 (2015). https://doi.org/10.1007/s10115-014-0742-2
Paiva, J.C., Leal, J.P., Figueira, A.: Automated assessment in computer science education: a state-of-the-art review. ACM Trans. Comput. Educ. (2022). https://doi.org/10.1145/3513140
Paiva, J.C., Leal, J.P., Figueira, Á.: Progpedia: collection of source-code submitted to introductory programming assignments. Data Brief 46, 108887 (2023). https://doi.org/10.1016/j.dib.2023.108887
Perry, DM., Kim, D., Samanta, R., et al.: Semcluster: clustering of imperative programming assignments based on quantitative semantic features. In: Proceedings of the 40th ACM SIGPLAN Conference on Programming Language Design and Implementation. Association for Computing Machinery, New York, NY, USA, PLDI 2019, pp. 860–873 (2019). https://doi.org/10.1145/3314221.3314629
Piech, C., Huang, J., Nguyen, A., et al.: Learning program embeddings to propagate feedback on student code. In: Proceedings of the 32nd International Conference on International Conference on Machine Learning, vol. 37, pp. 1093–1102. JMLR.org, ICML’15 (2015)
Poon, J.Y., Sugiyama, K., Tan, Y.F., et al.: Instructor-centric source code plagiarism detection and plagiarism corpus. In: Proceedings of the 17th ACM Annual Conference on Innovation and Technology in Computer Science Education. Association for Computing Machinery, New York, NY, USA, ITiCSE ’12, pp. 122–127 (2012). https://doi.org/10.1145/2325296.2325328
Pu, Y., Narasimhan, K., Solar-Lezama, A., et al.: Sk_p: a neural program corrector for MOOCs. In: Companion Proceedings of the 2016 ACM SIGPLAN International Conference on Systems, Programming, Languages and Applications: Software for Humanity. Association for Computing Machinery, New York, NY, USA, SPLASH Companion 2016, pp. 39–40 (2016). https://doi.org/10.1145/2984043.2989222
Rivers, K., Koedinger, K.R.: A canonicalizing model for building programming tutors. In: Cerri, S.A., Clancey, W.J., Papadourakis, G., et al. (eds.) Intelligent Tutoring Systems. Springer, Berlin, pp. 591–593 (2012). https://doi.org/10.1007/978-3-642-30950-2_80
Rivers, K., Koedinger, K.R.: Automatic generation of programming feedback: a data-driven approach. In: The First Workshop on AI-supported Education for Computer Science (AIEDCS 2013), pp. 50–59. Memphis, USA (2013)
Sculley, D.: Web-scale k-means clustering. In: Proceedings of the 19th International Conference on World Wide Web. Association for Computing Machinery, New York, NY, USA, WWW ’10, pp. 1177–1178 (2010). https://doi.org/10.1145/1772690.1772862
Wang, K., Singh, R., Su, Z.: Dynamic neural program embedding for program repair (2018). https://doi.org/10.48550/arXiv.1711.07163
Wang, K., Singh, R., Su, Z.: Search, align, and repair: data-driven feedback generation for introductory programming exercises. In: Proceedings of the 39th ACM SIGPLAN Conference on Programming Language Design and Implementation. Association for Computing Machinery, New York, NY, USA, PLDI 2018, pp. 481–495 (2018). https://doi.org/10.1145/3192366.3192384
Weiss, K., Banse, C.: A language-independent analysis platform for source code (2022). https://doi.org/10.48550/arXiv.2203.08424
Xu, S., Chee, Y.S.: Transformation-based diagnosis of student programs for programming tutoring systems. IEEE Trans. Softw. Eng. 29(4), 360–384 (2003). https://doi.org/10.1109/TSE.2003.1191799
Yamaguchi, F., Golde, N., Arp, D., et al.: Modeling and discovering vulnerabilities with code property graphs. In: 2014 IEEE Symposium on Security and Privacy, pp. 590–604. IEEE, Berkeley, CA, USA (2014). https://doi.org/10.1109/SP.2014.44
Zhang, F., Wu, D., Liu, P., et al.: Program logic based software plagiarism detection. In: 2014 IEEE 25th International Symposium on Software Reliability Engineering, pp. 66–77. IEEE, Naples, Italy (2014). https://doi.org/10.1109/ISSRE.2014.18
Ďuračík, M., Kršák, E., Hrkút, P.: Scalable source code plagiarism detection using source code vectors clustering. In: 2018 IEEE 9th International Conference on Software Engineering and Service Science (ICSESS), pp. 499–502. IEEE, Beijing, China (2018). https://doi.org/10.1109/ICSESS.2018.8663708
Acknowledgements
Not applicable.
Funding
Open access funding provided by FCT|FCCN (b-on). J.C.P.’s work is funded by the FCT—Fundação para a Ciência e a Tecnologia (Portuguese Foundation for Science and Technology), Portugal—for the PhD Grant 2020.04430.BD.
Author information
Authors and Affiliations
Contributions
JCP, JPL, and ÁF contributed to conceptualization; methodology; project administration; validation; and visualization; JCP was involved in data curation, funding acquisition; investigation; resources; and writing—original draft, and provided software; and JPL and ÁF contributed to supervision. All authors have read and agreed to the published version of the manuscript.
Corresponding author
Ethics declarations
Conflict of interest
The authors declare that they have no conflict of interest.
Additional information
Publisher's Note
Springer Nature remains neutral with regard to jurisdictional claims in published maps and institutional affiliations.
Rights and permissions
Open Access This article is licensed under a Creative Commons Attribution 4.0 International License, which permits use, sharing, adaptation, distribution and reproduction in any medium or format, as long as you give appropriate credit to the original author(s) and the source, provide a link to the Creative Commons licence, and indicate if changes were made. The images or other third party material in this article are included in the article’s Creative Commons licence, unless indicated otherwise in a credit line to the material. If material is not included in the article’s Creative Commons licence and your intended use is not permitted by statutory regulation or exceeds the permitted use, you will need to obtain permission directly from the copyright holder. To view a copy of this licence, visit http://creativecommons.org/licenses/by/4.0/.
About this article

Cite this article
Paiva, J.C., Leal, J.P. & Figueira, Á. Clustering source code from automated assessment of programming assignments. Int J Data Sci Anal (2024). https://doi.org/10.1007/s41060-024-00554-5
Received:
Accepted:
Published:
DOI: https://doi.org/10.1007/s41060-024-00554-5